 Yara EzAl Deen Sultan
 Kanni Raj Arumugam Pillai
 Archana Sharma
- 1Department of Chemistry, School of Science and Humanities, Vel Tech Rangarajan Dr. Sagunthala R&D Institute of Science and Technology, Chennai, Tamil Nadu, India
- 2Department of Agriculture, Marwadi University, Rajkot, Gujarat, India
Forest fires significantly impact ecosystems; thus, identifying characteristics that increase the danger of fires is critical to mitigating their negative impacts. This study examines the parameters contributing to wildfires in the Vellore Reserve Forest This paper aims to develop GIS-based risk maps and models to enhance fire protection, fuel mitigation strategies, and land use decisions by improving wildfire risk recognition and prediction. This research discusses Wildfire Modeling in Vellore Reserve Forest, Tamil Nadu, India. This field is large and rich in knowledge on the study of wildfires in the study area. Tamil Nadu, India’s southernmost state, is divided into 32 districts with diverse landscapes and ecosystems. The Vellore district, covering 6,077 square kilometers, has a significant 27% forest cover, covering 162,286 ha. This forest is primarily found between latitudinal and longitudinal coordinates in the calm taluks of Gudiyatham, Tirupattur, and Vellore—the Vellore Reserve Forest Report 2023 highlights this ecological diversity. Geographic information systems (GIS) based analysis of forest fire was done using normalized difference vegetation index, normalized difference moisture index, fuel danger index (human) activity danger index, weather danger index, topographic danger index, normalized burn ratio index, and differenced Normalized Burn Ratio. The geographical scope of this research encompasses the entire Vellore district of Tamil Nadu, India. Real-time maps were photographed by MODIS and Landsat nine satellites to obtain a normalized difference in vegetation and moisture index. Initially, data are converted to digital maps. The most helpful fuel, activity, weather, and topography danger indexes are calculated using the Raster Calculator utility, Euclidean Distance tool, Kriging tool, and Digital Elevation Model, respectively. In the Vellore district, the calculated activity danger index ranges from 0 to 12,000, showing that the high risk emanates from human activities. The climate is dry from May to July, and the weather danger index is 345–348. In other seasons, the weather index is 338–341, indicating a low-risk level. In Vellore, low to medium-risk values for the topography index are 56.5–933, and high-risk values are 934–1,690. Fire severity is indexed in terms of both NBR and dNBR. NBR and dNBR are calculated from the NIR-SWIR ratio. Despite the limited data sources being a big challenge in this paper, the innovative elements of this study are characterized by a comprehensive, integrated strategy that employs GIS technology, providing an understanding of localized factors influencing wildfire ignition. This research contributes significant data and insights regarding the metrics that govern wildfire dynamics, serving as a vital resource for wildfire management efforts in the region. This paper assists in applying the models to predict the future wildfire risk under climate change and land use conditions.
1 Introduction
Forest fires pose significant challenges to nations worldwide. The frequency and intensity are steadily increasing year by year. As the impact of climate change becomes more pronounced year by year steeply, the risks and consequences of climate problems and forest fires rise correspondingly, making disaster management a critical issue across all continents. In the context of forest fires, countries such as the United States, Canada, Australia, and numerous African nations experience a higher incidence of these blazes, which often lead to extensive destruction of wildlife habitats, property, and human lives. These forest fires can be attributed to many factors, including prolonged droughts, heat waves, and human activities, all contributing to the ignition and rapid spread of wildfires. Despite the severity of forest fires evident in these regions, India exhibits a relatively lower level of occurrence when compared to the global average. This discrepancy can be linked to various factors, including differences in land management practices, vegetation types, and climatic conditions. In Tamil Nadu state, Vellore district faces high temperatures and forest fires in the summer months (April-July). Accidental fires are often caused by human interventions in forest areas (Gandhi et al., 2015; District Administration V. and State Planning Commission Tamil Nadu in association with University V, 2017). In this region, the Department of Forests, Government of Tamil Nadu, handles forest fire management in collaboration with the Ministry of Environment, Forests and Climate Change, Government of India. During the fire season, it uses satellites (IRS and GSAT) to image forest land and GIS-based software to model possible fire risks and the severity of the fire. In this article, fire occurrence is modeled by obtaining the fuel danger index (FDI), (human) activity danger index (ADI), weather danger index (WDI), and topographic danger index (TDI).
Geographic information systems (GIS) and remote sensing in fire management are used to obtain digital data to calculate the above indices (Sivrikaya and Küçük, 2022). Nowadays, the world uses more accurate maps and digital land forest cover data from NASA satellites such as MODIS, VIIRS, and Landsat 9. These satellites use infrared (IR) sensors to get fire or any thermal anomaly data and high-resolution real-time cameras to obtain earth maps. These cameras are similar to Google’s satellite camera. This map is converted to digital data (matrices) called normalized difference vegetation index (NDVI) and normalized difference moisture index (NDMI) (Mahfoud and Ali, 2017; Refat Faisal et al., 2020). Government data on human roads and settlements near forests are used to get the (human) activity danger index (ADI). More roads and settlements create more forest fire risk. Climatic factors such as temperature, rainfall, and wind provide a weather danger index (WDI). Indian Meteorological Department (IMD) provides climate and weather data through regional centers and mass media (Rabiei et al., 2022; Borisova et al., 2024). TDI is obtained using slope, aspect, and elevation (Çolak and Sunar, 2020; Marshall et al., 2020). The most useful metric, FDI, is obtained from NVDI and NDMI. Fire risk is proportional to these two metrics (Gholamreza et al., 2012; Adab et al., 2013). Topography’s slope is directly proportional to risk (Adab et al., 2011). Infrared (IR) spectrometers present in MODIS, VIIRS, and Landsat nine are used to provide the intensity of near-infrared (NIR), the intensity of short wavelength infrared (SWIR), normalized burn ratio index (NBR), and differenced NBR (BR) and, in turn, fire severity (Heidari and Arfania, 2022; Pramanick et al., 2023).
Many countries instituted unique fire rating systems for their countries. For example, the USA, Canada, and Australia have formed fire rating systems for their countries (Ibrahim et al., 2024). Analytical network process (ANP) is used to mathematically model wildfire risk in any region (Mangiameli et al., 2021). The fire severity model is calculated using both NBR and dNBR metrics. Earlier predictions made in Turkey exactly match real-time fire problems. The fire spread science uses NVDI obtained from maps (Mahfoud, 2020; Mamgain et al., 2022). In general, and in this article, the fire mitigation strategies mostly follow GIS and remote sensing data analysis. This method has become indispensable nowadays (Sandal Erzurumlu and Yıldız, 2024).
India’s wildfire incidence is lower than worldwide norms for various reasons. Fires can favorably impact ecosystem dynamics when they are caused by human activities such as land clearance and grazing. Cultural practices include daily fire management, encouraging growth, and resource management. Wildfire incidents have decreased as fire management tactics have evolved away from strong punitive measures. These variables all lead to a better-regulated environment for wildfires in India (Schmerbeck and Hiremath, 2007).
Relying on a few data sources could be problematic because it could slow down and complicate data processing. Furthermore, narrowing the scope of the study may reduce the findings’ applicability to other areas with diverse climates and environmental factors, and the investigation results will enhance the capabilities of wildfire management groups in Vellore in Tamil Nadu, India. GIS-enabled risk maps and models could also help focus fire protection and firefighting resources, inform the selection of fuel management strategies, and improve land use-related decisions through better evaluation and prediction of wildfire risk using GIS technology. Further, this research aims to reduce the adverse effects of wildfires on ecosystems, people, and communities in these regions by identifying the risk zones in the study area, which showed that the pressure levels in the region are not as severe as in many other regions.
2 Materials and methods
2.1 Study area
In the Tamil Nadu State, Vellore District is located between 78° 20′to 78° 50′east longitude and 12°15′and 13°15′north latitudes. Tamil Nadu is divided into 32 districts, one of which is Vellore. Vellore District covers 6,077 sq. km geographically. The Vellore district has 27% forest cover, around 162,286 ha, most located in the taluks of Gudiyatham, Tirupattur, and Vellore. (Vellore Reserve Forest (RF) 2023).
Located in the eastern area of Tirupattur Taluk, the Javadhu Hills are the highest mountain in the Vellore district. The Javadhu Hills have peaks reaching up to 1,280.16 m, and their elevation is 762 m above mean sea level. The 975.36 m tall Yelagiri Hills are placed at the midpoint of the Tirupathur Taluk. The district is home to the Palar and Ponnai, two significant rivers. The capability for irrigation-led agriculture is restricted because both rivers are seasonal and rain-fed. Red loamy soil is in the other sections, and black soil is in the tank and river bottoms (District Administration V. and State Planning Commission Tamil Nadu in association with University V, 2017).
The grasslands and mountain vegetation of the Vellore district are blended with the forests. In addition, the wetland/dry land cover and forest classifications for 2001 and 2006 were determined. There were notable differences in dry farmland, hilly areas with vegetation, and agricultural areas throughout 10 years. Between 2001 and 2006, there was an approximate 6% and 23% decrease in forest or bushland and open area cover types, respectively, while agricultural and built-up areas and water areas had an approximate 19%, 4%, and 7% increase, accordingly (Gandhi et al., 2015).
In 2010, Vellore had 36.1 thousand hectares of natural forest, outspreading over 6.0% of its land area. In 2023, it lost 4 ha of natural forest; as of 2000, 8.6% of Vellore’s land area was >30% tree cover, natural forest 52.0 kha, plantations 499 ha, and other land cover 554 thousand hectares.
In 2020, Vellore had >30% tree cover by land as follows: forest 52% (179 thousand hectares), grassland 20% (66.3 thousand hectares), settlement 16% (54.2 thousand hectares), wetland <0.1% (155 ha), cropland 12% (40.1 thousand hectares), Other <0.1%. While tree cover density is high, in 2020, Vellore had 470 ha of land above 10% tree cover, extending over 77.7% of its land area. As of 2001, 27% of Vellore’s total tree cover was primary forest. Primary Forest 14.2 thousand hectares, Other Tree Cover 38.3 thousand hectares, non-forest 554 kha. Furthermore, from 2002 to 2023, Vellore lost 80 ha of humid primary forest, making up 24% of its total tree cover loss. In the same period, the total area of humid primary forest in Vellore decreased by 0.56%. From 2013 to 2023, 97% of tree cover loss in Vellore occurred within natural forests (Global Forest Watch, Vellore Reserve Forest (RF) 2023) (Figure 1).
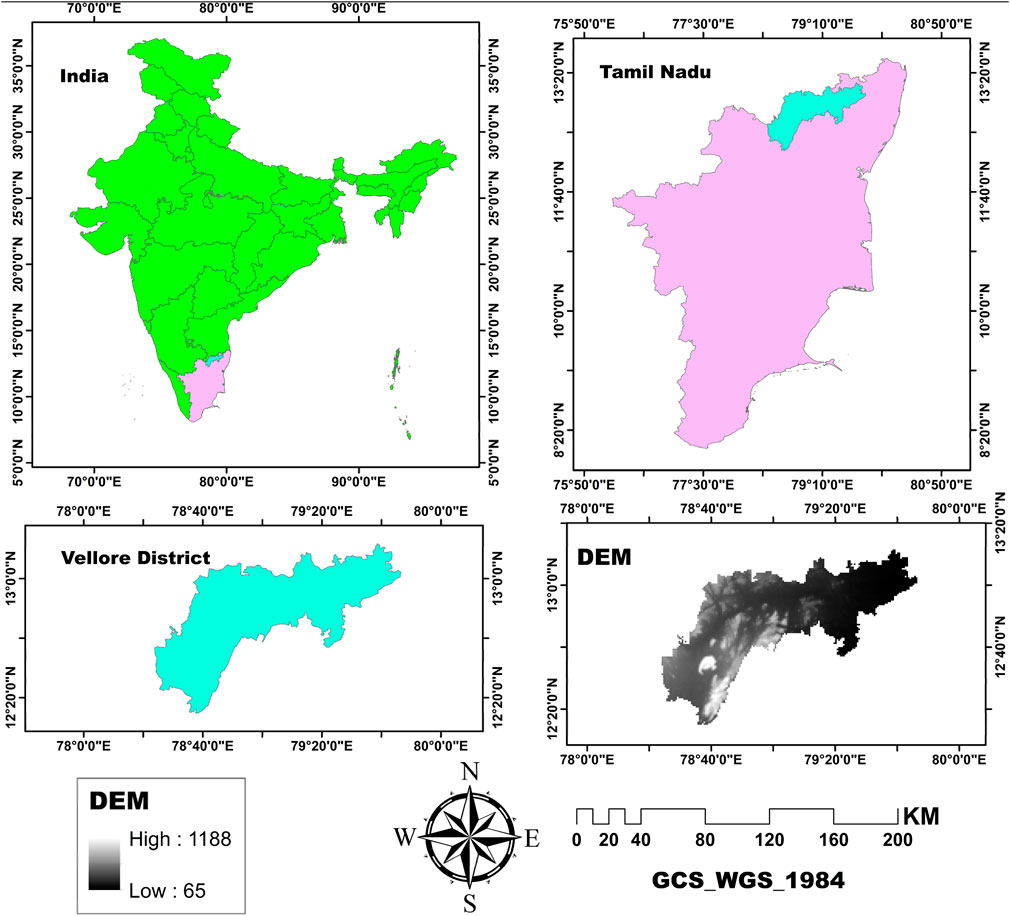
Figure 1. Study area, Vellore District, Tamil Nadu, India.
2.2 Independent parameters
This present research paper relies on independent metrics, such as the fuel danger index (FDI), activity danger index (ADI), weather danger index (WDI), and topographic danger index (TDI), as independent value factors of forest fires due to metrics’ immediate impact on the occurrence of fires (Sivrikaya and Küçük, 2022) (Figure 2).
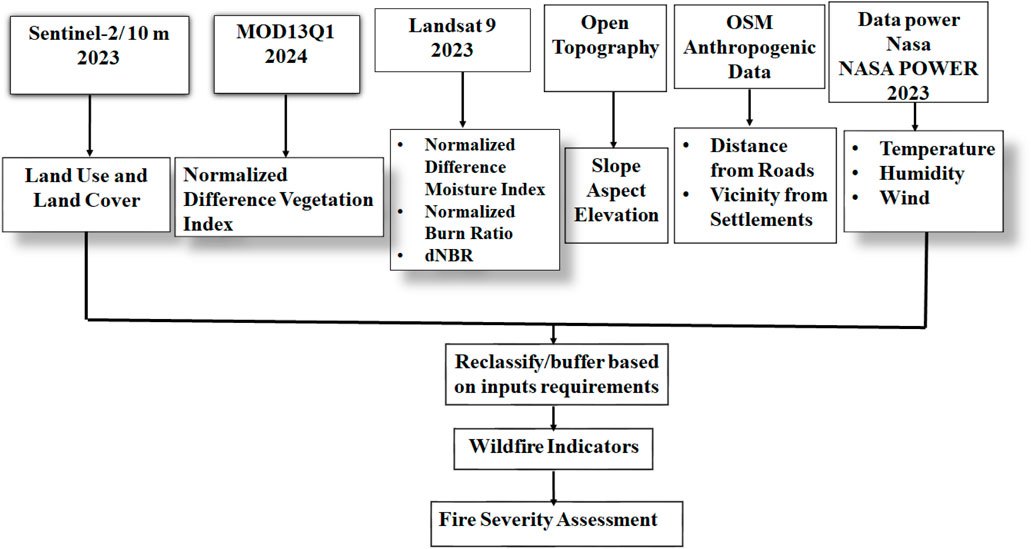
Figure 2. Methodological framework of study area to assess wildfire factors and generate fire severity assessment.
2.2.1 Fuel danger index (FDI)
The Normalized Difference Vegetation Index (NDVI), Normalized Difference Moisture Index (NDMI), and Fuel Danger Index according to Vegetation Type (FDvt) metrics calculate the Fuel Danger Index. The most essential ingredient for wildfires to start and spread is the FDI. In this work, FDI was assessed using NDVI and NDMI, and this study excluded FDI due to a deficiency in data on forest cover type (Marshall et al., 2020; Pillai and Sultan, 2024).
2.2.1.1 Normalized difference vegetation index (NDVI)
The NDVI is a dimensionless index that estimates an area’s vegetation density. This study used the MODIS13Q1 image with 250 m spatial resolution of 2024-derived NDVI product to calculate the vegetation concentration in the study area (Gandhi et al., 2015; Refat Faisal et al., 2020).
The Normalized Difference Vegetation Index (NDVI) is a quantitative indicator that ranges from −1 to +1. A higher NDVI value indicates dense vegetation, whereas a lower value indicates sparse vegetation. Areas with dense vegetation have a higher risk of forest fires (Parajuli et al., 2020).
2.2.1.2 Normalized difference moisture index (NDMI)
The moisture content of vegetation influences the combustion and fire propagation. Accordingly, fires are more likely to emerge when water evaporates and the fuel becomes dry. Wetness content can be evaluated using different approaches involving field measurements, meteorological data, and remote sensing, with the latter being the most convenient. In the present research, the Normalized Difference Moisture Index (NDMI) was applied to measure moisture content by analyzing a Landsat nine image of February/2023 with a 30 m resolution from the Earth Explorer website https://earthexplorer.usgs.gov/. The NDMI measurement using Equation 1 (Mahfoud and Ali, 2017):
Where:
NIR is near-infrared.
MIR is mid-infrared.
For Landsat 9: NMDI =
The (NDMI) ranges are between −1 and +1; when the value decreases, the ignition capability expands, and the fire spreads quickly. This study gave the greatest ignition danger to the vegetation type, density, and moisture content. FDI in the current paper used a simple formula, as shown in Equation 2.
2.2.2 Human Activity Danger Index (ADI)
Forests close to human activities such as highways and settlements are more likely to catch fire because of the increased danger of fire ignition. The ADI was computed by evaluating the danger concerning roadways and proximity to populated areas.
2.2.2.1 Activity danger index according to distance from roads (ADIr)
This factor also raises the possibility of fires started by people engaging in cooking, camping, grazing, maintaining roads, keeping animals at bay, making charcoal, hunting, and logging. The data for this case study was taken from OpenStreetMap: https://www.openstreetmap.org/#map=4/21.84/82.79.
Routes with much human activity that leads to fire risk were identified using the road map in the study area (Abedi Gheshlaghi, 2019).
2.2.2.2 Activity danger index according to distance from settlements (ADIs)
Residential communities are widely spread in the forest areas located in the study region, where there is hardly a forest or a forest group without a population concentration, even if it is not large, except for high mountain areas, and this is what poses a significant and permanent pressure and danger on the forest areas. The inhabitants of the settlements depend heavily on the neighboring forest areas for their livelihood in many ways, such as collecting forest products and grazing. Therefore, the remoteness of the forest from these settlements plays a role in their vulnerability to fires (Maniatis et al., 2022).
Open Street Map: https://www.openstreetmap.org/#map=4/21.84/82.79; used to extract data for this case study to study the danger of remoteness from residential communities. The current study categorized the Ideas into five classes by applying the Euclidean Distance tool in ArcGIS 10.8.
2.2.3 Weather danger index (WDI)
Situations such as temperature (T), relative humidity (RH), and wind (W) influence fuel moisture, combustion, and the velocity at which fires propagate. Furthermore, temperature and relative humidity impact vegetation’s moisture content and the time fires spread. Wind direction and speed also directly impact the spread of fire (Borisova et al., 2024). Data for the current study was sourced from NASA’s Data Power between 01/04/2023 – and 31/12/2023. The mean maximum temperature (in degrees Celsius), mean relative humidity (in percentage), and wind speed (in meters per second), along with the wind direction (Qiao et al., 2018; Keeley and Syphard, 2019), were utilized to model the Weather Danger Index (WDI) using Equation 3.
Temperature and relative humidity resolution are 2 m, and wind direction and speed are 10 m. The fire season in the Vellore district is from May to July, when the weather is dry because of cumulative drought due to rain preservation, so the drought expands until the rainy season.
2.2.4 Topographic danger index (TDI)
Topographic metrics impact fire intensity (Çolak and Sunar, 2020; Trucchia et al., 2020), and slope affects fire behavior, whereas aspect and elevation influence vegetation composition and moisture. TDI takes these factors into account.
The Vellore district’s TDI factors were derived from the NASA Shuttle Radar Topography Mission (SRTM) (2013). Shuttle Radar Topography Mission (SRTM) Global. Distributed by Open Topography https://doi.org/10.5069/G9445JDF, at a 30-m spatial resolution. Accessed: 2024-06-18.
2.2.4.1 Topographic danger index according to slope (TDIs)
The slope is a highly powerful parameter in fire behavior as it impacts the fire speed and ignition severity, which enhances with the slope, and the fire headway rises at the top of the slope more than at the down slope. Fuel humidity and amount of radiation are affected by slope steepness (Çolak and Sunar, 2020).
2.2.4.2 Topographic danger index according to aspect (TDIa)
The topography index represents a significant element for evaluating fire danger. Aspect is fundamental for identifying vegetation type and plays a role in its susceptibility to fire. The effects of this aspect on the temperature and fuel wetness content are noticeable; therefore, it is called fire behavior. In addition, sunny slopes can become hotter, making them more likely to grab fire (Çolak and Sunar, 2020; Parajuli et al., 2020).
As the study region is located in the Northern Hemisphere, its effect on fire behavior was categorized accordingly. The northern aspect of the slopes is mainly shaded, which leads to a decrease in temperatures and a rise in humidity. In return, the southern aspect obtains much more solar radiation, and the temperature becomes much higher than in other aspects.
2.2.4.3 Topographic danger index according to elevation (TDIe)
The elevation influences the temperature, humidity, and a more significant quantity of dry natural substances. The land gives more chances for combustion (Pradeep et al., 2022). The metrics mentioned in the research study estimated the TDI (slope, aspect, and elevation). It is worth mentioning that the slope has the highest weight, followed by the aspect, and the last one is elevation according to the following Equation 4 (Marshall et al., 2020).
2.3 Fire severity assessment: normalized burn ratio index (NBR) and differenced NBR (dNBR)
As a metric for measuring fire severity, the Normalized Burn Ratio (NBR) is a well-known index often utilized in research to emphasize scorched regions in huge fire areas. The Normalized Burn Ratio (NBR) is the proportion of the near-infrared (NIR) to short wavelength infrared (SWIR) bands. In turn, burned places reflect a more critical quantity of radiation in the wavelength’s visible and short wavelength infrared (SWIR) regions and obtain more radiation in the NIR; green vegetation consumes red light in the visible band (Zhao et al., 2021; Pramanick et al., 2023). NBR images were created for pre- and post-fire accidents, so maps of NBR-pre (NBR before the fire) and NBR-post (NBR following the fire) were generated (Alcaras et al., 2022).
Land-sat data were utilized in this study for NBR-pre- and post-fire and merging the use of both NIR (B5) and SWIR (B7) wavelengths by using a Land-sat nine data dated February/2023 with 30 m resolution from USGS Global Visualization Viewer website https://glovis.usgs.gov/app. Employ the NIR and SWIR parameters to simulate NBR using the bands coupled with each data for both pre-and post-fire images, Equation 5 (Khoirunisa and Mucsi, 2020; Zubkova et al., 2021):
Where:
NIR: near-infrared.
SWIR: Short wavelength infrared.
For Landsat 9: NBR =
NBR was conducted for the Landsat nine satellite data taken for the pre-fire (14/Feb/2023) and post-fire (19/Oct/2023) time and measured using Equation 5.
The Normalized Burn Ratio (NBR) is a typically used method that presents the entire burning area for the prior-fire and post-fire period. However, the most often employed satellite based on data parameters to simulate burning intensity is the Delta Normalized Burn Ratio (dNBR) (Uttaruk et al., 2022) (Figure 3).
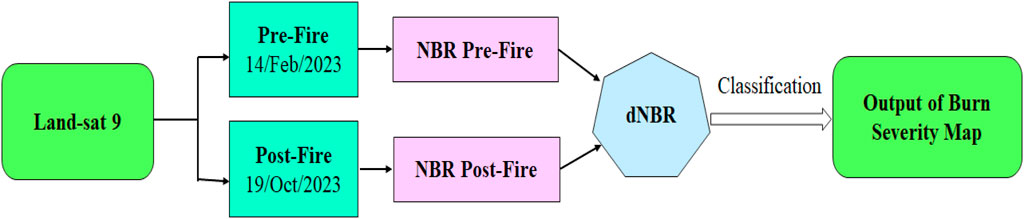
Figure 3. Flowchart shows the methodology applied to estimate dNBR.
Additionally, the dNBR is measured by deducting the pre-fire NBR from the post-fire NBR, Equation 6 for computing dNBR (Khoirunisa and Mucsi, 2020):
The dNBR ranged from −2 to +2 (Uttaruk et al., 2022). Values above 0 denote regions with more severe blazes, while rates less than 0 represent areas with fewer severe burns. One study suggested that the appropriate data rank between −0.5 and 1.3, where dNBR lower than −0.5 or more than 1.3 may occur but are usually not elaborated as scorched areas. Instead, they are likely due to misregistration, clouds, or other sources, not due to actual variations in land cover (Syaufina et al., 2022).
The dNBR is a valuable factor for determining fire severity in forest ecosystems, providing insights into the impacts of wildfires on greenery cover and natural ecosystem quality. One study noted that high dNBR metrics refer to severe burn severity, leading to enormous damage to flora and fauna within ecosystems. Severe wildfires with high dNBR rates can disrupt environmental processes like nutrients and the water cycle, affecting the ecosystem balance. A moderate positive bond between dNBR elements and prior-fire vegetation was displayed, which denoted fire severity impacted by the amount of fuel in nature. Also, as the topography greatly influences forest fire behavior, it impacts fire severity in different areas (Heidari and Arfania, 2022).
2.4 Dependent parameters: events including fire and burned land
All the independent factors referred to above have the ability to ignite and cause wildfires. Therefore, this paper has taken the historical forest fire events and their size as the dependent parameters. Vellore Reserve Forest (RF) (2023) confirmed that all the preceding metrics elevated the fire risk in the Vellore district; naturally occurring forest covered 36.1 kha (or 6.0%) of Vellore’s total land region in 2010. A 4-ha natural forest was lost in 2023. Twelve hectares of tree cover were lost to fires in Vellore between 2001 and 2023, whereas 410 ha were lost to all other causes of loss. With 2 ha lost to blaze, or 5.0% of all tree cover loss for that year, 2019 had the most due to fires during this era. Whereas between the 16th of August 2021 and the 12th of August 2024, Vellore witnessed 293 VIIRS Alerts fire alerts (Global Forest Watch 2024) https://www.globalforestwatch.org/dashboards/global/; In brief, several factors, including fuel elements like vegetation density, kind and moisture content, climate conditions, topography factors, and human activities, influence the incidence and spread of wildfires. Likewise, field observations help validate remote sensing data and models, provide information on the effects of fires on vegetation degradation and environmental changes brought on by wildfires, and provide valuable data for calculating fire risk and simulating fire behavior.
Finally, the study assessed the Fuel Danger Index (FDI) based on density and moisture content. The greenery density was measured using the Normalized Difference Vegetation Index (NDVI); a more excellent score means the vegetation is more susceptible to fire in a highly intensive fire. In addition, since drier fuels have a higher ignite potential, the vegetation’s wetness content was measured using the Normalized Difference Moisture Index (NDMI). These two components, density and moisture, were combined to replicate the overall FDI. Because forest fires are more likely to start when human activity is close to a forest, the Human Activity Danger Index (ADI) was enhanced using the distance between highways and communities and the forest. Meteorological metrics involving temperature, relative humidity, and wind speed are considered by the Weather Danger Index (WDI), which directly affects how fires behave. Slope, aspect, and elevation are used in the Topographic Danger Index (TDI) to determine the impacts on fire severity and spread. In addition, this research work applied the Normalized Burn Ratio (NBR) and Differenced NBR (dNBR) to rate the fire’s severity based on pre- and post-fire satellite data. Combining many variables makes a comprehensive assessment of wildfire danger and behavior in the Vellore Forest region possible.
3 Results and discussion
3.1 Fuel danger index (FDI)
In Vellore woods, vegetation type and density play a crucial role as igniting agents in forest fires. The mountain vegetation and grasslands blend with the trees. This study analyzed Shrubland and temperate and tropical rainforests in the woods. Due to the extended dry season, dense grasses such as lemon grass and shrubs take the place of trees in the forest, making them an excellent ignition source. In this study area, the NDVI ranges from −0.188 to +0.947. The NDVI was classified into five classes using ArcGIS 10.8 to assess fire danger. The Natural Breaks Jenks Distribution technique was applied, which provides a more balanced distribution of values between classes, reducing contrast within groups and increasing contrast between the groups in Table 1.
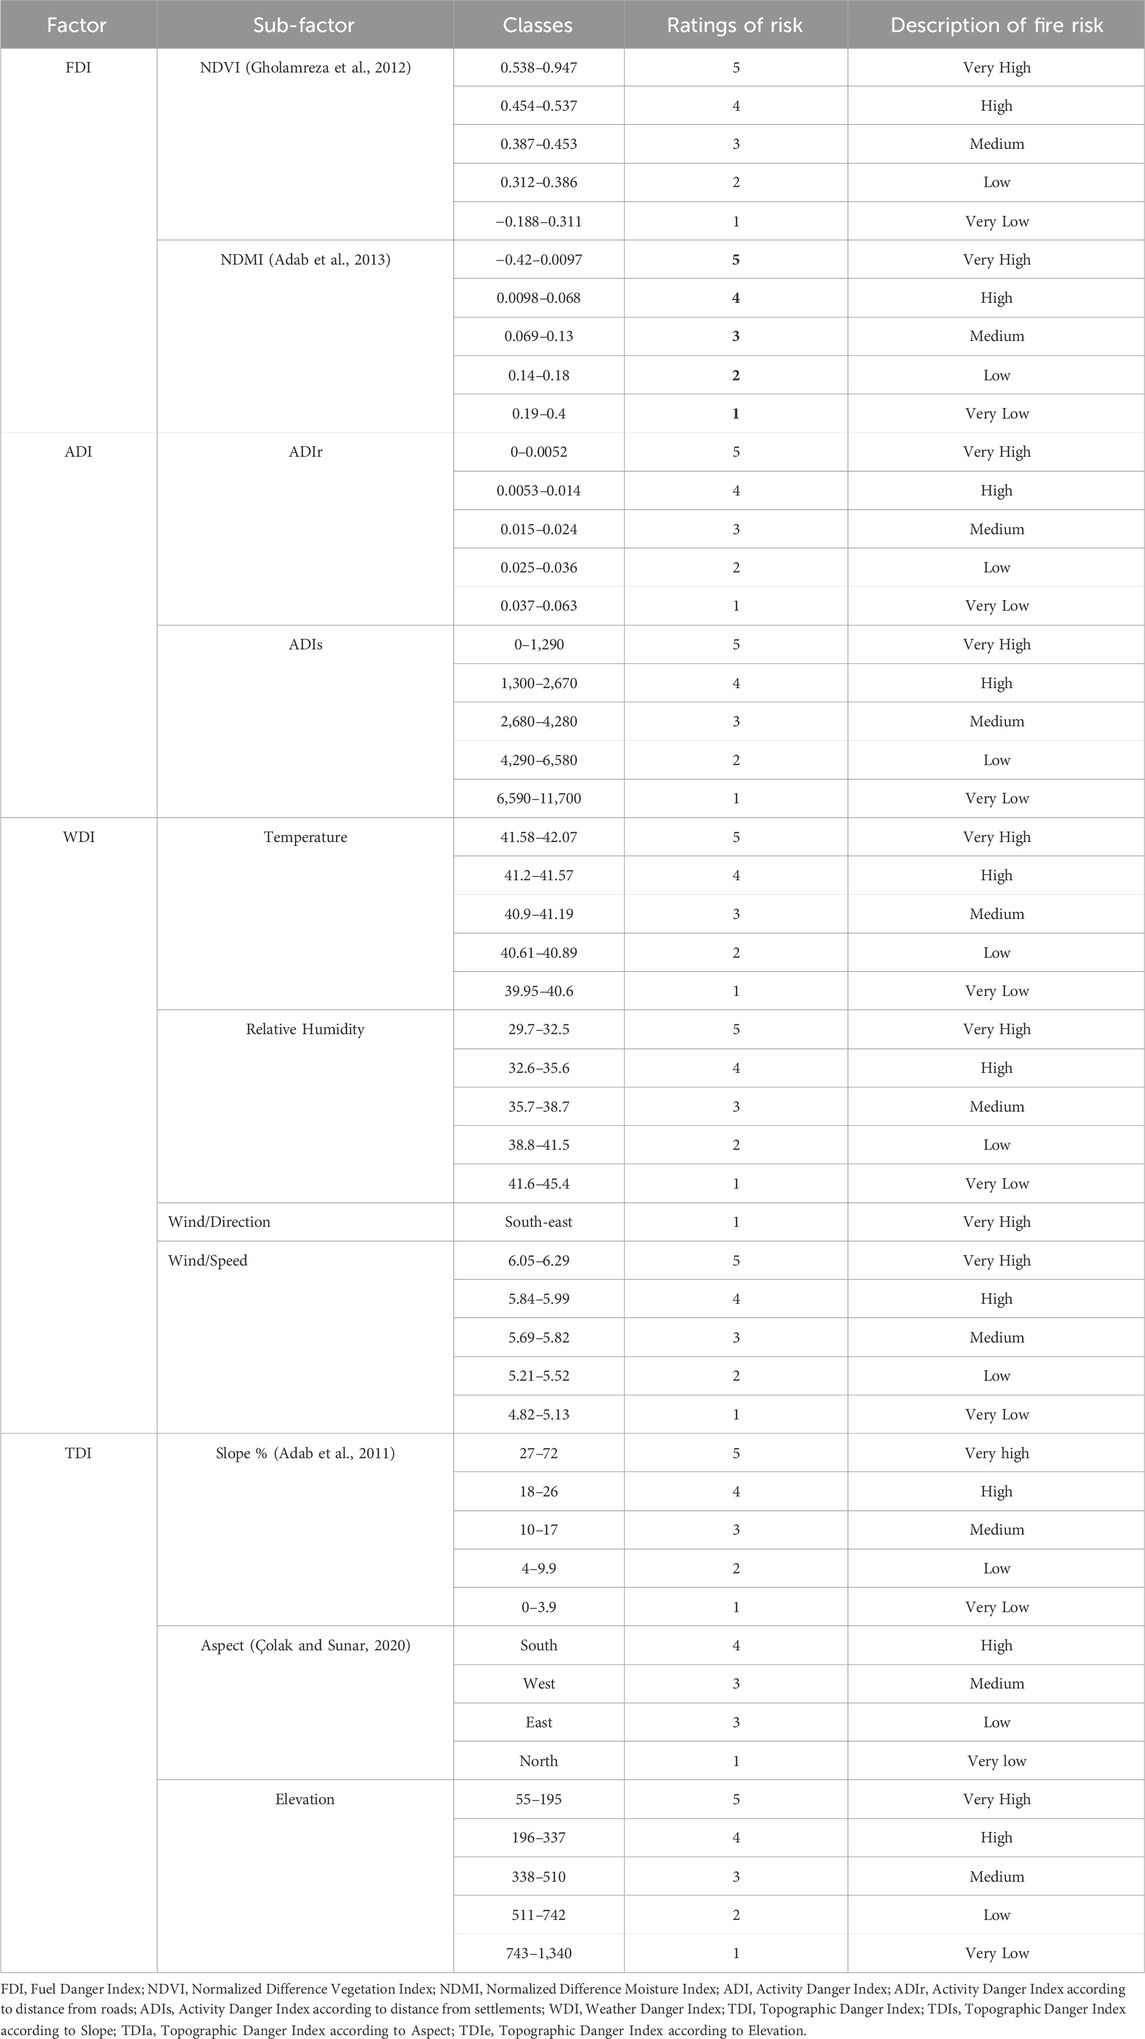
Table 1. Variables used to model forest fires and their effects on fire behavior in the Study area.
Density may be dangerous if the NDVI value falls between 0.538 and 0.947. Higher values indicate thicker vegetation. Typically, standard NDVI values range from −1 to +1. Table 1 indicates that the case study’s actual NDVI values range from −0.188 to +0.947.
Based on vegetation type, density, and moisture, the Fuel Danger Index (FDI) was utilized in a study area to determine the fire risk. Other research used similar techniques to examine the relationship between FDI and measurements like NDVI and NDMI, which measure vegetation. The Forest Fire Danger Rating System (FDRS) in Australia is one index that this technique corresponds with research that has been employed (Ibrahim et al., 2024). The research in the Vellore district further distinguished itself from earlier studies by providing comprehensive data on vegetation density and fire vulnerability, emphasizing grassland’s important role in fire events.
Conversely, a different study examined the coniferous kind, which has a higher resinous content and is more likely to cause wildfires in the Mediterranean region. For instance, the study demonstrated that pine woods are prone to wildfires (Sivrikaya and Küçük, 2022).
In contrast, the conventional NDMI used a weighting system of −1 to +1; a lower weight indicates drier and more flammable vegetation. Fire risk was partitioned into five classes according to moisture content by the Raster Calculator, then Map Algebra from Spatial Analyst in ArcGIS 10.8, which gives a value of five to very dry and one to exceptionally wet. Table 1 shows that the actual NDMI values in the study area range from 0.4 to −0.42, which were used to classify the fire risk into five bands. Wetness of the vegetation is deemed hazardous when the NDMI value is less than 0.0097; a value of five denotes arid vegetation, and a value of one denotes extremely wet vegetation is considered hazardous if its moisture content is less than 0.0097.
Standard FDI values are contingent upon the studied region’s particular vegetation type, density, and moisture content. About Table 4, the research region’s actual FDI value rates range from −0.119 to 1.15. The high and extremely high-threat areas are described in Figure 5A. Vellore lost 80 ha of its humid primary forest between 2002 and 2023, accounting for 24% of the district’s overall tree cover loss. During this time, Vellore’s humid primary forest’s total area shrank by 0.56%. As mentioned earlier, Figure 4A illustrates how the high vegetation density in the east contributed to the rise in the fuel hazard index value.
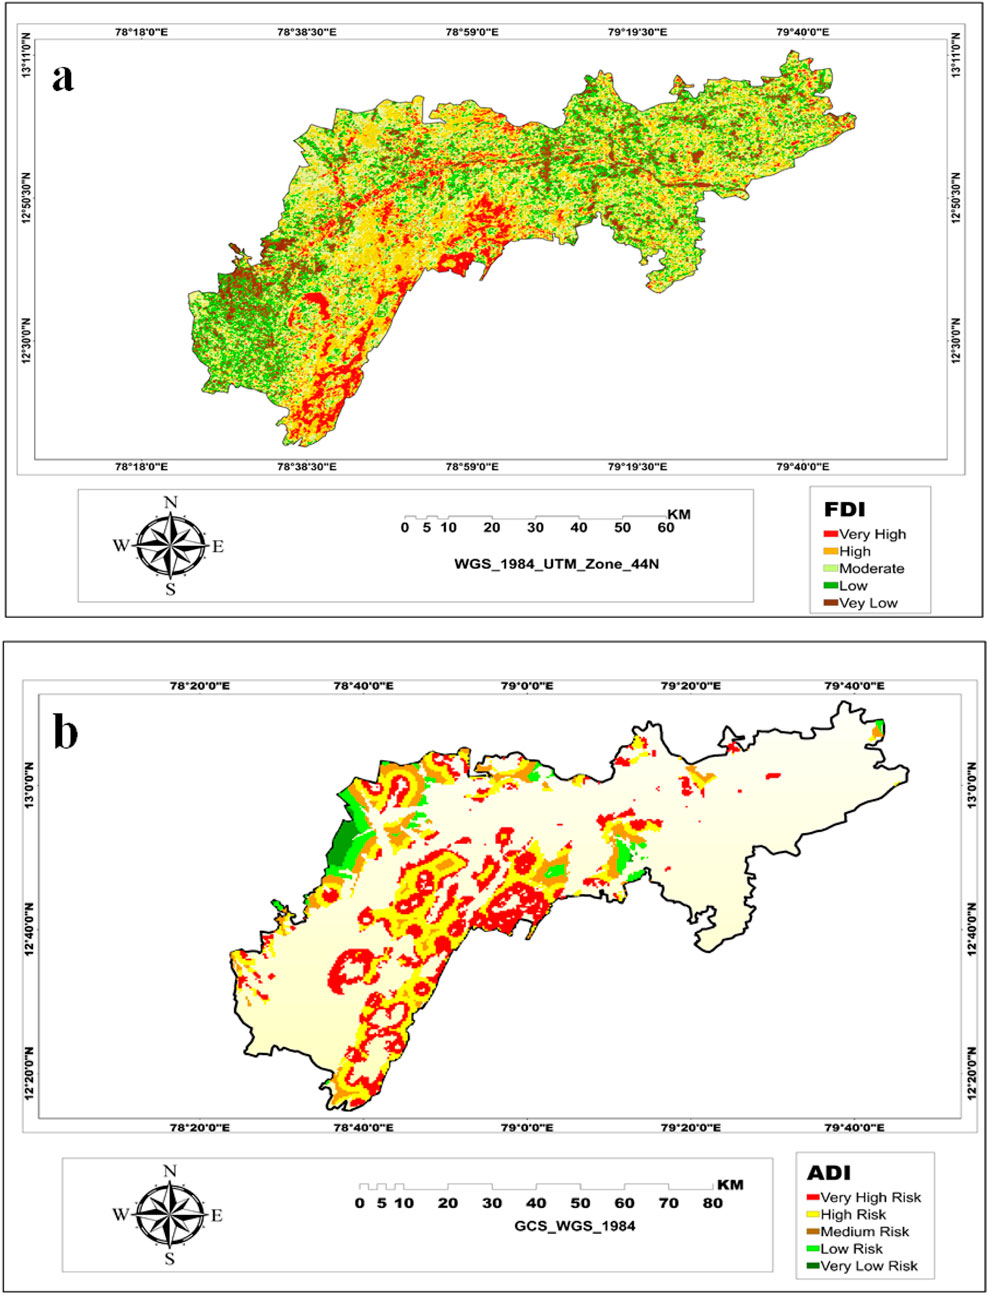
Figure 4. Forest fire variables (A) fuel danger index, (B) activity danger index.
The research also highlighted that the areas with high density are very high-risk areas. This paper emphasizes the importance of considering regional situations when estimating fire risk.
3.2 Human activity danger index (ADI)
Human activities vary in the study area, where the roads and settlements are widely spread through the forests in the research area, facilitating the population to visit the forests for activities involving rangeland use, hunting, and woodcutting. Since these parameters are considered average values, it is essential to note that they also raise the incidence of fire, gunfire, and other mishaps. The present study classified the ADIr into five categories using the Euclidean Distance tool from ArcGIS 10.8. A multi-buffer analysis was performed to categorize the values into five risk classes utilizing the Natural Break (Jenks) distribution. As demonstrated in (Table 1), a value of 0.037–0.063 is regarded as very low risk, and a value of 0–0.0052 increases the danger level. As indicated in (Table 4), the simulated human danger index (ADI) rates are from 12,000 to 0 in Figure 4B. A multi-buffer analysis was produced to classify the values into five risk classes utilizing the Natural Break (Jenks) distribution. As illustrated in (Table 1), a value of 6,590–11,700 is regarded as very low risk, and a value of 0–1,290 expands the risk level.
Since ADI is one of the fire indexes used in this research paper, it rates fire risk based on human activities proximate to the roads and settlements. This approach is similar to related studies that used GIS-based analytical network process (ANP) simulations to calculate wildfire risk regions (Mangiameli et al., 2021).
Furthermore, the study in the Vellore district provides more detailed data on specific human activities related to roads and populated areas and their effects on fire danger. The present work depends on GIS modeling to evaluate forest fire risk regions compared to related studies that applied different approaches. It also underlines the importance of the vicinity of roads and settlements to the forests in fire risk computing and prevention, an essential factor in wildfire risk modeling.
Conversely, to related surveys that utilized the same method, one relevant research conducted by Gheshlaghi discussed the influence of closeness to roads and populated areas on fire events, which is a crucial factor in forest fire danger modeling and impacts the possibility of fire incidents and protection. In the study conducted in Noshahr Forests, North Iran, the author applied the GIS-based analytical network process (ANP) model to assist forest fire risk areas. Also, the author pointed out that ADI raises the forest fire risk due to human activities near the forests (Abedi Gheshlaghi, 2019). Due to ADI, researchers and agricultural department managers can identify and mitigate the fire damage caused by human presence and activities in forested areas.
3.3 Weather danger index (WDI)
The weather status in the area governs the vegetation type dominance there, as the area will be susceptible to fires in an area with a drier climate. Standard climatic rates are based on climate metrics such as temperature, relative humidity, and wind speed/direction.
Weather Danger Index (WDI) simulation was generated by ArcGIS 10.8, starting with Multidimensional tools and then using “IDW” from Interpolation in Spatial Analyst Tool, which classifies the temperature index into five classes by applying Natural Breaks (Jenks) from very low danger up to very high risk. On the other hand, “IDW” was applied to categorize wind speed and direction and put it into five classes relying on Natural Breaks (Jenks). The same division was used for relative humidity, producing five categories from very low to very high danger. The final output for WDI was created utilizing the Raster Calculator in ArcGIS 10.8. WDI was classified into five classes, from a very low danger fire index to a very high fire danger index using Natural Breaks (Jenks), as shown in (Table 1) (Rabiei et al., 2022).
(Table 4) explains absolute weights for previous elements in the study area. In turn, and shows WDI categories in five levels of risk based on the simulated weather danger index (WDI) values, which ranged from 338 to 348 (Figure 5A). 345–348 refers to very high risk, while 338–341 is very low. The fire season, which lasts from May to July, leads to hydric pressure in the woods, which causes a cumulative proportion of dry organic substances, increasing the fuel for fire ignition.
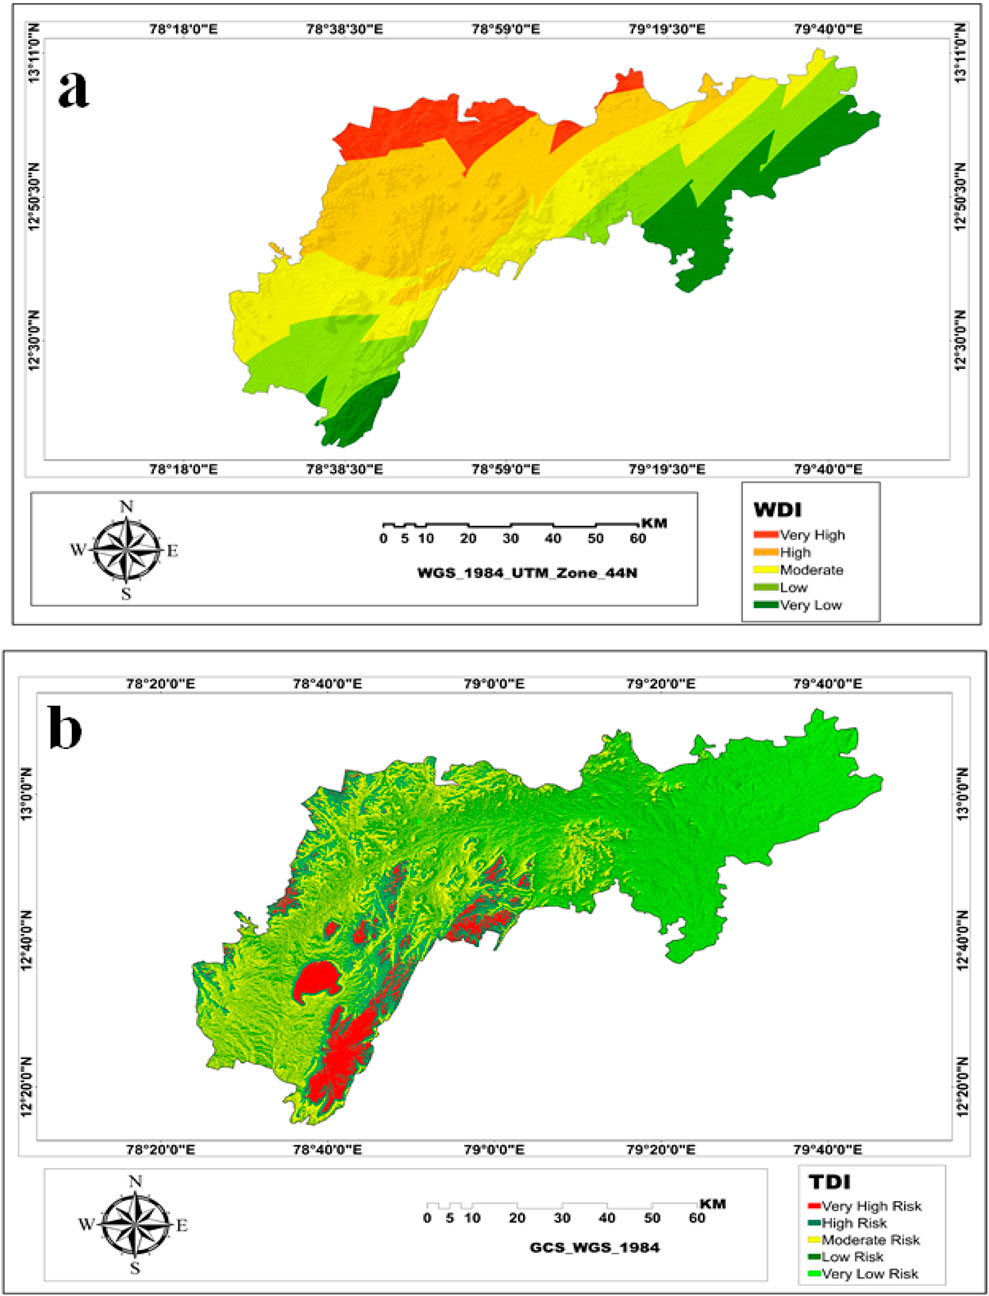
Figure 5. (A) Weather danger index, (B) topography danger index.
The present study used weather indexes like temperature, relative humidity, precipitation, wind speed, and direction to estimate fire risk and behavior. It provided more detailed information on the climatic metrics and their impacts on fire risk. This paper agrees with relevant studies that studied the effects of climate change on wildfire risk modeling and protection. This research work also meets with other studies that have assured that meteorological factors directly impact fire danger and behavior by influencing fuel moisture content and combustion capability.
Moreover, dryness enhances fire risk by drying out vegetation and creating a hospitable environment for fire inflammation. Vellore’s study output differs from other regions, such as the Mediterranean, with different weather and natural situations (Ibrahim et al., 2024). This comparison highlights the importance of regional variations in fire risk evaluation.
3.4 Topographic danger index (TDI)
In the research area, the terrain is crucial to spreading fire since steep slopes facilitate the fire’s rapid expansion and eventual annihilation of all vegetation species. Fire travels upward fastest on slopes. In this study, the software was used for slope categorizing into five classes and applying Natural Breaks (Jenks) distribution due to their impacts on the fire outspread in the study region, starting from the very low risk with one value up to very high risk, with five values in (Table 1). The present study has classified the aspect into four categories by applying Natural Break (Jenks) distribution. So, the southern aspect was classified as high ignition risk, and the northern aspect had the lowest rate, so it was classified as very low risk (Table 1). An elevation map was simulated using the Natural Breaks (Jenks) distribution, which was sorted into five classes with rating values between 1,340 and 55, where a rate of five was given to the highest-risk group and one to the very low-risk class (Table 1).
In the topography of current work, the slope is the leading cause of fire spread; aspect and elevation are not as dangerous as the slope. There is an increased risk of a fire spreading because most of the study area’s forests are dispersed over sloping terrain. As with the WDI index, the topographic danger index TDI value, which ranges from one to 5, provides the basis for five risk categories (Table 4).
The methodology used in this research marked the significance of topographic metrics, such as slope, aspect, and elevation, in fire risk mapping Figure 5B. This paper is consistent with other studies that have found that topography is crucial in wildfire behavior. The study used an integration of topographic factors to evaluate fire danger; it also highlighted the value of topography in spreading fire, a central parameter in wildfire danger simulation. The Vellore study found very high topographic risk values between 934 and 1,690, while medium risk values between 56.5 and 1,690 (Table 4).
Compared to a study conducted in Menderes, Turkey, the results indicated that topography plays a significant role in determining the behavior of wildfires. Turkish forests with a higher slope tend to spread fires more quickly, especially those containing Black and Calabrian pine species, with higher canopy closure rates than 71%. When determining the fire risk, the south aspect—which faces portions of Turkish forests—is essential since regions facing south are more prone to fires. The comparison with related studies emphasizes the importance of considering topography when evaluating a fire’s risk and how good fire behavior forecasting requires more precise data (Çolak and Sunar, 2020).
To summarize, although this study established that slope is the primary topographic component influencing the spread of fires, previous research has stressed the significance of aspect and elevation in determining the risk of fires and the extent of burn damage.
3.5 Normalized burn ratio index (NBR) and differenced NBR
The present study used remote sensing data and a GIS-based model to estimate fire severity. The research also noted the value of various land cover types in fire seriousness simulation, a fundamental parameter in wildfire risk calculation and prevention. Compared to related research, the study utilized dNBR to compute fire severity. A similar method was used in other studies that used a remote sensing approach to evaluate fire severity. Foremost, NBR pre- and post-fire and dNBR were measured for data analysis. Afterward, the results of the indexes were various under pixel values, and the regions that formed the fire danger were defined. Relying on the fire severity model regarding the dNBR index explained that not all areas are endangered by forest fires (Mamgain et al., 2022). According to the NBR simulation performed during the pre-fire period, populated areas, highways, water bodies, and forest areas all have reflection parameters.
NBR rates between −1 and +1, where the weight closer to value + 1 indicates the vegetation area (unburned area), and the value closer to −1 points out the scorched region. The factor was modeled by applying the raster calculator in ArcGIS 10.8 and using the Natural Breaks (Jenks) distribution. It was sorted into five groups: pre-fire and post-fire, as shown in (Table 2).

Table 2. Normalized burn ratio (NBR). Based on the USGS source.
By calculating the fire severity estimation using dNBR, the study presents a complete understanding of the forest fire patterns in the Vellore district. Combining these different metrics allowed the complete modeling of fire risk and sensitivity in the study area (Figure 6). So, a standard rate for NBR ranges between −1 and +1, while the dNBR ranges from −2 to +2 (Genç et al., 2023). The dNBR usually is scaled by 103, which rates between +59.43 and +754.7, indicating high severity fire (Table 3). The current results demonstrate the pre-NBR values between −0.661 and +0.545; on the other hand, post-NBR values between −0.442 and +0.542 (Table 2). Meanwhile, dNBR ranges from −1 to +754.7 (Table 4).
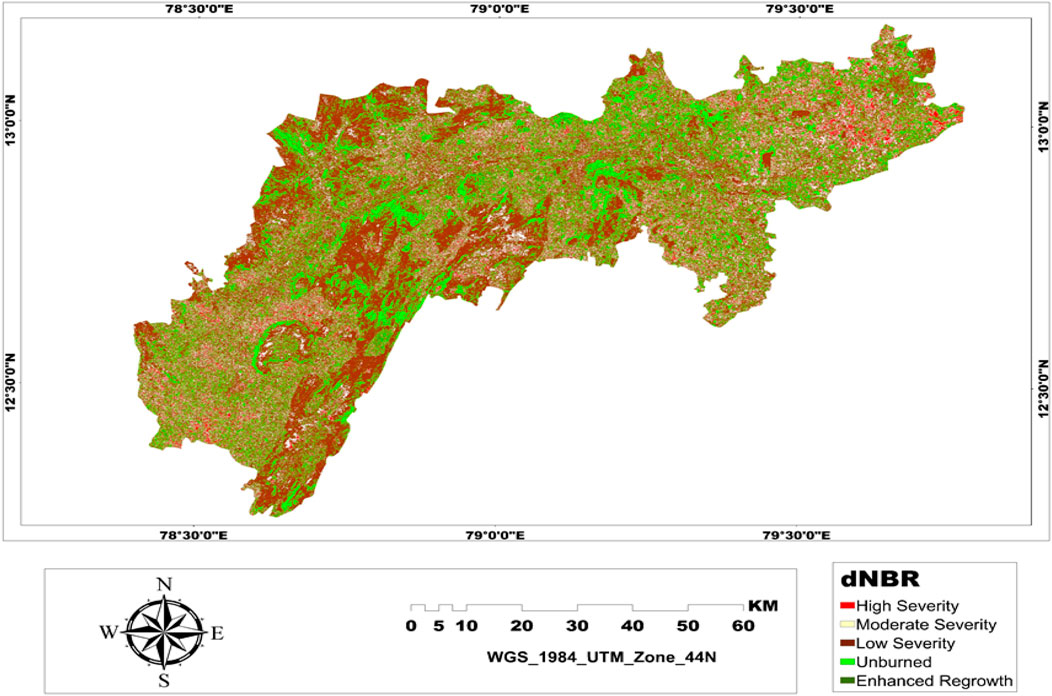
Figure 6. Differenced normalized burn ratio.
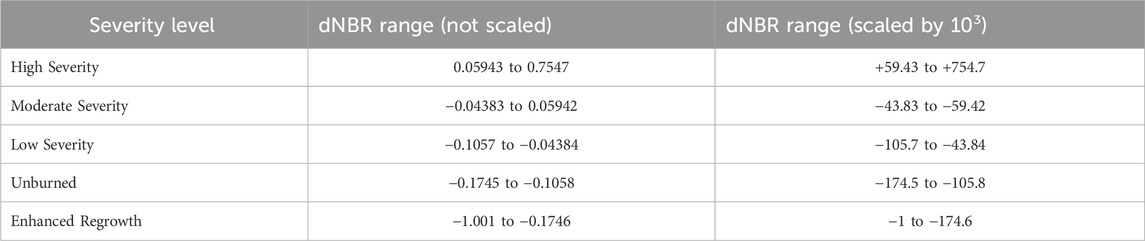
Table 3. Fire severity based on delta normalized burn ratio (dNBR). Source by USGS.
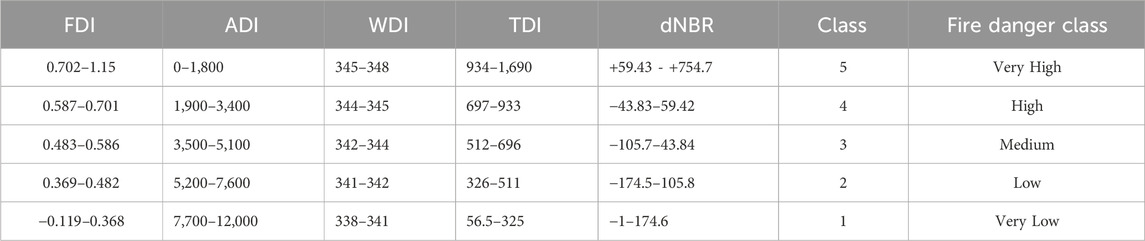
Table 4. Displays the index values together with the relevant classes.
This was approved with one study in Kastamonu, Turkey, that described that dNBR is a valuable element for identifying fire severity and produced a result that the dNBR index was used to compute the unburned region after a forest fire in 2020. The study site exposed enhanced regrowth, unburned, low severity, moderate severity, and high severity classes based on dNBR values, indicating variable levels of damage (Genç et al., 2023).
The paper meets the findings and approaches of a pertinent study on using dNBR to evaluate fire severity. Examining the impact of different land cover types on interpreting the fire severity indices derived from remote sensing makes the comparison crucial. A variety of topics were examined in this paper and related research, including the effects of fire on vegetation cover, the use of fire science, NDVI computing, the function of science in land management, and wildfire-exposing techniques in diverse environments (Mahfoud and Ali, 2017; Mahfoud, 2020). The researchers emphasized the importance of data quality in a fire study and the usefulness of data processing techniques, such as pre-treatment satellite data, for precise computations in NDVI simulation. Combining GIS-based modeling and remote sensing improves the study’s enforcement across various forest types and landscapes by thoroughly understanding fire behavior and danger parameters. The papers examined the advanced use of technologies such as remote sensing and GIS-based modeling to map burned regions, forecast fire danger, and study fire behavior.
The study’s authors stress a more cogent approach to fire management, prudent management of natural resources, and the promotion of effective fire danger mitigation techniques; they also emphasize the ecosystem impact of fires on vegetation strain, soil degradation, and changes in land cover and use (Sivrikaya and Küçük, 2022; Sandal Erzurumlu and Yıldız, 2024). GIS and RS technologies were used to determine fire risk categories, calculate fire hazard factors, and create fire severity maps to develop effective management strategies. Concentrating on fuel administration in areas with high vegetation species reduces the fire risk and spread. Also, acknowledging that human activity plays a crucial role in initiating fires is imperative. Simultaneously, to prevent wildfires, it is imperative to keep an eye on geographic features and weather patterns, especially during dry seasons. In addition to academic institutes, collaboration with forestry and environmental authorities is crucial for gathering field and wildfire data that will provide a thorough understanding of forest fire dynamics and optimal reduction strategies.
4 Conclusion
The study utilizes remote sensing and geographic information systems (GIS) to analyze fire behavior and risk, combining variables such as fuel danger index (FDI), weather danger index (WDI), topographic danger index (TDI), and differenced NBR (dNBR). This comprehensive approach emphasizes respecting geographical differences in fire risk computation. The dNBR provides a quantitative assessment of the fire size in the research region, ranging from −1 to +754.7.
Briefly, the quantitative data for the factors show crucial insights:
• FDI: Values rated from −0.119 to +1.15, with high and very high-risk regions including almost 26.22% of the total forest area.
• ADI: Values rated from 1,800 to 12,000, with high and very high risks showing an essential part of the forest area.
• WDI: Classes ranged from 338 to 348, with high and highly high-risk areas covering an immense portion of the study’s forest areas.
• TDI: High and very high topographic risks constitute 934–1,690 of the VRF area, while medium risk ranged between 512–696
• dNBR: rated from −1 to −174.6 (indicating less severe burns) to +59.43 to +754.7 (referring to severely burned areas), clarifying the extent of fire effect before and after the fire accident.
In light of the study’s conclusions, future research should enhance the methodology by incorporating other variables and using additional sophisticated analytical methods to complement GIS technologies. Further integration is needed to combine different indices and aspects to fully understand fire danger and behavior.
Furthermore, by considering various regions and environmental circumstances, subsequent research must seek to increase the generalizability of the results. Given the rise in forest fires, finding the most effective way to forecast and prevent wildfires and the most effective methods for assessing and monitoring fire danger in varied locations with diverse meteorological and environmental variables is crucial.
Data availability statement
The original contributions presented in the study are included in the article/supplementary material, further inquiries can be directed to the corresponding author.
Author contributions
YS: Conceptualization, Data curation, Investigation, Methodology, Software, Writing–original draft, Writing–review and editing. KP: Supervision, Writing–original draft. AS: Writing–review and editing.
Funding
The author(s) declare that no financial support was received for the research, authorship, and/or publication of this article.
Acknowledgments
The authors would like to thank all parents of the institute for possible facilities to complete the presented work.
Conflict of interest
The authors declare that the research was conducted in the absence of any commercial or financial relationships that could be construed as a potential conflict of interest.
Generative AI statement
The author(s) declare that no Generative AI was used in the creation of this manuscript.
Publisher’s note
All claims expressed in this article are solely those of the authors and do not necessarily represent those of their affiliated organizations, or those of the publisher, the editors and the reviewers. Any product that may be evaluated in this article, or claim that may be made by its manufacturer, is not guaranteed or endorsed by the publisher.
References
Abedi Gheshlaghi, H. (2019). Using GIS to develop a model for forest fire risk mapping. J. Indian Soc. Remote Sens. 47 (7), 1173–1185. doi:10.1007/s12524-019-00981-z
Adab, H., Kanniah, K. D., and Solaimani, K. (2011). GIS-Based probability assessment of fire risk in grassland and forested landscapes of golestan province, Iran. 2011 Int. Conf. Environ. Comput. Sci. 19, 170–175. doi:10.1007/s11069-012-0450-8
Adab, H., Kanniah, K. D., and Solaimani, K. (2013). Modeling forest fire risk in the northeast of Iran using remote sensing and GIS techniques. Nat. Hazards 65 (3), 1723–1743. doi:10.1007/s11069-012-0450-8
Alcaras, E., Costantino, D., Guastaferro, F., Parente, C., and Pepe, M. (2022). Normalized burn ratio plus (NBR+): a new index for sentinel-2 imagery. Remote Sens. 14 (7), 1727. doi:10.3390/rs14071727
Borisova, B., Todorova, E., Ihtimanski, I., Glushkova, M., Zhiyanski, M., Georgieva, M., et al. (2024). Wildfire risk assessment and mapping – an approach for Natura 2000 forest sites. Trees, For. People 16 (December 2023), 100532. doi:10.1016/j.tfp.2024.100532
Çolak, E., and Sunar, F. (2020). Evaluation of forest fire risk in the Mediterranean Turkish forests: a case study of Menderes region, Izmir. Int. J. Disaster Risk Reduct. 45, 101479. doi:10.1016/j.ijdrr.2020.101479
District Administration, V. and State Planning Commission, Tamil Nadu in association with University, V. (2017). DISTRICT HUMAN DEVELOPMENT REPORT - VELLORE DISTRICT.
Gandhi, G. M., Parthiban, S., Thummalu, N., and Christy, A. (2015). Ndvi: vegetation change detection using remote sensing and gis – a case study of Vellore district. Procedia Comput. Sci. 57 (March), 1199–1210. doi:10.1016/j.procs.2015.07.415
Genç, Ç. Ö., Küçük, Ö., Keleş, S. Ö., and Ünal, S. (2023). Burn severity evaluation in black pine forests with topographical factors using Sentinel-2 in Kastamonu, Turkiye. CERNE 29 (1). doi:10.1590/01047760202329013230
Gholamreza, J. C., Bahram, G., and Osman, M. D. (2012). Forest risk zone mapping from GIS in Northern forests of Iran. Int. J. Agric. Crop Sci. 4 (12), 818–824.
Heidari, F. B., and Arfania, R. (2022). Wildfire susceptibility mapping using NBR index and frequency ratio model. Geoconservation Res. 5 (1), 240–260. doi:10.30486/gcr.2022.1961153.1107
Ibrahim, S., Kose, M., Adamu, B., and Jega, I. M. (2024). “Remote sensing for assessing the impact of forest fire severity on ecological and socio-economic activities in Kozan District,”. Turkey: Journal of Environmental Studies and Sciences. [Preprint]. doi:10.1007/s13412-024-00951-z
Keeley, J. E., and Syphard, A. D. (2019). Twenty-first century California, USA, wildfires: fuel-dominated vs. wind-dominated fires. fire Ecol. 15, 24. doi:10.1186/s42408-019-0041-0
Khoirunisa, R., and Mucsi, L. (2020). Burned region analysis using normalized burn ratio index (NBRI) in 2019 forest fires in Indonesia (case study: pinggir-mandau district, bengkalis, riau). Geogr. Sci. Educ. J. 2 (1). doi:10.31327/gsej.v2i1.1293
Mahfoud, I. (2020). The impact of Syrian crisis on the forestry areas in north latakia governorate. J. Agric. Research-SJAR.
Mahfoud, I., and Ali, M. (2017). ‘Ogriginal article using remote sensing and gis technologies to map forest fire danger in lattakia governorate (Syria)’, 5(1), pp. 69–76.
Mamgain, S., Karnatak, H., Roy, A., and Chauhan, P. (2022). Analyzing spatio-temporal pattern of the forest fire burnt area in uttarakhand using sentinel-2 data’, ISPRS annals of the photogrammetry. Remote Sens. Spatial Inf. Sci. V-3–2022 (3), 533–539. doi:10.5194/isprs-annals-V-3-2022-533-2022
Mangiameli, M., Mussumeci, G., and Cappello, A. (2021). Forest fire spreading using free and open-source GIS technologies. Geomatics 1 (1), 50–64. doi:10.3390/geomatics1010005
Maniatis, Y., Doganis, A., and Chatzigeorgiadis, M. (2022). Fire risk probability mapping using machine learning tools and multi-criteria decision analysis in the GIS environment: a case study in the national park forest dadia-lefkimi-soufli, Greece. Appl. Sci. Switz. 12 (6), 2938. doi:10.3390/app12062938
Marshall, G., Thompson, D., Anderson, K., Simpson, B., Linn, R., and Schroeder, D. (2020). The impact of fuel treatments on wildfire behavior in North American boreal fuels: a simulation study using FIRETEC. Fire 3 (2), 18–14. doi:10.3390/fire3020018
Parajuli, A., Gautam, A. P., Sharma, S. P., Bhujel, K. B., Sharma, G., Thapa, P. B., et al. (2020). Forest fire risk mapping using GIS and remote sensing in two major landscapes of Nepal. Geomatics, Nat. Hazards Risk 11 (1), 2569–2586. doi:10.1080/19475705.2020.1853251
Pillai, K. R. A., and Sultan, Y. E. D. (2024). Mathematical modeling of forest fire-comprehensive review. Indian J. Environ. Prot. Available at: https://www.e-ijep.co.in/44-10-912-921/.
Pradeep, G. S., Danumah, J. H., Nikhil,, S., Prasad, M. K., Patel, N., Memmen, P. C., et al. (2022). Forest fire risk zone mapping of eravikulam national park in India. Croat. J. For. Eng. 43 (1), 199–217. doi:10.5552/crojfe.2022.1137
Pramanick, N., Kundu, B., Acharyya, R., and Mukhopadhyay, A. (2023). Forest fire risk zone mapping in Mizoram using RS and GIS. IOP Conf. Ser. Earth Environ. Sci. 1164 (1), 012005. doi:10.1088/1755-1315/1164/1/012005
Qiao, C., Wu, L., Chen, T., Huang, Q., and Li, Z. (2018). “Study on forest fire spreading model based on remote sensing and GIS,” in IOP conference series: earth and environmental science (Institute of Physics Publishing). doi:10.1088/1755-1315/199/2/022017
Rabiei, J., Khademi, M. S., Bagherpour, S., Ebadi, N., Karimi, A., and Ostad-Ali-Askari, K. (2022). Investigation of fire risk zones using heat–humidity time series data and vegetation. Appl. Water Sci. 12 (9), 216–312. doi:10.1007/s13201-022-01742-z
Refat Faisal, B. M., Rahman, H., Sharifee, N. H., Sultana, N., Islam, M. I., Habib, S. M. A., et al. (2020). Integrated application of remote sensing and GIS in crop information system—a case study on aman rice production forecasting using MODIS-NDVI in Bangladesh. AgriEngineering 2 (2), 264–279. doi:10.3390/agriengineering2020017
Sandal Erzurumlu, G., and Yıldız, N. E. (2024). “Determination of fire intensity after forest fire by remote sensing: marmaris case study,”. BIO Web Conf. Editor A. M. Bozdoğan 85. doi:10.1051/bioconf/20248501041
Sivrikaya, F., and Küçük, Ö. (2022). Modeling forest fire risk based on GIS-based analytical hierarchy process and statistical analysis in Mediterranean region. Ecol. Inf. 68 (September 2021), 101537. doi:10.1016/j.ecoinf.2021.101537
Syaufina, L., Sitanggang, I. S., Anggraini, A., and Afina, F. S. (2022). Fire severity assessment on peatland vegetation diversity. IOP Conf. Ser. Earth Environ. Sci. 1025 (1), 012014. doi:10.1088/1755-1315/1025/1/012014
Trucchia, A., D’Andrea, M., Baghino, F., Fiorucci, P., Ferraris, L., Negro, D., et al. (2020). Propagator: an operational cellular-automata based wildfire simulator. Fire 3 (3), 26–24. doi:10.3390/fire3030026
Uttaruk, Y., Rotjanakusol, T., and Laosuwan, T. (2022). Burned area evaluation method for wildfires in wildlife sanctuaries based on data from sentinel-2 satellite. Pol. J. Environ. Stud. 31 (6), 5875–5885. doi:10.15244/pjoes/152835
Zhao, P., Zhang, F., Lin, H., and Xu, S. (2021). GIS-based forest fire risk model: a case study in laoshan national forest park, nanjing. Remote Sens. 13 (18), 3704. doi:10.3390/rs13183704
Keywords: wildfire, NDVI, NDMI, TDI, WDI, DNBR
Citation: Sultan YED, Pillai KRA and Sharma A (2025) Wildfire indicators modeling for reserved forest of Vellore district (Tamil Nadu, India). Front. Remote Sens. 6:1518539. doi: 10.3389/frsen.2025.1518539
Received: 28 October 2024; Accepted: 10 January 2025;
Published: 30 January 2025.
Edited by:
Romulus Costache, National Institute of Hydrology and Water Management, RomaniaReviewed by:
Nishant Gupta, River Engineering Private Limited, IndiaTathagata Ghosh, Balurghat Mahila Mahavidyalaya, India
Ahmad Ansari, Helmand Higher Education Institute, Afghanistan
Copyright © 2025 Sultan, Pillai and Sharma. This is an open-access article distributed under the terms of the Creative Commons Attribution License (CC BY). The use, distribution or reproduction in other forums is permitted, provided the original author(s) and the copyright owner(s) are credited and that the original publication in this journal is cited, in accordance with accepted academic practice. No use, distribution or reproduction is permitted which does not comply with these terms.
*Correspondence: Yara EzAl Deen Sultan, eWFyYXN1bHRhbjMxQGdtYWlsLmNvbQ==