 Anna Zenonos
 Sizhuo Li2
 Philippe Ciais
- 1 Climate and Atmosphere Research Center (CARE-C), The Cyprus Institute, Nicosia, Cyprus
- 2 Department of Geosciences and Natural Resource Management, University of Copenhagen, Copenhagen, Denmark
- 3 Laboratoire des Sciences du Climat et de l’Environnement, CEA, CNRS, UVSQ, Université Paris-Saclay, Gif-sur-Yvette, France
Trees play a crucial role in mitigating climate change by absorbing
1 Introduction
In the face of climate change, rapid implementation of mitigation and adaptation measures has become a major priority. The Eastern Mediterranean and Middle East region stands out as a climate change hot-spot (Cramer et al., 2018; Giorgi, 2006; Lelieveld et al., 2012; Zittis and Hadjinicolaou, 2017). In this region, the island of Cyprus, object of this study, has already experienced a higher warming rate than the global mean, with extreme heat and drought in summer (Zittis et al., 2019). One of the main mitigation measures is afforestation and reforestation since new trees absorb
The model was modified and optimized to produce an airborne tree inventory for an area of about
2 Materials and methods
2.1 Description of the studied area
The Cyprus island (9,251
2.1.1 Cyprus forests
The total forest area of Cyprus is equal to 1,725.1
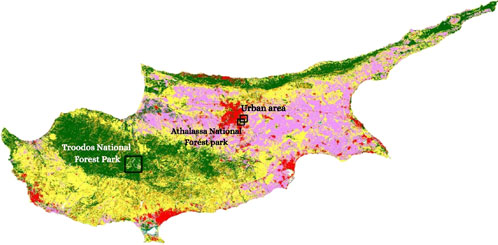
Figure 1. Land use map of Cyprus taken from ESA WorldCover Viewer ESA (2024). The location of the three study areas is pointed on the map.
2.1.2 National Forest Inventory data
The most recent National Forest Inventory (NFI) report was published in 2019 and was based on campaigns, where limited sampling and statistical methods were applied. The NFI data is re-evaluated every 10 years and so far, no remote sensing data have been used, to measure and report on the Cyprus forest resources.
According to the NFI report of 2019, there are two main types of trees in Cyprus, coniferous and broad-leaved. The most widespread forest types are composed of pinus brutia, pinus nigra, mixed pinus brutia, and riparian communities. The harvest rate was found to be about 9% of the increment, which is extremely low compared to Western and Central Europe, and was reported separately for coniferous and broad-leaved trees. The analysis for broad-leaved trees was based on previous NFI data of 2001–2011 while the analysis for the pinus brutia forests was based on permanent plots. The information used to estimate the forest reference area from the National Forest Inventory encompasses 81,575.42 ha of land that includes the Pinus brutia community within the state forest area. The tree covered area occupied by each forest type is presented in Table 1. This information does not refer to the tree crown area, and tree size has not been considered. Estimations in Table 1 result from a raw approximation based on the number of trees that have been surveyed from 1997 until 2013. Below is a short description of the three small areas analyzed for high resolution tree crown area in this study 1.
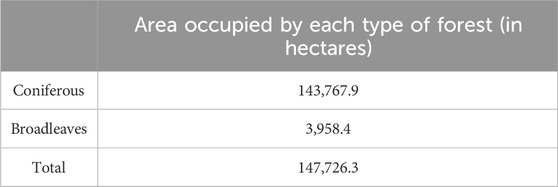
Table 1. Estimated forest area occupied by different types - Table taken from National Forest Inventory report of 2019 (The republic of cyprus ministry of agriculture, rural development and environment. 2019).
2.1.3 Troodos National Forest Park
The Troodos mountain range is the primary geological and topographical feature of the island, with natural forests providing habitats for various plant and animal species. Its central forest, encompassing its loftiest peaks is called Chionistra, in the heart of the range. In 1992, a major portion of this forest, around 91 square kilometers, was designated as a National Forest Park, aiming to preserve its unique biodiversity; and it has been integrated into the European network of “Natura 2000″ protected areas. The forests within the National Forest Park are predominantly natural, having regenerated without human intervention. Calabrian pine (Pinus brutia) is the prevailing tree species at lower heights, reaching up to 1,200 m, and on warm, south-facing slopes, up to 1,600 m. Smaller trees and shrubs occupy specific niches, influenced by altitude, geology, and moisture conditions. At higher elevations, from 1,200 to 1,500 m, black pine (Pinus nigra) dominates the forest species. Other hardwood species include foetid juniper (Juniperus foetiditssima), wild service tree (Sorbus aria), cotoneaster (Cotoneaster racemiflorus), barberry (Berberis cretica), and the endemic dwarf gorse (Genista sphacelata subsp. crudelis), among others. A significant number of black pine trees and junipers in this zone are exceptionally old, some exceeding 500 years, and a few reaching up to 1,000 years. These trees are strictly protected due to their high ecological and cultural value (Troodos, 2024).
2.1.4 Peri-urban forest park, Athalassa
This park (see map in Figure 1) is situated on the southeastern outskirts of the city of Nicosia, and covers 840 ha, serving as a “green paradise” with endemic and indigenous trees, shrubs, and grasses. Athalassa was designated a National Forest Park in 1990 in accordance with Forestry Legislation.
2.1.5 Urban area, Aglantzia
This area is a suburb of Nicosia, characterized by a mix of modern blocks of apartments and traditional houses. The maximum building height is 24 m adhering to urban planning regulations, and the building-plot ratio, according to the Department of Land and Survey of Cyprus, is equal to 1.60. Aglantzia has small parks and green spaces, such as the Pedagogical Academy National Forest Park. Our study domain includes a park with large trees of
2.2 Data description and pre-processing
As an input, the model receives RGB and NIR orthophotos collected over Cyprus during 2019 with a 10-cm resolution by the Department of Land and Survey of Cyprus. The GeoTIFF images used here are of high-resolution (10 cm per pixel), derived from UAV (drone) flight data with Red, Green, Blue (RGB), and Near-Infrared (NIR) bands, and use the ESRI:102,319 - CGRS-1993-LTM coordinate reference system (Transverse Mercator, meters). The images were processed using the Inpho GmbH software, commonly used in photogrammetry. The combination of RGB and NIR bands makes the images suitable for both visual interpretation and vegetation analysis. We split the dataset into small images, each of
2.3 Model description
The deep-learning model of Li et al. (2023) to create maps of trees crown areas uses convolutional neural networks. Initially, it was developed to map trees in Denmark and further tested and validated in Finland and France (Li et al., 2023). Given the huge differences of trees and forest structure between Cyprus and Denmark, related to the dry climate of Cyprus which influences tree density, species and related crown shapes, as well as the presence of trees in mountains (not present in Denmark). The method used to re-tune the model for Cyprus is presented in the following section. We implemented tree counting and crown segmentation tasks simultaneously by using a multitask deep learning-based network (see Figure 2) derived from the U-Net architecture (Ronneberger et al., 2015), featuring two separate output branches dedicated to each task. The crown segmentation branch addressed a semantic segmentation challenge, where every pixel in an image was categorized either as part of an object (white) or as part of the background (black) (Wang, 2018). Therefore, the model outputs a binary mask (see Figure 3) showing tree areas with white pixels and non-tree areas with black pixels. The secondary branch estimates the overstory tree count by generating density maps through regression for a specific image. The ground truth density maps were created by applying normalized 2D Gaussian kernels (see Figure 2) on the delineated tree crowns (Zhang et al., 2016). The overall count of trees in an image of any dimension was determined by integrating the density map. Compared to counting by enumerating the segmented tree crowns, where several adjoining tree crowns might be incorrectly counted as one, the density estimation-based approach, according to the authors (Li et al., 2023), improves the overall counting bias.
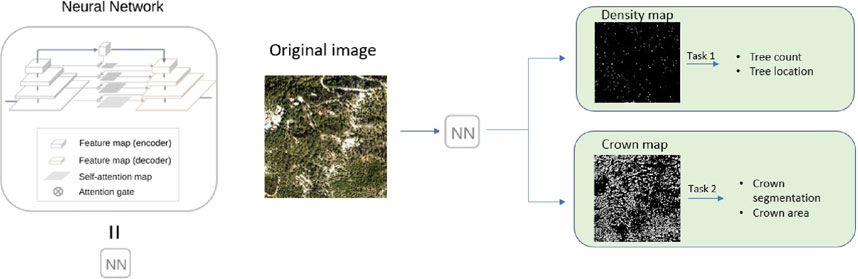
Figure 2. Graphical representation of the model - based on Figure 1 of Li et al., 2023, Li et al. (2023).
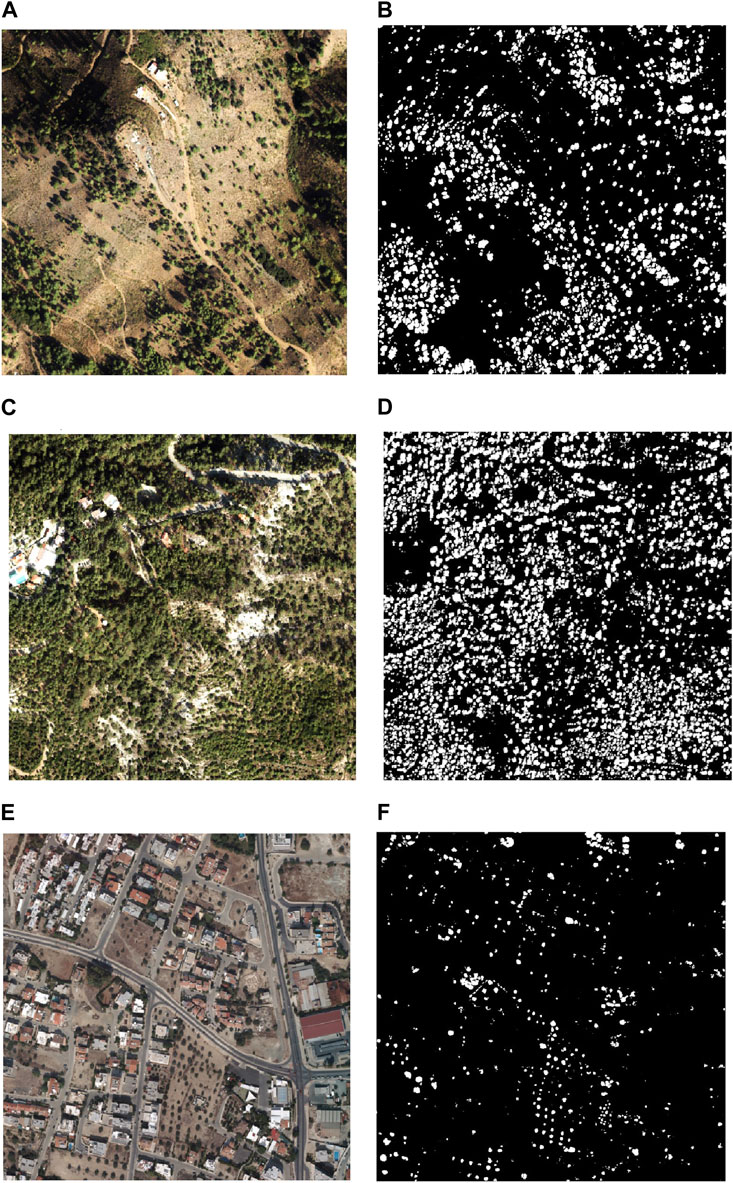
Figure 3. Three images of different landscapes that have been considered by the model together with the corresponding picture of tree masks that has been created by the model as crown segmentation output. (A) Athalassa forest park, (C) Troodos forest park, (E) Urban area). Each image covers an area of
2.4 Model configurations and training
The model architecture is a U-Net framework, widely employed in computer vision tasks. In line with the methodology proposed by Oktay (2018), the conventional U-Net was enhanced by integrating self-attention blocks to capture more relevant information during the down-sampling phase. Additionally, batch normalization was employed after each convolutional layer to enhance stability and accelerate the training procedure (Wang, 2018; Zhang et al., 2016). Most of the model parameters were shared between the two branches (segmentation and counting) with only those necessary for generating the ultimate output predictions being specific to each task. In the segmentation branch, a sigmoid activation function was employed in the final output layer to generate probabilities of a pixel to belong to a tree, ranging from 0 to 1. These probabilities were subsequently transformed into binary labels using a threshold of 0.5. According to Li et al. (2023), in the counting branch, a linear activation function is the best choice to preserve the values of the Gaussian kernel.
During each training epoch, random patches (tree crown labels) measuring
2.5 Model evaluation
For evaluation, we generated a new test dataset of 2,500 manually created tree crown labels, 2,000 labels in Troodos forest, and 500 labels of trees in Athalassa, and Aglantzia. There was no spatial overlap between this test data and the training data. There is unfortunately no accurate National Forest Inventory (NFI) sample data for Cyprus, as recent data based on permanent plots is lacking. Consequently, the evaluation of the model was done by using only our new testing dataset. For the crown area segmentation task, the model output was evaluated by calculating the common area between predictions and labels (F1 score). For the tree counting task, three metrics were used (Chalmers and Adkins, 2020; Sigal and Chalmers, 2016): the relative mean error (Equation 1), the relative total error (Equation 2), and the coefficient of determination
where
3 Results - estimation of tree crown area and tree counts
The evaluation metrics reported in the second column of Table 2, indicate an overall good agreement between manually created and predicted tree crown areas, as reflected by a relative total error of
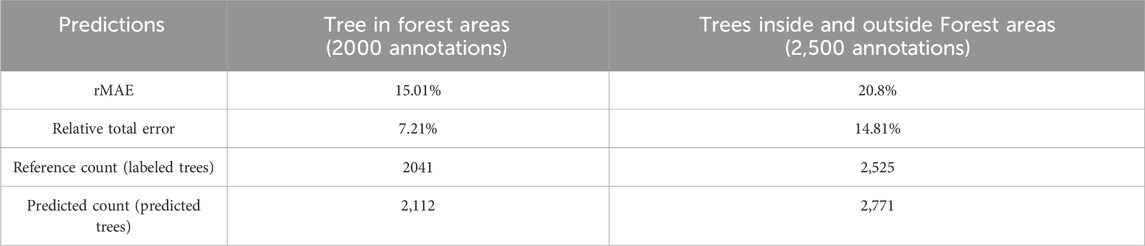
Table 2. Evaluation metrics of the model.
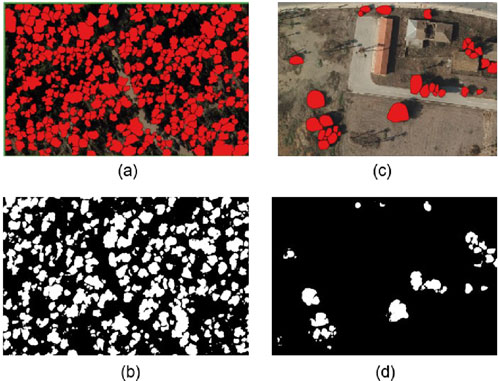
Figure 4. Examples of a dense forest area [image (A)] and a dry field [image (C)] that the model has been tested on, where all the trees were manually labeled with red masks. The corresponding binary masks of tree crowns are shown in images (B, D). The relative Mean Absolute Error (considering the total tree count based on density estimation for the two areas) for images (A, C) respectively, was found equal to 2% and 12.85%. The relative total error was found equal to 0.93% and 57.36%, respectively. Based on the relative error of the prediction for each image, it can be seen that the model counts trees more efficiently in dense forest areas due to its original design.
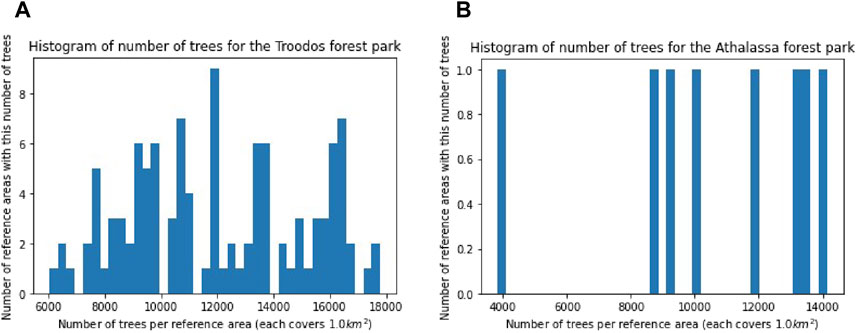
Figure 5. Histogram of the number of trees (X-axis) for Troodos forest park and Athalassa forest park (Frequency corresponds to the number of reference area images (covering
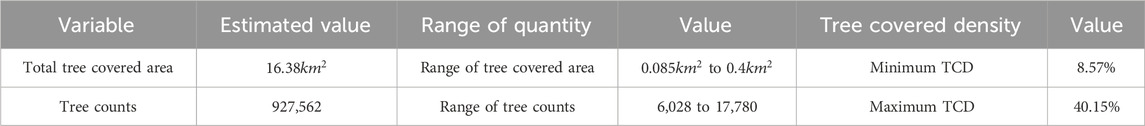
Table 3. Tree covered area, number of trees, and tree cover density range among 91 images in Troodos forest park. The tree covered area and the TCD have been calculated per reference area that covers

Table 4. Tree covered area, number of trees and tree cover density (per
3.1 Correlation between tree cover density (TCD) and number of trees
The relationship between tree cover density and the number of trees within an area allows us to better understand the structure of forests that include sparse trees. The correlation between these two variables for the Troodos National Forest Park, Aglantzia urban area, and Athalassa Forest Park is shown in Figures 6B, D, F, respectively.
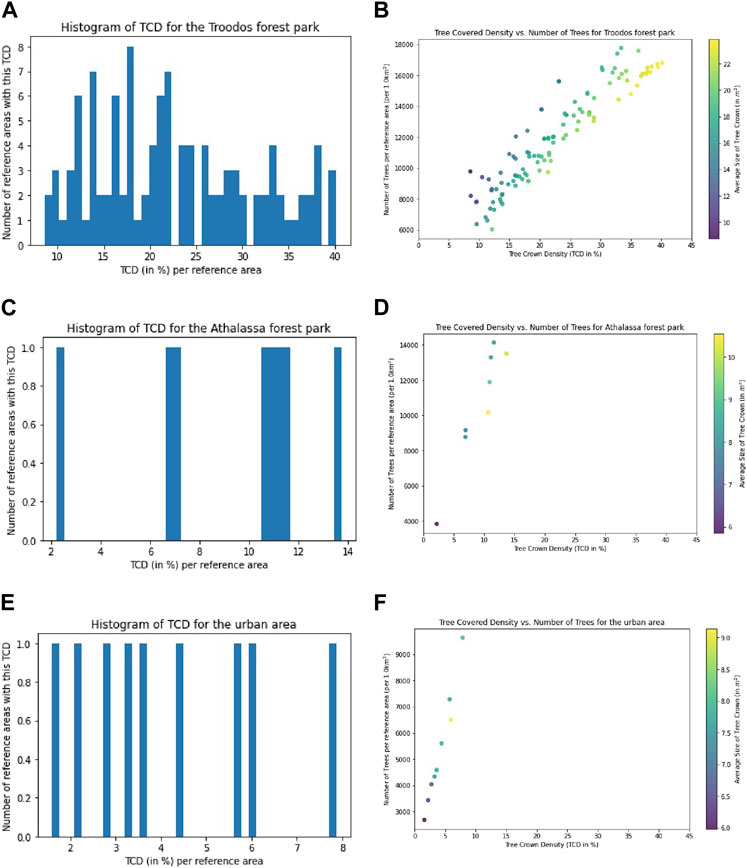
Figure 6. Histogram of the tree covered density and Scatter plot of Tree Cover Density (TCD) vs. Number of trees per reference area (size
For the Troodos Park, a correlation coefficient of 0.93 was found between tree cover density and the number of trees, as shown in Figure 6B. In other words, as tree cover density increases, there is a tendency for the number of trees to increase as well. The
For the Athalassa National Forest Park, the situation is slightly different. The correlation between TCD and the number of trees across
For the urban area, which includes buildings, a large number of trees has been found. Despite the fact that a very small area has been considered as a sample, it was found that there is a strong positive correlation between TCD and tree numbers, equal to 0.99 (seen Figure 6F). This is a surprising result given the expected wide variety of trees (and related maturity) encountered within the city.
According to Figure 6D, the maximum tree cover density of a
3.2 A power law for closed forests
A well-known empirical law in closed forests, referred to as self-thinning, is a linear heuristic relationship between log-transformed tree density and individual tree crown size in a forest stand that reaches its maximum density (Farrior et al., 2016). Essentially, trees compete for resources and space, so that a given area can only accommodate either a few large trees or many small trees. This principle is well-established in dense forests (i.e., with high TCD) where trees compete for access to sunlight. It is therefore, very interesting to examine the law for non-closed (i.e., with low TCD) forests such as the Troodos forest park and the small Athalassa forest park, where trees do not compete for light but rather for water or nutrients. The self-thinning exponent for these two forests is calculated as the linear regression slope between the logarithm of the average area covered by a tree crown against the logarithm of the number of trees. For the Troodos Forest Park, the self-thinning exponent equals −0.45, indicating that as the average individual tree size increases, the number of trees decrease quickly, with a strong relationship between the two (see Supplementary Appendix E). This steeper slope suggests a higher level of competition among tree species for resources such as water and nutrients. It also implies a more pronounced hierarchical canopy structure, with larger, dominant trees more effectively competing for resources and a decrease in the number of smaller trees. Additionally, the maximum tree cover density in a reference area of Troodos was found to be approximately 45%, indicating that Troodos is a sparse forest. This observation is particularly interesting because the forest law considered here has not been previously applied to sparse forests. For the Athalassa forest park, the self-thinning exponent equals −1.17, which indicates a moderate to strong negative relationship between tree density and individual tree size within this small city forest park (see Supplementary Appendix E). This indicates that trees in the area compete strongly for resources and they form a relatively uniform canopy. Since the park consists of mainly man-made vegetation we could suggest that a lot (possibly too many) trees were planted per area in Athalassa compared to Troodos forest park (see slopes of Figures 6B, C. The self-thinning exponent carries significant implications for forest management practices. For example, it can help in making decisions related to thinning treatments, spacing of trees, and stand density management to optimize timber production, biodiversity conservation, or other management objectives.
3.3 Estimation of the total area covered by tree crowns over Cyprus using our results and CLC + Backbone product map for tree cover
Because it was not possible to get access to all the photos available for Cyprus, we established a transfer function between our very high resolution dataset and a coarser resolution dataset, available for the whole island. When considering different coarse resolution tree cover datasets in Cyprus, such as the Global Forest Watch (GFW), the European Forest Institute (EFI) Maps, the CORINE Land Cover (CLC), we decided to use the CORINE CLC + Backbone product with 10 m resolution for the year 2018 to derive a moderate resolution estimation of the total tree covered area over Cyprus (Copernicus, 2020). The CLC + Backbone raster product provides comprehensive land-cover mapping, distinguishing 11 different land cover types, one of which is the tree cover. It uses pixel-based, multi-temporal Sentinel-2 imagery to create a continuous 10 m resolution map. When overlapping land cover types occur within a single pixel (such as a combination of vegetation and sealed surfaces), the product assigns one dominant class, generally using a majority rule where the class covering more than 50% of the pixel is selected. In the case of tree cover, the pixels of tree cover class are classified into two forest type classes, coniferous and broad-leaved.
The reason behind the choice of CLC+ is the quality of the prediction, which for Cyprus is almost
For the prediction of the size of the area covered by tree crowns per reference area, we used a Random Forest regression method, having as a feature value the forested percentage of CLC+ and as a target value the area covered by tree crowns from our very high resolution images. Using the area that is covered by our dataset of high-resolution images as a test set, we found that the performance of the model was good with Mean Absolute Error (MAE) equal to 0.0068, Mean Squared Error (MSE) equal to 9.125e-05 and R-squared (R 2): 0.82. The data in Figure 7) show that the model prediction is more efficient for areas with a moderate tree cover value compared to the rest of the data but also achieves the accurate prediction of tree cover in dense forest areas.
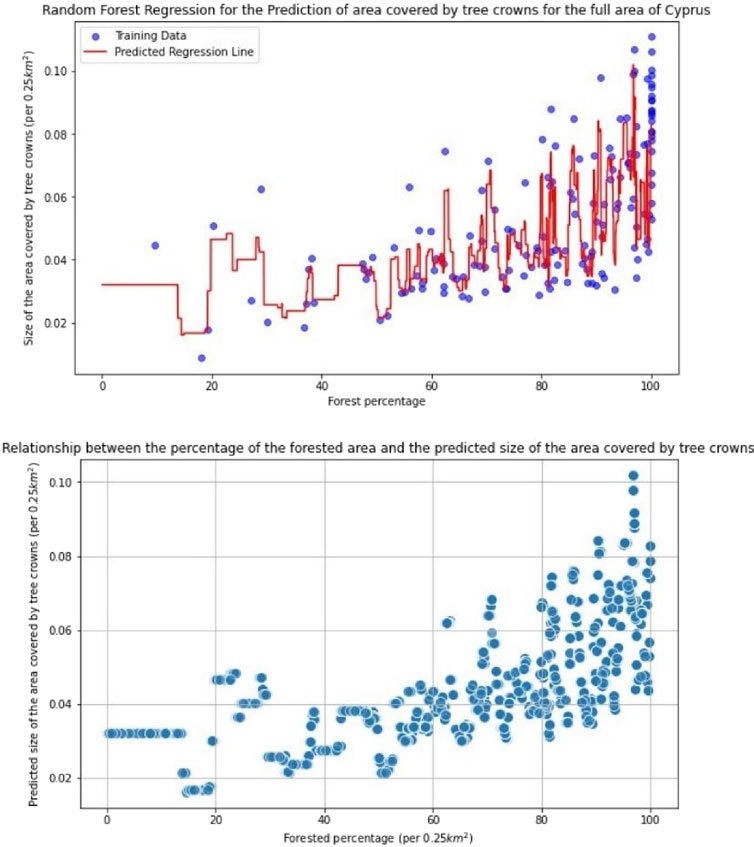
Figure 7. Prediction of the area covered by tree crowns in Cyprus by using the Random Forest regression.
The RF results applied to the whole island indicate that in Cyprus,
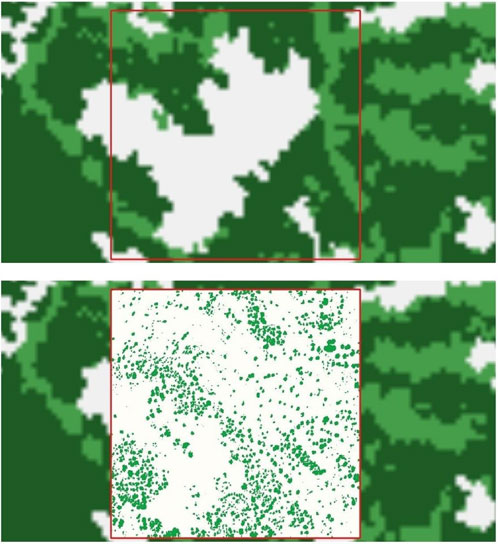
Figure 8. Comparison between the tree masks created by our model and the CLC + Backbone map of forest type tree cover with resolution 10 m/pixel.
4 Discussion
We used airborne remote sensing images alongside deep learning neural network models to estimate both area covered by tree crowns and the number of trees over three small study areas in Cyprus. This approach was selected based on the best available methods for creating tree inventories at the time of the study. The high-resolution (10 cm) aerial images enabled us to segment even small trees located outside forest areas, providing insights into urban tree resources, which have not been accounted for in any tree inventory conducted in the Mediterranean region. Simultaneously, deep learning models allow for fast and efficient analysis and prediction.
A test set was created to evaluate the model’s performance, covering all landscape types. The size of the test and training sets was determined based on the acceptable loss threshold we established, as well as the quality of the prediction we aimed to achieve. For other applications, such as the segmentation of larger objects (e.g., buildings), a smaller test set may suffice to achieve acceptable model performance.
The overall prediction quality of the model was excellent in forest areas and remained acceptable for trees outside of forests. In the original study by Li et al. (2023), the relative total error for non-forest trees was approximately
When combining our results with coarser resolution maps of tree cover and forest types, we found that tree canopy can be predicted at a national level by using a small sample of very high-resolution images as a reference. This combination improves the quality of the information derived from lower-resolution maps and highlights the advantages of using high-resolution images and state-of-the-art models. As illustrated in Figure 8, coarser-resolution (10 m) maps such as CLC + tend to overestimate tree cover in dense forest regions while underestimating it in urban areas with smaller trees. In the case of Troodos Forest Park, we found that CLC + Backbone overestimated tree canopy size by
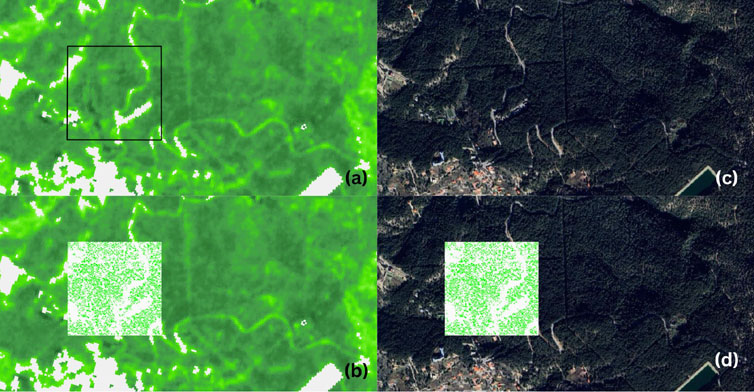
Figure 9. Comparison between our results, Copernicus TCD dataset, and Google satellite. Image (A) Copernicus TCD data image that includes the reference area that we used for estimating the total tree covered area of Cyprus. Image (B) Image of the same area including the tree masks that have been created by our model for the area in the rectangular. Images (C, D) Image taken by Google satellite for the same area and the tree-masked image that has been created by our model.
5 Summary and conclusions
This study addressed for the first time the quantification of the number of trees and the extent of tree cover within the largest forested region of Cyprus (the Troodos National Forest Park), employing tree segmentation and density mapping techniques. The model developed by Li et al., 2023 was used here by applying minor modifications to become compatible with the Cypriot landscape. It must be highlighted that this is the first time that a state-of-art model has been applied to segment and count trees over an Eastern Mediterranean region, Cyprus, making our results to be of high importance. Until now, there are no accurate estimates of the total number of trees in Cyprus and no national airborne inventory has been created. Therefore, the model can offer us the opportunity, having available data for the full country area of Cyprus, to create the first national airborne tree inventory.
To set up our model, a high-resolution orthophoto dataset was used to create manual annotations to define accurate tree areas and train our model efficiently. It was found that the Troodos forest area contains as many as 927,562 trees (no species categorization) with a total tree-covered area equal to
As a case study, we extended the application of our model to an urban area which includes a small forest park in the suburb of Nicosia. This is the first time that a study counted trees and evaluated the tree coverage in an urban area of Cyprus. A significant number of trees were found in this urban area, with approximately 130,000 trees in
Our model results were further processed by employing some additional statistical tests such as the correlation between the tree cover density and the number of trees measured for each image of reference area. The existence of areas with the same tree cover density but different numbers of trees at Troodos Forest Park, despite the strong correlation between the two variables, highlights the presence of tree species diversity in the area and provides insight into the nature of the ecosystem. For the Athalassa forest park (in Nicosia), there is also a strong correlation between tree cover density and the number of trees but with a rather different slope compared to the Troodos forest, suggesting a rather different type of forest while the strong correlation also suggests a quite homogeneous forest with trees in this area having similar size and age. Interestingly, for the small urban area, the correlation is again very strong with a slope similar to the forest park next to Nicosia. Therefore, our analysis highlights the significance of monitoring the number of trees and not only the tree-covered area, which is the parameter that is mainly studied worldwide. The correlation between tree cover density and the number of trees holds important implications for forest management and conservation efforts. Some of the aspects that can be considered, to develop a more sophisticated analysis are biodiversity, carbon stock, and the ecosystem in general. Consequently, it will be beneficiary to refine our study and examine other parameters such as climate, soil characteristics, and other environmental factors.
Due to the high purchasing cost of aerial images, we restricted our study to a small portion of the Troodos Mountains area while the CLC + backbone product map was used to scale up our model results and derive a raw estimation of the total tree covered area of Cyprus. In 2019, the total tree-covered area of Cyprus was estimated to be approximately 138,100 ha. Using the Troodos Forest Park as a case study, we found that the CLC + Backbone overestimated the tree canopy size by 100%. This result underscores the key advantage of our analysis—the use of high-resolution images. These images, with a resolution finer than 1 m/pixel, allow us to accurately account for gaps between trees, large shrubs, and other green objects that are not detectable in lower-resolution imagery. Overall, our results indicate that Cyprus holds a significant amount of tree-covered area which contributes to carbon stock. Our analysis emphasizes how important it is to look at both tree cover density and the number of trees. Knowing how these two factors interact can help in making smart choices in forest management and conservation efforts. It should be noted that the images were collected in 2019. Consequently, the variation in tree cover must be considered to make an accurate evaluation of the tree resources of Cyprus today. Our proposed strategy can be used in the future to evaluate how the tree-covered area changed through the years by using deep learning models and high-resolution orthophotos.
Thanks to the development of this model, we can realistically aim at the creation of the first national airborne tree inventory of Cyprus by applying the model to high-resolution images that cover the full area of the island. Such an inventory can contribute to the monitoring of the carbon emissions level to assess the development of strategies for the achievement of carbon neutrality, especially in the context of the Land Use, Land-Use Change and Forestry (LULUCF) initiative.
Data availability statement
A part of the dataset generated for this study and all the developed tree cover maps can be found on Zenodo470 under the paper title (https://zenodo.org/records/13987821?preview=1&token=471eyJhbGciOiJIUzUxMiJ9.eyJpZCI6ImM3NzZjZTNiLTc4ODQtNDJjNy05MzM4LTY5NTQ2YThhZmU5472_zKT4fCa12KmLRSTEt2fkpdtb8R9pD-jpTFpGvziA9GlicCkgMflJlpy1Il3HEjZPq-BO05k6oCdY Frontiers 12 Zenonos et al. Running Title The maps can also be accessed online in the following links: https://annzen.github.io/Athalassa_Forest_park_tree_map/index_Athalassa.html, https://annzen.github.io/Troodos_Forest_park_tree_map. All the generated dataset can be provided upon request to the correspondence author.
Author contributions
AZ: Conceptualization, Formal Analysis, Investigation, Resources, Software, Validation, Visualization, Writing–original draft, Writing–review and editing. SL: Data curation, Methodology, Writing–review and editing. MB: Writing–review and editing. JS: Funding acquisition, Supervision, Writing–review and editing. PC: Resources, Supervision, Writing–review and editing.
Funding
The author(s) declare that financial support was received for the research, authorship, and/or publication of this article. This project has received funding from the European Union’s Horizon Europe research and innovation program under Grant Agreement N° 101071247 (Edu4Climate – European Higher Education Institutions Network for Climate and Atmospheric Sciences).
Acknowledgments
PC acknowledges support from the German-French BMBF ANR project AI4FOREST.
Conflict of interest
The authors declare that the research was conducted in the absence of any commercial or financial relationships that could be construed as a potential conflict of interest.
Publisher’s note
All claims expressed in this article are solely those of the authors and do not necessarily represent those of their affiliated organizations, or those of the publisher, the editors and the reviewers. Any product that may be evaluated in this article, or claim that may be made by its manufacturer, is not guaranteed or endorsed by the publisher.
Supplementary material
The Supplementary Material for this article can be found online at: https://www.frontiersin.org/articles/10.3389/frsen.2025.1498217/full#supplementary-material
References
Bochkovskiy, A., Wang, C., and Liao, H. M. (2020). Yolov4: optimal speed and accuracy of object detection. Corr. abs/2004, 10934. doi:10.48550/arXiv.2004.10934
Chalmers, R., and Adkins, M. (2020). Writing effective and reliable Monte Carlo simulations with the simdesign package. Quant. Method Psychol. 16, 248–280. doi:10.20982/tqmp.16.4.p248
Copernicus, E. E. A. (2020). CLC+ backbone 2018 (raster 10 m), Europe, 3-yearly. Available at: https://sdi.eea.europa.eu/catalogue/copernicus/api/records/486f77da (Accessed April, 2024).
Cramer, W., Guiot, J., Fader, M., Garrabou, J., Gattuso, J., Iglesias, A., et al. (2018). Climate change and interconnected risks to sustainable development in the mediterranean. Nat. Clim. Change 8, 972–980. JRC105105. doi:10.1038/s41558-018-0299-2
Esa, E. S. A. (2024). Worldcover viewer. Available at: https://worldcover.esa.int/viewer.
Farrior, C., Bohlman, S., Hubbell, S., and Pacala, S. (2016). Dominance of the suppressed: power-law size structure in tropical forests. Science 351, 155–157. doi:10.1126/science.aad0592
Giorgi, F. (2006). Climate change hot-spots. Geophys. Res. Lett. 33, L08707. doi:10.1029/2006GL025734
Gong, H., Sun, Q., Fang, C., Sun, L., and Su, R. (2024). Treedetector: using deep learning for the localization and reconstruction of urban trees from high-resolution remote sensing images. Remote Sens. 16, 524. doi:10.3390/rs16030524
Guenther, A., Karl, T., Harley, P., Wiedinmyer, C., Palmer, P., and Geron, C. (2006). Estimates of global terrestrial isoprene emissions using megan (model of emissions of gases and aerosols from nature). Atmos. Chem. Phys. 6, 3181–3210. doi:10.5194/acp-6-3181-2006
Guo, J., Xu, Q., Zeng, Y., Liu, Z., and Zhu, X. X. (2023). Nationwide urban tree canopy mapping and coverage assessment in Brazil from high-resolution remote sensing images using deep learning. ISPRS J. Photogrammetry Remote Sens. 198, 1–15. doi:10.1016/j.isprsjprs.2023.02.007
Hansen, M., Potapov, P., Moore, R., Hancher, M., Turubanova, S., Tyukavina, A., et al. (2013). High-resolution global maps of 21st-century forest cover change. Sci. (New York, N.Y.) 342, 850–853. doi:10.1126/science.1244693
Lelieveld, J., Hadjinicolaou, P., Kostopoulou, E., Chenoweth, J., El Maayar, M., Giannakopoulos, C. e. a., et al. (2012). Climate change and impacts in the eastern mediterranean and the middle east. Clim. Change 114, 667–687. doi:10.1007/s10584-012-0418-4
Li, S., Brandt, M., Fensholt, R., Kariryaa, A., Igel, C., Gieseke, F., et al. (2023). Deep learning enables image-based tree counting, crown segmentation, and height prediction at national scale. PNAS Nexus 2, pgad076. doi:10.1093/pnasnexus/pgad076
Parliament, E., and Council, O. T. (2021). Regulation (eu) 2021/1119. Establishing the framework for achieving climate neutrality and amending Regulations (EC) No 401/2009 and (EU) 2018/1999 (“European Climate Law”). Available at: http://data.europa.eu/eli/reg/2021/1119/oj. (Accessed April 2024)
Ronneberger, O., Fischer, P., and Brox, T. (2015). U-net: convolutional networks for biomedical image segmentation. arXiv, 234–241. doi:10.1007/978-3-319-24574-4_28
Salehi, S., Erdogmus, D., and Gholipour, A. (2017). Tversky loss function for image segmentation using 3d fully convolutional deep networks. Med. Image Comput. Computer-Assisted Intervention – MICCAI 2017, 379–387. doi:10.1007/978-3-319-67389-9_44
Shorten, C., and Khoshgoftaar, T. (2019). A survey on image data augmentation for deep learning. J. Big Data 6, 60. doi:10.1186/s40537-019-0197-0
Sigal, M., and Chalmers, R. (2016). Play it again: teaching statistics with Monte Carlo simulation. J. Stat. Educ. 24, 136–156. doi:10.1080/10691898.2016.1246953
Sun, C., Huang, C., Zhang, H., Chen, B., An, F., Wang, L., et al. (2022). Individual tree crown segmentation and crown width extraction from a heightmap derived from aerial laser scanning data using a deep learning framework. Front. Plant Sci. 13, 914974. doi:10.3389/fpls.2022.914974
The republic of cyprus ministry of agriculture, rural development and environment (2019). Cyprus’ national forestry accounting plan in accordance with regulation (eu) 2018/841. Available at: https://www.moa.gov.cy.
Troodos (2024). The troodos national forest park. Available at: https://www.moa.gov.cy (Accessed April, 2024).
Turner, W., Rondinini, C., Pettorelli, N., Mora, B., Leidner, A., Szantoi, Z., et al. (2015). Free and open-access satellite data are key to biodiversity conservation. Biol. Conserv. 182, 173–176. doi:10.1016/j.biocon.2014.11.048
Wang, P. e. a. (2018). “Understanding convolution for semantic segmentation,” in 2018 IEEE Winter Conference on Applications of Computer Vision (WACV), Lake Tahoe, NV, USA, 12-15 March 2018 (IEEE), 1451–1460.
Yin, T., Zeng, J., Zhang, X., and Zhou, X. (2020). Individual tree parameters estimation for Chinese fir (cunninghamia lanceolate (lamb.) hook) plantations of south China using uav oblique photography: possibilities and challenges. IEEE J. Sel. Top. Appl. Earth Observations Remote Sens. PP, 827–842. doi:10.1109/JSTARS.2020.3038819
Zhang, L., Sun, J., Yang, X., Jiang, R., and Ye, Q. (2022). Improving deep learning-based cloud detection for satellite images with attention mechanism. IEEE Geoscience Remote Sens. Lett. 19, 1–5. doi:10.1109/LGRS.2021.3133872
Zhang, Y., Wang, M., Mango, J., Xin, L., Meng, C., and Li, X. (2024). Individual tree detection and counting based on high-resolution imagery and the canopy height model data. Geo-spatial Inf. Sci. 27, 2162–2178. doi:10.1080/10095020.2023.2299146
Zhang, Y., Zhou, D., Chen, S., Gao, S., and Ma, Y. (2016). “Single-image crowd counting via multi-column convolutional neural network,” in 2016 IEEE Conference on Computer Vision and Pattern Recognition (CVPR), Las Vegas, NV, USA, 27-30 June 2016 (IEEE), 589–597.
Zhou, Y., Wang, L., Jiang, K., Xue, L., An, F., Chen, B., et al. (2020). Individual tree crown segmentation based on aerial image using superpixel and topological features. J. Appl. Remote Sens. 14, 1. doi:10.1117/1.JRS.14.022210
Zittis, G., and Hadjinicolaou, P. (2017). The effect of radiation parameterization schemes on surface temperature in regional climate simulations over the mena-cordex domain. Int. J. Climatol. 37, 3847–3862. doi:10.1002/joc.4959
Keywords: tree segmentation, deep learning, remote sensing, image analysis, individual trees
Citation: Zenonos A, Li S, Brandt M, Sciare J and Ciais P (2025) AI-powered estimation of tree covered area and number of trees over the Mediterranean island of Cyprus. Front. Remote Sens. 6:1498217. doi: 10.3389/frsen.2025.1498217
Received: 18 September 2024; Accepted: 06 January 2025;
Published: 31 January 2025.
Edited by:
Liangxiu Han, Manchester Metropolitan University, United KingdomReviewed by:
Antonio Trabucco, Foundation Euro-Mediterranean Center on Climate Change (CMCC), ItalyJoão M. N. Silva, University of Lisbon, Portugal
Copyright © 2025 Zenonos, Li, Brandt, Sciare and Ciais. This is an open-access article distributed under the terms of the Creative Commons Attribution License (CC BY). The use, distribution or reproduction in other forums is permitted, provided the original author(s) and the copyright owner(s) are credited and that the original publication in this journal is cited, in accordance with accepted academic practice. No use, distribution or reproduction is permitted which does not comply with these terms.
*Correspondence: Anna Zenonos, YS56ZW5vbm9zQGN5aS5hYy5jeQ==