 Trevor Crosby
 Philip A. Townsend2
 Prabu Ravindran
 Brendan C. Heberlein
 Yi Wang
- 1Department of Plant and Agroecosystem Sciences, University of Wisconsin-Madison, Madison, WI, United States
- 2Department of Forest and Wildlife Ecology, University of Wisconsin-Madison, Madison, WI, United States
Proper monitoring of plant nitrogen (N) status and yield forecasting is essential to achieving a healthy crop and to maximizing profitability, especially in N-demanding crops such as potato. The most common method of monitoring potato N status (nitrate-N analysis of petioles) by the potato farmers in Wisconsin is time-consuming, destructive, and is impractical to sufficiently characterize spatial-temporal variability. This study utilized narrow-band hyperspectral imagery (including the visible and near-infrared (VNIR) and shortwave infrared (SWIR) spectral regions) collected over two growing seasons from two potato varieties (Russet Burbank and Soraya) grown under varied N treatments to develop robust partial least squares regression (PLSR) models for predicting potato in-season and at-harvest traits related to N. The results indicate that some traits such as leaf total N content, within-season tuber yield, and the marketable yield and quality at harvest could be well predicted for both varieties (R2 up to 0.78). The best spectral regions for those predictions varied depending on the growth stages of the plants, with VNIR predominating during early and mid-tuber, and SWIR during late tuber bulking. Our research suggests that the narrow-band hyperspectral imaging technique could be utilized to develop robust models to assist and potentially improve crop N fertilization decision-making, which will eventually result in higher input use efficiency of the cropping systems and better environmental stewardship for the farmers.
1 Introduction
Potato (Solanum tuberosum L.) is a food crop that is grown globally in a wide variety of locations (Hijmans, 2001; FAO, 2021). Over 375 million tonnes of potatoes were produced around the world in 2022 (FAO, 2021). In the United States, potato cultivation covers approximately 400,000 ha, and produces a total raw product value of approximately $4 billion per year (National Potato Council, 2018). Despite the economic importance of potatoes, farmers lack sophisticated tools that allow them to accurately and efficiently monitor and predict growing status of their crop during the field season, and to aid them to achieve maximum productivity and profitability while minimizing impact of potato production on the environment.
Nitrogen (N) is one of the key inputs that farmers must manage to achieve high crop yield and premium quality (Muleta and Aga, 2019; Stark and Love, 2003; Vos, 1999; 2009). Proper management of N fertilizer ensures the crop’s ability to produce marketable tubers, to achieve optimal canopy size, as well as to resist pest and disease pressure and environmental stresses such as drought and heat (Stark and Love, 2003). In spite of the essential role of N, the potato plant itself is generally inefficient at taking up N. Potatoes have shallow roots, with the majority of them confined to the top 30 cm of the soil (Epstein and Grant, 1973; Stark and Love, 2003). Potatoes in the U.S. are commonly grown on coarse-textured soils (King et al., 2020) in the northern part of the country that have low soil organic matter content (<10 g kg-1) and relatively shallow ground water tables. This soil feature together with rain events that produce soil saturation during the growing season are significant contributors to nitrate leaching and groundwater contamination in many regions of the country (Kraft et al., 1999; Kraft and Stites, 2003; Leghari et al., 2016; Stark and Love, 2003). Due to these factors, precision application of N fertilizer by potato farmers is highly necessary.
The most widely used method of monitoring N status and planning for fertilization is by collecting petiole tissues from the plants and analyzing them in a laboratory to determine the nitrate-N concentration (Rosen and Bierman, 2008; Stark and Love, 2003). If the petiole nitrate-N is lower than the published sufficiency range, a supplemental N fertilizer application is recommended, typically by 11–34 kg N ha-1 (Colquhoun et al., 2020). Aside from petiole sampling, similar analysis of total N in other plant parts, most often the entire leaf or a portion of the canopy, are also utilized to assess N status of the plants (Jones et al., 2021; Reis Jr and Monnerat, 2000; Lauer, 1985). Petiole nitrate-N reflects the immediate N status of the plants at the time of testing, and total N in leaves or vines indicates the accumulated N uptake of the plants from planting up until the point of test (Liu et al., 2021). However, these field sampling methods can only collect site-specific information from the sampled location in the field, with no ability to cover any spatial-temporal variability that might lead to under- or over-application of N fertilizer. Under-application could result in tuber yield and quality reduction, and over-application is often associated with underdevelopment of tuber skin at harvest and high chance of pathogen infection during storage, as well as nitrate leaching and groundwater quality issues.
With growers’ interest in adopting new technologies to maximize their fertilizer use efficiency and increase precision in their crop management, agricultural remote sensing has expanded rapidly into new areas of application in recent years (Pinter Jr et al., 2003). Remote sensing techniques are of particular interest and value to the agricultural industry due to the unique challenges that it faces, such as the seasonality in biological life cycles and the weather and climate variables that can impact crop production (Atzberger, 2013). By avoiding contact with the crop, remote sensing allows for data collection that is not invasive and destructive compared to the traditional field sampling methods. As well, remote sensing has the potential to be more time-efficient and less labor-intensive than field sampling (Alkhaled et al., 2023). Remote sensing in agriculture generally uses the relationship that leaf or canopy spectral signature has with biological traits of the plants to estimate or predict information on features of the crop (Curran, 1989; Muñoz-Huerta et al., 2013). The optical properties used to obtain this information may stem from characteristics such as spectral reflectance or transmittance of plant tissues as well as fluorescence of chlorophyll or polyphenol (Muñoz-Huerta et al., 2013). Because N is a critical element in chlorophyll synthesis, photosynthetic capacity and plant productivity, spectral regions associated with chlorophyll content are oftentimes the key basis for evaluations of crop N status and vigor (Ali, 2020; Delloye et al., 2018; Patane and Vibhute, 2014; Schlemmer et al., 2013). As a pigment, chlorophyll content is directly associated with reflectance from the visible and near-infrared (VNIR) spectral regions (Curran, 1989; Evans, 1989; Gitelson and Merzlyak, 1996; 1998). In addition, many spectral ranges in the shortwave infrared (SWIR) region (1,400 nm–2,500 nm) are correlated with plant traits such as content of starch, lignin, protein, cellulose, and nonstructural carbohydrates (Curran, 1989; Liu et al., 2021). Together, spectra from the visible through shortwave infrared (VSWIR, 400–2,500 nm) offer great potential for concurrent mapping of many plant traits (Wang et al., 2020). In agriculture, these traits can directly influence plant total N content, plant vigor, yield and quality.
Handheld sensors have been deployed in N content prediction (Abdelbaki et al., 2021; Ali, 2020; Ali et al., 2020; Prikaziuk et al., 2022; Singh et al., 2018; Zheng et al., 2018), and remote cameras mounted on unmanned aerial vehicles have also been used to predict crop N status (Abdelbaki et al., 2021; Cai et al., 2019; Li et al., 2020; Li et al., 2018; Zheng et al., 2018). These smaller-scale methods often have high resolution but are less adept at effectively capturing information from large agricultural areas, compared to larger-scale methods such as imagery collected from airplanes and satellites. In addition, the use of a small number of broadband spectral data captured in multispectral imagery may fail to capture the nuance of a crop canopy’s spectral signatures. By comparison, hyperspectral imagery collects continuous measurements of spectral data from a wide range of narrow bands across the electromagnetic spectrum, and it is these narrow features that enable detection of foliar nutrition (Curran, 1989; Martin and Aber, 1997). Hyperspectral images are generally described as a data cube, with the X and Y planes containing spatial information and the Z plane containing a large range of spectral information, i.e., each “pixel” in the image is a continuous spectrum covering the VSWIR wavelengths (Shukla and Kot, 2016).
Partial least squares regression (PLSR) is a statistical model which utilizes weighted predictor components to model the relationship between predictor variables and a response variable (Garthwaite, 1994). A key feature of PLSR is that it uses latent variables to explain the effects of correlated independent variables, causing it to perform well in situations where multicollinearity is high (Haenlein and Kaplan, 2004; Wold et al., 1984). Multicollinearity is an issue that occurs when two or more independent variables in a multiple regression model are highly correlated, resulting in a raised or lowered standard error within the coefficients of the model, and ultimately leading to models that are overfitted and difficult to accurately interpret (Tsagris and Pandis, 2021). Multicollinearity is a critical concern when developing predictive models using hyperspectral data, as the number of ground-truthed field measurements can be considerably fewer than the number of initial wavelengths, resulting in high correlation between the independent variables of the model (Grossman et al., 1996; Martens and Naes, 1992). For this reason, PLSR has been used to avoid overfitting while accurately predicting foliar chemistry from hyperspectral imagery, including traits associated with plant N status and productivity (Asner et al., 2015; Li et al., 2020; Liu et al., 2021; Nguyen and Lee, 2006; Singh et al., 2015; Wang et al., 2020; Liu et al., 2021).
While the use of hyperspectral remote sensing to capture a wide range of narrowband reflectance values from the full VSWIR has been shown to aid in the prediction of biophysical traits of plants, this technology has not been widely investigated in most crops, including potatoes. Much of the existing scientific literature on predictions of potato N status from hyperspectral data only focuses on the visible-near infrared (VNIR) region, which in remote sensing covers the range of 400 nm–1,000 nm (Abdelbaki et al., 2021; Cohen et al., 2010; Li et al., 2020; Jain et al., 2007; Morier et al., 2015).
The objective of the research presented in this paper is to develop data-driven models to predict in-season and at-harvest aboveground and belowground traits of potato plants grown under different N treatments using hyperspectral data from a 2-year field study. By using image data from multiple years and across the growing season, this research addresses issues of generalizability that arise from analyses using data from a single plant growth stage or year, since the relevant spectral characteristics may differ seasonally or between years if climatic conditions differ. The models developed in this study will likely allow potato growers to make more informed management decisions, resulting in more efficient use of N fertilizer while still optimizing crop yield and quality, and minimizing the impact of fertilizer use on the invaluable ground water resource.
2 Data and methods
2.1 Field data
2.1.1 Study location, experimental design, and weather conditions
A 2-year field trial was conducted at the University of Wisconsin-Madison Hancock Agricultural Research Station (Hancock, WI, latitude: 44.12°N; longitude 89.53°W; elevation 328 m) using a randomized complete block design for each variety. In 2020, only Russet Burbank (a fry processing variety) was grown, and in 2021 both Russet Burbank and Soraya (a yellow fresh market variety) were grown. Russet Burbank is the No.1 potato variety grown in the U.S., and it is highly N-demanding (Bethke, et al., 2014). Soraya is a recently released variety from the Netherlands, and was bred to develop small canopies with minimum use of N fertilizer but high yield potential (D. Maum, personal communication, 10 January 2020). The soil type in this location is categorized as a loamy fine sand (organic matter <1%) from a depth of 0–45 cm and as a fine sand (organic matter <0.5%) from a depth of 45–75 cm. Each plot consisted of eight 6-m by 0.9-m rows. Within a plot, the outermost rows (rows one and 8) were used as guard rows, rows 2 and 3 were used for in-season tuber digging and whole vine collection, rows 4 and 5 were used for in-season petiole and leaf collection, and rows 6 and 7 were harvested for final yield and quality evaluation. The study included four replications of 4 N fertilizer treatments, each treatment with varied fertilizer amounts and application timings (Table 1). Stater fertilizer was banded with a planter attachment. Fertilizer at hilling was banded and incorporated. All the in-season fertilizer was side dressed and irrigated immediately. Aside from N application, other production practices including irrigation and pest management were performed following University of Wisconsin–Madison Extension recommendations (Colquhoun et al., 2020).
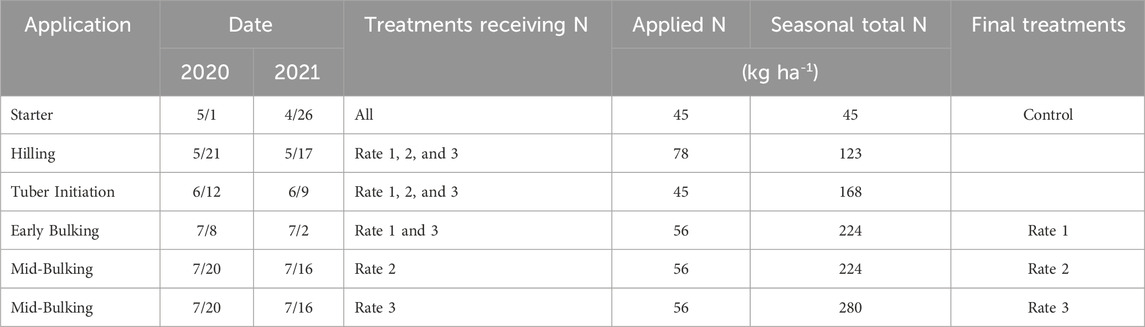
Table 1. Nitrogen application treatments applied in this study.
Planting occurred on 1 May 2020 and 22 April 2021. Emergence was observed on 25 May 2020 and 20 May 2021 respectively. Monthly average air temperature and average precipitation between May and August in 2020 and 2021 is shown in Supplemental Figure 1. In both years, daily minimum temperatures dropped below freezing (0°C) within 2 weeks of planting. While precipitation events were generally evenly distributed across 2020, there was one large (approximately 5 cm) precipitation 2 weeks after planting. In 2021, a long dry spell coincided with daily average temperatures above 30°C in early-to-mid June. Overall higher variation in precipitation amounts were observed with frequent small or large events in 2021 than 2020.
2.1.2 Ground truthing data collection
All in-season sampling occurred between 8:00 a.m. and 12:00 p.m. 1 day at early, mid-, and late tuber bulking stages respectively in each year. Petioles and whole leaves (petioles + leaflets) were collected from 20 randomly selected healthy plants per plot for nitrate-N and total N analysis separately. On the same day, three healthy plants per plot were randomly removed and separated for whole canopy samples (including leaves, stems and flowers) and tuber samples. Whole canopy samples were measured for biomass at sampling and were chopped into pieces to measure total N content and total N uptake later. Tuber samples were measured for tuber biomass at sampling. Petiole, whole leaf, and whole canopy samples were placed into paper bags separately and transported to a dryer at 70°C for a minimum duration of 48 h until no more weight was lost. Post drying, the tissues were ground using a Wiley mini mill (Thomas Scientific, Swedesboro, New Jersey) to facilitate passage through a 2-mm sieve.
For petiole nitrate-N analysis, extraction of nitrate was conducted with 2% acetic acid (MacKown and Weik, 2004). Firstly 0.10 g of ground dry tissue samples was weighed into a 50 mL centrifuge tube before the addition of 25 mL of 2% acetic acid. Capped tubes were then shaken for 15 minutes before filtration of samples through Whatman No. 2 filter papers. The filtered samples were analyzed by flow injection analysis on a Fialyzer 1,000 Series instrument (FIALab, Seattle, WA) using a nitrate/nitrite analysis by the Griess method with cadmium reduction of nitrate to nitrite (Gal et al., 2004). Unit of petiole nitrate-N was mg (kg of dry weight)−1.
For total N content analysis of whole leaves and whole canopies, ground dry tissue samples were weighed (2 – 5 mg) into tin foil capsules and analyzed using an elemental combustion analyzer (Costech Analytical Technologies, INC., Valencia, CA). Whole canopy total N uptake per plot was calculated by the equation: whole canopy dry weight × total N %.
All plots were harvested to measure marketable yield, tuber specific gravity, and fertilizer N recovery % in late September of both years. Tubers were washed and graded by weight (for Russet Burbank) or diameter (for Soraya) using an AgRay Vision x-ray grading machine (AgRay Vision, Acampo, California). Marketable yield was calculated as the yield of non-culled tubers that had a weight larger than 170 g (for Russet Burbank) or a diameter larger than 3.8 cm (for Soraya). These values were used to reflect regional industry standards. Culled tubers that were misshaped, diseased or defected were disposed. Tuber quality was assessed by measuring specific gravity (an indicator for tuber starch content) with a Weltech PW-2050 Dry Matter Assessment System. After taking the weight of a 2000 g–3,000 g of tuber samples from each plot in the air and in water, the system used the following formula to calculate the specific gravity for the sample (Kleinkopf, et al., 1987):
Subsequently, a subsample of tubers ranging from 200 to 350 g were randomly selected from the same batch, chopped and placed in paper bags for drying at 70°C until no weight was lost. Post drying, these samples were ground using a Thomas-Wiley laboratory mill (Model 4) to pass through a 2-mm sieve, ground dry tuber tissue samples were then weighed (2 – 5 mg) into tin foil capsules and analyzed for total N content (% dry weight basis) of the plants in each plot. Total N uptake per plot was calculated by the equation: tuber dry weight × total N %. Fertilizer N recovery % was defined as the ratio of N that was taken up by the tubers and removed from the field during harvest to the seasonal total N applied.
2.2 Imaging data collection and processing
A co-aligned HySpex (Norsk Elektro Optikk, Norway) system was utilized to capture hyperspectral imagery during each field season. This system was made up of a VNIR-1800 camera with 186 spectral bands between 400 nm and 1,000 nm and a spectral resolution of 3.26 nm, as well as a SWIR-384 camera with 288 spectral bands between 953 nm and 2,518 nm and a resolution of 5.45 nm. The flight was at an altitude of approximately 365 m above the ground, giving a spatial resolution of 0.25 m in the VNIR-1800 system and 0.5 m in the SWIR-348 system. Imagery collection dates (as indicated by crops’ days after emergence (DAE)) in 2020 and 2021 were chosen to ensure they covered the critical potato growth stages in each field season. They included: early tuber bulking (53 DAE in 2020 and 51 DAE in 2021), mid tuber bulking (61 DAE in 2020 and 59 DAE in 2021), and late tuber bulking (81 DAE in 2020 and 85 DAE in 2021). Imagery collection dates were coordinated with field sampling dates as closely as possible, although weather factors (primarily precipitation and cloud coverage) limited the ability to align flight dates perfectly. For predictions of in-season traits, ground truthing data was paired with imaging data only when their collection dates were no more than 3 days apart. Pairs of collection dates for aerial imaging and in-season field measurement in this study are shown in Table 2. Data from Russet Burbank and Soraya individually and combined were used for in-season predictions. End-of-season traits were predicted using at-harvest measurements paired with spectral data collected at early, mid- and late tuber bulking separately in each of the 2 years. In addition, models for end-of-season traits were developed using spectral data collected from all three growth stages combined across the 2 years. This paper reported at-harvest predictions for Russet Burbank because only this variety was grown in both years.
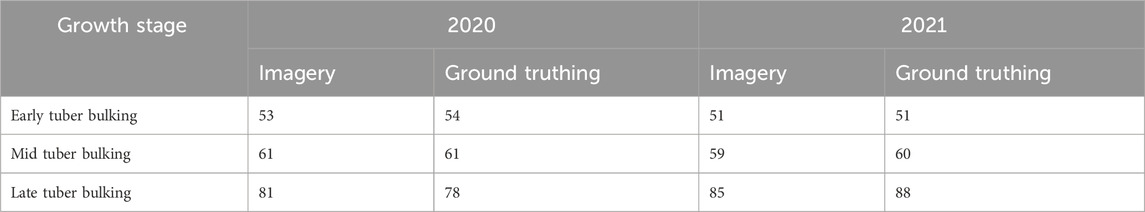
Table 2. Timeline of data collection (as indicated by days after emergence) for paired imaging and in-season field measurements.
HySpex images were processed using a consistent and open-source workflow following Liu et al. (2021), https://github.com/EnSpec/hypro). Processing steps included radiometric calibration using manufacturer-provided coefficients, correction for smile effects (shifts in wavelength position across spectrometer focal array (Schläpfer and Richter, 2010), orthorectification to <1 m precision using GPS-IMU data, atmospheric correction (Richter and Schläpfer, 2010), and correction of bi-directional reflectance distribution effects due to variations in sun-sensor-target geometry across flightlines (Queally et al., 2022).
Spectral smoothing and data extraction for statistical analyses Savitzky–Golay filter (window size: 7) was used to reduce noise in surface reflectance (Schafer, 2011). Then, the average reflectance of all vegetation pixels within each subplot was extracted. Non-vegetation pixels (e.g., shadows and soil) were excluded using NDVI<0.5. Vector normalization was performed to reduce the effects of illumination conditions on reflectance (Asner et al., 2015; Feilhauer et al., 2010). Reflectance values extracted from the hyperspectral imagery were averaged over each plot for modeling. Spectral data from atmospheric water absorption features at 1,320–1,470 nm and 1780–2000 nm were removed from analysis, as were noisy data from 2,350–2,500 nm. Plot mean reflectance values were paired with the target predicted trait measured from each plot and were then used to build partial least squares regression (PLSR) models. All steps were performed using the open-source Geospatial Data Abstraction Library (GDAL, version 3.0.4), as well as Python packages Pillow (6.2.0), Numpy (1.17.2) and Scipy (1.3.1).
2.3 Modeling
All PLSR modeling was done using the HyTraits package in Python. PLSR analyses (Figure 1) consisted of an outer loop, where the original dataset was split into a calibration (70%) and testing (30%) dataset, and an inner loop, where the calibration dataset was further split into a training (70%) and validation (30%) dataset, which was used for hyperparameter testing. Models were built using different values for the maximum number of components in the PLS process, with the model that performed the best on the validation data being saved. The outer loop was nested within the inner loop, with each inner loop process repeated 100 times, and a total of 200 outer loop processes. This pipeline yielded 200 final models that were saved from each model’s respective inner loop process. Final predictions were created by averaging the output of these 200 final models. Models were evaluated according to the testing R2 and Normalized Root Mean Square Error (NRMSE). The standardized regression coefficients were used to evaluate the contribution of each wavelength to the estimation of potato traits (Liu et al., 2021).
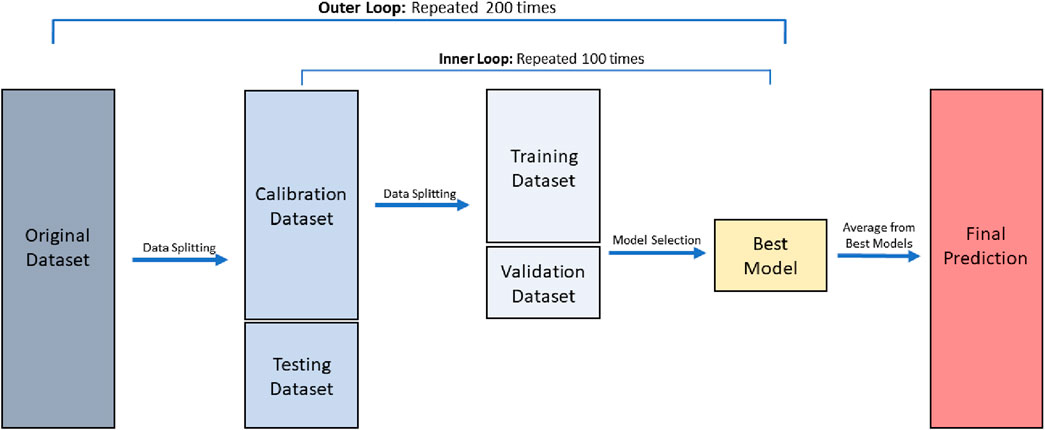
Figure 1. A flowchart illustrating the HyTraits PLSR modeling process.
Cross-year validation was conducted where the models were calibrated using data from 1 year and tested on data from the other year. Only data from Russet Burbank that was cultivated in both years was used for the cross-year validation. Cross-variety validation was performed using data from one variety for calibration and those from the other variety for testing. In addition to models using the entire spectrum (400 nm–2,500 nm), models were built using only the visible-near infrared (VNIR) spectrum (400 nm–1,300 nm) or the shortwave infrared (SWIR) spectrum (1,400 nm–2,500 nm) (Liu et al., 2021).
All data management was performed using the Python (version 3.8.8) packages NumPy (version 1.20.1), pandas (version 1.2.4), and SciKit Learn (version 0.24.1) and the R (R Core Team, 2019) package ggplot2 (version 3.4.2).
3 Results
3.1 Evaluation of PLSR models created to predict in-season and at-harvest traits using the whole spectrum
For analyses using both years, model performance across all five in-season traits of interest and by variety exhibited R2 > 0.5 and NRMSE ranging 0.15–0.27 (Figure 2). Compared to the control treatment, the three higher N rates (Rate one–3) were consistently associated with higher N status indicators, and higher total N uptake in both aboveground whole canopies and belowground tubers. However, no general trends could be summarized about N effects on the in-season immediate tuber yield. In most cases, the models created using the Russet Burbank data alone slightly outperformed those created using the Soraya data alone or models created from both varieties.
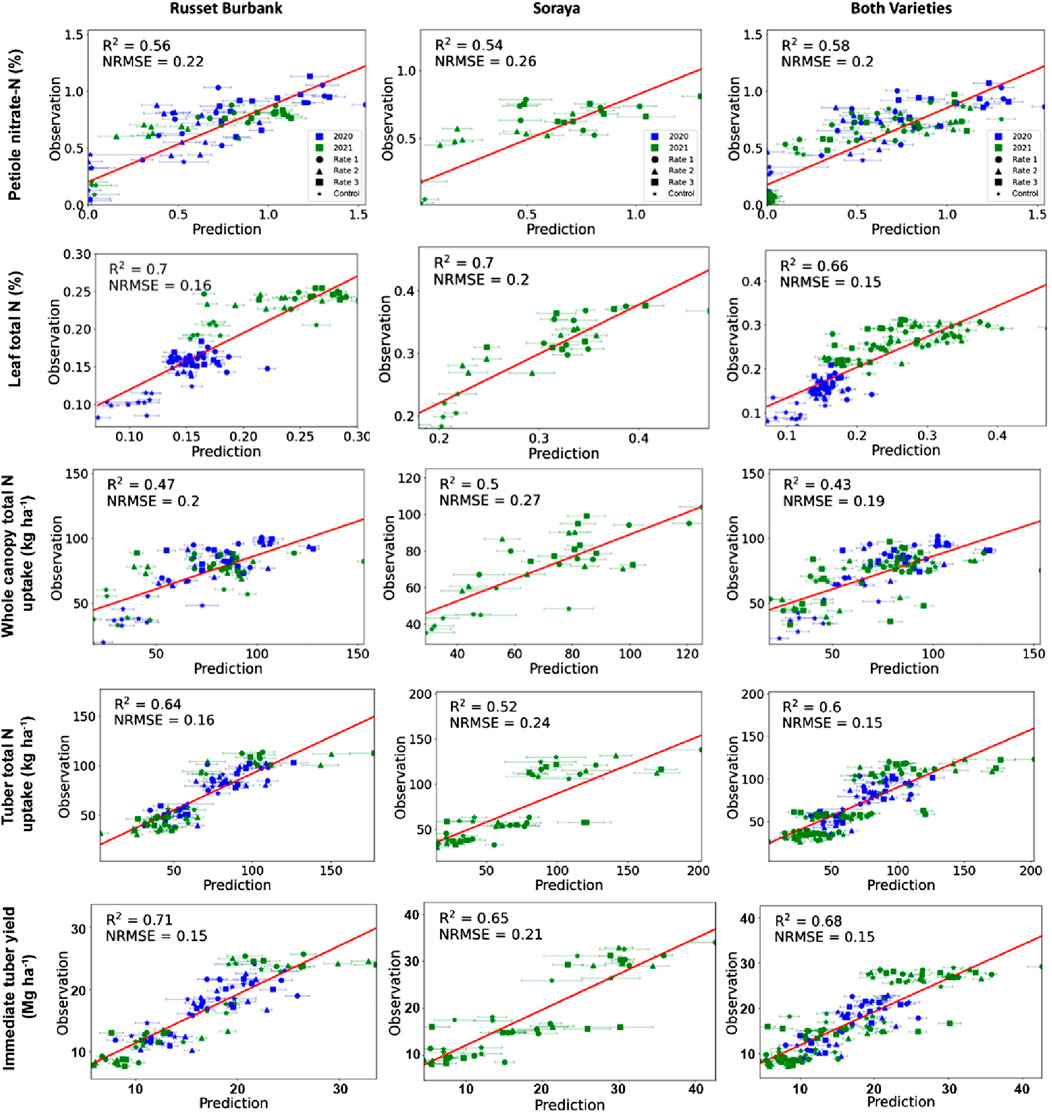
Figure 2. PLSR modelling testing results (testing R2 and Normalized Root Mean Square Error (NRMSE)) of in-season aboveground traits including petiole nitrate-N, leaf total nitrogen (N) content, and whole canopy N uptake, and belowground traits that included tuber N uptake and immediate tuber yield of each variety as well as of both varieties combined. In each figure, different colors were used to indicate the 2 years, and different marks were used to indicate the 4 N treatments. Horizontal bars indicate the uncertainty (±1 standard deviation) in predictions.
Models built from the leaf data had better performance (total leaf N, R2 = 0.66–0.70) than those built from the petiole data (petiole nitrate-N, R2 = 0.54–0.58). Models predicting whole canopy N uptake showed moderate accuracy, whereas those predicting tuber N uptake and in-season immediate yield were strong with R2 values ranging from 0.52 to 0.71.
Prediction of traits measured at harvest are shown in Figure 3. The control treatment consistently produced the lowest yield, smallest tuber size, and lowest fertilizer N recovery % at harvest. No trend of N effects on specific gravity were observed. Marketable yields in 2021 were higher than those in 2020 across all treatments, likely due to different weather conditions during the two growing seasons. In general, models built from imaging data collected from the three different growth stages had comparable results, with the best results from early- and mid-tuber bulking stages. In all cases, models predicting marketable yield and specific gravity all performed well (R2 > 0.6), whereas models predicting fertilizer N recovery % exhibited lower evaluation statistics (R2 < 0.4).
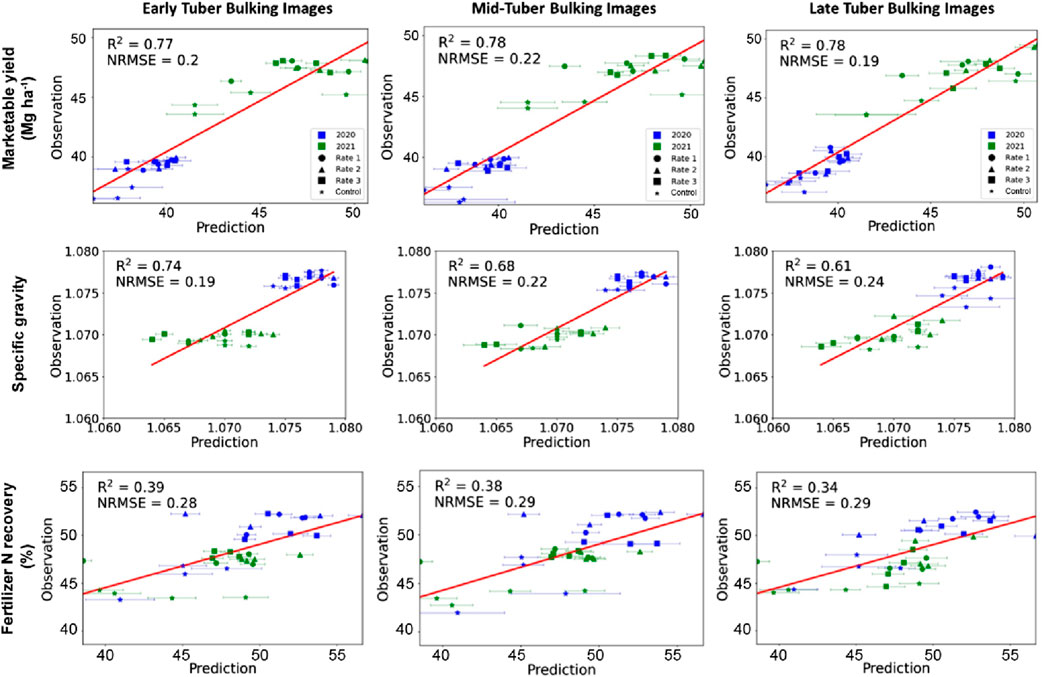
Figure 3. PLSR modeling testing results (testing R2 and Normalized Root Mean Square Error (NRMSE)) of at-harvest traits that included marketable yield, specific gravity and fertilizer nitrogen recovery using images collected at early, mid-, and late tuber bulking stages across the 2 years for Russet Burbank. In each figure, different colors were used to indicate the 2 years, and different marks were used to indicate the 4 N treatments. Horizontal bars indicate the uncertainty (±1 standard deviation) in predictions.
Models to predict at-harvest traits using spectral data combined from all three growth stages (named multi-stage models) for Russet Burbank typically did not improve in comparison to those built using only one date of imagery (named single-date models), except for marketable yield (data not shown). No general trends emerged when comparing multi-stage models with the single-date models developed using imagery from the mid- or late tuber bulking stages.
3.2 Cross-year and cross-variety validation results
In general, models calibrated with Soraya and tested with Russet Burbank generated similar or better prediction results (similar or higher R2) for both aboveground and belowground traits than those calibrated with Russet Burbank and tested with Soraya (Table 3). The belowground tuber N uptake could be well validated both ways with R2 close to or higher than 0.6. Comparatively, predictions of the immediate tuber yield could not be well validated across the two varieties.
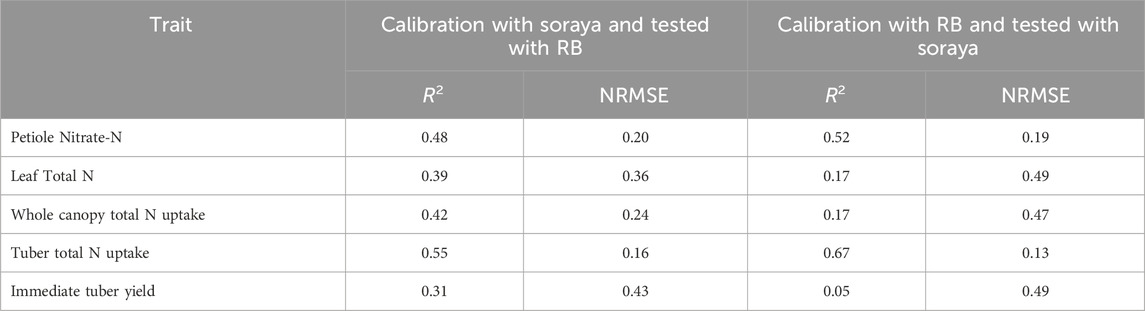
Table 3. Evaluation statistics of cross-variety validation models to predict in-season aboveground and belowground potato traits.
For the cross-year validation, the multi-stage model predicting marketable yield showed better performances with higher R2 and lower NRMSE than the single-date models for both ways of validation (Table 4). Specific gravity could not be well validated in either case. Fertilizer N recovery % showed moderate validation results across different growth stages or over the whole season.
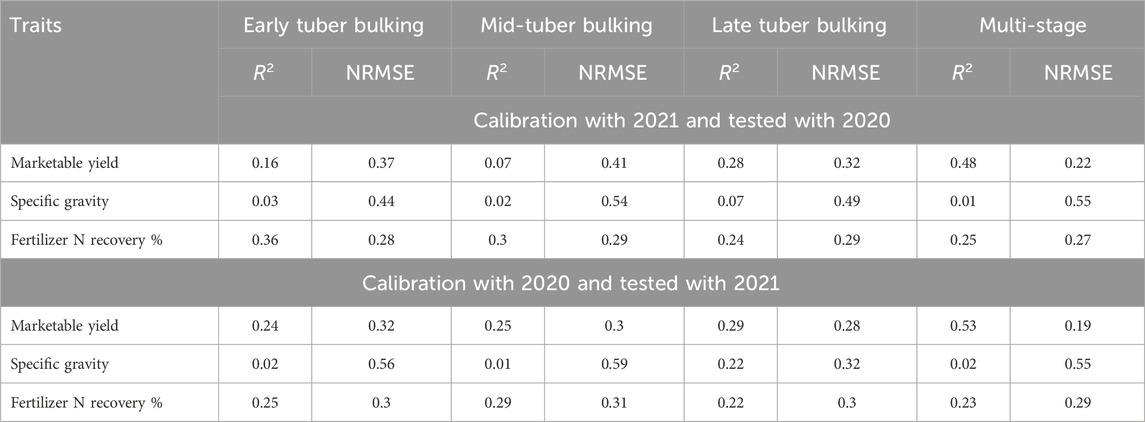
Table 4. Cross-year validation results that show evaluation statistics of single-date (at early, mid- and late tuber bulking) and multi-stage models predicting at-harvest traits for Russet Burbank.
3.3 Standardized regression coefficients
Full spectrum standardized regression coefficient values (“coefficients” in short) illustrate the contribution of different wavelengths or wavelength regions to models predicting in-season aboveground and belowground traits (Figure 4). For interpretation, these are used to identify the plant spectral characteristics that contribute to the prediction capacity, in particular since some traits (e.g., marketable yield, specific gravity) are not directly sensed in the imagery, but rather are inferred from foliar characteristics. In both the VNIR and SWIR regions, coefficient weights typically followed consistent trends among the different trait prediction models. The coefficients of features from the regions (530–630 nm and 700–750 nm) mostly associated with chlorophyll had relatively large weights. Coefficients from the red-edge position (680 nm–780 nm) were weighted heavily as well. Although coefficients from the near-infrared region were not consistently weighted heavily, some portions of this region had high weights, particularly from 900 to 1,200 nm (the region that is related to plant structure).
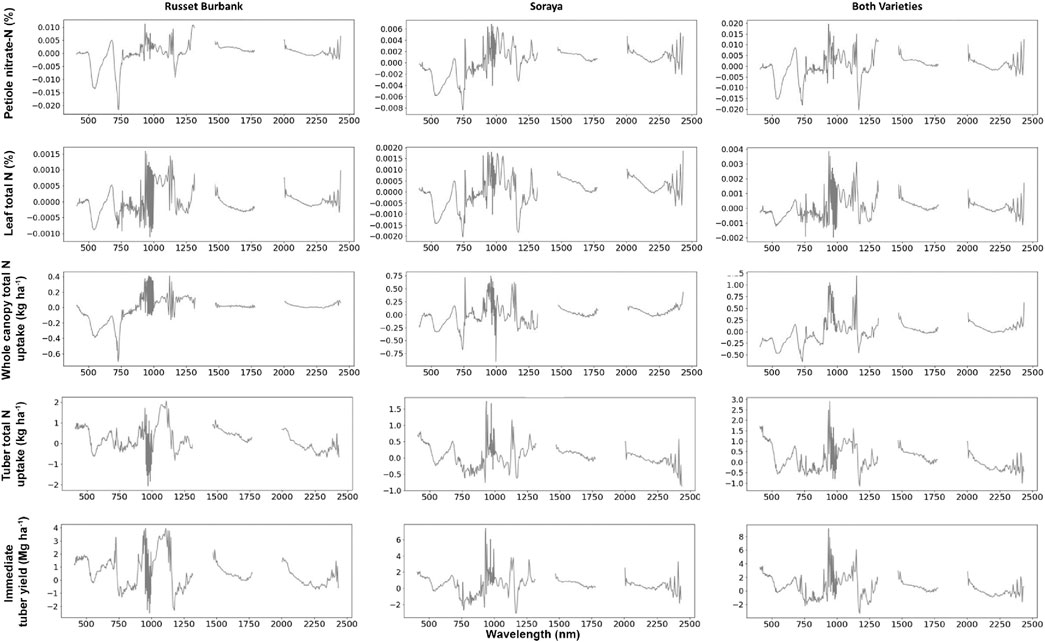
Figure 4. Standardized regression coefficients for models predicting in-season aboveground and belowground traits for each variety as well as the two varieties combined across different nitrogen treatments.
Features had overall lower coefficients in the SWIR region than in the VNIR region. And features in the SWIR region showed more difference between the two varieties, which is likely related to their genetic differences. In general, features at the beginning (from 1,500 nm to 1,600 nm) and the end (from 2,300 nm to 2,450 nm) of the SWIR region had larger weights. Coefficients from the SWIR region were overall the highest in models built from the Soraya data alone and were the lowest in those built from the Russet Burbank data alone. Over the whole spectrum, although following the same trends, coefficients at specific wavelengths of Russet Burbank are different from those of Soraya, indicating that those two varieties have different spectral signatures under the same N treatments.
The standardized regression coefficient values for models using the images collected at one of the three growth stages across the 2 years for Russet Burbank to predict at-harvest traits follow the same trends as those found in the in-season belowground traits, with the highest weights found in the 900 nm–1,200 nm range (Figure 5). No consistent trends were noted across different traits for models built from imagery taken at different growth stages (i.e., early vs. mid-vs. late tuber bulking). For models predicting marketable yield and fertilizer N recovery % by tubers, the coefficients of features from the chlorophyll-associated wavelengths were weighted lower at the late tuber bulking stage of the season than in the early season, whereas the opposite was true for models predicting specific gravity. Models built using imagery from the mid-tuber bulking stage had larger weights on features in the 2,250 nm–2,450 nm range than those built using imagery from the early or late tuber bulking phases.
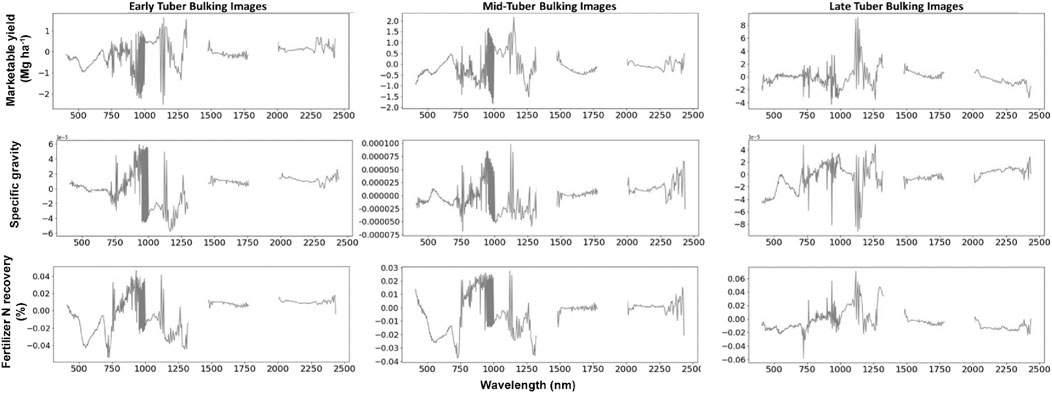
Figure 5. Standardized regression coefficients for models predicting at-harvest traits using images collected at each of the three growth stages during the field season (i.e., early, mid-, and late) across the 2 years and different nitrogen treatments for Russet Burbank.
3.4 PLSR model performance with different spectral regions
Predictions of each in-season trait were performed using three different spectral datasets: 1) the entire set of spectral data; 2) the visible-near infrared (VNIR) region ranging from 420 nm–1,300 nm; and 3) the shortwave infrared (SWIR) region ranging from 1,400 nm–2,350 nm. The best spectral region (with the highest R2 and lowest NRMSE) for each trait of the two varieties individually and combined is reported in Table 5. The use of different spectral regions generally resulted in comparable R2 and NRMSE values for each trait, but predictive models built from the two varieties individually or combined had noticeably different performances under different spectral regions. For Russet Burbank, the models using the SWIR spectral data consistently underperformed those using the VNIR spectral data or the full spectrum. In comparison, when creating predictive models with only the Soraya data or with data of both varieties, no single spectral region consistently performed the best. Predictions of plant N status using petioles and leaves, and the whole canopy N uptake generally favored the VNIR region.
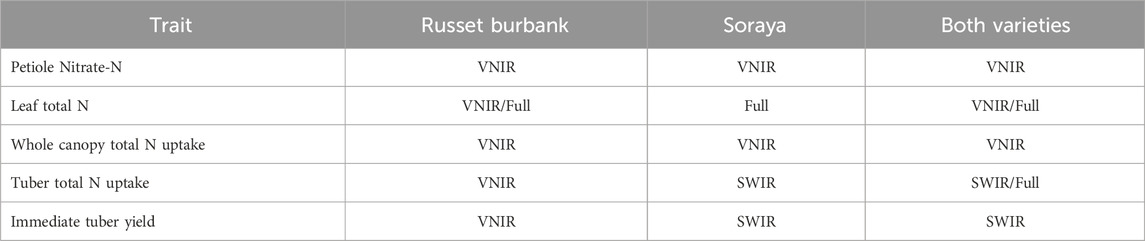
Table 5. The best performing spectral region for predicting in-season traits of each variety and the two varieties combined across the 2 years. Performance was evaluated by the highest coefficient of determination (R2) and the lowest Normalized Root Mean Square Error (NRMSE). For those cells with two results (e.g., visible and near-infrared (VNIR)/Full or shortwave infrared (SWIR)/Full), it meant that the two regions generated similar R2 and NRMSE.
Similar to in-season predictions, evaluation statistics were often similar between models predicting the at-harvest traits using different spectral regions (Table 6). Models predicting fertilizer N recovery mostly showed better performances using only the VNIR region, while those predicting tuber marketable yield were less consistently impacted by spectral regions, for both single-date and multi-stage models. Notably, the SWIR region at the late tuber bulking stage produced the best prediction results for all the three at-harvest traits. For multi-stage models, using the full spectrum always produced the best prediction results.
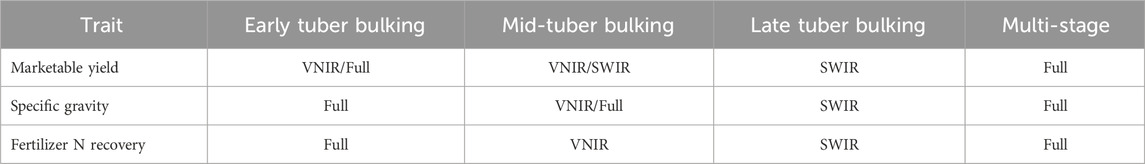
Table 6. The best performing spectral region for predicting at-harvest traits of Russet Burbank using the single-date imagery or all images across growth stages in the 2 years. Performance was evaluated by the highest coefficient of determination (R2) and the lowest Normalized Root Mean Square Error (NRMSE). For those cells with two results (e.g., visible and near-infrared (VNIR)/Full or shortwave infrared (SWIR)/Full), it meant that the two regions generated similar R2 and NRMSE.
4 Discussion
4.1 PLSR models provided accurate predictions for in-season traits about potato plant growth
For the predicted indicators to assess crop N status (petiole nitrate-N and leaf total N), higher N rates consistently resulted in higher crop N status indicators. Predictive models built from petiole nitrate-N showed moderate R2 and NRMSE (Figure 2). Although petioles are the primary plant parts that transport inorganic N in the form of nitrate within the plants, and nitrate-N levels are the most common indicators to guide potato farmers’ in-season N fertilization decisions (Colquhoun, et al., 2020; Zebarth and Rosen, 2007), agronomic studies often see high levels of variability in petiole nitrate-N levels under varied N treatments, as they can be influenced by many factors such as time of tissue collection during the day, cloud cover, and temperature (Liu, et al., 2021; Wang, et al., 2022). In contrast, total N content in the leaves does not exhibit this high variability, and, as well, foliage (in contrast to petioles) is directly observed by the sensor. With a higher number of field measurements, the variability in petiole nitrate-N might be reduced, possibly resulting in stronger predictions. While additional research is needed to further refine the understanding of the relationship between plant tissue types and the spectral data collected from them, the results of this study suggest that whole leaf total N (directly observed) are better than petiole nitrate-N for monitoring and predicting potato N status, and should be used instead of petiole nitrate-N to inform in-season N fertilization if remote sensing technologies are applied (Liu, et al., 2021).
Predictive models of in-season N uptake by both aboveground canopies and belowground tubers of each and both varieties had moderately good performance with R2 values between 0.43 and 0.64 (Figure 2). Tuber initiation leads to a sharp increase of N absorbed and utilized by the plants, and tuber bulking signals a transition for potato plants to rapidly partition N and energy from the aboveground canopy to the belowground tubers (Alva et al., 2002; Lauer, 1985; Millard et al., 1989; Zebarth and Rosen, 2007). Typically, 70%–85% of the N in the plants is present in the tubers, although as much as 40% of plant N can be present in potato vines (Zebarth, et al., 2004). Our results suggest that hyperspectral remote sensing of the foliage could be moderately effective in estimating potato N uptake both aboveground and belowground. Notably, predictions of tuber N uptake were slightly better (with higher R2) than those of the whole canopy N uptake (Figure 2). This capability likely results from a tight linkage between aboveground N (detected in imagery from leaves) and N availability belowground to tubers (which is not directly imaged). This correspondence can be seen in the standardized PLSR coefficients for whole canopy total N (Figure 4, third row) and fertilizer N recovery % (Figure 5, third row), which are comparable and show higher coefficients in similar wavelength ranges.
In addition, in-season immediate tuber yield predictions had favorable evaluation statistics. Photosynthetic activity is one of the major factors affecting tuber growth, and spectral reflectance data can reflect photosynthetic activity well (Gitelson and Merzlyak, 1996; Gitelson and Merzlyak, 1998; Patane and Vibhute, 2014). Besides, plant vigor is generally highly correlated with crop yield and is reflected well in hyperspectral images due to high reflectance of starch, cellulose, lignin, and nonstructural carbohydrates in the near-infrared and shortwave infrared regions (Curran, 1989; Liu et al., 2021). These factors may contribute to the good real-time prediction for the immediate tuber productivity using the hyperspectral signatures of the foliage. Note that standardized PLSR coefficients for intermediate yield and nitrogen-related traits track closely (Figure 4), further supporting the interpretation that the ability to predict yield depends on the ability to characterize factors related to photosynthesis, such as plant N.
4.2 In-season spectral signatures and cross-year/cross-variety validation
Models predicting end-of-season marketable yield performed well (R2 = 0.77–0.78). Final marketable yield could be well predicted as early as the beginning stage of tuber bulking (R2 = 0.77, NRMSE = 0.2), and the good prediction results could be found throughout the mid- and late tuber bulking periods, showing that higher N rates could produce higher marketable yields (Figure 3). Accurate prediction of marketable yield from in-season imagery over the course of the growing season is greatly valuable to potato farmers as it could inform economic and management decision-making for producing sellable agricultural products, support sustainable practices that underscore efficient N fertilizer use, and reduce impact of crop production on the environment and the groundwater quality (Chang, et al., 2023; Luczaj and Masarik, 2015).
Models predicting at-harvest specific gravity showed good evaluation statistics as well (Figure 3). As a major indicator of potato crop quality, predictions of end-of-season specific gravity complement the good marketable yield predictions, allowing for farmers to further estimate the final value of their crops before the end of the season so they can adjust their harvest time and practices to ensure the optimal conditions for maximum crop profitability. The models derived from late-season imagery did not perform as well as those derived from early and mid-season imagery (R2 = 0.61 compared to 0.74 and 0.68). Tuber starch accumulation, a quality parameter that tuber specific gravity indicates, tends to level off during the later part of the growing season than in the early or middle of the season, when tuber bulking occurs at an exponential rate (Zebarth and Rosen, 2007). This may result in a relatively weaker late-season prediction for specific gravity of the tubers.
Fertilizer N recovery is the ratio of total amount of N that leaves a cropping system through the harvested tubers to total seasonal applied fertilizer N. The N that was not recovered by tubers at harvest will be lost to the groundwater via nitrate leaching, to the atmosphere via denitrification, and to terrestrial and aquatic systems through wet or dry deposition, all of which could cause environmental concerns (Zebarth and Rosen, 2007). Compared to the better performance of models predicting the in-season tuber N uptake (Figure 2), evaluation statistics for models predicting fertilizer N recovery at the end of the season were relatively weak (R2 < 0.4, Figure 3). This could suggest that unlike for other potato traits, hyperspectral remote sensing might not have the capacity to predict a trait that needed to be calculated compared to a trait that could be directly measured.
For cross-variety testing, our study showed that models calibrated with Soraya, a Dutch variety bred to be a highly efficient N user, could be moderately tested on Russet Burbank, the No.1 variety developed and grown in the U.S. for over 100 years that is values for its frozen fry processing quality but requires high nutrient and water inputs. Our findings suggest that the new elite potato varieties possess similar in-season traits as the traditional ones, but otherwise they harbor some unique characteristics such as the high N use efficiency and low need of fertilizer inputs, which could make them more sustainable to grow. There is ongoing research to replace Russet Burbank in the U.S., and varieties such as Soraya from other germplasms could provide good genetic resources to facilitate that effort. This indicates that the development of new varieties bred for different characteristics will be best predicted from hyperspectral imagery using models that explicitly include those varieties in the training data.
For cross-year testing using Russet Burbank, we did not achieve satisfying results to predict the at-harvest traits from the single-date models, but the multi-stage models to predict marketable tuber yield produced relatively strong results. This finding demonstrates that there are systematic differences in plant growth caused by different temperature and precipitation conditions in each season (Supplemental Figure 1), or in the hyperspectral images collected at different growth stages of each year. These differences may not be accounted for in the single-stage or single-season models to predict specific gravity and fertilizer recovery %. However for marketable tuber yield, if we combined images over all three growth stages (early, mid-, and late tuber bulking) that covered the growing condition range throughout the season, it could generate moderate testing results between the 2 years. In conjunction with the cross-variety results, this result points to the need to develop training data sets that cover the reasonable variation that would be expected across varieties, growth stages and years.
4.3 The optimal spectral region for making predictive models varied
The PLSR coefficients were similar to those observed in Liu et al. (2021) for petiole nitrate-N, whole leaf total N, and yield at harvest. Positions of the most important wavelengths in predicting the in-season traits were consistently found in the visible and red-edge region (530–630 nm and 680–780 nm) that is highly associated with chlorophyll absorption and canopy greenness, the near-infrared region (900–1,200 nm) that is directly related with the canopy structure and overall vegetation health (Brewer, et al., 2022; Croft, et al., 2020), and at the beginning (1,500–1,600 nm) and the end of the shortwave infrared region (2,300–2,450 nm) that are related to plant starch, cellulose and protein content (Fathi, 2022). Although the positions of the most importance wavelengths stayed within the same ranges over the spectrum between the two varieties (Figure 4), specific wavelengths were typically differed between Russet Burbank and Soraya, noting that all the in-season traits measured in this study were related to plant N status and N uptake. This finding again suggests that although the foliar hyperspectral signatures generally showed similar relationships with plants’ biophysical and biochemical characteristics, some wavelengths were still variety-specific, caused by the unique N use efficiency and partitioning between aboveground and underground N of that variety.
When comparing models built from the VNIR region alone, the SWIR region alone, or the full spectrum, the best spectral regions that generated the highest R2 and lowest NRMSE were trait- and variety-specific, again pointing to differences in plant spectral and nutrient usage characteristics resulting from genetic differences. Models predicting the aboveground traits (N status and whole canopy N uptake, Table 5) consistently performed better when the VNIR region was used. Specifically for whole leaf total N prediction, when using the full spectrum to build models, the contribution from SWIR wavelengths seemed to be suppressed so that using the full spectrum and only using the VNIR generated the same model evaluation statistics, possibly due to very small variations in the SWIR reflectance among different N treatments (Liu, et al., 2021). For belowground traits (tuber N uptake and immediate tuber yield, Table 5), the best regions are highly variable between different varieties/combination of varieties. The VNIR region contains wavelengths where plant spectral signatures are impacted by chlorophyll activity, likely leading to the observed effects of VNIR on the photosynthetic aboveground tissues than on the belowground traits. In comparison, the ubiquitous preference of the SWIR region by Soraya models to predict the belowground traits (Table 5) may be influenced by its high N-use efficiency and special characteristics to partition N between the canopy and the tubers (D. Maum, personal communication, 10 January 2020), as the SWIR wavelengths have important features related to plant nutrient uptake and overall plant physiology (Gold, et al., 2020).
Table 6 clearly shows that during the early and mid-tuber bulking phases, the best regions to predict traits at harvest mostly included the VNIR part of the spectrum, related to vegetation greenness and vigor, but they switched to the SWIR region during the late tuber bulking phase, more related to foliar nutrition and foliar chemical content. Results from our PLSR models using the late tuber bulking images indicated the importance of the SWIR region to predict potato traits at harvest. It has been reported that SWIR wavelengths are related to crop dry matter content. During the latter part of the growing season, potato dry matter content accumulation plateaus and is maximized, while the aboveground canopy is senescing and wilting (Zebarth and Rosen, 2007), and therefore the utility of VNIR data that’s related to chlorophyll and canopy structure would be substantially reduced, and the SWIR-only model became the best option for predicting potato traits using late-growth-stage imagery. As well, information from the SWIR region may be more strongly related to nitrogen absorption features associated with proteins (Berger, et al., 2020), despite of confounding effects from chlorophyll and canopy vigor. When making predictions on data that include aerial images across different growth stages of the crop, using the whole spectrum including both the VNIR and SWIR regions may result in more robust predictive results (Table 6), as the relationships between plants’ spectral reflectance and their biophysical and biochemical properties changed over the course of the growing season.
4.4 What can we learn from this study?
Optimally managing nitrogen for potato production is extremely challenging. The amount of N the crop needs and the available amount in the soil change throughout the growing season. Ideally, N should be added as it is needed, matching nutrient supply with crop demand. Unfortunately, growers cannot currently make real-time nitrogen budgets and calculate the ideal amount of N to add at any certain time. Instead, they use guidelines developed through research and past experiences for fertilization scheduling. The most commonly adopted method in the U.S. is petiole nitrate-N testing, and the measurements are typically made every 5–10 days. Petiole nitrate-N suffers from high variability, high labor costs and long turnaround testing time (typically 3 days). The present study shows that by using narrow-band hyperspectral imagery collected at different potato growth stages, it is possible to develop relatively robust PLSR models with higher R2 and low NRMSE values for the most popular potato variety (Russet Burbank) in the U.S. and a new variety (Soraya) from Europe. The prediction results could help farmers to gain a real-time picture of their crop N status and yield forecasting, so that better N fertilization decisions can be made, unnecessary N use can be reduced, and the associated groundwater contamination may eventually be mitigated. To further refine this approach, additional spectral and field measurement data gathered from different locations and years, potato varieties, and production practices should be used for training and testing. It will create more robust models, capture further nuance behind variations in the relationship between spectra and crop biophysical and biochemical traits, and generate more finely tuned precision resource management tools.
5 Conclusion
This study utilized the partial least squares regression (PLSR) analysis of full-spectrum hyperspectral data (including VNIR and SWIR) from aerial imagery to predict in-season potato growth and N status as well as at-harvest yield and quality of two potato varieties over two growing seasons. The results revealed that some traits such as leaf total N content and immediate tuber yield during the season, and marketable yield and specific gravity at harvest could be well predicted, suggesting that this method could be used to inform N fertilization decisions based on crop growth and productivity forecasting. The study also found that the best spectral regions to predict potato traits at harvest could change as the field season progresses, since the relationships between plant physiological characteristics and their spectral signatures were changing at different growth stages. This study illustrates the potential for this approach (PLSR + hyperspectral imaging) to be used with future datasets to improve crop input efficiency and environmental stewardship in agricultural cropping systems.
Data availability statement
The original contributions presented in the study are included in the article/Supplementary Material, further inquiries can be directed to the corresponding author.
Author contributions
TC: Data curation, Formal Analysis, Investigation, Validation, Writing–original draft, Writing–review and editing. PT: Conceptualization, Funding acquisition, Methodology, Project administration, Writing–review and editing. PR: Methodology, Writing–original draft. BH: Data curation, Investigation, Resources, Writing–original draft. WH: Data curation, Investigation, Resources, Writing–original draft. YW: Conceptualization, Funding acquisition, Methodology, Project administration, Supervision, Writing–review and editing.
Funding
The author(s) declare that financial support was received for the research, authorship, and/or publication of this article. Have filled out in previous submissions. Support for this research was provided by funding from the Wisconsin Potato and Vegetable Growers Association, Wisconsin Potato Industry Board and USDA NIFA award 2020-6801-30866 to YW and PT. Additional support was provided by USDA Hatch awards WIS03089 and WIS01874 to PT. PR and WH were supported by NSF ASCEND Biology Integration Institute (BII) award DBI 2021898.
Acknowledgments
Thank you to Guolong Liang, Alfadhl Alkhaled, Ophelia Tsai, Taqdeer Gill, Paul Sytsma and the UW HARS field crew for assistance with field management, N application, and field data collection, to Kyle Kovach for assistance with model development, and to the UW Soil and Forage Lab for plant tissue processing and analysis.
Conflict of interest
The authors declare that the research was conducted in the absence of any commercial or financial relationships that could be construed as a potential conflict of interest.
Publisher’s note
All claims expressed in this article are solely those of the authors and do not necessarily represent those of their affiliated organizations, or those of the publisher, the editors and the reviewers. Any product that may be evaluated in this article, or claim that may be made by its manufacturer, is not guaranteed or endorsed by the publisher.
Supplementary material
The Supplementary Material for this article can be found online at: https://www.frontiersin.org/articles/10.3389/frsen.2025.1484582/full#supplementary-material
SUPPLEMENTARY FIGURE S1 | Daily max (red dotted line), average (green dotted line), and min (purple dotted line) temperature, as well as precipitation amount (blue bars) during the growing season of 2020 (A) and 2021 (B).
SUPPLEMENTARY FIGURE S2 | Mapped predictions of in-season whole leaf nitrogen (in % dry weight).
SUPPLEMENTARY FIGURE S3 | Mapped predictions of end-of-season marketable yield (in Mg ha-1) from late tuber bulking stage imagery.
References
Abdelbaki, A., Schlerf, M., Retzlaff, R., Machwitz, M., Verrelst, J., and Udelhoven, T. (2021). Comparison of crop trait retrieval strategies using UAV-based VNIR hyperspectral imaging. Remote Sens. 13 (9), 1748. doi:10.3390/rs13091748
Ali, A. M. (2020). Using hand-held chlorophyll meters and canopy reflectance sensors for fertilizer nitrogen management in cereals in small farms in developing countries. Sensors 20 (4), 1127. doi:10.3390/s20041127
Ali, A. M., Ibrahim, S. M., and Bijay-Singh, (2020). Wheat grain yield and nitrogen uptake prediction using atLeaf and GreenSeeker portable optical sensors at jointing growth stage. Inf. Process. Agric. 7 (3), 375–383. doi:10.1016/j.inpa.2019.09.008
Alkhaled, A., Townsend, P. A., and Wang, Y. (2023). Remote sensing for monitoring potato nitrogen status. Am. J. Potato Res. 100, 1–14. doi:10.1007/s12230-022-09898-9
Alva, A. K., Hodges, T., Boydston, R. A., and Collins, H. P. (2002). Dry matter and nitrogen accumulations and partitioning in two potato cultivars. J. Plant Nutr. 25 (8), 1621–1630. doi:10.1081/pln-120006047
Asner, G. P., Martin, R. E., Anderson, C. B., and Knapp, D. E. (2015). Quantifying forest canopy traits: imaging spectroscopy versus field survey. Remote Sens. Environ. 158, 15–27. doi:10.1016/j.rse.2014.11.011
Atzberger, C. (2013). Advances in remote sensing of agriculture: context description, existing operational monitoring systems and major information needs. Remote Sens. 5 (2), 949–981. doi:10.3390/rs5020949
Berger, K., Verrelst, J., Feret, J. B., Wang, Z., Wocher, M., Strathmann, M., et al. (2020). Crop nitrogen monitoring: recent progress and principal developments in the context of imaging spectroscopy missions. Remote Sens. Environ. 242, 111758. doi:10.1016/j.rse.2020.111758
Bethke, P. C., Nassar, A. M. K., Kubow, S., Leclere, Y. N., Li, X., Haroon, M., et al. (2014). History and origin of Russet Burbank (netted gem) a sport of Burbank. Am. J. Potato Res. 91, 594–609. doi:10.1007/s12230-014-9397-5
Brewer, K., Clulow, A., Sibanda, M., Gokool, S., Naiken, V., and Mabhaudhi, T. (2022). Predicting the chlorophyll content of maize over phenotyping as a proxy for crop health in smallholder farming systems. Remote Sens. 14 (3), 518. doi:10.3390/rs14030518
Cai, Y., Guan, K., Nafziger, E., Chowdhary, G., Peng, B., Jin, Z., et al. (2019). Detecting in-season crop nitrogen stress of corn for field trials using UAV-and CubeSat-based multispectral sensing. IEEE J. Sel. Top. Appl. Earth Observations Remote Sens. 12 (12), 5153–5166. doi:10.1109/jstars.2019.2953489
Chang, Y., Latham, J., Licht, M., and Wang, L. (2023). A data-driven crop model for maize yield prediction. Commun. Biol. 6, 439. doi:10.1038/s42003-023-04833-y
Cohen, Y., Alchanatis, V., Zusman, Y., Dar, Z., Bonfil, D. J., Karnieli, A., et al. (2010). Leaf nitrogen estimation in potato based on spectral data and on simulated bands of the VENμS satellite. Precis. Agric. 11 (5), 520–537. doi:10.1007/s11119-009-9147-8
Colquhoun, J. B., Chapman, S. A., Gevens, A. J., Groves, R. L., Heider, D. J., Jensen, B. M., et al. (2020). Commercial vegetable Production in Wisconsin 2020. Madison extension publication A3422.
Croft, H., Arabian, J., Chen, J. M., Shang, J., and Liu, J. (2020). Mapping within-field leaf chlorophyll content in agricultural crops for nitrogen management using Landsat-8 imagery. Precis. Agric. 21, 856–880. doi:10.1007/s11119-019-09698-y
Curran, P. J. (1989). Remote sensing of foliar chemistry. Remote Sens. Environ. 30 (3), 271–278. doi:10.1016/0034-4257(89)90069-2
Delloye, C., Weiss, M., and Defourny, P. (2018). Retrieval of the canopy chlorophyll content from Sentinel-2 spectral bands to estimate nitrogen uptake in intensive winter wheat cropping systems. Remote Sens. Environ. 216, 245–261. doi:10.1016/j.rse.2018.06.037
Epstein, E., and Grant, W. J. (1973). Water stress relations of the potato plant under field conditions. Agron. J. 65 (3), 400–404. doi:10.2134/agronj1973.00021962006500030015x
Evans, J. R. (1989). Photosynthesis and nitrogen relationships in leaves of C3 plants. Oecologia 78 (1), 9–19. doi:10.1007/bf00377192
Fathi, A. (2022). Role of nitrogen (N) in plant growth, photosynthesis pigments, and N use efficiency: a review. Agrisost 28, 1–8. doi:10.5281/zenodo.7143588
Feilhauer, H., Asner, G. P., Martin, R. E., and Schmidtlein, S. (2010). Brightness-normalized partial least squares regression for hyperspectral data. J. Quant. Spectrosc. Radiat. Transf. 111, 1947–1957. doi:10.1016/j.jqsrt.2010.03.007
Gal, C., Frenzel, W., and Möller, J. (2004). Re-examination of the cadmium reduction method and optimisation of conditions for the determination of nitrate by flow injection analysis. Microchim. Acta, 146(2), 155–164. doi:10.1007/s00604-004-0193-7
Garthwaite, P. H. (1994). An interpretation of partial least squares. J. Am. Stat. Assoc. 89 (425), 122–127. doi:10.2307/2291207
Gitelson, A. A., and Merzlyak, M. N. (1996). Signature analysis of leaf reflectance spectra: algorithm development for remote sensing of chlorophyll. J. Plant Physiology 148 (3–4), 494–500. doi:10.1016/s0176-1617(96)80284-7
Gitelson, A. A., and Merzlyak, M. N. (1998). Remote sensing of chlorophyll concentration in higher plant leaves. Adv. Space Res. 22 (5), 689–692. doi:10.1016/s0273-1177(97)01133-2
Gold, K. M., Townsend, P. A., Chlus, A., Herrmann, I., Couture, J. J., Larson, E. R., et al. (2020). Hyperspectral measurements enable pre-symptomatic detection and differentiation of contrasting physiological effects of late blight and early blight in potato. Remote Sens. 12, 286. doi:10.3390/rs12020286
Grossman, Y. L., Ustin, S. L., Jacquemoud, S., Sanderson, E. W., Schmuck, G., and Verdebout, J. (1996). Critique of stepwise multiple linear regression for the extraction of leaf biochemistry information from leaf reflectance data. Remote Sens. Environ. 56 (3), 182–193. doi:10.1016/0034-4257(95)00235-9
Haenlein, M., and Kaplan, A. M. (2004). A beginner’s guide to partial least squares analysis. Underst. Stat. 3 (4), 283–297. doi:10.1207/s15328031us0304_4
Hijmans, R. J. (2001). Global distribution of the potato crop. Am. J. Potato Res. 78 (6), 403–412. doi:10.1007/bf02896371
Jain, N., Ray, S. S., Singh, J. P., and Panigrahy, S. (2007). Use of hyperspectral data to assess the effects of different nitrogen applications on a potato crop. Precis. Agric. 8 (4), 225–239. doi:10.1007/s11119-007-9042-0
Jones, C. R., Michaels, T. E., Schmitz Carley, C., Rosen, C. J., and Shannon, L. M. (2021). Nitrogen uptake and utilization in advanced fresh-market red potato breeding lines. Crop Sci. 61 (2), 878–895. doi:10.1002/csc2.20297
King, B., Stark, J., and Neibling, H. (2020). “Potato irrigation management,” in Potato Production Systems. Editor J. Stark, M. Thornton, and P. Phillip (Cham: Springer), 417–446.
Kleinkopf, G. E., Westermann, D. T., Wille, M. J., and Kleinschmidt, G. D. (1987). Specific gravity of Russet Burbank potatoes. Am. Potato J. 64 (11), 579–587. doi:10.1007/bf02853760
Kraft, G. J., and Stites, W. (2003). Nitrate impacts on groundwater from irrigated-vegetable systems in a humid north-central US sand plain. Agric. Ecosyst. and Environ. 100 (1), 63–74. doi:10.1016/s0167-8809(03)00172-5
Kraft, G. J., Stites, W., and Mechenich, D. J. (1999). Impacts of irrigated vegetable agriculture on a humid north-central US sand plain aquifer. Groundwater 37 (4), 572–580. doi:10.1111/j.1745-6584.1999.tb01144.x
Lauer, D. A. (1985). Nitrogen uptake patterns of potatoes with high-frequency sprinkler-applied N fertilizer 1. Agron. J. 77 (2), 193–197. doi:10.2134/agronj1985.00021962007700020005x
Leghari, S. J., Wahocho, N. A., Laghari, G. M., HafeezLaghari, A., MustafaBhabhan, G., HussainTalpur, K., et al. (2016). Role of nitrogen for plant growth and development: a review. Adv. Environ. Biol. 10 (9), 209–219.
Li, B., Xu, X., Zhang, L., Han, J., Bian, C., Li, G., et al. (2020). Above-ground biomass estimation and yield prediction in potato by using UAV-based RGB and hyperspectral imaging. ISPRS J. Photogrammetry Remote Sens. 162, 161–172. doi:10.1016/j.isprsjprs.2020.02.013
Li, S., Ding, X., Kuang, Q., Ata-Ui-Karim, S. T., Cheng, T., Liu, X., et al. (2018). Potential of UAV-based active sensing for monitoring rice leaf nitrogen status. Front. Plant Sci. 9, 1834. doi:10.3389/fpls.2018.01834
Liu, N., Townsend, P. A., Naber, M. R., Bethke, P. C., Hills, W. B., and Wang, Y. (2021). Hyperspectral imagery to monitor crop nutrient status within and across growing seasons. Remote Sens. Environ. 255, 112303. doi:10.1016/j.rse.2021.112303
Luczaj, J., and Masarik, K. (2015). Groundwater quantity and quality issues in a water-rich region: examples from Wisconsin, USA. Resources 4 (2), 323–357. doi:10.3390/resources4020323
MacKown, C. T., and Weik, J. P. (2004). Comparison of laboratory and quick-test methods for forage nitrate forage nitrate. Crop Sci., 44(1), 218–226. doi:10.2135/cropsci2004.2180b
Martin, M. E., and Aber, J. D. (1997). High spectral resolution remote sensing of forest canopy lignin, nitrogen, and ecosystem processes. Ecol. Appl. 7, 431–443. doi:10.1890/1051-0761(1997)007[0431:hsrrso]2.0.co;2
Millard, P., Robinson, D., and Mackie-Dawson, L. A. (1989). Nitrogen partitioning within the potato (solarium tuberosum L) plant in relation to nitrogen supply. Ann. Bot. 63 (2), 289–296. doi:10.1093/oxfordjournals.aob.a087744
Morier, T., Cambouris, A. N., and Chokmani, K. (2015). In-season nitrogen status assessment and yield estimation using hyperspectral vegetation indices in a potato crop. Agron. J. 107 (4), 1295–1309. doi:10.2134/agronj14.0402
Muleta, H. D., and Aga, M. C. (2019). Role of nitrogen on potato production: a review. J. Plant Sci. 7 (2), 36–42. doi:10.11648/j.jps.20190702.11
Muñoz-Huerta, R. F., Guevara-Gonzalez, R. G., Contreras-Medina, L. M., Torres-Pacheco, I., Prado-Olivarez, J., and Ocampo-Velazquez, R. V. (2013). A review of methods for sensing the nitrogen status in plants: advantages, disadvantages and recent advances. Sensors 13 (8), 10823–10843. doi:10.3390/s130810823
Nguyen, H. T., and Lee, B. W. (2006). Assessment of rice leaf growth and nitrogen status by hyperspectral canopy reflectance and partial least square regression. Eur. J. Agron. 24 (4), 349–356. doi:10.1016/j.eja.2006.01.001
Patane, P., and Vibhute, A. (2014). Chlorophyll and nitrogen estimation techniques: a Review. Int. J. Eng. Res. Rev. 2 (4), 33–41.
Pinter Jr, P. J., Hatfield, J. L., Schepers, J. S., Barnes, E. M., Moran, M. S., Daughtry, C. S., et al. (2003). Remote sensing for crop management. Photogrammetric Eng. and Remote Sens. 69 (6), 647–664. doi:10.14358/pers.69.6.647
Prikaziuk, E., Ntakos, G., ten Den, T., Reidsma, P., van der Wal, T., and van der Tol, C. (2022). Using the SCOPE model for potato growth, productivity and yield monitoring under different levels of nitrogen fertilization. Int. J. Appl. Earth Observation Geoinformation 114, 102997. doi:10.1016/j.jag.2022.102997
Queally, N., Ye, Z., Zheng, T., Chlus, A., Schneider, F., Pavlick, R. P., et al. (2022). FlexBRDF: a flexible brdf correction for grouped processing of airborne imaging spectroscopy flightlines. J. Geophys. Res. Biogeosciences 127 (1), e2021JG006622. doi:10.1029/2021jg006622
R Core Team (2019). R: a language and environment for statistical computing. Available at: http://www.r-project.org/.
Reis, Jr, R. dos, A., and Monnerat, P. H. (2000). Nutrient concentrations in potato stem, petiole and leaflet in response to potassium fertilizer. Sci. Agric. 57, 251–255. doi:10.1590/s0103-90162000000200009
Richter, R., and Schläpfer, D. (2010). Geo-atmospheric processing of airborne imaging spectrometry data. Part 2: atmospheric/topographic correction. Int. J. Remote Sens. 23 (13), 2631–2649. doi:10.1080/01431160110115834
Rosen, C. J., and Bierman, P. M. (2008). Best management practices for nitrogen use: irrigated potatoes.
Schafer, R. (2011). What is a Savitzky-Golay filter? [lecture notes]. IEEE Signal Process. Mag. 28, 111–117. doi:10.1109/msp.2011.941097
Schläpfer, D., and Richter, R. (2010). Geo-atmospheric processing of airborne imaging spectrometry data. Part 1: parametric orthorectification. Int. J. Remote Sens. 23 (13), 2609–2630. doi:10.1080/01431160110115825
Schlemmer, M., Gitelson, A., Schepers, J., Ferguson, R., Peng, Y., Shanahan, J., et al. (2013). Remote estimation of nitrogen and chlorophyll contents in maize at leaf and canopy levels. Int. J. Appl. Earth Observation Geoinformation 25, 47–54. doi:10.1016/j.jag.2013.04.003
Shukla, A., and Kot, R. (2016). An overview of hyperspectral remote sensing and its applications in various disciplines. IRA-International J. Appl. Sci. 5 (2), 85–90. doi:10.21013/jas.v5.n2.p4
Singh, A., Serbin, S. P., McNeil, B. E., Kingdon, C. C., and Townsend, P. A. (2015). Imaging spectroscopy algorithms for mapping canopy foliar chemical and morphological traits and their uncertainties. Ecol. Appl. 25 (8), 2180–2197. doi:10.1890/14-2098.1
Singh, B., Singh, V., Singh, Y., Kumar, A., Sharma, S., Thind, H. S., et al. (2018). Site-specific fertilizer nitrogen management in irrigated wheat using chlorophyll meter (SPAD meter) in the north-western India. J. Indian Soc. Soil Sci. 66 (1), 53–65. doi:10.5958/0974-0228.2018.00006.3
Stark, J. C., and Love, S. L. (2003). Potato production systems. Boise, ID: University of Idaho Agricultural Communications.
Tsagris, M., and Pandis, N. (2021). Multicollinearity. Am. J. Orthod. Dentofac. Orthop. 159 (5), 695–696. doi:10.1016/j.ajodo.2021.02.005
Vos, J. (1999). Split nitrogen application in potato: effects on accumulation of nitrogen and dry matter in the crop and on the soil nitrogen budget. J. Agric. Sci. 133 (3), 263–274. doi:10.1017/s0021859699006966
Vos, J. (2009). Nitrogen responses and nitrogen management in potato. Potato Res. 52, 305–317. doi:10.1007/s11540-009-9145-2
Wang, Y., Naber, M., Crosby, T., and Liang, G. (2022). Evaluating multiple diagnostic tools for monitoring in-season nitrogen status of chipping potatoes in the Upper Midwest of the USA. Potato Res. 65, 31–50. doi:10.1007/s11540-021-09507-y
Wang, Z., Chlus, A., Geygan, R., Ye, Z., Zheng, T., Singh, A., et al. (2020). Foliar functional traits from imaging spectroscopy across biomes in eastern North America. New Phytol. 228 (2), 494–511. doi:10.1111/nph.16711
Wold, S., Ruhe, A., Wold, H., and Dunn, W. J. (1984). The collinearity problem in linear regression. The partial least squares (PLS) approach to generalized inverses. SIAM J. Sci. Stat. Comput. 5 (3), 735–743. doi:10.1137/0905052
Zebarth, B. J., Leclerc, Y., and Moreau, G. (2004). Rate and timing of nitrogen fertilization of Russet Burbank potato: nitrogen use efficiency. Can. J. Plant Sci. 84, 845–854. doi:10.4141/p03-131
Zebarth, B. J., and Rosen, C. J. (2007). Research perspective on nitrogen BMP development for potato. Am. J. Potato Res. 84 (1), 3–18. doi:10.1007/bf02986294
Keywords: hyperspectral image, modeling, nitrogen, partial least squares regression, potato, quality, yield
Citation: Crosby T, Townsend PA, Ravindran P, Heberlein BC, Hills WB and Wang Y (2025) What can we learn from a multi-season-stage-variety potato (Solanum tuberosum L.) study using aerial hyperspectral imagery?. Front. Remote Sens. 6:1484582. doi: 10.3389/frsen.2025.1484582
Received: 22 August 2024; Accepted: 28 January 2025;
Published: 19 February 2025.
Edited by:
Liangxiu Han, Manchester Metropolitan University, United KingdomReviewed by:
Bee Khim Chim, University of Maine, United StatesAyush Sharma, University of Florida, United States
Copyright © 2025 Crosby, Townsend, Ravindran, Heberlein, Hills and Wang. This is an open-access article distributed under the terms of the Creative Commons Attribution License (CC BY). The use, distribution or reproduction in other forums is permitted, provided the original author(s) and the copyright owner(s) are credited and that the original publication in this journal is cited, in accordance with accepted academic practice. No use, distribution or reproduction is permitted which does not comply with these terms.
*Correspondence: Yi Wang, V2FuZzUyQHdpc2MuZWR1