 Birutė Ruzgienė1
 Dainora Jankauskienė
 Sérgio Lousada
95% of researchers rate our articles as excellent or good
Learn more about the work of our research integrity team to safeguard the quality of each article we publish.
Find out more
ORIGINAL RESEARCH article
Front. Remote Sens. , 06 February 2025
Sec. Lidar Sensing
Volume 6 - 2025 | https://doi.org/10.3389/frsen.2025.1397513
Nowadays, the development of Unmanned Aerial Vehicle in conjunction with Photogrammetry and LiDAR technologies, has revolutionized the collection of geospatial data. These technologies enable the acquisition of very high-resolution images and dense point clouds. They also allow the generation of aerial mapping products and simulations of geospatial data for territories that are difficult to access using traditional surveying methods. The paper deals with the use of kinematic remote sensing technique for the study of surface with extreme topography as is a near-vertical cliff named Olandian hat situated in the Seaside regional park on the Baltic sea coast of Lithuania. This area has been significantly eroded by the sea due to the climatic changes of the last few decades, which have caused substantial damage to the coastline. Quantitative measurements show that coastal erosion has led to a retreat of up to [X] meters over the last [Y] years. In order to preserve this unique cultural object, needs to keep an observation on a regular basis (as monitoring) for capture the real situation. Applying an appropriate way for generation of the reliable and accurate spatial models of surface with extreme topography, four data sets were processed: images gained with the camera, oriented horizontally; images gained with the camera tilted at about 50°; combining both image sets collected from camera; LiDAR data. Point clouds and orthophoto maps were generated. The evaluation of aerial mapping products showed that the best accuracy was achieved with products derived from the combined image sets, based on the metric of RMSE, with a mean RMSE of 0.048 m in X, Y, and Z directions. The spatial model generated from LiDAR data is more accurate in Z direction. Correct representation of DEM was not possible using only image data from camera horizontally oriented.
Nowadays, due to the latest developments regarding unmanned aerial vehicles (UAVs), which include their enhanced payload, operating time, and autonomous flight capacities, it has become possible to utilize them in several different applications (Cariou et al., 2023; Šiljeg et al., 2023; Li et al., 2019). Recently, the capabilities and performance of UAVs—commonly referred to as drones or remotely piloted aircrafts, depending on their operational procedures—have improved. For example, recent technological advancements have significantly increased UAV battery life, allowing for longer flight durations, and improved camera resolutions, enabling the capture of high-quality, detailed images from higher altitudes (Manfreda et al., 2018; Vélez et al., 2022). UAVs can operate either autonomously or follow a pre-established flight plan. Their main advantage lies in their capacity of obtaining data with very high levels of spatial resolution (Alvarez-Vanhard et al., 2021; Sozzi et al., 2021). Due to this particular feature, the majority of scientists favor the use of UAVs to assist them in interdisciplinary research (Delavarpour et al., 2021; Watts et al., 2012). Studies have demonstrated the significant utility of UAVs across multiple domains, such as agriculture (Sousa et al., 2022), environmental monitoring (Apaza et al., 2017), and infrastructure maintenance (Buggiani et al., 2023; Koganti et al., 2021; T. Li et al., 2019; Rodríguez-Molina et al., 2021). UAVs have several features that make them highly efficient in scenarios where swift and responsive collection of information across expansive areas is key: (a) their high mobility enables a wide range of maneuvers and facilitates access to areas that were previously inaccessible to humans or larger devices due to distance, positioning, or environmental conditions (Casalbore et al., 2022); (b) acquiring and employing these devices is usually cost-effective; (c) these devices are compact as they require minimal logistics for their relocation; (d) they are able to efficiently collect large amounts of information without significant time constraints, which means that they might end up being highly effective for handling big data (C. Li et al., 2022); (e) as a result of their capability for remote control or autonomous operation, they may undertake monotonous tasks independently, therefore eliminating the need for supervision (Shojaei et al., 2020). Notwithstanding the extensive use of UAVs across various sectors and the advantages that such use brings, there are specific areas where these devices lack the popularity that other types of hardware possess (Addabbo et al., 2018; Hartley et al., 2020; Pinton et al., 2023).
UAV is the effective platform flying at low altitude and can be used for taking images or scanning by Light Detection and Ranging (LiDAR) of territories where humans access is difficult and complicated for classical surveying (C. Li et al., 2022; Lin et al., 2019; Y. Liu et al., 2017; H. Wang et al., 2013; J. Wang et al., 2017; Woo et al., 2019). The technology of UAV-photogrammetry is related with photogrammetric data acquisition, processing, and generation of the aerial mapping products used in surveying and cartographic or GIS environment. UAV-photogrammetry is rapidly changing the classical methods used in geodesy and cadastral measurements, among others. Traditional geodesy methods, such as the use of total stations, GPS, and terrestrial laser scanning, typically require extensive fieldwork and are often limited by the terrain or difficult-to-reach locations. These methods are time-consuming and costly, particularly in areas with complex topography or hard-to-reach areas, such as cliffs or densely vegetated environments. In contrast, UAV-photogrammetry, coupled with LiDAR technology, allows for rapid data acquisition, reduces the need for extensive fieldwork, and provides high-resolution, accurate topographical models, even in challenging environments (Fan et al., 2023; Lee et al., 2009). This methodology not only saves time and cost but also enhances the quality and accuracy of the data collected, offering significant advantages over classical methods. The main advantages are as follows: the costs are not high and are decreasing, real-time collection of images is fast, it is possible to acquire images of the territories where relief is complicated or where it is not possible to reach the object, rapid processing of images, and the obtained cartographic products are accurate depending on customers’ requirements. A UAV with a mounted camera and flying at low distances above the ground is mostly advantageous for collecting images of linear objects (network of roads, seacoasts, etc.), cultural monuments, objects with extreme surface, etc. (Qiao et al., 2023; Ruzgienė et al., 2015; Zang et al., 2019).
These devices are used to gather information about land changes in the form of images, especially in small areas with significant alterations. Multirotor UAVs, in particular, offer the ability to monitor phenomena in specific areas due to their capacity to maintain a stable altitude and hover in a place for predefined durations (Qiao et al., 2023; Smaczyński et al., 2020). The study by Laporte-Fauret et al. (2019) demonstrates the use of low-cost UAVs for high-resolution, large-scale monitoring of coastal dunes, highlighting the efficiency and cost-effectiveness of these technologies for environmental mapping in challenging terrains (Laporte-Fauret et al., 2019). In our research, we address the challenge of generating thematic maps that illustrate official land use, including areas affected by human activity, such as pedestrian paths (Zang et al., 2019). Techniques for acquiring UAV data demand the creation of a digital elevation model (DEM) and a point cloud that derives from the captured images (Clapuyt et al., 2017; Colomina and Molina, 2014; Niedzielski, 2018).
The texture of the soil is one of its key physical properties, affecting its permeability, water retention, and fertility (Song et al., 2023). Mapping the spatial distribution of soil texture improves digital soil databases and provides crucial data for studies on the spatial distribution of soil properties (Swain et al., 2021). With the enhancement of UAV hyperspectral technology, it is now capable of delivering imagery with both high spatial and spectral resolution, which ultimately leads to more precise mapping outcomes in regard to soil texture content (Shahriari et al., 2019).
Photogrammetric requirements should be considered the basis for preparing the technical specification of aerial mapping projects and realization of workflow. Aerial mapping is one of the most advanced methods to obtain information about the surface of the Earth and other objects using images. The quality of images and mapping products mainly depends on the success of aerial photography missions, qualified guidance of photogrammetric works, and appropriate realization of aerial mapping requirements. A UAV mission has to be executed in good meteorological conditions—light wind (1, 6–3, 3 m/s) and minimal cloudiness. Aerial photography of the object on the seaside should preferably be realized in the spring before the storm season (preliminary in March) and/or in the autumn after the storm season (e.g., in November) (Neitzel and Klonowski, 2011).
Three-dimensional (3D) data have a high level of importance regarding autonomous driving, domestic robots, and remote sensing (Lan et al., 2023; Wu et al., 2019a). Different types of data—for example, point clouds, depth images, and polygon meshes—are part of the 3D data (Guo et al., 2021). Point clouds are generated by LiDAR, which enables supplying precise and useful information at 360°. Furthermore, LiDAR can maintain consistent functionality even in low-light environments. This occurs because its operations remain unaffected by variations in terms of light conditions (Gens, 2010; Sylvester and Macon, 2011; Wu et al., 2019b). In recent times, point clouds have been receiving much attention (Sousa et al., 2022), and multiple studies of onboard LiDAR for the detection of 3D objects were proposed. The main goal of the detection of 3D objects is to determine the position, dimensions, and category of the objects in the surrounding areas, which would ultimately allow the creation of a bounding box that would provide information regarding the object’s shape and heading angle (Qian et al., 2022; Szostak and Pająk, 2023). Additionally, regarding river geometry acquisition, LiDAR has become one of the most used sources, which enables a quick and precise 3D point cloud collection. It is capable of determining the distance to a given target by measuring the time between the moment when a sensor emits a pulse of laser and the moment when the target’s reflection of that same laser is detected (Awadallah et al., 2023; Lefsky et al., 2002). There are two different types of LiDAR sensors, depending on the wavelength: topographic LiDAR and bathymetric LiDAR. In regard to topographic LiDAR, it is associated with a laser wavelength of 1,064 nm; given that this laser cannot penetrate water bodies, topographic LiDAR is commonly used for topographic surface detection. In terms of bathymetric LiDAR, it is associated with a laser of 532 nm—a laser that is able to penetrate water bodies—which provides bottom detection. Therefore, bathymetric LiDAR is widely used in river studies that demand a higher mapping precision—for instance, environmental river studies (Juárez et al., 2019; Moniz et al., 2020; Saltveit et al., 2020), sediment transport studies (Mandlburger et al., 2015), or even flood modeling (Awadallah et al., 2022; Juárez et al., 2021).
LiDAR is useful when used for the creation of high-resolution digital surfaces (Alesheikh et al., 2007; Boak and Turner, 2005). Information generated from LiDAR data terrain and elevation models is applied for various applications (Liu et al., 2019). It is highly recommended for the correct monitoring of the evolution of land use depending on the climatic evolution (Nunes et al., 2020). Through innovations by leading LiDAR manufacturers to lower the costs and size of LiDAR models, everybody can now easily exploit a LiDAR system mounted onto a UAV as a 3D-mapping device. LiDAR offers significant savings over ground survey methods (Ackermann, 1999; García-Rubio et al., 2015; Kim et al., 2017; Y; Liu et al., 2017; Obu et al., 2017). By using the method of detecting distant objects such as leaves, shrubs, trees, and even grass, LiDAR can determine their position, velocity, and other characteristics by analyzing pulsed laser light reflected from an object’s surface (Aksamitauskas et al., 2016; Morsy et al., 2018; Pe’eri & Long, 2011; Xu et al., 2019).
The goal of this research is to identify the most effective sensor and technique for generating accurate aerial mapping products of surfaces with extreme topography. The “best sensor” and “best technique” are defined based on multiple factors, including accuracy (quantified through root mean square error (RMSE)), cost-efficiency, and processing time. The effectiveness of the sensor is assessed by its ability to capture high-resolution data under challenging terrain conditions, while the technique’s efficiency is evaluated based on the speed and accuracy of data processing (Kovanič et al., 2023; Telli et al., 2023).The specific focus of this study is on a parabolic dune hill created by aeolian processes, located on a moraine ridge within the Seaside Regional Park, which is classified as a preserved natural heritage site and a natural monument. This particular object presents significant topographical challenges, including steep cliffs and a constantly changing surface with protrusions, depressions, and downward-sloping patches of land. Therefore, this area is classified as a surface with extreme topography. In this context, extreme topography refers to surfaces characterized by steep gradients, sudden elevation changes, and irregular or uneven landforms such as folds, caves, and protrusions. These features create difficulties for traditional surveying methods, making the application of UAV-based photogrammetry and LiDAR particularly valuable. The methodology proposed in this research focuses on effectively capturing and modeling these complex and dynamic surfaces, ensuring the preservation of such unique and sensitive cultural and natural heritage sites.
The experimental area/test site, Dutchman’s Cap (named Olandian hat), is located on the Baltic Sea coast between the cities of Klaipėda and Palanga in the western part of Lithuania (Figure 1).
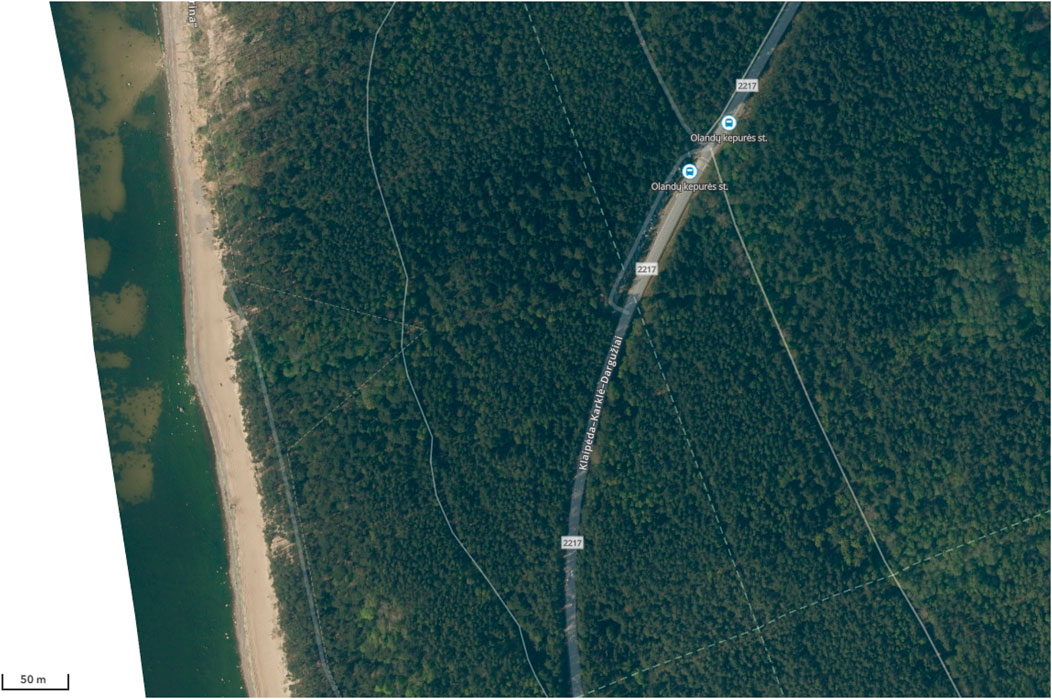
Figure 1. Overview map of the test area—Dutchman’s Cap: Baltic Sea coast, Lithuania. (source: ORT10 NZT, National Land Service under the Ministry of Environment).
The test site, Olandian hat, is the cut-slope surface, near-vertical cliff situated in the Seaside Regional Park on the Baltic Sea shore (Figure 2). Olandian hat is approximately 24 m high and is a parabolic dune drifted on a moraine crest. This place is intensely eroded, mainly by the sea and torrential rains. As a result of the damage to the base of the cliff, landslides are formed from the top of the Olandian hat due to gravity. This area, measuring approximately 2 km long (∼3 ha), was chosen advisably for the experimental study due to the unique challenges presented by the extreme topography. The site’s steep gradients, constant exposure to coastal erosion, and the dynamic nature of its landforms make it an ideal location to test UAV-based photogrammetry and LiDAR methodologies. The morphology of the Olandian hat, particularly its near-vertical cliff and parabolic dune, presents significant challenges for aerial mapping. These features can cause distortions in the captured images, making it difficult to achieve accurate representations of steep gradients and complex terrain, a challenge that traditional surveying methods also struggle to address. Similar studies have shown that steep and highly eroded landscapes require the use of advanced mapping technologies to compensate for the terrain’s irregularities (Eakins and Grothe, 2014; Filippelli et al., 2019). Furthermore, its location within a preserved natural heritage site ensures that accurate mapping and monitoring are critical for ongoing conservation efforts.
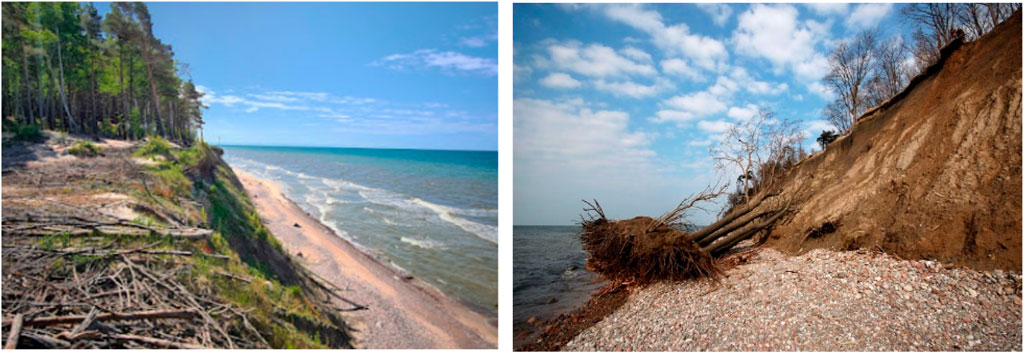
Figure 2. Experimental object: cut-slope surface of Olandian hat, which is located on the seacoast.
The operations of unmanned aerial systems (UASs) have seen significant advancements in recent years. These systems now employ cutting-edge technologies, driven by the development of new concepts in air mobility (EASA, 2022; Fakhraian et al., 2023). UAV operations, an emerging concept, hold vast potential when integrated with innovative technologies, which leads to the development of new applications (Rosen et al., 2018). The UAV’s actuator, consisting of motors, electrical controls, and propellers, is a critical component and serves as the primary power source. During UAV operations, factors such as friction, wear, shock, and vibration are inevitable, posing risks to the actuator’s components. The degradation of these components can result in malfunctions or major mechanical failures. Therefore, continuous and precise monitoring of actuator health is essential for ensuring the reliable performance of UAVs (Alemayehu et al., 2020; Hamadi et al., 2022; Zhang et al., 2023).
The application of UAS in mapping objects with diverse topographies has revolutionized surveying technology. UAS aerial imaging solutions are designed to reduce both time and costs associated with aerial data collection, while ensuring the reliability of mapping products (Enterprise, 2022).
Through a single UAV flight, numerous images can be captured, and point clouds can be gathered via laser scanning of the terrain. The UAV-mounted camera is equipped with a high-resolution imaging sensor that captures detailed and color-rich images. Image overlap is a crucial parameter in the preparation of aerial photography projects and for obtaining high-quality cartographic products. Optimal results are achieved when images overlap by more than 50%. Considering that UAV systems are often unstable during aerial photography, with positioning largely affected by wind gusts, it is recommended that 70%–80% of the images overlap. This overlap percentage is optimal for the specific conditions of the study area due to the variability of the terrain and the UAV’s stability during flight. In areas with significant topographic variations such as steep slopes and cut slopes, the increased overlap ensures more comprehensive data capture and minimizes gaps in the resulting images, especially when wind gusts or other environmental factors may affect image stability. Furthermore, side and front overlaps were set to 80% and 90%, respectively, to ensure full coverage of the area, especially in critical sections that required detailed resolution. The 70%–80% overlap ensures that sufficient data are captured for photogrammetric processing, minimizing the risk of missing critical features or details. Such overlap is generally recommended in UAV-based photogrammetry, especially when working with complex or variable terrains. Previous studies have emphasized the need for high overlap percentages to ensure the accuracy of the derived models and minimize errors related to image misalignment (Ferrer-González et al., 2020; McGlone, 2013). The use of overlap in the recommended range improves the consistency and precision of the resulting geospatial data, particularly when the UAV is operating in dynamic conditions where factors such as wind or variable lighting may influence image capture (Ferrer-González et al., 2020). The side and front overlaps should be set to 80% × 80% and 90% × 90%, respectively. When processing photographic images, the target point identification accuracy is typically accepted as one-tenth of the ground sample distance (GSD). For instance, if the GSD is 2 cm, the accuracy of target point identification would be at least 2 mm. Achieving greater accuracy is generally not feasible. Using classical surveying methods, such as RTK GPS, the point position accuracy is determined to be approximately 1 cm (McGlone, 2013; Nurminen et al., 2013).
A key tool for modern land surveyors utilizing UAS technology is the Pix4Dmapper image data processing software, developed by the Computer Vision Lab in Switzerland. This software package integrates state-of-the-art photogrammetric techniques with advanced computer vision algorithms, producing outputs with high accuracy and requiring minimal manual intervention. The Pix4Dmapper software, including the rayCloud module, extends the stereo-view triangulation concept, enhancing the accuracy of 3D modeling. Aerial images are imported with location, orientation, and camera calibration parameters. Photogrammetric algorithms correct the orientations of the images, first adjusting with photo tie points that are automatically matched across all images. These tie points are typically distributed densely, even in low-terrain texture. Pix4Dmapper offers efficient capabilities for orthophoto generation, surface modeling, and more. Operations within this software are fully automated and flexible, with scalable data input, easily editable output data, and real-time on-site quality assessment (Pix4D, 2024).
TerraScan and TerraMatch, software products from Terrasolid (Finland), are used for managing and processing LiDAR point clouds collected by UAV platforms. TerraScan is designed for LiDAR data handling and 3D vector data creation, while TerraMatch improves the accuracy and quality of raw laser point clouds. With UAVs operating at low altitudes, where the system is more unstable, improving data accuracy by eliminating misalignment and positional inaccuracies due to poor trajectories is crucial in the LiDAR data processing workflow. The accuracy of laser scanning results depends on flight height, scanning angle, terrain type, and the size and characteristics of the objects being scanned. Under optimal conditions, laser scanning results can achieve accuracy within a few centimeters. For example, at a flight height of 60 m, the positional accuracy of points on the ground can be within ±1 cm (Terrasolid, 2024).
To preserve unique objects or terrain with extreme topographies, a photogrammetric/GIS workflow has been developed. By acquiring reliable and accurate data and enhancing the efficiency of spatial modeling processes, the following actions for scanning and processing the research object are planned:
- UAV flights with an integrated Zenmuse X5 camera and MAPPER LITE 2 (LiDAR equipment).
- Aerial photography of the object, with the camera oriented horizontally and tilted by approximately 50°.
- Simultaneous surface scanning with LiDAR equipment.
- Photogrammetric data processing (combining vertical, tilted, and both datasets) using Pix4Dmapper software.
- LiDAR data processing and surface modeling with TerraScan and Terrasolid software applications, including the generation of cross-sections from the point cloud.
- Analysis of the results and accuracy assessment.
For the analysis of aerial mapping results and accuracy evaluation, the RMSE calculation is performed according to the following equation:
where X, Y, and Z(cpi) are coordinates that are determined using the geodetic methods (measurements performed by the total station) for the ith check point; X, Y, and Z(ci) are coordinates of check points measured in the generated aerial mapping production and dense points cloud; and n is the number of check points.
The aerial drone surveying project was developed considering the standard requirements for flight planning and realization. The aim was to perform short flights over unique and cultural heritage objects with extreme topography and acquire images of high quality. Considering the specific features of the object, which is located alongside the seacoast, the flight realization has strong dependence on good meteorological conditions (minimal cloud, low winds, mild temperature, and good visibility). The important procedures were checking the forecast before flight and choosing well the flying height.
The flight mission of the UAV equipped with a digital camera of high resolution (16 MP), LiDAR, and GPS was executed over the test site—Olandian hat. The main focus was on capturing image data suitable for photogrammetric processing and laser scanning for correct relief representation. The flight mission was executed at the end of May 2021, with good meteorological conditions.
The UAV’s camera and LiDAR equipment are specified, along with the software and processing steps taken for generating the 3D models and digital terrain models (DTMs). The UAV, model MATRICE 600 PRO, DJI, with mounted camera Zenmuse X5 and 3D laser scanner MAPPER LITE 2, was applied for data acquisition (Figure 3). The MATRICE 600 PRO is a UAV platform with low cost and weight. The weight is 9.5 kg, the max. speed is 65 km/h, hovering time is 32 min, and flying height is up to 2,500 m. The UAV’s weight, speed, and hovering time were key factors in the data collection process. The MATRICE 600 PRO, with a weight of 9.5 kg and a maximum speed of 65 km/h, was capable of reaching the required flight speeds required for efficient mapping in this study. However, the maximum hovering time of 32 min limited the total duration of each flight, requiring precise planning of the flight path and efficient data acquisition to ensure full coverage of the study area within the UAV’s operational time. The limited hovering time also impacted the number of images captured during each flight as it was crucial to balance flight duration with the need for sufficient image overlap (70%–80%) to ensure high-quality photogrammetric outputs (McGlone, 2013). Furthermore, the UAV’s weight influenced its maneuverability, particularly in the presence of strong winds, which required careful consideration of wind speed and direction during flight planning (Shahbazi et al., 2015). Despite these constraints, the UAV’s specifications were sufficient to meet the accuracy requirements for this study area, ensuring precise mapping and 3D model generation. The main features of gimbal camera DJI Zenmuse X5 are the following: sensor’s size, 17.3 × 13.0 mm; resolution, 4,608 × 3,456 px. (16 M); focal length, 15 mm. Simultaneously with image data acquisition, surface scanning was performed by the 3D LiDAR system MAPPER LITE 2, with weight up to 2.2 kg and automatic operation up to 1 h, and the navigation systems are GPS, GLONASS, Beidou, Galileo1, and SBAS.
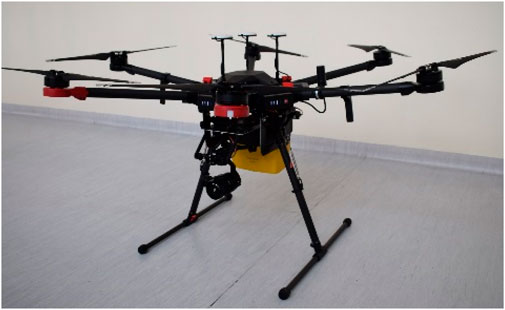
Figure 3. UAV with equipment (camera, LiDAR, and GPNS) used for collection of topographic data.
The flight height depends on the size of the image pixel on the area—ground sample distance (GSD), the camera sensor size, and focal length (Enterprise, 2022). When each pixel on the ground is not perfectly square, the GSD is calculated with the following Equation 2:
When planning the UAV flight over the experimental area, the GSD of size 1.5 cm was specified considering the required accuracy of aerial mapping production. The flight height (aerial ground level) was fixed at 60 m. The GSD of 1.5 cm was specified based on the desired level of accuracy required for this study’s topographic mapping and is consistent with industry standards for similar aerial mapping projects. A GSD of this size ensures that the individual details of the terrain, particularly features of the Olandian hat with its steep slopes, are captured with sufficient resolution for effective analysis. According to McGlone (2013), a typical GSD for high-accuracy aerial surveys ranges from 1 cm to 5 cm, depending on factors such as the UAV’s sensor resolution, flight altitude, and the specific requirements of the terrain being mapped. This choice of GSD is within the recommended range for photogrammetric surveys of challenging topographies. It balances the need for high spatial resolution while optimizing the number of images that can be processed within the operational constraints of the UAV (Žabota and Kobal, 2021). A higher-resolution GSD would have resulted in diminishing returns in terms of accuracy as the gain in detail would be outweighed by the limitations in UAV capabilities, such as its flight time and payload capacity. The decision to set a GSD of 1.5 cm for this study was based on the desired accuracy for detailed topographical mapping and terrain representation in this specific study area. A GSD of 1.5 cm ensures that the spatial resolution of the images is sufficiently high for creating accurate 3D models and DTMs without excessive data volume, which could hinder processing efficiency (Zeybek et al., 2023). This threshold is consistent with industry standards for UAV-based mapping in areas with moderate-to-steep topographies, where fine details such as surface elevation and small landform variations are essential for precise analysis (McGlone, 2013; Sanz-Ablanedo et al., 2018). It ensures that the accuracy of the aerial mapping products meets the project’s requirements for precision while maintaining the balance between image quality and data management.
The photogrammetric network was created for the external orientation of images. Before taking images, 10 ground control points (GCPs) were well-distributed and marked on the territory by standard marks (targets of size 40 × 40 cm) (Figure 4). The fixing of targets on the ground was complicated because of the unstable surface and significant slope. After aerial photography, these marks are clearly visible in high-resolution images. The planimetric coordinates of the targets were determined by the GPS in the Lithuanian (LKS94) coordinate system using the LitPOS network with an accuracy of 5–8 cm. The planimetric projection system is transverse cylindrical Mercator projection (UTM) for the territory of Lithuania, with an axial meridian L0 = 24° and a scale at the axial meridian m0 = 0.9998. The reference system used for planimetric coordinates—Lithuanian coordinate system (LKS 94)—is based on the GRS 80 ellipsoid, and the origin of the planimetric coordinates coincides with the intersection point of the axial 24° meridian and the equator. LitPOS consists of a network of permanently operating GPNS stations, which are evenly distributed throughout the territory of Lithuania. The Lithuanian state height system LAS07 (ellipsoidal altitudes) uses the European height. Using RTK GPS, the measuring time of the 10 GCPs includes approximately 5 h considering the unique location of the points.
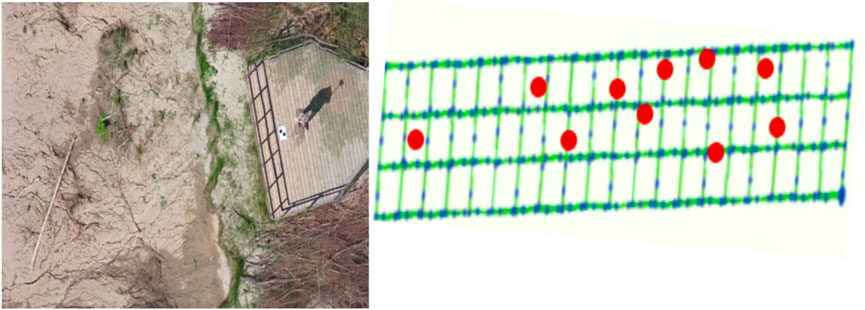
Figure 4. GCP target visible on the image and initial images positions with distributed GCPs.
GPNS equipped at the UAV offers geographical coordinates of each image projection center in coordinate system WGS 84 (geoid–EGM96).
Employing digital photogrammetric software Pix4Dmapper, the orthophoto map and 3D model (DSM) of the study area have been generated (Figure 5). The scale of the orthophoto map is 1:50, and the altitudes range is from 1.5 m up to 21.5 m.

Figure 5. Aerial mapping products generated by the use of software Pix4Dmapper: orthophoto map of the test site and digital surface model (DSM).
Three photogrammetric data blocks were processed: 1) images were collected when the photography axis was at a horizontal position—vertical projection line; 2) photography axis was tilted at approximately 50°—inclined projection line; 3) combining both images’ data sets.
Georeferencing of images was obtained with an accuracy of RMSE 0.014 m. The following generalized rule was applied for the accuracy of images’ exterior orientation—the precision of planimetric coordinates must be 2 × GSD higher, the altitudes three times.
The point cloud from LiDAR scanning was processed using software application TerraScan and Terrasolid. Figure 6 presents DTM generated from laser scanning data.
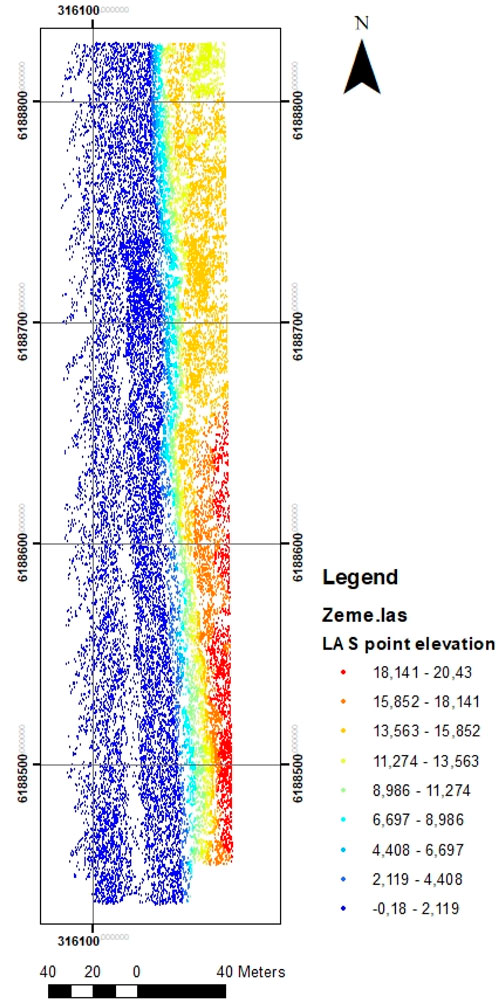
Figure 6. DTM of the experimental area generated from LiDAR point cloud: colors represent the relief (in LAS-07 height system). Altitudes range from 2.5 m up to 22.8 m.
The verified information from the study area (Olandian hat) image processing outputs (from the first dataset, when the projection line was at a vertical position) includes the following key details: the average GSD is 1.45 cm, with 245 out of 289 images calibrated (84%). Camera optimization showed a 2.4% relative difference between the initial camera parameters, which is below the 5% threshold. The georeferencing accuracy, as determined by the RMSE of the 10 GCPs (3D), is 0.014 m (Table 1). This result satisfies the accuracy requirements, with RMSE being below 0.0435 m (3 × GSD in general). The acceptable accuracy in aerial mapping results is typically defined based on the specific application and industry standards for precision. In this study, an RMSE of 0.014 m for the 10 GCPs falls well within the typical requirements for high-quality geospatial data collection, where RMSE values under 3 × GSD are generally deemed acceptable for most topographic applications (McGlone, 2013; Žabota and Kobal, 2021). The accuracy in the horizontal (X, Y) directions, with an RMSE of 0.013 m and 0.009 m, respectively, demonstrates high reliability, while the vertical accuracy (Z direction) presents a slightly higher RMSE of 0.023 m, which is still considered acceptable within industry standards for the generation of DTMs in areas with moderate to high relief (Vaze et al., 2010).
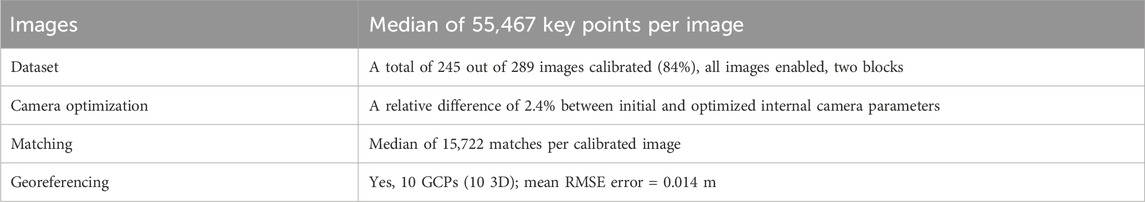
Table 1. Quality check—summary of the quality report for the first dataset using software Pix4Dmapper.
The evaluation of geolocation accuracy across three directions (X, Y, and Z) based on manually measured and marked GCPs is presented in Table 2. The maximal errors in the easting (X), northing (Y), and height (Z) directions are as follows: 0.022 m, 0.016 m, and 0.042 m, respectively. The RMSE values are 0.013 m, 0.009 m, and 0.023 m for the X, Y, and Z directions, respectively, with the least precise marking occurring in the Z direction (RMSE = 0.023 m). The reduced precision in the Z direction (RMSE = 0.023 m) has potential implications for terrain modeling, particularly when generating accurate DEMs or DTMs. The Z direction represents the vertical component of the data, which is critical for capturing the true surface elevation of the study area, particularly in areas with steep slopes or pronounced relief, such as the Olandian hat. Inaccuracies in the Z direction can lead to errors in surface representation, potentially affecting analyses such as slope stability, drainage modeling, or landform classification. As the Z-direction errors may accumulate in areas of significant elevation change, this could impact the accuracy of the DTMs in representing the precise terrain shape, particularly in steep areas (Szypuła, 2024). However, the RMSE of 0.023 m is within acceptable limits for many standard topographic applications, and this minor reduction in precision is unlikely to significantly affect the overall quality of the terrain model for the purposes of this study. Moreover, the combination of UAV photogrammetry and LiDAR data can help mitigate this issue. LiDAR, with its superior accuracy in vertical measurements, can complement photogrammetry by providing more accurate elevation data, especially for areas where the photogrammetry may struggle due to reduced visibility or surface texture (Oniga et al., 2024). Applying the generalized rule for accuracy evaluation in exterior orientation (in X, Y directions: 2 × GSD, and in Z direction: 3 × GSD), the exterior orientation of images meets the accuracy requirements, i.e., is below 29 cm in planimetric coordinates and 43.5 cm in elevation.
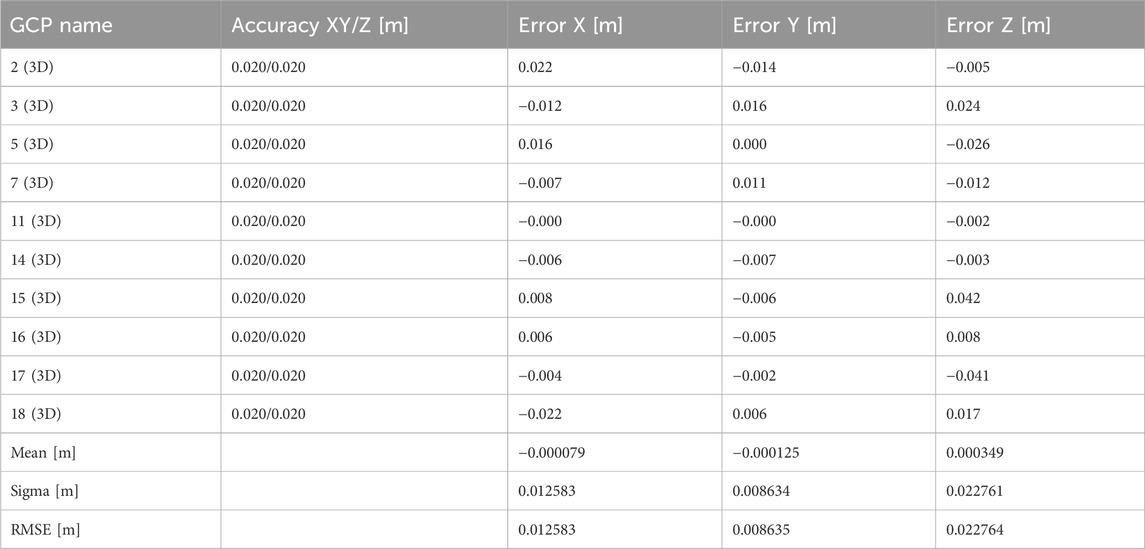
Table 2. Geolocation accuracy—summary of the quality report for the first dataset.
The evaluation of geolocation accuracy for the images with the projection ray tilted at approximately 50° shows that combining both horizontal and tilted image datasets does not significantly change the results compared to the results using the first dataset.
Overlap between images is another critical parameter affecting the quality of aerial cartographic products. As shown in Figure 7, images were overlapped to generate an orthophoto mosaic of the study area. Approximately 95% of the study area was covered by overlapped images, meeting the recommended overlap guidelines. Areas with insufficient overlap (shown in red or yellow) might lead to poor results.
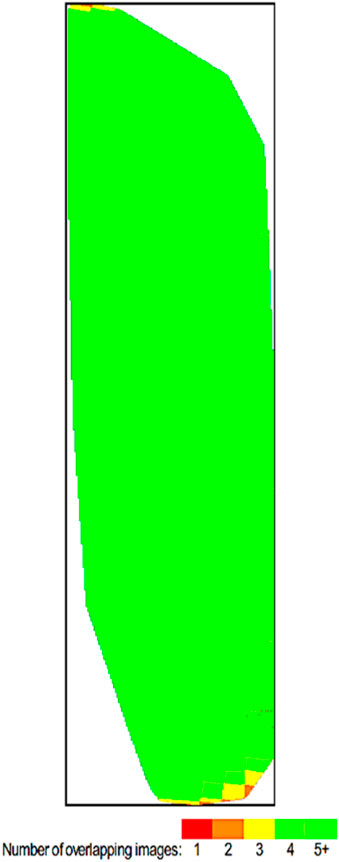
Figure 7. Image overlap analysis for the study area (approx. 95% overlap).
A sample of 25 reference (check) points was created for the accuracy evaluation of aerial mapping products. These points, located on the cut-slope area, were measured using geodetic methods with the GeoMax Zoom25 total station. For each check point, accuracy assessment (in X, Y, and Z directions) was performed by comparing the measured coordinates with the point coordinates determined in the dense point cloud generated after processing the photogrammetric images. The RMSE was calculated according to Equation 1.
Recent studies have shown that LiDAR and photogrammetry are both excellent methods for mapping objects with varied topography. While photogrammetry, using UAVs, provides high-resolution images for accurate terrain mapping, it often faces challenges in areas with complex surface features such as dense vegetation or steep slopes. On the other hand, LiDAR’s ability to penetrate through vegetation and capture precise terrain data makes it highly effective for areas with extreme topography (Demoulin et al., 2007; Jakovljevic et al., 2019; Kanostrevac et al., 2019). The work by Li et al. (2020) provides a detailed analysis comparing UAVs equipped with photogrammetry and LiDAR for the evolution of ice morphology. This study reinforces the idea that integrating these technologies can enhance the accuracy and reliability of spatial models, particularly in extreme topographic conditions, as observed in this research (T. Li et al., 2020).
The following criteria were applied for the accuracy evaluation of aerial mapping products: mean and maximum errors of planimetric coordinates should be within 1.0 × GSD and 1.6 × GSD, respectively; for elevations, the accuracy should be within 1.6 × GSD and 2.5 × GSD.
LiDAR data typically result in higher accuracy in the Z direction, especially when used in combination with photogrammetry, as seen in the combined dataset where the RMSE for X, Y, and Z directions was 0.049 m, 0.056 m, and 0.040 m, respectively. This combination is ideal for modeling surfaces with extreme topography, such as cut slopes, where the accuracy is critical. LiDAR’s dense point cloud offers superior performance in accurately representing terrain surfaces, leading to better extraction of terrain parameters and more reliable models for monitoring land conditions, as seen in the following sources (Demoulin et al., 2007; Jakovljevic et al., 2019; Kanostrevac et al., 2019; Kovanič et al., 2023; Sharma et al., 2021). LiDAR datasets are particularly recommended for generating DEMs in areas with steep terrain, providing detailed information for terrain analysis, such as landslide risk assessment or terrain restoration (Demoulin et al., 2007). The accuracy in Z direction from LiDAR data is approximately twice as high as the accuracy of planimetric coordinates, highlighting its strength in capturing vertical features.
In terms of statistical analysis, additional methods such as paired t-tests or analysis of variance (ANOVA) could be employed to evaluate the significance of the differences between the datasets obtained from UAV-based photogrammetry and traditional geodetic techniques (e.g., RTK GPS) (Fisher, 1992). Paired t-tests would be particularly useful for comparing the accuracy of georeferencing results between the two methods, allowing for the assessment of whether there are statistically significant differences in the positioning accuracy between UAV and conventional techniques (McGlone, 2013). ANOVA could be used if more than two datasets or methods are compared, such as comparing various UAV configurations, flight heights, or sensor types (Furby and Akhavian, 2024). These analyses would not only improve the scientific rigor of the findings but also provide a clearer understanding of the variability in accuracy between UAV-based methods and traditional surveying techniques. Such statistical tests would help quantify the extent to which UAV-based methods improve or deviate from established geodetic practices, providing a more robust evaluation of the accuracy and efficiency of UAV technology for mapping challenging topographies. Furthermore, these analyses would be valuable in highlighting specific conditions under which UAVs may be preferable or less effective than traditional methods (Giordan et al., 2020). This would ultimately contribute to a more nuanced and evidence-based conclusion about the potential of UAVs in geospatial data collection.
The proposed technique aims to be efficient for the reconstruction of surfaces with extreme topography, such as a parabolic dune drifted on a moraine crest, which is severely eroded by the sea and rain. This technique is essential for obtaining reliable data for users involved in the monitoring and preservation of unique cultural objects (Nunes et al., 2020). Potential end-users of the data obtained from this study include conservationists, archaeologists, urban planners, landscape architects, and engineers. These professionals rely on accurate topographic data for monitoring and preserving cultural and natural sites. The high-resolution 3D models and DEMs generated by this study are especially useful for conservation and restoration efforts, allowing users to track changes in the terrain and detect issues such as erosion or structural shifts (Caciora et al., 2024). For urban planners and engineers working in challenging environments, such as flood-prone or steep areas, these DEMs enable better land-use planning and infrastructure development. The integration of these models into GIS allows for precise analyses, such as slope stability and flood risk assessment, which are essential for optimizing project design in complex terrains (Oniga et al., 2024). This methodology also provides real-time data processing, allowing continuous monitoring of terrain changes, which is critical for ongoing preservation and management projects. By integrating UAV photogrammetry and LiDAR data, this approach offers a powerful tool for professionals working in areas with difficult topography, facilitating more informed decision-making in conservation, restoration, and urban planning (Khelifi et al., 2021; McGlone, 2013).The research is based on collecting images during UAV flights, with the camera axis set perpendicular to the experimental surface and tilted at approximately 50°, while simultaneously scanning with LiDAR. Using classical surveying technologies and instruments, such as GPS, terrestrial laser scanners, or total stations, is not suitable for measurements in this case due to the complicated cut-slope topography (Lague et al., 2013).
The evaluation of aerial mapping and cartographic products shows that the best accuracy was achieved with products derived from the combined image set, with a mean RMSE of 0.048 m (in X, Y, and Z directions). Correct representation of DEMs was not possible using only image data from horizontally oriented cameras. This limitation is particularly evident when generating DEMs from point clouds produced by standard software. In such cases, the geometry of the terrain might not be accurately represented, leading to potential errors in surface height. Therefore, correcting the height information using additional data, such as LiDAR, is advisable (Kinzel et al., 2021). LiDAR scanning from low altitudes has proven to be more accurate in capturing vertical information, and when combined with photogrammetry, it provides a more comprehensive and reliable representation of the terrain, especially in extreme topographical conditions (such as field evaluation of a compact, polarizing topo-bathymetric LiDAR across a range of river conditions) (Kinzel et al., 2021).
The spatial model generated from LiDAR data is more accurate in the Z direction. The point cloud density derived from the combined UAV photogrammetry and LiDAR datasets allows for an accurate representation of the terrain, facilitating the preparation of cross-sections necessary for planning special purpose works on such terrain (Costa et al., 2009; Glira et al., 2016). The mesh with a GSD of 1 cm was defined as sufficient for obtaining an accurate relief representation. Surveying work measuring GCPs in such complex terrain should focus on improving the distribution of GCPs, which directly impacts the accuracy of the cartographic products.
Looking ahead, there are several avenues to enhance the robustness and applicability of the proposed methodology. One promising direction is the integration of additional data sources, such as multispectral or hyperspectral imagery, which could provide more detailed information on surface materials and vegetation. Coupling these data with LiDAR and photogrammetric data could improve the model’s ability to represent complex terrains, especially in areas with varied vegetation and surface textures. Moreover, the use of real-time data processing techniques, such as edge computing, could significantly reduce the time required for large-scale mapping, offering near-instantaneous results that are crucial for time-sensitive preservation and monitoring projects (Columbro et al., 2022; Ikeda et al., 2024).
In addition to these technological advancements, the methodology could be further refined for applications in diverse environments. For example, expanding its use to different types of cultural heritage sites with varying topographical challenges would demonstrate its flexibility and robustness. Integrating this workflow with the existing GIS could offer an even deeper level of analysis, facilitating more effective management and conservation efforts. As the technology continues to evolve, future studies could explore the potential for autonomous UAVs and mobile platforms to further improve data collection in hard-to-reach areas, ensuring that complex terrain and cultural assets are preserved with high accuracy and minimal human intervention (Kemarau et al., 2024).
The study acknowledges certain limitations, particularly regarding the impact of climate conditions on the data collection process. For instance, the research area, situated along the Baltic Sea coast, is subject to coastal erosion and seasonal weather variations that can influence UAV flight stability and the accuracy of collected data. Strong winds or rain can limit UAV operational capacity, affecting image overlap and the quality of the data gathered, particularly in areas with steep topography (Linder, 2009). Future research should explore ways to mitigate the effects of such environmental conditions, including the use of UAVs with enhanced stability features and weather-resistant technologies. Additionally, further studies could examine how seasonal changes in vegetation or terrain may affect the quality of photogrammetric models, which are critical for accurate terrain representation.
Looking ahead, it is also crucial to establish clearer research directions for improving the existing methodology. This could involve investigating advanced sensor fusion techniques, the integration of additional environmental data, and exploring the potential for autonomous UAV systems that can operate in harsh conditions with minimal human intervention (Kemarau et al., 2024). These developments would further strengthen the capacity for high-quality mapping in challenging topographies, particularly in regions prone to rapid environmental changes.
The raw data supporting the conclusions of this article will be made available by the authors, without undue reservation.
BR: conceptualization, formal analysis, investigation, methodology, resources, validation, visualization, writing–original draft, and writing–review and editing. LK: conceptualization, formal analysis, investigation, methodology, resources, validation, visualization, writing–original draft, and writing–review and editing. IK: conceptualization, formal analysis, investigation, methodology, resources, validation, visualization, writing–original draft, and writing–review and editing. DJ: conceptualization, formal analysis, investigation, methodology, project administration, resources, supervision, validation, visualization, writing–original draft, and writing–review and editing. SL: formal analysis, methodology, resources, supervision, validation, visualization, writing–original draft, and writing–review and editing.
The author(s) declare that no financial support was received for the research, authorship, and/or publication of this article.
The team of authors expresses their gratitude to the reviewers for valuable recommendations that have been taken into account to significantly improve the quality of this manuscript.
The authors declare that the research was conducted in the absence of any commercial or financial relationships that could be construed as a potential conflict of interest.
All claims expressed in this article are solely those of the authors and do not necessarily represent those of their affiliated organizations, or those of the publisher, the editors and the reviewers. Any product that may be evaluated in this article, or claim that may be made by its manufacturer, is not guaranteed or endorsed by the publisher.
Ackermann, F. (1999). Airborne laser scanning—present status and future expectations. ISPRS J. Photogrammetry Remote Sens. 54 (2), 64–67. doi:10.1016/S0924-2716(99)00009-X
Addabbo, P., Angrisano, A., Bernardi, M. L., Gagliarde, G., Mennella, A., Nisi, M., et al. (2018). UAV system for photovoltaic plant inspection. IEEE Aerosp. Electron. Syst. Mag. 33 (8), 58–67. doi:10.1109/MAES.2018.170145
Aksamitauskas, V. Č., Kriaučiūnaitė-Neklejonovienė, V., Rekus, D., Ruzgienė, B., Puodžiukas, V., and Stanionis, A. (2016). Advantages of laser scanning systems for topographical surveys in roads engineering. Baltic J. Road Bridge Eng. 11 (2), 153–159. doi:10.3846/bjrbe.2016.18
Alemayehu, T. S., Kim, J.-H., and Yoon, W. (2020). Fault-tolerant UAV data acquisition schemes. Wirel. Personal. Commun. 114 (2), 1669–1685. doi:10.1007/s11277-020-07445-5
Alesheikh, A. A., Ghorbanali, A., and Nouri, N. (2007). Coastline change detection using remote sensing. Int. J. Environ. Sci. and Technol. 4 (1), 61–66. doi:10.1007/BF03325962
Alvarez-Vanhard, E., Corpetti, T., and Houet, T. (2021). UAV and satellite synergies for optical remote sensing applications: a literature review. Sci. Remote Sens. 3, 100019. doi:10.1016/j.srs.2021.100019
Apaza, J., Scipión, D., Lume, D., and Saito, C. (2017). “Development of two UAVs for volcano studies in southern Peru,” in 2017 IEEE XXIV international conference on electronics, electrical engineering and computing (INTERCON), 1–4. doi:10.1109/INTERCON.2017.8079700
Awadallah, M. O. M., Juárez, A., and Alfredsen, K. (2022). Comparison between topographic and bathymetric LiDAR terrain models in flood inundation estimations. Remote Sens. 14 (1), 227. doi:10.3390/rs14010227
Awadallah, M. O. M., Malmquist, C., Stickler, M., and Alfredsen, K. (2023). Quantitative evaluation of bathymetric LiDAR sensors and acquisition approaches in lærdal river in Norway. Remote Sens. 15 (1), 263. doi:10.3390/rs15010263
Boak, E. H., and Turner, I. L. (2005). Shoreline definition and detection: a review. J. Coast. Res. 2005 (214), 688–703. doi:10.2112/03-0071.1
Buggiani, V., Ortega, J. C. Ú., Silva, G., Rodríguez-Molina, J., and Vilca, D. (2023). An inexpensive unmanned aerial vehicle-based tool for mobile network output analysis and visualization. Sensors 23 (3), 1285. doi:10.3390/s23031285
Caciora, T., Ilieș, A., Herman, G. V., Berdenov, Z., Safarov, B., Bilalov, B., et al. (2024). Advanced semi-automatic approach for identifying damaged surfaces in cultural heritage sites: integrating UAVs, photogrammetry, and 3D data analysis. Remote Sens. 16 (16), 3061. doi:10.3390/rs16163061
Cariou, C., Moiroux-Arvis, L., Pinet, F., and Chanet, J.-P. (2023). Evolutionary algorithm with geometrical heuristics for solving the close enough traveling salesman problem: application to the trajectory planning of an unmanned aerial vehicle. Algorithms 16 (1), 44. doi:10.3390/a16010044
Casalbore, D., Di Traglia, F., Romagnoli, C., Favalli, M., Gracchi, T., Tacconi Stefanelli, C., et al. (2022). Integration of remote sensing and offshore geophysical data for monitoring the short-term morphological evolution of an active volcanic flank: a case study from stromboli island. Remote Sens. 14 (18), 4605. doi:10.3390/rs14184605
Clapuyt, F., Vanacker, V., Schlunegger, F., and Van Oost, K. (2017). Unravelling earth flow dynamics with 3-D time series derived from UAV-SfM models. Earth Surf. Dyn. 5 (4), 791–806. doi:10.5194/esurf-5-791-2017
Colomina, I., and Molina, P. (2014). Unmanned aerial systems for photogrammetry and remote sensing: a review. ISPRS J. Photogrammetry Remote Sens. 92, 79–97. doi:10.1016/j.isprsjprs.2014.02.013
Columbro, C., Eudave, R. R., Ferreira, T. M., Lourenço, P. B., and Fabbrocino, G. (2022). On the use of web mapping platforms to support the seismic vulnerability assessment of old urban areas. Remote Sens. 14 (6), 1424. doi:10.3390/rs14061424
Costa, B. M., Battista, T. A., and Pittman, S. J. (2009). Comparative evaluation of airborne LiDAR and ship-based multibeam SoNAR bathymetry and intensity for mapping coral reef ecosystems. Remote Sens. Environ. 113 (5), 1082–1100. doi:10.1016/j.rse.2009.01.015
Delavarpour, N., Koparan, C., Nowatzki, J., Bajwa, S., and Sun, X. (2021). A technical study on UAV characteristics for precision agriculture applications and associated practical challenges. Remote Sens. 13 (6), 1204. doi:10.3390/rs13061204
Demoulin, A., Bovy, B., Rixhon, G., and Cornet, Y. (2007). An automated method to extract fluvial terraces from digital elevation models: the Vesdre valley, a case study in eastern Belgium. Geomorphology 91 (1), 51–64. doi:10.1016/j.geomorph.2007.01.020
Eakins, B., and Grothe, P. (2014). Challenges in building coastal digital elevation models. J. Coast. Res. 30, 942–953. doi:10.2112/JCOASTRES-D-13-00192.1
EASA (2022). EASA. Available at: https://www.easa.europa.eu/en/newsroom-and-events/press-releases/easa-publishes-worlds-first-rules-operation-air-taxis-cities.
Enterprise, D. J. I. (2022). LiDAR drone systems: using LiDAR equipped UAVs. Available at: https://enterprise-insights.dji.com/blog/lidar-equipped-uavs.
Fakhraian, E., Semanjski, I., Semanjski, S., and Aghezzaf, E.-H. (2023). Towards safe and efficient unmanned aircraft system operations: literature review of digital twins’ applications and European union regulatory compliance. Drones 7 (7), 478. doi:10.3390/drones7070478
Fan, J., Dai, W., Wang, B., Li, J., Yao, J., and Chen, K. (2023). UAV-based terrain modeling in low-vegetation areas: a framework based on multiscale elevation variation coefficients. Remote Sens. 15 (14), 3569. doi:10.3390/rs15143569
Ferrer-González, E., Agüera-Vega, F., Carvajal-Ramírez, F., and Martínez-Carricondo, P. (2020). UAV photogrammetry accuracy assessment for corridor mapping based on the number and distribution of ground control points. Remote Sens. 12 (15), 2447. doi:10.3390/rs12152447
Filippelli, S., Lefsky, M., and Rocca, M. (2019). Comparison and integration of lidar and photogrammetric point clouds for mapping pre-fire forest structure. Remote Sens. Environ. 224, 154–166. doi:10.1016/j.rse.2019.01.029
Fisher, R. A. (1992). “Statistical methods for research workers,” in Breakthroughs in statistics: methodology and distribution. Editors Em S. Kotz, and N. L. Johnson (Springer), 66–70. doi:10.1007/978-1-4612-4380-9_6
Furby, B., and Akhavian, R. (2024). A comprehensive comparison of photogrammetric and RTK-GPS methods for general order land surveying. Buildings 14 (6), 1863. doi:10.3390/buildings14061863
García-Rubio, G., Huntley, D., and Russell, P. (2015). Evaluating shoreline identification using optical satellite images. Mar. Geol. 359, 96–105. doi:10.1016/j.margeo.2014.11.002
Gens, R. (2010). Remote sensing of coastlines: detection, extraction and monitoring. Int. J. Remote Sens. 31 (7), 1819–1836. doi:10.1080/01431160902926673
Giordan, D., Adams, M. S., Aicardi, I., Alicandro, M., Allasia, P., Baldo, M., et al. (2020). The use of unmanned aerial vehicles (UAVs) for engineering geology applications. Bull. Eng. Geol. Environ. 79 (7), 3437–3481. doi:10.1007/s10064-020-01766-2
Glira, P., Pfeifer, N., and Mandlburger, G. (2016). Rigorous strip adjustment of UAV-based laserscanning data including time-dependent correction of trajectory errors. Photogrammetric Eng. and Remote Sens. 82 (12), 945–954. doi:10.14358/PERS.82.12.945
Guo, Y., Wang, H., Hu, Q., Liu, H., Liu, L., and Bennamoun, M. (2021). Deep learning for 3D point clouds: a survey. IEEE Trans. Pattern Analysis Mach. Intell. 43 (12), 4338–4364. doi:10.1109/TPAMI.2020.3005434
Hamadi, H., Lussier, B., Fantoni, I., and Francis, C. (2022). Data fusion fault tolerant strategy for a quadrotor UAV under sensors and software faults. ISA Trans. 129, 520–539. doi:10.1016/j.isatra.2022.01.007
Hartley, R. J. L., Leonardo, E. M., Massam, P., Watt, M. S., Estarija, H. J., Wright, L., et al. (2020). An assessment of high-density UAV point clouds for the measurement of young forestry trials. Remote Sens. 12 (24), 4039. doi:10.3390/rs12244039
Ikeda, H., Bibish, B., Fissha, Y., Sinaice, B. B., Toriya, H., Adachi, T., et al. (2024). Advanced UAV photogrammetry for precision 3D modeling in GPS denied inaccessible tunnels. Saf. Extreme Environ. 6 (4), 269–287. doi:10.1007/s42797-024-00109-8
Jakovljevic, G., Govedarica, M., Alvarez-Taboada, F., and Pajic, V. (2019). Accuracy assessment of deep learning based classification of LiDAR and UAV points clouds for DTM creation and flood risk mapping. Geosciences 9 (7), 323. doi:10.3390/geosciences9070323
Juárez, A., Adeva-Bustos, A., Alfredsen, K., and Dønnum, B. O. (2019). Performance of A Two-Dimensional hydraulic model for the evaluation of stranding areas and characterization of rapid fluctuations in hydropeaking rivers. Water 11 (2), 201. doi:10.3390/w11020201
Juárez, A., Alfredsen, K., Stickler, M., Adeva-Bustos, A., Suárez, R., Seguín-García, S., et al. (2021). A conflict between traditional flood measures and maintaining river ecosystems? A case study based upon the river lærdal, Norway. Water 13 (14), 1884. doi:10.3390/w13141884
Kanostrevac, D., Borisov, M., Bugarinović, Ž., Ristic, A., and Radulović, A. (2019) Data quality comparative analysis of photogrammetric and LiDAR DEM, 17–34.
Kemarau, R. A., Sakawi, Z., Suab, S. A., Eboy, O. V., Wan Mohd Jaafar, W. S., Abdul Maulud, K. N., et al. (2024). Global perspectives on unmanned aerial vehicles technology in social sciences: applications, innovations, and future research directions. Geocarto Int. 39 (1), 2413547. doi:10.1080/10106049.2024.2413547
Khelifi, A., Ciccone, G., Altaweel, M., Basmaji, T., and Ghazal, M. (2021). Autonomous Service drones for multimodal detection and monitoring of archaeological sites. Appl. Sci. 11 (21), 10424. doi:10.3390/app112110424
Kim, H., Lee, S. B., and Min, K. S. (2017). Shoreline change analysis using airborne LiDAR bathymetry for coastal monitoring. J. Coast. Res. 79 (sp1), 269–273. doi:10.2112/SI79-055.1
Kinzel, P. J., Legleiter, C. J., and Grams, P. E. (2021). Field evaluation of a compact, polarizing topo-bathymetric lidar across a range of river conditions. River Res. Appl. 37 (4), 531–543. doi:10.1002/rra.3771
Koganti, T., Ghane, E., Martinez, L. R., Iversen, B. V., and Allred, B. J. (2021). Mapping of agricultural subsurface drainage systems using unmanned aerial vehicle imagery and ground penetrating radar. Sensors 21 (8), 2800. doi:10.3390/s21082800
Kovanič, Ľ., Topitzer, B., Peťovský, P., Blišťan, P., Gergeľová, M. B., and Blišťanová, M. (2023). Review of photogrammetric and lidar applications of UAV. Appl. Sci. 13 (11), 6732. doi:10.3390/app13116732
Lague, D., Brodu, N., and Leroux, J. (2013). Accurate 3D comparison of complex topography with terrestrial laser scanner: application to the Rangitikei canyon (N-Z). ISPRS J. Photogrammetry Remote Sens. 82, 10–26. doi:10.1016/j.isprsjprs.2013.04.009
Lan, X., Wang, C., Lv, B., Li, J., Zhang, M., and Zhang, Z. (2023). 3D point cloud stitching for object detection with wide FoV using roadside LiDAR. Electronics 12 (3), 703. doi:10.3390/electronics12030703
Laporte-Fauret, Q., Marieu, V., Castelle, B., Michalet, R., Bujan, S., and Rosebery, D. (2019). Low-cost UAV for high-resolution and large-scale coastal dune change monitoring using photogrammetry. J. Mar. Sci. Eng. 7 (3), 63. doi:10.3390/jmse7030063
Lee, I., Lee, J., and Ge, L. (2009). Comparison of terrestrial laser scanner with digital aerial photogrammetry for extracting ridges in the rice paddies. Surv. Rev. - Surv. Rev. 41, 253–267. doi:10.1179/003962609X390148
Lefsky, M. A., Cohen, W. B., Parker, G. G., and Harding, D. J. (2002). Lidar Remote Sensing for Ecosystem Studies: lidar, an emerging remote sensing technology that directly measures the three-dimensional distribution of plant canopies, can accurately estimate vegetation structural attributes and should be of particular interest to forest, landscape, and global ecologists. BioScience 52 (1), 19–30. doi:10.1641/0006-3568(2002)052[0019:LRSFES]2.0.CO;2
Li, C., Chen, H., Xiong, Y., Chen, Y., Zhao, S., Duan, J., et al. (2022). Analysis of Chinese typical lane change behavior in car–truck heterogeneous traffic flow from UAV view. Electronics 11 (9), 1398. doi:10.3390/electronics11091398
Li, T., Zhang, B., Cheng, X., Westoby, M. J., Li, Z., Ma, C., et al. (2019). Resolving fine-scale surface features on polar sea ice: a first assessment of UAS photogrammetry without ground control. Remote Sens. 11 (7), 784. doi:10.3390/rs11070784
Li, T., Zhang, B., Xiao, W., Cheng, X., Li, Z., and Zhao, J. (2020). UAV-based photogrammetry and LiDAR for the characterization of ice morphology evolution. IEEE J. Sel. Top. Appl. Earth Observations Remote Sens. 13, 4188–4199. doi:10.1109/JSTARS.2020.3010069
Lin, Y.-C., Cheng, Y.-T., Zhou, T., Ravi, R., Hasheminasab, S. M., Flatt, J. E., et al. (2019). Evaluation of UAV LiDAR for mapping coastal environments. Remote Sens. 11 (24), 2893. doi:10.3390/rs11242893
Linder, W. (2009). Digital photogrammetry: a practical course. Em digital photogrammetry: a practical course. doi:10.1007/978-3-540-92725-9
Liu, X.-Y., Jia, R.-S., Liu, Q.-M., Zhao, C.-Y., and Sun, H.-M. (2019). Coastline extraction method based on convolutional neural networks—a case study of jiaozhou bay in qingdao, China. IEEE Access 7, 180281–180291. doi:10.1109/ACCESS.2019.2959662
Liu, Y., Wang, X., Ling, F., Xu, S., and Wang, C. (2017). Analysis of coastline extraction from landsat-8 OLI imagery. Water 9 (11), 1–26. doi:10.3390/w9110816
Mandlburger, G., Hauer, C., Wieser, M., and Pfeifer, N. (2015). Topo-bathymetric LiDAR for monitoring river morphodynamics and instream habitats—a case study at the pielach river. Remote Sens. 7 (5), 6160–6195. doi:10.3390/rs70506160
Manfreda, S., McCabe, M. F., Miller, P. E., Lucas, R., Pajuelo Madrigal, V., Mallinis, G., et al. (2018). On the use of unmanned aerial systems for environmental monitoring. Remote Sens. 10 (4), 641. doi:10.3390/rs10040641
McGlone, J. C. (2013). Manual of photogrammetry. 6 edn. Bethesda, MA: American Society for Photogrammetry and Remote Sensing, 1318.
Moniz, P. J., Pasternack, G. B., Massa, D. A., Stearman, L. W., and Bratovich, P. M. (2020). Do rearing salmonids predictably occupy physical microhabitat? J. Ecohydraulics 5 (2), 132–150. doi:10.1080/24705357.2019.1696717
Morsy, S., Shaker, A., and El-Rabbany, A. (2018). Using multispectral airborne LiDAR data for land/water discrimination: a case study at lake ontario, Canada. Appl. Sci. 8 (3), 349. doi:10.3390/app8030349
Neitzel, F., and Klonowski, J. (2011). Mobile 3D mapping with a low-cost UAV system. Em ISPRS - international Archives of the photogrammetry, remote Sensing and spatial information sciences: 22 (p. 44). doi:10.5194/isprsarchives-XXXVIII-1-C22-39-2011
Niedzielski, T. (2018). Applications of unmanned aerial vehicles in geosciences: introduction. Pure Appl. Geophys. 175 (9), 3141–3144. doi:10.1007/s00024-018-1992-9
Nunes, L. J. R., Raposo, M. A. M., and Gomes, C. J. P. (2020). The Impact of Tourism Activity on Coastal Biodiversity: A Case Study at Praia da Cova Redonda (Algarve—Portugal). Environments 7 (10), 88. doi:10.3390/environments7100088
Nurminen, K., Karjalainen, M., Yu, X., Hyyppä, J., and Honkavaara, E. (2013). Performance of dense digital surface models based on image matching in the estimation of plot-level forest variables. ISPRS J. Photogrammetry Remote Sens. 83, 104–115. doi:10.1016/j.isprsjprs.2013.06.005
Obu, J., Lantuit, H., Grosse, G., Günther, F., Sachs, T., Helm, V., et al. (2017). Coastal erosion and mass wasting along the Canadian Beaufort Sea based on annual airborne LiDAR elevation data. Geomorphology 293, 331–346. doi:10.1016/j.geomorph.2016.02.014
Oniga, V.-E., Loghin, A.-M., Macovei, M., Lazar, A.-A., Boroianu, B., and Sestras, P. (2024). Enhancing LiDAR-UAS derived digital terrain models with hierarchic robust and volume-based filtering approaches for precision topographic mapping. Remote Sens. 16 (1), 78. doi:10.3390/rs16010078
Pe’eri, S., and Long, B. (2011). LIDAR technology applied in coastal studies and management. J. Coast. Res. 2011 (10062), 1–5. doi:10.2112/SI_62_1
Pinton, D., Canestrelli, A., Moon, R., and Wilkinson, B. (2023). Estimating ground elevation in coastal dunes from high-resolution UAV-LIDAR point clouds and photogrammetry. Remote Sens. 15 (1), 226. doi:10.3390/rs15010226
Pix4D (2024). Pix4D. Available at: https://www.pix4d.com/pt.
Qian, R., Lai, X., and Li, X. (2022). 3D object detection for autonomous driving: a survey. Pattern Recognit. 130, 108796. doi:10.1016/j.patcog.2022.108796
Qiao, G., Yuan, X., Florinsky, I., Popov, S., He, Y., and Li, H. (2023). Topography reconstruction and evolution analysis of outlet glacier using data from unmanned aerial vehicles in Antarctica. Int. J. Appl. Earth Observation Geoinformation 117, 103186. doi:10.1016/j.jag.2023.103186
Rodríguez-Molina, J., Corpas, B., Hirsch, C., and Castillejo, P. (2021). SEDIBLOFRA: a blockchain-based, secure framework for remote data transfer in unmanned aerial vehicles. IEEE Access 9, 121385–121404. doi:10.1109/ACCESS.2021.3106379
Rosen, R., Boschert, S., and Sohr, A. (2018). Next Generation Digital Twin: Öko-System für simulationsbasierte Lösungen im Betrieb. Atp. Mag. 60 (10), 86–96. doi:10.17560/atp.v60i10.2371
Ruzgienė, B., Berteška, T., Gečyte, S., Jakubauskienė, E., and Aksamitauskas, V. Č. (2015). The surface modelling based on UAV Photogrammetry and qualitative estimation. Measurement 73, 619–627. doi:10.1016/j.measurement.2015.04.018
Saltveit, S. J., Brabrand, Å., Juárez, A., Stickler, M., and Dønnum, B. O. (2020). The impact of hydropeaking on juvenile Brown trout (Salmo trutta) in a Norwegian regulated river. Sustainability 12 (20), 8670. doi:10.3390/su12208670
Sanz-Ablanedo, E., Chandler, J. H., Rodríguez-Pérez, J. R., and Ordóñez, C. (2018). Accuracy of unmanned aerial vehicle (UAV) and SfM photogrammetry survey as a function of the number and location of ground control points used. Remote Sens. 10 (10), 1606. doi:10.3390/rs10101606
Shahbazi, M., Sohn, G., Théau, J., and Menard, P. (2015). Development and evaluation of a UAV-photogrammetry system for precise 3D environmental modeling. Sensors 15 (11), 27493–27524. doi:10.3390/s151127493
Shahriari, M., Delbari, M., Afrasiab, P., and Pahlavan-Rad, M. R. (2019). Predicting regional spatial distribution of soil texture in floodplains using remote sensing data: a case of southeastern Iran. CATENA 182, 104149. doi:10.1016/j.catena.2019.104149
Sharma, M., Garg, R. D., Badenko, V., Fedotov, A., Min, L., and Yao, A. (2021). Potential of airborne LiDAR data for terrain parameters extraction. Quat. Int. 575 (576), 317–327. doi:10.1016/j.quaint.2020.07.039
Shojaei, A., Mohammadzadeh, J., and Khamforoosh, K. (2020). Combining differential algorithm with node centrality criterion for increasing the accuracy of high dimension data selection. Int. J. Grid Distributed Comput. 13 (2).
Šiljeg, A., Marinović, R., Domazetović, F., Jurišić, M., Marić, I., Panđa, L., et al. (2023). GEOBIA and vegetation indices in extracting olive tree canopies based on very high-resolution UAV multispectral imagery. Appl. Sci. 13 (2), 739. doi:10.3390/app13020739
Smaczyński, M., Medyńska-Gulij, B., and Halik, Ł. (2020). The land use mapping techniques (including the areas used by pedestrians) based on low-level aerial imagery. ISPRS Int. J. Geo-Information 9 (12), 754. doi:10.3390/ijgi9120754
Song, Q., Gao, X., Song, Y., Li, Q., Chen, Z., Li, R., et al. (2023). Estimation and mapping of soil texture content based on unmanned aerial vehicle hyperspectral imaging. Sci. Rep. 13 (1), 14097. doi:10.1038/s41598-023-40384-2
Sousa, J. J., Toscano, P., Matese, A., Di Gennaro, S. F., Berton, A., Gatti, M., et al. (2022). UAV-based hyperspectral monitoring using push-broom and snapshot sensors: a multisite assessment for precision viticulture applications. Sensors 22 (17), 6574. doi:10.3390/s22176574
Sozzi, M., Kayad, A., Gobbo, S., Cogato, A., Sartori, L., and Marinello, F. (2021). Economic comparison of satellite, plane and UAV-acquired NDVI images for site-specific nitrogen application: observations from Italy. Agronomy 11 (11), 2098. doi:10.3390/agronomy11112098
Swain, S. R., Chakraborty, P., Panigrahi, N., Vasava, H. B., Reddy, N. N., Roy, S., et al. (2021). Estimation of soil texture using Sentinel-2 multispectral imaging data: an ensemble modeling approach. Soil Tillage Res. 213, 105134. doi:10.1016/j.still.2021.105134
Sylvester, C., and Macon, C. (2011). Coastal remote sensing through sensor and data fusion with CZMIL. OCEANS’11 MTS/IEEE KONA, 1–5. doi:10.23919/OCEANS.2011.6107170
Szostak, M., and Pająk, M. (2023). LiDAR point clouds usage for mapping the vegetation cover of the “fryderyk” mine repository. Remote Sens. 15 (1), 201. doi:10.3390/rs15010201
Szypuła, B. (2024). Accuracy of UAV-based DEMs without ground control points. GeoInformatica 28 (1), 1–28. doi:10.1007/s10707-023-00498-1
Telli, K., Kraa, O., Himeur, Y., Ouamane, A., Boumehraz, M., Atalla, S., et al. (2023). A comprehensive review of recent research trends on unmanned aerial vehicles (UAVs). Systems 11 (8), 400. doi:10.3390/systems11080400
Terrasolid (2024). Terrasolid—software for point cloud and image processing. Available at: https://terrasolid.com/.
Vaze, J., Teng, J., and Spencer, G. (2010). Impact of DEM accuracy and resolution on topographic indices. Environ. Model. and Softw. 25 (10), 1086–1098. doi:10.1016/j.envsoft.2010.03.014
Vélez, S., Vacas, R., Martín, H., Ruano-Rosa, D., and Álvarez, S. (2022). High-resolution UAV RGB imagery dataset for precision agriculture and 3D photogrammetric reconstruction captured over a pistachio orchard (pistacia vera L.) in Spain. Data 7 (11), 157. doi:10.3390/data7110157
Wang, H., Zhang, Y., Li, P., and Zha, X. (2013). A method of deriving DEM from airborne LiDAR points cloud data. 2013 Jt. urban remote Sens. event (JURSE), 13–16. doi:10.1109/JURSE.2013.6550654
Wang, J., Liu, Z., Yu, H., and Li, F. (2017). Mapping spartina alterniflora biomass using LiDAR and hyperspectral data. Remote Sens. 9 (6), 589. doi:10.3390/rs9060589
Watts, A. C., Ambrosia, V. G., and Hinkley, E. A. (2012). Unmanned aircraft systems in remote sensing and scientific research: classification and considerations of use. Remote Sens. 4 (6), 1671–1692. doi:10.3390/rs4061671
Woo, D. K., Song, H., and Kumar, P. (2019). Mapping subsurface tile drainage systems with thermal images. Agric. Water Manag. 218, 94–101. doi:10.1016/j.agwat.2019.01.031
Wu, J., Tian, Y., Xu, H., Yue, R., Wang, A., and Song, X. (2019a). Automatic ground points filtering of roadside LiDAR data using a channel-based filtering algorithm. Opt. and Laser Technol. 115, 374–383. doi:10.1016/j.optlastec.2019.02.039
Wu, J., Xu, H., Zheng, Y., Zhang, Y., Lv, B., and Tian, Z. (2019b). Automatic vehicle classification using roadside LiDAR data. Transp. Res. Rec. 2673 (6), 153–164. doi:10.1177/0361198119843857
Xu, S., Ye, N., and Xu, S. (2019). A new method for shoreline extraction from airborne LiDAR point clouds. Remote Sens. Lett. 10 (5), 496–505. doi:10.1080/2150704X.2019.1569277
Žabota, B., and Kobal, M. (2021). Accuracy assessment of UAV-photogrammetric-derived products using PPK and GCPs in challenging terrains: in search of optimized rockfall mapping. Remote Sens. 13 (19), 3812. doi:10.3390/rs13193812
Zang, Y., Yang, B., Li, J., and Guan, H. (2019). An accurate TLS and UAV image point clouds registration method for deformation detection of chaotic hillside areas. Remote Sens. 11 (6), 647. doi:10.3390/rs11060647
Zeybek, M., Taşkaya, S., Elkhrachy, I., and Tarolli, P. (2023). Improving the spatial accuracy of UAV platforms using direct georeferencing methods: an application for steep slopes. Remote Sens. 15 (10), 2700. doi:10.3390/rs15102700
Keywords: accuracy evaluation, extreme topography, image processing, LiDAR, orthophoto, surface modeling, UAV-photogrammetry
Citation: Ruzgienė B, Kuklienė L, Kuklys I, Jankauskienė D and Lousada S (2025) The use of kinematic photogrammetry and LiDAR for reconstruction of a unique object with extreme topography: a case study of Dutchman’s Cap, Baltic seacoast, Lithuania. Front. Remote Sens. 6:1397513. doi: 10.3389/frsen.2025.1397513
Received: 07 August 2024; Accepted: 10 January 2025;
Published: 06 February 2025.
Edited by:
Parvez Rana, Natural Resources Institute Finland (Luke), FinlandReviewed by:
Zixiang Gao, University of Calgary, CanadaCopyright © 2025 Ruzgienė, Kuklienė, Kuklys, Jankauskienė and Lousada. This is an open-access article distributed under the terms of the Creative Commons Attribution License (CC BY). The use, distribution or reproduction in other forums is permitted, provided the original author(s) and the copyright owner(s) are credited and that the original publication in this journal is cited, in accordance with accepted academic practice. No use, distribution or reproduction is permitted which does not comply with these terms.
*Correspondence: Sérgio Lousada, c2xvdXNhZGFAc3RhZmYudW1hLnB0
Disclaimer: All claims expressed in this article are solely those of the authors and do not necessarily represent those of their affiliated organizations, or those of the publisher, the editors and the reviewers. Any product that may be evaluated in this article or claim that may be made by its manufacturer is not guaranteed or endorsed by the publisher.
Research integrity at Frontiers
Learn more about the work of our research integrity team to safeguard the quality of each article we publish.