- 1Department of Plant, Food, and Environmental Sciences, Dalhousie University, Truro, NS, Canada
- 2Center of Geographic Sciences, Nova Scotia Community College, Lawrencetown, NS, Canada
Nitrogen (N) fertilization is a major management requirement for wild blueberry fields. Its presence and estimation can be difficult given the perennial and heterogeneous nature of the plant, low N requirement, and residual N effects, resulting in the frequent over-application of N, excessive canopy growth, and resulting reduction in berry yields. Therefore, this study aimed to estimate nitrogen content and growth parameters using remote sensing approaches. Three trials were established in three commercial fields in Nova Scotia, Canada. An RCBD with 5 replicates and a plot size of 6 × 8 m with a 2 m buffer was used. Treatments consisted of 0, 20, 40, 60, and 100 kg N ha-1 of fertilizer. Using a DJI Matrice 300 UAV mounted with an RGB and a multispectral camera, aerial measurements were collected at 30 m altitude. Several field measurements including leaf nitrogen content (LNC), leaf area, floral bud numbers, stem height, and yield were conducted. Several vegetation indices (VIs) were computed for each plot, and correlation and regression analyses were conducted. Results indicated that treatments with high nitrogen rates had correspondingly high LAI measurements with the 60 kg ha-1 rate achieving the best growth parameters compared to the other treatments. LNC, LAI, and berry yield estimations using VIs [green leaf index (GLI), green red vegetation index (GRVI), and visible atmospheric red index (VARI)] produced significantly positive R2 values of 0.43, 0.48, and 0.30 respectively. Results from this study illustrated the potential of using VIs to estimate LNC, LAI, and berry yield parameters. It was established that the near-infrared VIs are the most effective in estimating differences in nitrogen rates, making them suitable for use in prescription maps for N fertilization applications.
1 Introduction
The wild blueberry also called the sweet lowbush blueberry, is an economically important ericaceous shrub that thrives in northeastern America. Commercial wild blueberry fields consist of naturally occurring populations of Vaccinium angustifolium (the predominate species found in fields) and V. myrtilloides (Percival et al., 2003; Marty et al., 2022). Wild blueberry plants grow naturally as they are not planted but are managed through regular management practices. Wild blueberries are calcifuge plants with a large root and rhizome network that allows them to thrive in harsh conditions (Thyssen et al., 2006). The lowbush plant is resilient, lending itself to periodic pruning, and can thrive in a range of soil types, particularly acidic soils (Percival and Sanderson, 2004). Several management practices are used, including pruning, fertilizer application, pest control, and pollination (Percival and Sanderson, 2004). Upright plant shoots are periodically pruned in alternate years; thus, fields are managed on a 2-year system with a biennial production cycle of a sprout year and a cropping year (Percival and Sanderson, 2004). Thriving in low-nutrient and varied soil types, fertilizers are used to boost nutrient levels for plant growth and development and to replenish the nutrients associated with the previous crop. However, concerns about its carbon footprint and resulting greenhouse gas emissions persist.
Fertilizer application is a regular practice used in wild blueberry production with fertilizers being frequently comprised of ammonium sulfate (AS: 21-0-0), diammonium phosphates (DAP) (18-46-0), and potash (0-0–60), and the application rate is generally based on N (Gumbrewicz and Calderwood, 2022). The low nutrient status of the different soil fertility types has been demonstrated to cause a positive plant response upon fertilizer application (Percival and Sanderson, 2004; Smagula and Hepler, 1978) established that the application of N (43 kg ha-1) in the form of urea increased flower buds and berry yield by 22% and 25% respectively, over the unfertilized plots. An increase in stem length, floral buds, number of berries, and yield were observed in Maine upon application of N (20–98 kg ha-1) rates (Smagula and Hepler, 1978) with excess application causing negative effects.
Several studies on the wild blueberry fields have demonstrated many effects of fertilization (Percival and Sanderson, 2004; Marty et al., 2019) demonstrated that inorganic fertilization increased yield by 70%. Percival et al. (2003) established that multiple fertilizer applications increased stem density, leaf nitrogen content, dry weight, and harvestable yield, however, the poor nature of soils coupled with environmental losses through leaching, erosion, volatilization, and greenhouse gas emissions raises concerns. Commercial wild blueberry fields are mostly patchy or discontinuous, thus in resolving these challenges, producers are trying to avoid a broad application of fertilizers. Despite this traditional approach, producers are now moving away from the blanket application to spot application of N depending on the spatial variability of plant coverage and the potential to determine N levels using remote sensing techniques. Development activities in agriculture have led to the proliferation of remote sensing techniques in plant growth monitoring and prediction (Anku et al., 2023; Hussain et al., 2020). With the adoption of a non-destructive approach, sensors such as the red-green-blue (RGB), multispectral, hyperspectral, and thermal sensors have been utilized (Maes and Steppe, 2019). In addition, several studies have demonstrated the use of remote sensing techniques in estimating plant growth and development in the fields. Näsi et al. (2018) estimated biomass and nitrogen (N) content of barley and grass using an unmanned aerial vehicle (UAV). The study confirmed a high regression value of 0.89 and established a relationship between these parameters. This approach and technique have also been utilized in several crops including wheat, rice, and soybean (Zhou et al., 2017). However, little has been done to utilize the multispectral sensors in estimating N content and determining canopy characteristics in wild blueberry fields. A recent remote sensing study on the blueberry field, investigated the sensitivity and impact of management practices on two vegetation indices, normalized difference vegetation index (NDVI) and normalized difference red edge (NDRE) using a multispectral sensor (Marty et al., 2022). The study established significant differences in vegetation indices (VIs) between different fertilizer treatments as against different management practices. However, the study did not consider the estimation of growth parameters rather it focused on NDVI and NDRE sensitivity to management practices. Nevertheless, the study suggests the potential of using VIs to differentiate between fertilizer treatments, which was the basis for this study.
Given that the potential and application of remote sensing techniques have been demonstrated in different crops, a considerable lack of information still exists in wild blueberries. This study was conducted to primarily provide an approach to test the effect of fertilizer treatments on vegetation indices using RGB and multispectral sensors and to further monitor and estimate growth parameters in the wild blueberry field. Therefore, the objectives of this study were to (i) determine the effect of fertilization on spatial variation using vegetation indices, and (ii) estimate berry yield, LAI, and LNC using a predictive model.
2 Materials and methods
2.1 Study area
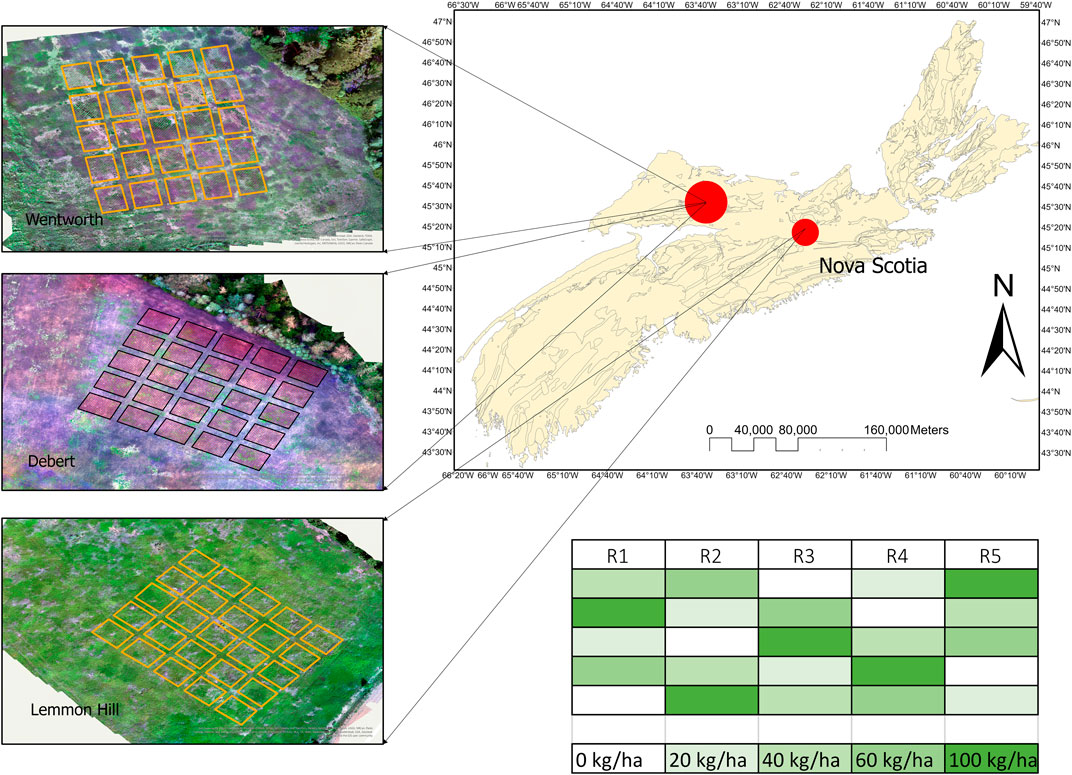
Three (3) experimental trials were set up in the 2021 field season to conduct this experiment (Figure 1). These experimental trials were set up in Debert (DB), Lemmon Hill (LH), and Wentworth (WW), all within Nova Scotia, Canada, with their geographic coordinates (45.444,445°N, −63.450,472°W), (45.190,360°N, −62.872,721°W), and (45.642,327°N, −63.611,735°W) respectively (Figure 1). Despite Nova Scotia being noted for Queens soil type, the three sites, DB, LH, and WW are specifically classified as orthic humo-ferric podzol. Therefore, since all three sites are within this zone, they share the same soil type (Nowland and MacDougalI, 2013). These trials started during the plant’s vegetative growth phase and carried through the crop phase until harvest.
The locations for these trials were wide apart, thus, the distance between DB and LH was about 84 km, DB to WW location was about 43.5 km, and WW to LH was about 111 km. These fields varied in plant density, topography, and weather conditions which introduced some uniqueness to this study. Unlike DB and LH locations, the trial set up at the WW location was on a low-lying field with high moisture content. Generally, the trial set up at the WW location had a low plant density as compared to the trials set up in the DB and LH locations. Weed patches and bare areas varied across the three locations, with WW having the barest areas with weeds. Apart from fertilizer application, all other management practices were carried out during the trials.
2.2 Experimental set-up and treatment applications
A randomized complete block experimental design (RCBD) with 5 replications, 5 treatments, and a plot size of 6 × 8 m with 2-m buffers between plots was used. Treatments consisted of (i) an untreated control (0 kg N ha-1), (ii) 20 kg N ha-1, (iii) 40 kg N ha-1, (iv) 60 kg N ha-1, and (v) 100 kg N ha-1 using ammonium sulfate (AS) as an N source. Treatment applications consisted of two compound fertilizers, a 16-21-8 (partially wet) fertilizer was provided as a base which was uniformly applied, and then a 21-0-0 (dry) fertilizer was later applied to the fields according to the treatment rates in spring during the sprouting phase of the plants when the shoots were about to develop. These granular fertilizers were applied 2 weeks apart on the 12th and 26th of June 2021, using a fertilizer spreader (Lesco High Wheel Fertilizer Spreader). To achieve uniform application, the spreader made three passes along the 6 m stretch of each plot with the deflector guard lowered to minimize applications to areas outside of the plots.
2.3 Field data collection
Field assessment on stem density was determined by collecting 4 samples of wild blueberry stems per plot using a 30 × 30 cm quadrant. The leaf area was determined for each plot using the LiCor 3100C leaf area meter. An SS1 Sunscan Canopy Analysis System (Delta T Devices) was used to remotely collect leaf area index (LAI) measurements from each plot. Physical plant characteristics such as stem length, vegetative buds, and floral bud numbers were collected. Leaf tissue N content from each plot was determined using the protocol of Maqbool et al. (2012).
2.4 Plant sampling and nitrogen content analysis
Fresh leaf samples were collected from each treatment plot on 5th August 2021. The leaf tissue samples were oven-dried for 36 h at 60°C. The dry leaf tissues were ground into a fine powdery sample using the mortar and pestle. The ground leaf samples were stored in dry labeled falcon tubes and analyzed for N content using the LECO CNS-1000 elemental auto-analyzer (LECO Corp., St. Joseph, MI). The analysis of the LNC followed the procedure of Rutherford et al. (2007).
2.5 Aerial image acquisition and sensory platform
The DJI Matrice 300 UAV was equipped with a 3-band Zenmuse X5, a 16-Mega-Pixel (MP) digital camera, and a 5-band Micasense RedEdge™ 3 multispectral camera to collect reflected lights. Reflected lights from the RGB camera were collected at blue (448), green (548), and red (650) wavelengths while that of the Micasense was collected at blue (475), green (560), red (668), red edge (717), and near-infrared (840) wavelength (Figure 2). The Matrice Pro 300 was flown at 30 m height with a frontal image overlap of 75% and a side image overlap of 70%.
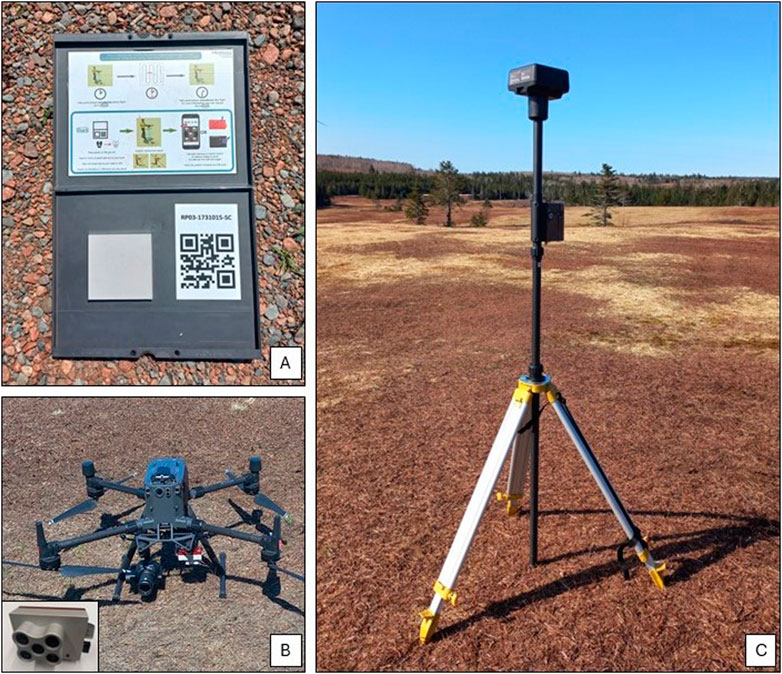
Figure 2. UAV remote sensing tools. (A) Calibration panel, (B) DJI Matrice 300 UAV fitted with a micasense camera, and (C) A Real Time Kinematic receiver.
Flights on all 3 sites were conducted on 29th July 2021 and 4th August 2021, about 2 months after treatments were applied to plots. Imageries were acquired under clear conditions to minimize the effects of clouds, wind, and rain. Calibration, corrections, and adjustments were carried out to minimize the effects of distortion on the quality of the imagery obtained. Depending on whether the camera was RGB or Micasense, the imagery was acquired at approximately 0.7 or 2.2 cm/px spatial resolution, respectively.
2.5.1 Image processing
The raw images collected with the two sensors were processed using the online Solvi platform (https://solvi.ag/features) and this consisted of (i) upload of raw images and ground control points (GCPs), (ii) stitching images into composite orthomosaic images, (iii) digitizing individual plots, (iv) computation and extraction of vegetation indices and (v) export of data file for analysis. All analyses of data were performed using SAS software (version 9.4, SAS Institute, Inc., Cary, NC).
2.6 Vegetation indices
A vegetation index (VI) is a mathematical computation obtained using wavebands. Therefore, these index values are important ways by which information can be sourced from remote sensing data. In this research, different vegetation indices (VIs) were examined (Table 1). The capacity to compute a vegetation index is determined by the sensor’s available bands, so it varies based on whether a camera is RGB or multispectral, allowing the computation of certain VIs while others may not be possible. This study focused on the RGB sensor but utilized the multispectral sensor in other aspects.
2.7 Statistical analysis
Combined analyses were initially performed, however, results revealed significant differences between treatments, and locations, thus the individual locations were analyzed separately. To determine which of the treatment applications had the highest concentration of N, an analysis of variance (ANOVA) was performed, and a least significant difference (LSD) was used for multiple means comparison to differentiate between treatments for significant effects. All conditions for statistical testing were performed, thus normality tests, constant variance, and independence of the error terms were conducted in Minitab. To establish relationships, correlation analysis on aerial data, LAI, LNC, vegetative and productive yield components, and harvestable berry yield was conducted.
After the correlation analyses, simple linear regression (SLR) analyses were conducted, where VIs were used as dependent variables while the other parameters were set as independent variables. The statistical analyses were performed using SAS (version 9.4), Minitab (version 19, Minitab Inc.), and Excel software. Specifically, SAS was utilized for ANOVA analysis using the PROC GLIMMIX procedure, Minitab for correlation and regression analysis, and Excel for graphical designs.
3 Results
3.1 Effect of nitrogen rates on vegetation indices
Results showed some significant differences between the various vegetation indices, thus the different nitrogen rates influenced vegetation indices (Table 2). Across the 7 VIs, it was observed that the high nitrogen rates, 60 and 100 kg N ha-1, were significantly different from the other treatments. It was established that there was a significant variation between the different rates of the near-infrared (NIR) VIs when compared to the visible (VIS) light VIs. Therefore, differentiation was established between 100 and 60 kg N ha-1 under the NIR indices compared to the VIS-VIs (Table 2).

Table 2. Analysis of variance on the effects of nitrogen rates on vegetation indices from the Wentworth location [7th October 2021].
3.2 Leaf nitrogen content
Results showed no significant differences in the LNC of treatment trials between two locations, Debert and Wentworth, however, a significant treatment effect (p < 0.05) was observed at the Lemmon Hill location (Table 3). There were no significant differences in treatment effects between the DB and WW locations. Treatment 5 (100 kg N ha-1) exhibited the highest mean LNC value compared to all the other treatments in all 3 locations (Table 3). At the LH location, treatment 5 (100 kg N ha-1) was significantly different from all the other treatments. Although there was no significance in some locations, there were mean differences in the LNC values. It was observed that LNC values from the LH location were almost twice what was contained in the leaves from both DB and WW, however the mean values between WW and DB were almost similar.

Table 3. Analysis of variance (ANOVA) on LNC in blueberry leaf tissues treated with 4 rates of mixed compound fertilizers at three (3) experimental sites [Collected: 5th August 2021, sample (n) = 25].
3.3 Relationship between vegetation indices and growth parameters
3.3.1 Correlation analysis
Pearson’s correlation between the various parameters showed significant relationships between specific parameters which were consistent for all three locations (Table 4). Across all 3 locations, significant correlations were established between plant density (PD) and leaf area index (LAI), as well as between leaf nitrogen content (LNC) and green leaf index (GLI). In DB and WW locations, a significant correlation was observed between LAI and GLI. At the WW location, yield showed a significant positive correlation with LNC and GLI, while PD showed a significant positive correlation with GLI. Therefore, a positive relationship was established between PD and LAI, and this translates to an increase in GLI. These results suggest the possibility for some predictions to be achieved; thus, PD can be used in predicting LAI, GLI can be used to predict LNC and GLI can be used in predicting LAI (Table 4). At the WW location, yield showed a significant correlation with all three VIs. A subsequent assessment of all 3 locations (Table 5) revealed a strong correlation between stem length and the various VIs, while floral bud numbers displayed significantly low correlation values. Despite the relatively low correlation values, floral bud numbers showed strong correlations with stem length (Table 5). Stem length and VIs observed a significantly high number of correlations at WW and DB locations with almost no significant stem length correlation occurring at the LH location (Table 5).

Table 4. Pearson’s correlation between yield, plant density (PD), leaf area index (LAI), leaf nitrogen content (LNC), and vegetation indices (GLI, GRVI, and VARI).
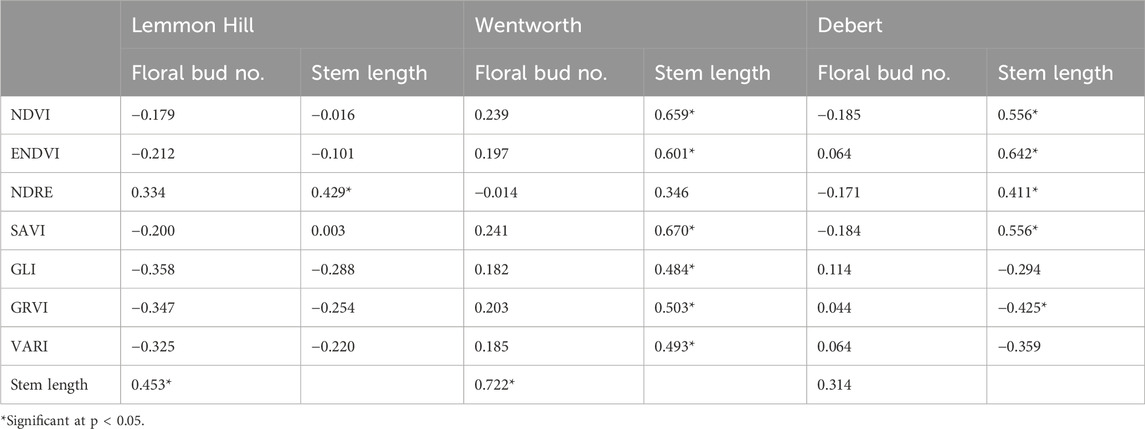
Table 5. Correlation analysis on stem length and floral bud numbers from all three (3) locations of the wild blueberry fields [Data collected on December 21, 2021].
3.3.2 Relationship between LNC, PD, LAI, and yield
The impact and relationship between plant density, leaf area index (LAI), and LNC among other parameters can help predict yield. Generally, the LH and DB locations showed weak but mixed effects on yield, with both positive and negative relationships, respectively. However, at the WW location, there was a moderately strong positive relationship between yield and LNC (Figure 3B). In contrast, there were no significant relationships between yield and LAI across all the 3 locations (Figure 3D–F). The relationship between plant density and yield was positively weak at all 3 locations (Figure 3G–I) with no significant (p > 0.05) relationship between the parameters.
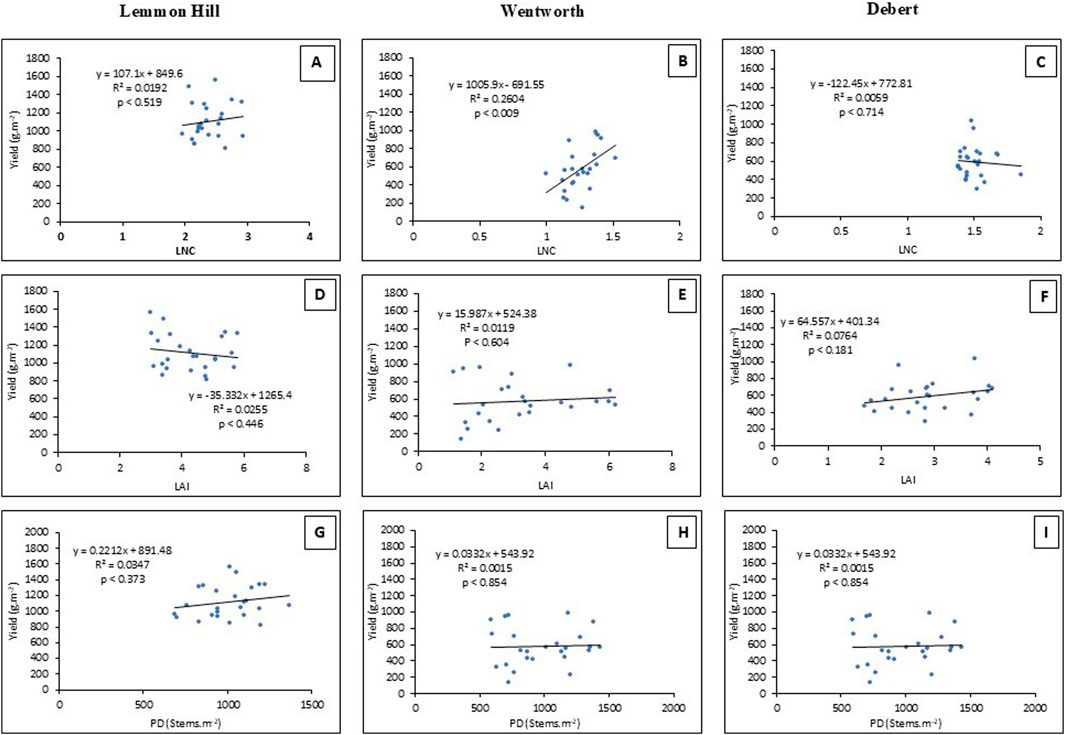
Figure 3. Linear regression analysis on yield using Nitrogen content, leaf area index (LAI), and plant density (PD) from the three trial sites, Lemmon Hill, Wentworth, and Debert. Yield and leaf nitrogen content (LNC) (A–C), Yield and LAI (D–F), Yield and PD (G–I), and PD and VARI (J-L) define the different graphs. The relevance of a relationship was assessed using a 5% significance level.
3.3.3 Relationship between vegetation indices and growth parameters
Results showed that plant density and LAI had a positively strong and significant (p < 0.05) relationship across all three locations (Figure 4A–C). This suggests that an increase in the number of plant stands per unit area increases the total leaf coverage per area of the plant. Furthermore, the relationship between plant density and GLI was positive at both WW and DB locations with a significantly negative relationship at the LH locations (Figure 4D–F). This suggests that, as the number of stems increased, the green leaf index value also increased. The relationship between PD and GRVI was a non-significantly weak relationship, which was across all three locations (Figure 4G–I). and the same was observed for PD and VARI, (Figure 4J–I).
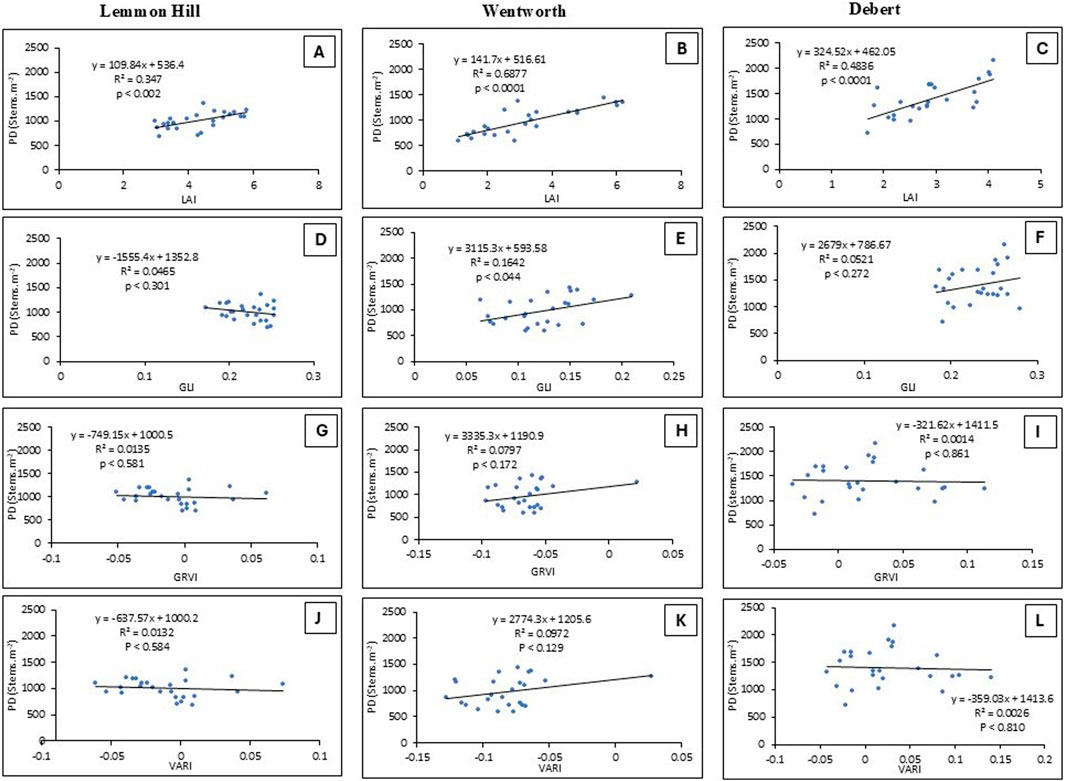
Figure 4. Relationship between plant density, LAI, and VIs from the three trial locations. Plant density (PD) and leaf area index (LAI) (A–C), PD and GLI (D–F), PD and GRVI (G–I), and PD and VARI (J-L), defines the different graphs. The relevance of a relationship was assessed using a 5% significance level.
A moderately strong significant relationship was observed between LNC and GLI (Figure 5A–B) across the three locations. The relationship between the two parameters at LH and DB was negative with WW showing a positive relationship (Figure 5A–B). The relationship between LNC and GRVI showed a moderate but positively strong relationship at WW (R2 = 0.43), with the other two locations observing weak relationships (Figure 5D–F). Similar relationships between LNC and GRVI were observed between VARI and LNC (Figure 5G–I).
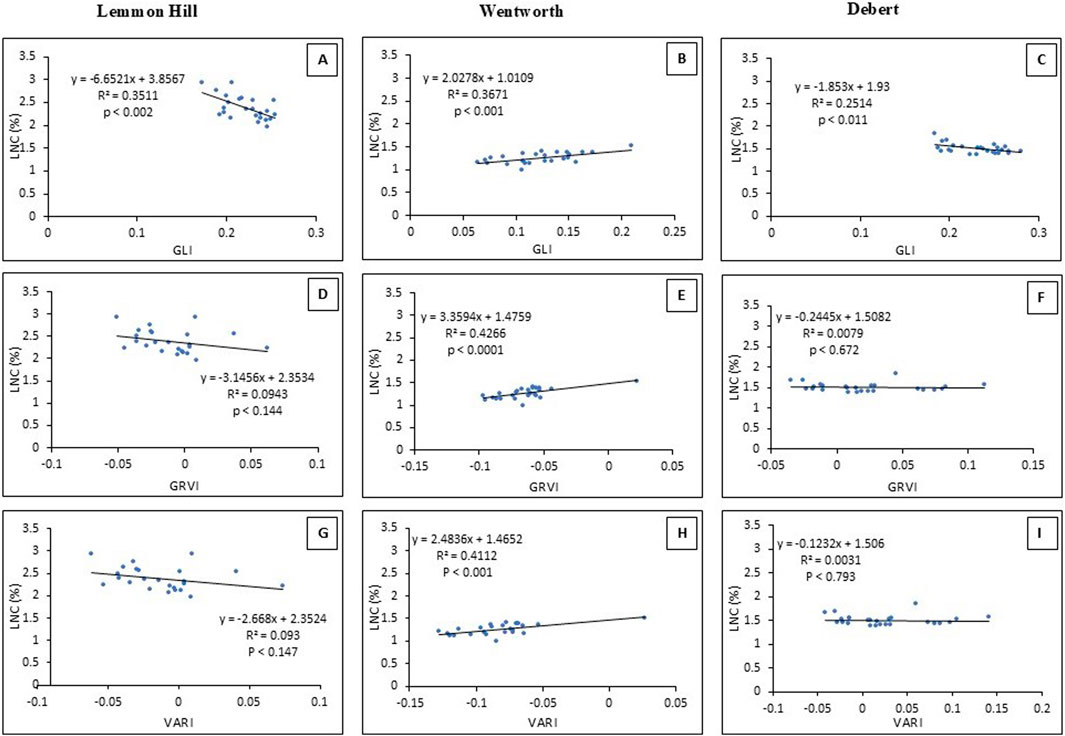
Figure 5. Relationship between Leaf Nitrogen Content (LNC) and vegetation indices at three trial sites, Lemmon Hill, Wentworth, and Debert. LNC and GLI (A–C), LNC and GRVI (D–F), and LNC and VARI (G–I) define the different graphs. The relevance of a relationship was assessed using a 5% significance level.
A moderate but significantly positive relationship was observed between LAI and GLI at both WW and DB locations, with a negative relationship at LH (Figure 6A–C). This implied that an increase in the leaf coverage area of the plant increases the green leaf index value. Furthermore, the relationship between GRVI and LAI was moderately strong and significantly (p < 0.017) positive at the WW location, with DB and LH showing very weak relationships (Figure 6D–F). The relationship between VARI and LAI was similar to that of GRVI and LAI (Figure 6G–I). Finally, there were strong relationships between yield and the VIs (GLI, GRVI, and VARI) (Figure 7B, E, H) at the WW location but weak relationships at the DB and LH locations were observed. Except for slight changes in the R2 and p-values, the dynamics between GRVI, VARI, and yield were similar across the 3 locations.
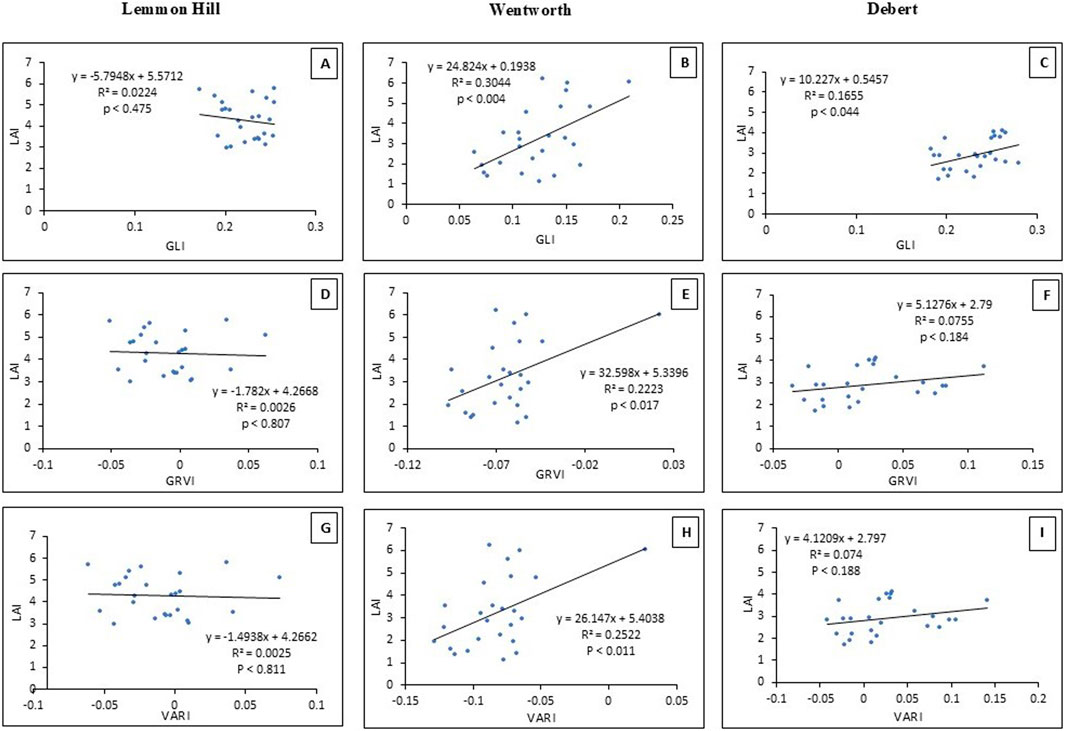
Figure 6. Relationship between Leaf area index (LAI) and vegetation indices at three trial sites Lemmon Hill, Wentworth, and Debert. LAI and GLI (A–C), LAI and GRVI (D–F), and LAI and VARI (G–I) define the different graphs. The relevance of a relationship was assessed using a 5% significance level.
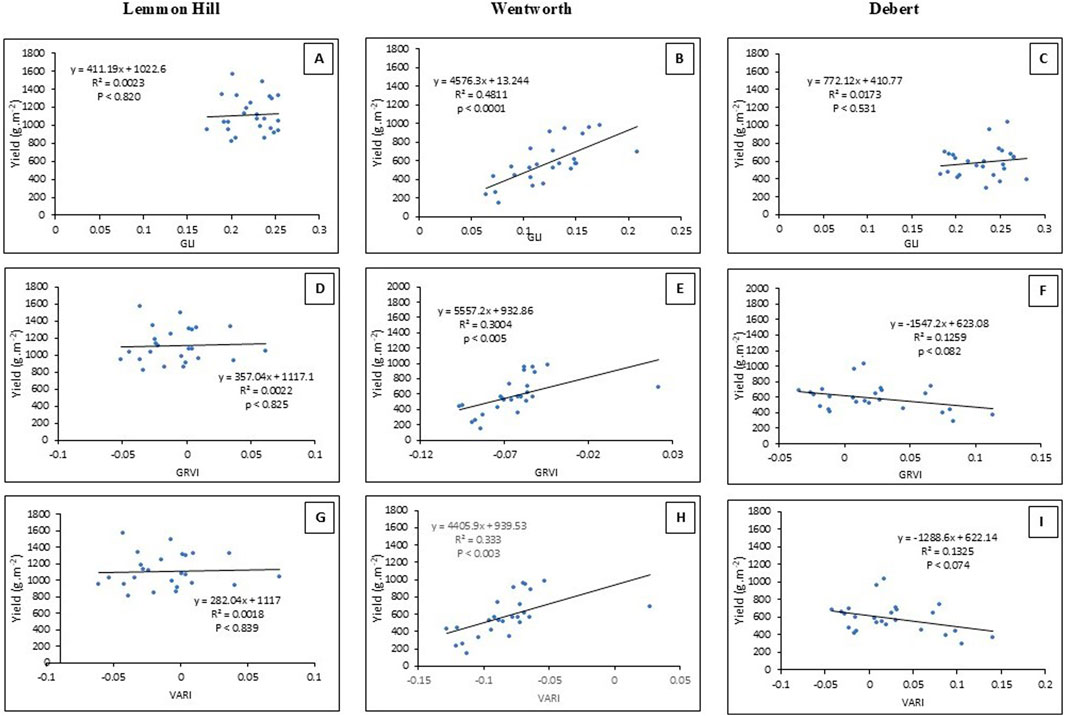
Figure 7. Relationship between harvestable yield and 3 vegetation indices GLI, GRVI, and VARI using the coefficient of determination values at three trial sites Lemmon Hill, Wentworth, and Debert. Yield and GLI (A–C), yield and GRVI (D–F), and yield and VARI (G–I), define the different graphs. The relevance of a relationship was assessed using a 5% significance level.
4 Discussion
High and low nitrogen fertilization in wild blueberries can pose several challenges given the heterogeneous nature, spatially variable coverage, and residual N effects of the plant. Therefore, a poor estimate of the plant’s requirement may lead to an over-application of the fertilizer product which hinders efforts to reduce the accumulation of greenhouse gas emissions. Therefore, this study was carried out to determine (i) N treatment effects on vegetation indices, and (ii) remote estimation of leaf nitrogen content (LNC) and productive yield parameters on the wild blueberry fields using vegetation indices (VIs). The results shown provide a broad but specific insight into the remote assessment of nitrogen fertilization in the wild blueberry field. Indications from these results suggest lots of consistencies, but few variations among the nitrogen treatments across all three locations.
4.1 Effects of nitrogen fertilization on vegetation indices
The effect of nitrogen fertilization on vegetation indices appeared inconsistent, however, significant differences established at the WW location and the other two locations (Table 3) indicate a considerable effect of nitrogen fertilization on VIs. This finding is consistent with the results of Caturegli et al. (2016) who stated that colour intensity has a significant correlation with nitrogen fertilization which further correlates with vegetation indices, specifically NDVI. Nitrogen contributes significantly to plant growth as it constitutes the chlorophyll molecule content impacting the green pigments of the plant (do Amaral et al., 2019). Therefore, it is expected that the higher the nitrogen content in a plant the greener the plant will be, translating to a high VI value. This finding further supports the conclusion of Caturegli et al. (2016) that strong correlations can be established between LNC and VIs. However, some inconsistencies observed at the two other locations can be attributed to locational differences like moist soil conditions observed in some areas. Granular fertilizers can achieve maximum effects over time when the granules are dissolved in moisture to maximize their mobility and effects on the plant. Therefore, considering the 3 locations, the WW location been a low-lying field with a relatively high moisture content, allowed for easy breakdown of the granular fertilizers, compared to both DB and LH locations which experienced drier conditions on an uphill field. Additionally, the sensitivity of the red, blue, and green (RGB) reflectance values may have contributed to the indifference between treatments, thus the NIR-VIs reflected the difference in nitrogen rates (Table 3). The relative difference between an RGB light camera and a multispectral camera may have influenced the data collected (Kokhan and Vostokov, 2020; Lu et al., 2021). Based on previous works with both data sets, it was evident that VIs computed using multispectral images are usually sensitive and have higher index values than RGB images. Therefore, their ability to determine areas of a field with high nitrogen levels can be utilized in the development of prescription maps for nitrogen application.
4.2 Remote estimations of plant growth parameters and yield
This study focused on specific vegetation indices (VIs), the green leaf index (GLI), Green red vegetation index (GRVI), and the Visible atmospheric red index (VARI). These VIs showed moderately high correlation values with the normalized difference vegetation index (NDVI), consistent with the work of Yamamoto et al. (2005). However, the predictability of yield using LNC seemed variable and inconsistent, as negative correlations were observed in two locations. Conversely, the estimation of LNC using VIs seemed positive which contrasts with Bourguignon (2007) who states the inadequacy of NDVI in quantifying N levels assessed in wild blueberries. From this assertion, this may suggest a difficulty in generally using VIs in nutrient level estimations in wild blueberries. However, this finding was consistent with the study of Maqbool et al. (2012), who used spectral reflectance bands to establish relationships, unlike this study which used vegetation indices to establish relationships. Though VIs consists of spectral data (wavelength regions), there are limitations as to the light regions included in the computational process. Maqbool et al. (2012) established the green peak region as the best for estimating foliar N. Therefore, this suggests the potential of these VIs (GLI, GRVI, and VARI) from the light-visible regions to estimate LNC. Notwithstanding, there is still potential for the other light bands to generate good estimations. The moderately high coefficient of determination (R2) values observed at the WW location explain about 36.7%, 42.7%, and 41.12% variability of the data. Though better estimations can be achieved, this difficulty can be attributed to several reasons including the level of variability of the field, image resolution, and the non-homogenous nature of the canopy (Daughtry et al., 2000). This finding also agreed with the work of Lu et al. (2021), who showed that LNC was accurately estimated in maize (R2 = 0.76) using VIs. While strong correlations have been found between VIs and LNC in other crops (Caturegli et al., 2016; Lu et al., 2021), variability in the plant canopy, crop features, and developmental stage, background noise, topographic effects, vegetation density, and other intrinsic factors may account for the difficulty to estimate nitrogen levels (Daughtry et al., 2000; Kokhan and Vostokov, 2020). This study further agreed with Bourguignon, (2007), whose work focused on the ability to estimate N, P, and K levels in wild blueberry leaf tissues using specific hyperspectral technologies. It was observed that the possibility of estimating N and P levels using hyperspectral technology was high yet varied for some instruments (Bourguignon, 2007).
It could be determined that as the number of stems increases, plant leaf coverage area increases, and this should directly impact the vegetation index values. Therefore, the relationship established between LAI and GLI may suggest the impact on VIs (Figure 6B). Variability in leaf pigment and colour intensity becomes a significant contributor to this phenomenal difference. This is because the absorption and reflectance peak for the different pigments vary, thus making it difficult for estimated values to be determined (Sims and Gamon, 2002). The wild blueberry field is not an ever-green shrub but has a prevalence of other pigments including anthocyanins that influence the vegetation index values. Furthermore, leaf colour variation affects the portion of light by either being highly absorbed or highly reflected, and this affects vegetation indices (Marty et al., 2022). However, there is great potential for the predictability of LAI using GLI or a near-infrared vegetation index, as these indices are not directly affected by changes in leaf colour. Percival et al. (2003) found a strong correlation between LAI and NIR bands. Therefore, NIR vegetation indices may yield stronger relationships compared to VIS vegetation indices.
As the number of stems increased, GLI was expected to increase, giving a strong positive relationship. However, the highest R2 value of the three locations explains only about 16.42% of the data, which was relatively low compared to other studies (Lu et al., 2021). However, PD showed a strong correlation (R = 0.83) and regression (R2 = 0.69) with LAI. Unlike other row crops, plant density is highly variable across the wild blueberry field, and this impacts LAI and possibly vegetation index values. This confirms the variability levels observed in the wild blueberry fields in terms of population and clonal differences which affect leaf area (Kinsman, 1993). The findings from this study agreed with Lu et al. (2021) that LAI can be estimated by VIs, despite their description of LAI as canopy cover.
Yield estimations using vegetation indices have proved challenging on the wild blueberry field, despite the successes reported in other crops (Hussain et al., 2020). This finding agreed with the study of Barai et al. (2021) who assessed the effects of drought on wild blueberry production. The study reports that it is difficult and variable to predict harvestable yield in a wild blueberry field using VIs. This was because several variables constantly change along the production cycle making it difficult to use VIs in determining harvestable berry yield. For example, some factors such as pollination and competitive pressures including fungal diseases and weeds negate yield, and these vary across the field and season. However, Maqbool et al. (2012) used optimum multiple narrow reflectance data in the prediction of harvestable yield, with very high regression values (R2 = 0.79). Considering the slight difference in the approaches used, Maqbool et al. (2012) advocated that consideration should be given to issues of sensor resolution which affects the levels of detail to be gotten from the field. Despite the inconsistency in yield prediction, correlation values from this study (Table 4) have proven positive and have shown potential in yield predictions.
In conclusion, this study examined the effect of nitrogen on vegetation indices. The study further examined the potential to estimate growth parameters using vegetation indices. We have demonstrated that vegetation indices can be used to estimate some growth parameters on the wild blueberry field, specifically LNC, and LAI. Whereas the estimation of PD and berry yield looks variable, there is therefore a need for further studies into this aspect. Furthermore, findings from the WW location strongly point to a future application and adoption of liquid fertilizers on the wild blueberry field considering the challenges of the granular fertilizer products. It was established that GLI, GRVI, and VARI vegetation indices from an RGB sensor showed strong potential in estimating growth parameters, however, it is expected that NIR-VIs should outperform visible light VIs. Based on this assessment, the NIR-VIs established differences between the different nitrogen rates, unlike the VIS-VIs. Thus, it is recommended that further study should be conducted to consider predictions and estimations using a multispectral sensor.
Data availability statement
The original contributions presented in the study are included in the article/supplementary material, further inquiries can be directed to the corresponding author.
Author contributions
KA: Data curation, Formal Analysis, Investigation, Methodology, Software, Visualization, Writing–original draft. DP: Conceptualization, Funding acquisition, Methodology, Project administration, Resources, Supervision, Visualization, Writing–review and editing. RL: Supervision, Writing–review and editing. BH: Formal Analysis, Supervision, Writing–review and editing. MV: Formal Analysis, Supervision, Writing–review and editing.
Funding
The author(s) declare that financial support was received for the research, authorship, and/or publication of this article. This was a project of the Canadian Wild Blueberry Industry Research and Development Institute (CWBIRDI) funded through the Atlantic Canada Agriculture Research and Innovation Initiative and the Natural Sciences and Engineering Research Council project (Grant Number: CRDPJ 507170-16). Additional funding support came from the Bragg Group of Food Companies.
Acknowledgments
I sincerely acknowledge the contributions of the research assistants, who helped with flying the drone among other field activities. This manuscript was developed from an original document (a thesis chapter).
Conflict of interest
The authors declare that the research was conducted in the absence of any commercial or financial relationships that could be construed as a potential conflict of interest.
Publisher’s note
All claims expressed in this article are solely those of the authors and do not necessarily represent those of their affiliated organizations, or those of the publisher, the editors and the reviewers. Any product that may be evaluated in this article, or claim that may be made by its manufacturer, is not guaranteed or endorsed by the publisher.
References
Anku, K. E., Percival, D. C., Rajasekaran, L. R., Heung, B., and Vankoughnett, M. (2023). Phenological assessment of the wild blueberry field using an unmanned aerial vehicle. Acta Hortic., 35–42. doi:10.17660/ActaHortic.2023.1357.6
Barai, K., Tasnim, R., Hall, B., Rahimzadeh-Bajgiran, P., and Zhang, Y.-J. (2021). Is drought increasing in Maine and hurting wild blueberry production? Climate 9 (12), 178. doi:10.3390/cli9120178
Bourguignon, C. (2007). The feasibility of determining foliar nitrogen, phosphorus, and potassium contents using existing hyperspectral technologies in wild blueberry fields. Dalhous. Univ. N. S. Agric. Coll.
Caturegli, L., Corniglia, M., Gaetani, M., Grossi, N., Magni, S., Migliazzi, M., et al. (2016). Unmanned aerial vehicle to estimate nitrogen status of turfgrasses. PLOS ONE 11 (6), e0158268. doi:10.1371/journal.pone.0158268
Daughtry, C. (2000). Estimating corn leaf chlorophyll concentration from leaf and canopy reflectance. Remote Sens. Environ. 74 (2), 229–239. doi:10.1016/S0034-4257(00)00113-9
do Amaral, E. S., Vieira Silva, D., Dos Anjos, L., Schilling, A. C., Dalmolin, Â. C., and Mielke, M. S. (2019). Relationships between reflectance and absorbance chlorophyll indices with RGB (Red, Green, Blue) image components in seedlings of tropical tree species at nursery stage. New For. 50 (3), 377–388. doi:10.1007/s11056-018-9662-4
Gumbrewicz, R., and Calderwood, L. (2022). Fertility effects on blueberry gall midge (Diptera: cecidomyiidae) in wild blueberry (Vaccinium angustifolium; ericales: ericaceae). J. Econ. Entomology 115 (3), 783–791. doi:10.1093/jee/toac043
Hussain, S., Gao, K., Din, M., Gao, Y., Shi, Z., and Wang, S. (2020). Assessment of UAV-onboard multispectral sensor for non-destructive site-specific rapeseed crop phenotype variable at different phenological stages and resolutions. Remote Sens. 12 (3), 397. doi:10.3390/rs12030397
Kinsman, G. B. (1993). The history of the lowbush blueberry industry in Nova Scotia, 1950-1990. Blueberry Producers’ Assoc. N. S.
Kokhan, S., and Vostokov, A. (2020). Using vegetative indices to quantify agricultural crop characteristics. J. Ecol. Eng. 21 (4), 120–127. doi:10.12911/22998993/119808
Lu, J., Cheng, D., Geng, C., Zhang, Z., Xiang, Y., and Hu, T. (2021). Combining plant height, canopy coverage and vegetation index from UAV-based RGB images to estimate leaf nitrogen concentration of summer maize. Biosyst. Eng. 202, 42–54. doi:10.1016/j.biosystemseng.2020.11.010
Maes, W. H., and Steppe, K. (2019). Perspectives for remote sensing with unmanned aerial vehicles in precision agriculture. Trends Plant Sci. 24 (2), 152–164. doi:10.1016/j.tplants.2018.11.007
Maqbool, R., Percival, D. C., Adl, M. S., Zaman, Q. U., and Buszard, D. (2012). In situ estimation of foliar nitrogen in wild blueberry using reflectance spectra. Can. J. Plant Sci. 92 (6), 1155–1161. doi:10.4141/cjps2011-203
Marty, C., Khare, S., Rossi, S., Lafond, J., Boivin, M., and Paré, M. C. (2022). Detection of management practices and cropping phases in wild lowbush blueberry fields using multispectral UAV data. Can. J. Remote Sens. 48 (3), 469–480. doi:10.1080/07038992.2022.2070144
Marty, C., Lévesque, J.-A., Bradley, R. L., Lafond, J., and Paré, M. C. (2019). Lowbush blueberry fruit yield and growth response to inorganic and organic N-fertilization when competing with two common weed species. PLOS ONE 14 (12), e0226619. doi:10.1371/journal.pone.0226619
Näsi, R., Viljanen, N., Kaivosoja, J., Alhonoja, K., Hakala, T., Markelin, L., et al. (2018). Estimating biomass and nitrogen amount of barley and grass using UAV and aircraft based spectral and photogrammetric 3D features. Remote Sens. 10 (7), 1082. Article 7. doi:10.3390/rs10071082
Nowland, J. L., and MacDougalI, J. I. (2013). Soils of cumberland county nova scotia. N. S. Soils Surv. Report No. 17.
Percival, D., and Sanderson, K. (2004). Main and interactive effects of vegetative-year applications of nitrogen, phosphorus, and potassium fertilizers on the wild blueberry. Small Fruits Rev. 3 (1–2), 105–121. doi:10.1300/J301v03n01_11
Percival, D. C., Janes, D. E., Stevens, D. E., and Sanderson, K. (2003). Impact of multiple fertilizer applications on plant growth, development, and yield of wild lowbush blueberry (Vaccinium angustifolium Aiton). Acta Hortic. 626, 415–421. doi:10.17660/ActaHortic.2003.626.57
Rutherford, P. M., McGill, W. B., Arocena, J. M., and Figueiredo, C. T. (2007). in Soil sampling and methods of analysis: total Nitrogen. Editors M. R. Carter, and E. G. Gregorich (Germany: CRC Press).
Sims, D. A., and Gamon, J. A. (2002). Relationships between leaf pigment content and spectral reflectance across a wide range of species, leaf structures, and developmental stages. Remote Sens. Environ. 81 (2–3), 337–354. doi:10.1016/S0034-4257(02)00010-X
Smagula, J. M., and Hepler, P. R. (1978). Comparison of urea and sulfur-coated urea as nitrogen sources for lowbush blueberries growing on a colton gravelly loamy Sand1. J. Am. Soc. Hortic. Sci. 103 (6), 818–820. doi:10.21273/JASHS.103.6.818
Thyssen, G., Percival, D., Burton, D., and Sanderson, K. (2006). Effect of nitrogen fertilizers on ammonia volatilization in wild blueberry production. Can. J. Plant Sci. 86 (Special Issue), 1383–1386. doi:10.4141/P06-121
Yamamoto, H., Hashimoto, T., Seki, M., Yuda, N., Mitomi, Y., and Yoshioka, H. (2005). Evaluation of GLI reflectance and vegetation indices with MODIS products. Available at: https://apps.dtic.mil/sti/pdfs/ADA449784.pdf.
Keywords: nitrogen fertilizers, remote sensing, vegetation indices, multispectral sensor, growth parameters
Citation: Anku KE, Percival DC, Lada R, Heung B and Vankoughnett M (2024) Remote estimation of leaf nitrogen content, leaf area, and berry yield in wild blueberries. Front. Remote Sens. 5:1414540. doi: 10.3389/frsen.2024.1414540
Received: 09 April 2024; Accepted: 23 October 2024;
Published: 18 November 2024.
Edited by:
Hongmei Li, CABI, ChinaReviewed by:
Krishan K. Verma, Guangxi Academy of Agricultural Sciences, ChinaJose Eduardo, University of Western São Paulo, Brazil
Copyright © 2024 Anku, Percival, Lada, Heung and Vankoughnett. This is an open-access article distributed under the terms of the Creative Commons Attribution License (CC BY). The use, distribution or reproduction in other forums is permitted, provided the original author(s) and the copyright owner(s) are credited and that the original publication in this journal is cited, in accordance with accepted academic practice. No use, distribution or reproduction is permitted which does not comply with these terms.
*Correspondence: Kenneth Eteme Anku, S2VubmV0aC5hbmt1QGRhbC5jYQ==
 Kenneth Eteme Anku
 David C. Percival1
 Rajasekaran Lada
 Brandon Heung
 Mathew Vankoughnett