
94% of researchers rate our articles as excellent or good
Learn more about the work of our research integrity team to safeguard the quality of each article we publish.
Find out more
ORIGINAL RESEARCH article
Front. Remote Sens., 17 August 2021
Sec. Atmospheric Remote Sensing
Volume 2 - 2021 | https://doi.org/10.3389/frsen.2021.719610
This article is part of the Research TopicDSCOVR EPIC/NISTAR: 5 years of Observing Earth from the first Lagrangian PointView all 24 articles
After March 2020 the range of scattering angle for DSCOVR EPIC and NISTAR has been substantially increased with its upper bound reaching 178°. This provides a unique opportunity to observe bi-directional effects of reflectance near backscattering directions. The dependence of the top-of-atmosphere (TOA) reflectance on scattering angle is shown separately for ocean and land areas, for cloudy and clear pixels, while cloudy pixels are also separated into liquid and ice clouds. A strong increase of TOA reflectance towards backscattering direction is reported for all components (except cloudless areas over ocean). The observed increase of reflectance is confirmed by cloud and vegetation models. The strongest correlation between TOA reflectance and scattering angle was found near IR where contribution from vegetation dominates. Surface Bidirectional Reflectance Factor (BRF) acquired by DSCOVR EPIC and Terra MISR sensors over the Amazon basin is used to demonstrate the bi-directional effects of solar zenith and scattering angles on variation of reflected radiation from rainforest.
The Deep Space Climate Observatory (DSCOVR) was launched in February 2015 to a Sun-Earth Lagrange-1 (L1) orbit, approximately 1.5 million kilometers from Earth towards the Sun (Marshak et al., 2018). In addition to continuous solar wind measurements for accurate space weather forecasting, it observes the full, sunlit disk of Earth from a unique vantage point with the two instruments: the Earth Polychromatic Imaging Camera (EPIC) and the NIST (National Institute of Standards and Technology) Advanced Radiometer (NISTAR). The Earth-observing geometry of the EPIC instrument is characterized by a scattering angle between 168° and 178°. The left panel in Figure 1 displays a time series of the scattering angle1 from June 2015.
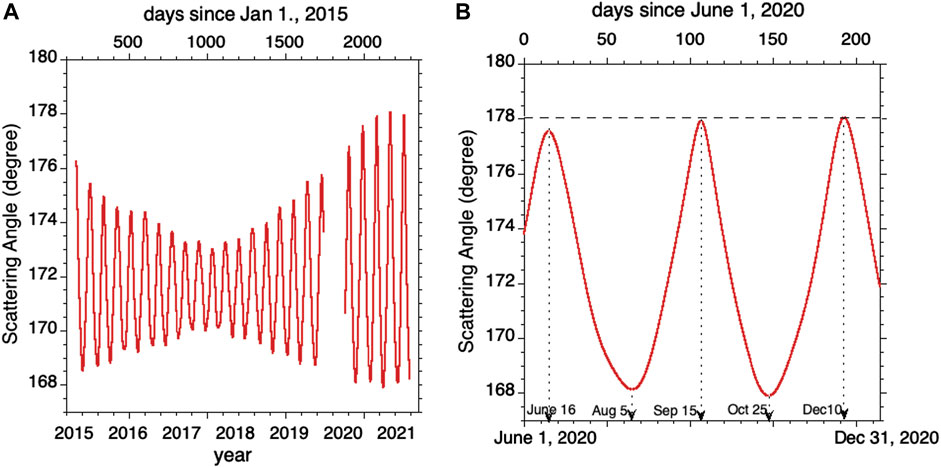
FIGURE 1. Time series of the scattering angle between solar beam and sensor directions. (A) Scattering angle is plotted versus UTC since June 12, 2015, the first day DSCOVR became operational. (B) Zoom. Scattering angle is plotted for days between June 1 and December 31, 2020. Horizontal dash line indicates scattering angle of 178°; in December 10 scattering angle is 178.05° (SEV = 1.95°).
EPIC and NISTAR have continuously operated until June 27, 2019, when the spacecraft was placed in an extended safe hold due to degradation of the inertial navigation unit (gyros). Since then, a software patch was developed and uploaded to the spacecraft that relies only on the star tracker for spacecraft attitude determination. DSCOVR returned to full operations on March 2, 2020. Since then, DSCOVR has been able to maintain a ∼0.02° pointing accuracy, similar to the pre-gyro-failure operations, that keeps Earth fully in the field-of-view of EPIC. Both EPIC and NISTAR calibrations performed since March 2020, show no change in the performance or calibration constants of the instruments.
As Figure 1 shows, after March 2020 the range of scattering angle has substantially increased towards backscattering reaching 178° (see the right panel). This provides a unique opportunity to study angular variations of the Earth reflectivity in the vicinity of the backscattering direction.
It is well-known that radiation reflected from rough surface exhibits a sharp increase in the backscattering direction (e.g., Hapke, 1963; Lumme and Bowell E, 1981; Kuusk, 1991). Therefore one should expect an enhance reflection near backscattering in the Earth observations from the DSCOVR platform.
This paper studies the effect of scattering angles near the backscattering directions on Earth reflectivity using EPIC and NISTAR data with emphases on understanding mechanisms contributing to this phenomenon. After description of the data used in the paper (Data Used), we focus on the EPIC observed radiance emanating from ocean and land, clear, and cloudy skies; in addition, ice and water clouds are treated separately (EPIC Observations). In Simulations EPIC cloud and vegetation reflectances are simulated with models. A special attention is paid to Amazonian forests where EPIC results near backscattering are complemented with Multi-Angle Imaging SpectroRadiometer (MISR) observations (Forest BRF). Finally, NISTAR Observations discusses NISTAR data near backscattering and Summary summarizes the results.
EPIC provides 10 narrow band spectral images at 317, 325, 340, 388, 443, 551, 680, 688, 764, and 780 nm of the entire sunlit face of Earth using a 2048 x 2048 pixel CCD (Marshak et al., 2018). The sampling size is about 8 km at nadir (near the center of the image), which effectively increases to 10 km when EPIC’s point spread function is included. The pixel size increases as the reciprocal of cosine of latitude. To reduce transmission time for EPIC data for maximizing time cadence, the images of all wavelength channels, except 443 nm, have been reduced to 1024 x 1024 pixels.
We use DSCOVR EPIC L1B data product that provides radiance data every 65–110 min (NASA/LARC/SD/ASDC-L1B, 2018c). The radiance data are in engineering units of counts per second. The EPIC team provides a calibration factor to convert measurements given in counts per second into the TOA reflectance (Geogdzhayev and Marshak, 2018; Geodzhayev et al., 2021).
We also use surface Bidirectional Reflectance Factor (BRF) derived from DSCOVR EPIC (NASA/LARC/SD/ASDC-MAIAC, 2018b) and MISR onboard low-earth-orbiting Terra satellite (NASA/LARC/SD/ASDC-MISR, 1999). BRF describes surface reflective properties in the absence of atmosphere and is defined as the ratio of the surface-reflected radiance to radiance reflected from an ideal Lambertian surface into the same beam geometry and illuminated by the same mono-directional beam (Martonchik et al., 2000; Schaepman-Strub et al., 2006). The MISR sensor views the Earth’s surface with nine cameras simultaneously. MISR has a ground track repeat cycle every 16 days and achieves global coverage every 9 days. In an equatorial zone it can measure surface reflected radiation over a wide range of the phase angle (Bi et al., 2015). Unlike DSCOVR EPIC, the Terra MISR samples reflectance over a 360 km wide swath at 10:30 am local solar time.
NISTAR measures the outgoing radiation from the Earth integrated over the entire face of Earth in four broadband channels: total radiation (Band A, 0.2–100 μm), total solar reflected (Band B, 0.2–4 μm), NIR solar reflected (Band C, 0.7–4 μm) and photodiode (0.2–1.1 μm). These measurements provide data for estimating planet’s energy budget (Trenberth et al., 2009; Su et al., 2020).
To study the effect of scattering angle on the reflection from sunlit Earth, we first focus on the EPIC 780 nm band in the year of 2020. Figure 2 shows the total reflectance at 780 nm between September 17 and December 10 when scattering angle first drops from 178° to 168° and then increases back to 178°. We use here only 2 months of data in order to limit the effect of seasonality on total reflectance. Left panel shows global average TOA reflectance together with averages over ocean and land. Middle and right panels illustrate mean TOA reflectances accumulated over ocean and land under clear sky and cloudy conditions. The increase of both clear and cloudy reflectances with scattering angle (especially for large angles close to the backscattering direction) is clearly seen.
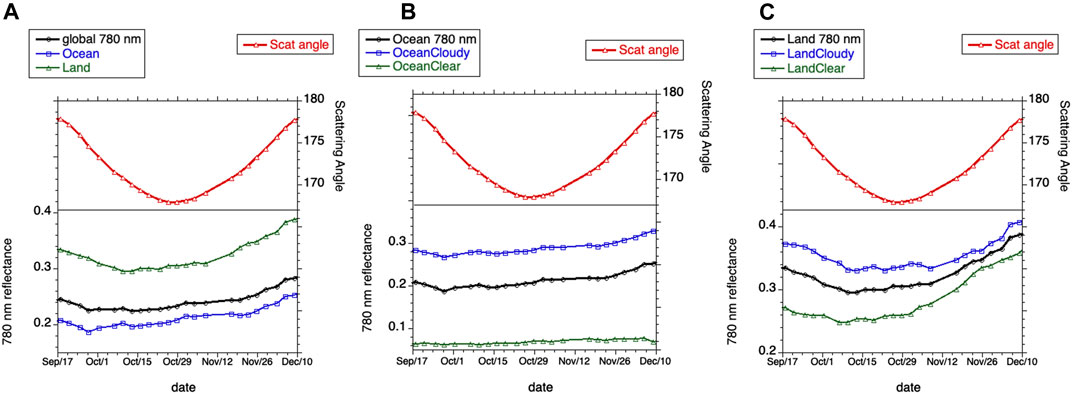
FIGURE 2. Time series of scattering angle and top-of-atmosphere (TOA) reflectance at 780 nm between September 17 and December 10, 2020. To reduce noise, 3 days averages are used here. (A) Global TOA reflectance and its components accumulated over ocean and land; (B) TOA reflectance accumulated over cloudy and clear sky pixels over ocean. (C) TOA reflectance accumulated over cloudy and clear sky pixels over land.
To better illustrate the dependence of TOA reflectance on scattering angles, Figure 3 provides scatter plots of reflectances vs. scattering angles for the whole year 2020. With exception of cloud-free regions over ocean (lower dots in the middle panel), a positive correlation between TOA reflectance and scattering angle is clearly seen. The strongest correlation is over land that includes both cloudy and clear pixels. These observations suggest that radiation reflected from clouds and land exhibits a strong sensitivity towards scattering angle near backscattering directions.
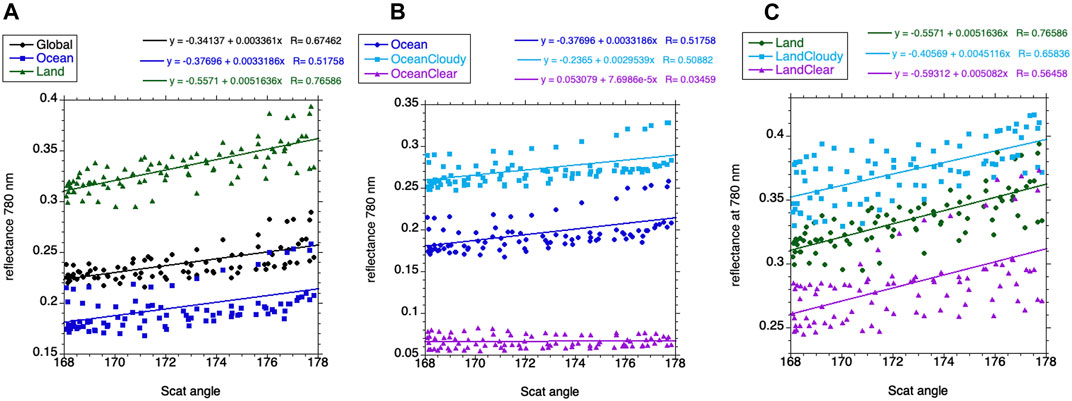
FIGURE 3. Scatter plots of reflectance at 780 nm vs. scattering angle for the whole 2020 (from February 26 to December 20, 2020). (A) Global reflectance together with ocean and land reflectances; (B) Ocean reflectance together with ocean cloudy and ocean clear reflectances; (C) Land reflectance together with land cloudy and land clear reflectances.
Such correlations are also valid for all EPIC visible spectral bands. Figure 4 (see also Table 1) illustrates scatter plots of TOA reflectance vs. scattering angle for four different wavelengths, 443, 551, 680, and 780 nm, corresponding to the 168° to 178° peak-to-peak amplitude of the scattering angle between October 25 and December 14, 2020 (for clarity, see the right panel in Figure 2). As expected, the correlation over land is much stronger than that over ocean for all spectral bands. Table 1 provides the values of slopes of reflectance versus scattering angle relationships for land and ocean separately for all visible and NIR EPIC bands from October 25 to December 14. The highest value (0.0088) corresponds to the reflection from land at 780 nm.

FIGURE 4. Scatter plots of spectral reflectance vs. scattering angle for the last increase of scattering angle in 2020 (from October 25 to December 14). Global reflectance together with ocean and land reflectances. (A) 443 nm; (B) 551 nm; (C) 680 nm; (D) 780 nm.
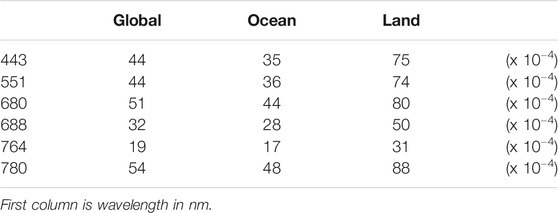
TABLE 1. Slope of correlation between reflectance and scattering angle from October 22 to December 14, 2020 for Earth global, ocean, and land.
It is also of interest to study variations in TOA reflectance of ice and liquid clouds separately2 as viewing direction approaches the backscattering direction. Figure 5 illustrates TOA reflectance for the whole year 2020. Total fraction of cloudy pixels is about 60%, of which liquid clouds account for about 47% (13% over land and 34% over ocean) and ice clouds for 13% (9.3% over land and 3.4% over ocean). Liquid clouds dominate over ocean while ice clouds over land. The trend towards the backscattering direction in reflectance from cloudy pixels is very similar to the global one shown on Figure 5.
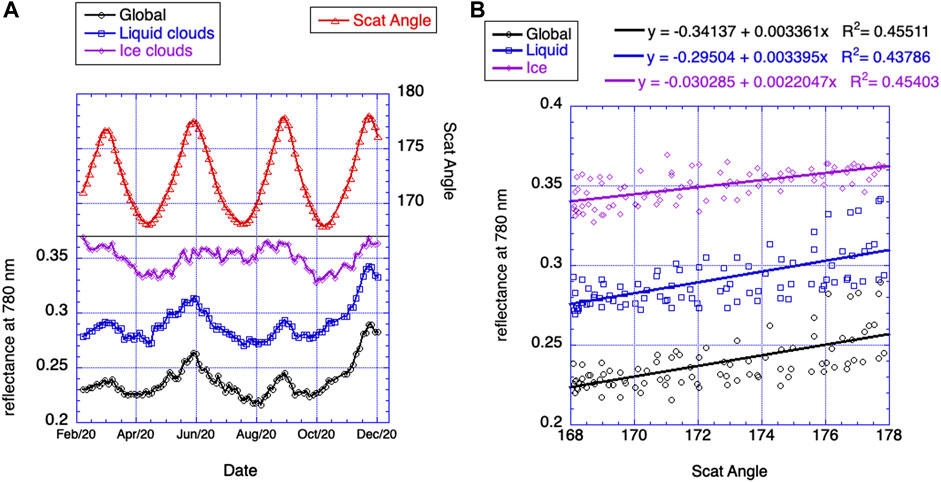
FIGURE 5. Liquid and ice clouds. (A) Scattering angle and 780 nm reflectance from ice and water clouds between February 26 and December 20, 2020 (liquid–46.9%, ice–12.6%). (B) Scatter plot of liquid and ice reflectance vs scattering angle for 10 months of the year 2020 (from February 26 to December 20).
As we see from the right panel in Figure 5 and Table 2, the slope of the “reflectance-versus-scattering angle” dependence for ice clouds (0.0022) is lower than for liquid ones (0.0034). More than that, in the left panel of Figure 5 we can see the lack of correlation for ice clouds in summer 2020 (June-September) while there is still a good correlation in spring and fall 2020. This is related to seasonal behavior of ice clouds, at least in 2020: there are less ice clouds in September than in July; thus, in September, when scattering angle riches its maximum of 178°, a smaller number of ice clouds leads to a smaller than expected reflectance from ice clouds.
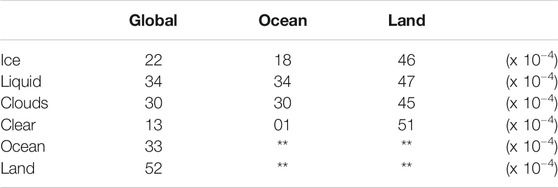
TABLE 2. Slope of correlation between reflectance and scattering angle for 780 nm from February 26 to December 20, 2020 for Earth global, ocean, and land.
The main contribution to global reflectance comes from an area around the center of sunlit Earth, which is located in an equatorial zone. Contributions from other areas decline as the square of cosine of latitude since the amount of radiant energy reflected from an area dS varies with solar (SZA) and view (VZA) zenith angles as BRFcos(SZA)cos(VZA)dS. Ocean and forests are dominant types of the Earth’s surface in the equatorial zone (Figure 6). Ocean acts as an absorber of solar radiation at the EPIC spectral bands and its contribution to Earth reflectance is small. Therefore, clouds and cloud-free forests are reflectors that control the sensitivity of TOA reflectance to the phase angle. We will focus on analyses of radiation reflected by clouds and forests. We start with cloud and vegetation radiative transfer models to understand features of reflectance in near backscattering directions.
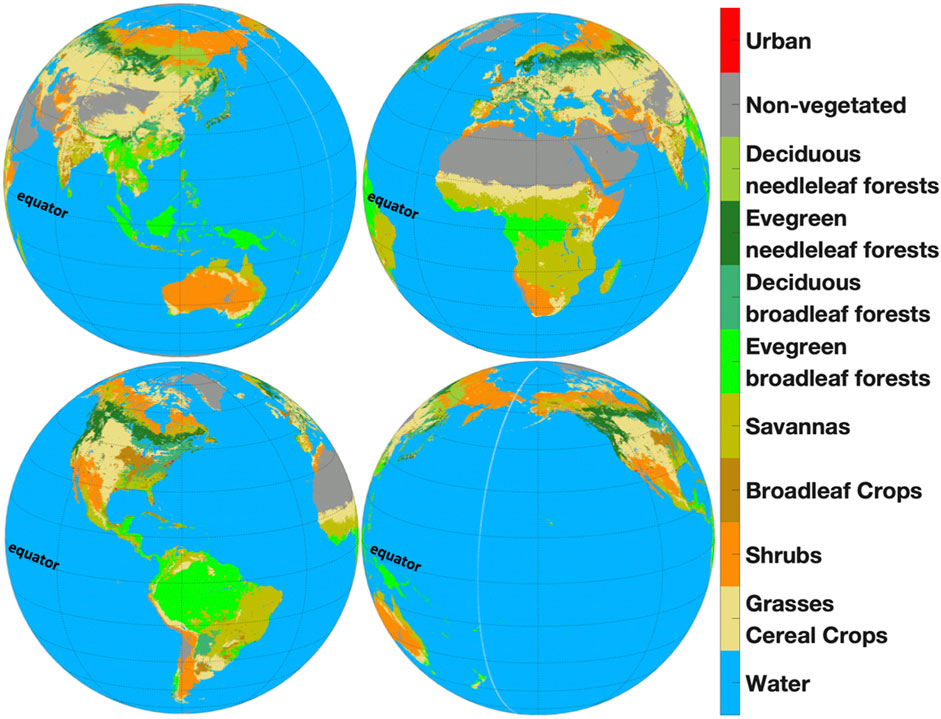
FIGURE 6. DSCOVR EPIC 10 km land cover map (NASA/LARC/SD/ASDC-VESDR, 2018a) on orthographic projection. Ocean and rainforests are dominant types of the Earth’s surface in equatorial zone. Amazonian rainforests are shown in South America as evergreen broadleaf forest.
Here we use a one-dimensional radiative transfer model (Stamnes et al., 1988) to simulate reflectance near backscattering directions. Figure 7 shows TOA reflectance as a function of scattering angle for water and ice clouds for two cloud optical depths and three SZAs. We clearly see that reflectance increases between 170 and 178 degrees of scattering angle in all cases. The increase is substantial: 5–15% for water clouds and 10–25% for ice clouds.
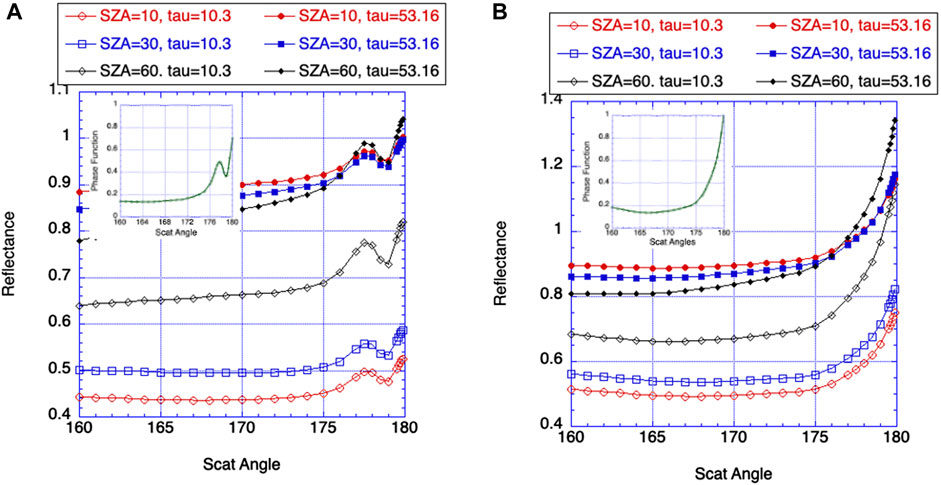
FIGURE 7. Reflectance from water (A) and ice (B) clouds for optical depths 10.3 and 53.16; SZAs are 10°, 30°, and 60°. For water clouds Mie scattering phase function was used with re = 10 μm and λ = 0.87 μm; for ice clouds MODIS band-2 (λ = 0.87 μm) C5 ice phase function was used with re = 30 μm. Both liquid and ice phase functions are shown as inserts.
In vegetation canopies finite size of scatters (leaves, needles, etc.) can cast shadows. A satellite-borne sensor sees minimal shadows if the Sun is behind the sensor. This makes the forest looking very bright in satellite images. With a change in view direction more shaded leaves appear in the sensor field of view and the radiance of the forest reflected radiation is consequently decreased. This mechanism causes a sharp peak in retro-solar direction. This phenomenon is known as “the hotspot effect” (Ross and Marshak, 1988; Knyazikhin and Marshak, 1991; Kuusk, 1991; Gerstl, 1999). Its shape and magnitude depend on canopy structural organization.
Figure 8 shows forest BRF at the NIR spectral band simulated with the stochastic radiative transfer equation (Huang et al., 2008; Yang et al., 2018) as functions of VZA (left panel) and phase angle (right panel) for three values of the SZA. It illustrates important features in relation between BRF and sun-sensor geometry, namely, a sharp increase in BRF as scattering direction approaches the direction to the Sun and a rise in magnitude of BRF and its rate with respect to the phase angle,
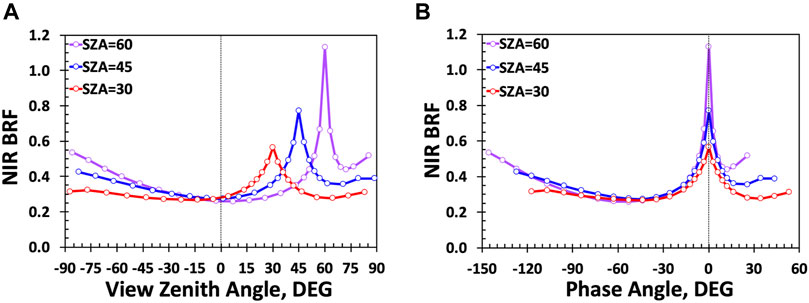
FIGURE 8. Bidirectional Reflectance Factor (BRF) of forest at the NIR spectral band in the principal plane as a function of VZA (A) and phase angle (B). Phase angle (or SEV) = VZA-SZA for SZA of 30°, 45°, and 60°. (Values of VZA with the sign “minus” are for azimuthal plane
Let us check how much vegetated areas increase surface BRF as observational direction approaches sun direction. As an example, we consider the Amazon basins. The Amazonian forests represent the largest equatorial rainforest on Earth (Figure 6). The rainforests play a uniquely important role in carbon and water cycles across regional to global scales as it contains nearly 50% of the tropical forest carbon stocks and is the most productive and biodiverse of terrestrial ecosystems (Saatchi et al., 2011). It was found that the green vegetation contributes significantly to the NIR global average reflectance when the South America appears in the EPIC’s field of view (Wen et al., 2019) suggesting a significant contribution from the equatorial forests. The left panel in Figure 9 demonstrates BRF of Amazonian forests derived from Terra MISR data acquired on August 28, 2016, at 10:30 local solar time. One can clearly see a sharp increase in BRF as scattering direction approaches the direction to the Sun, as theory predicts (cf. Figure 8).

FIGURE 9. Reflective properties of Amazonian forests. Reflectance of other equatorial forests show similar behavior (not shown here). (A) NIR BRF of an area of 70 by 256 km in Amazonian rainforests obtained from MISR data acquired on August 28, 2016 at 10:30 am (1502:29 UTC). The MISR sensor can see this area at phase angles up to 4°. (B) Two-months average normalized radiance over Amazonian forests derived from DSCOVR EPIC MAIAC BRF acquired between June 15 and August 08, 2020, as a function of SZA for 10 values of SEV. (C) Two-months average scattering function as a function of SEV accumulated over the same area and time interval as in the middle panel.
Terra MISR surface product provides BRFs over a 360 km wide swath at 10:30 local solar time and achieves global coverage every 9 days. This obviously is not sufficient for temporal analyses of Earth reflectivity. Therefore, we use DSCOVR EPIC BRF (NASA/LARC/SD/ASDC-MAIAC, 2018d) which provides global coverage at about hourly frequency (Lyapustin et al., 2018). We use two variables to characterize angular variation of forest reflectance. The first one is the temporal average normalized radiance estimated as
The integration is performed over pixels (x,y) in the Amazonian forests with given values of SZA and SEV accumulated over a given time interval. The middle panel in Figure 9 shows normalized radiance for the period of June 15 to August 8, 2020. As theory predicts, the normalized radiance and its rate of variation with respect to phase angle,
The surface scattering function, P, is the fraction of the total radiant energy incident on the surface that is scattered towards the sensor. It depends on scattering angle and exhibits strong diurnal variations. The right panel in Figure 9 shows two-month average scattering function of Amazonian forests estimated as
Here the integration is performed over pixels (x,y) in the Amazonian forests with a given phase angle. As expected from theory, it is a decreasing function with respect to phase angle (or SEV). Thus, anisotropy of forest reflected radiation can explain increase in Earth scattering at least when equatorial forests appear in the EPIC image.
NISTAR measures the outgoing radiation from the Earth integrated over the entire face of Earth in four broadband channels: total radiation (Band A, 0.2–100 μm), total solar reflected (Band B, 0.2–4 μm), NIR solar reflected (Band C, 0.7–4 μm) and photodiode (0.2–1.1 μm). In addition to EPIC observations, it is of interest to see how scattering angles affect NISTAR measurements.
Figure 10 shows NISTAR band A and B radiance and scattering angle for 2020. A strong positive correlation (R∼0.98) between the scattering angle and NISTAR data is clearly seen. This is especially pronounced for the time interval between November 15 and December 20, 2020 with maximum around December 10 when scattering angle reaches its maximum of 178.1°. The left panel that illustrates radiances plotted vs. scattering angles confirms it with high correlation which is slightly higher for the B-band radiance. It is also true for C-band radiance (not shown here) though with a bit lower correlation coefficient (0.90 for band C vs. 0.98 for band B). This is understandable since the increase of radiation near backscattering is higher in visible than in NIR (Platnick et al., 2017).
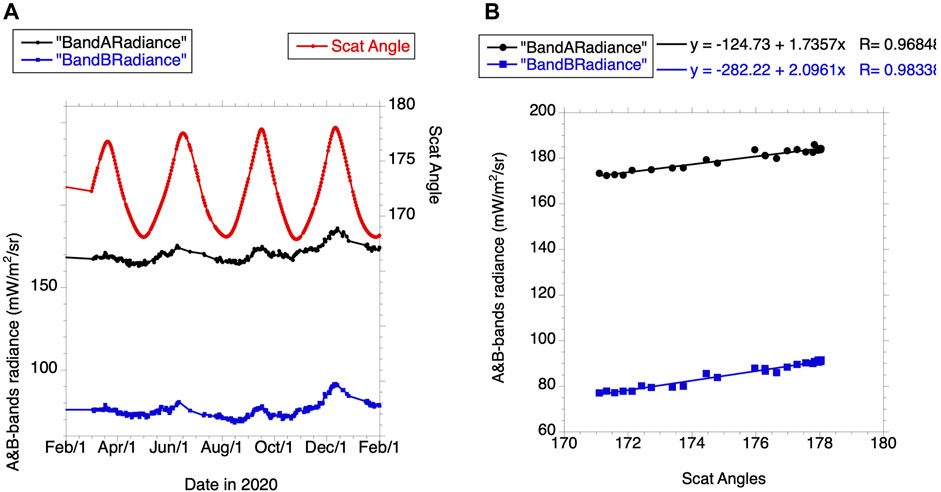
FIGURE 10. NISTAR band A and B radiance and scattering angle. (A) Band A and B radiance and scattering angle for the time period February 26, 2020 to February 1, 2021. (B) Band A and B radiance vs. scattering angle for the time period November 15–December 20, 2020.
DSCOVR EPIC and NISTAR observations from the Lagrange L1 point (about 1.5 mln km from Earth) provide a unique opportunity to study the effect of scattering angle on TOA reflectance near backscattering. This effect was studied for ocean and land areas, for cloudy and clear pixels, for liquid and ice clouds separately. All EPIC observations, except over ocean under clear sky conditions, show a strong increase of reflectance towards backscattering direction. The increase is well confirmed with cloud and vegetation models. The strongest increase is observed over land at the NIR band (780 nm). The Amazonian basin is taken as an example of a possible mechanism causing variation of BRF with solar zenith and scattering angles. NISTAR observations also demonstrate an increase with scattering angle for all bands but the strongest one is for B-band radiance (0.2–4 μm).
To summarize, measurements of Earth reflectance near the backscattering direction show a strong sensitivity towards scattering angle, especially for scattering angles above 175°. Any angular distribution model with a bin size bigger than 1°–3° near backscattering may lead to substantial errors.
Publicly available datasets were analyzed in this study. This data can be found in the article/supplementary material, further inquiries can be directed to the corresponding author.
All authors contributed to the article. AD-B and YK conducted an analysis of EPIC and NISTAR data. YK focused on vegetation while AM on clouds. AM wrote the very first version of the paper; it was later modified by all co-authors.
This work was supported by NASA DSCOVR program. YK is supported by the NASA DSCOVR project under grant 80NSSC19K0762 and Jet Propulsion Laboratory under contract 1625837.
The authors declare that the research was conducted in the absence of any commercial or financial relationships that could be construed as a potential conflict of interest.
All claims expressed in this article are solely those of the authors and do not necessarily represent those of their affiliated organizations, or those of the publisher, the editors and the reviewers. Any product that may be evaluated in this article, or claim that may be made by its manufacturer, is not guaranteed or endorsed by the publisher.
We are grateful to the DSCOVR science team for providing data and to the NASA Center for Climate Simulations providing resources for the EPIC data processing.
1We will be using “scattering angle” here which goes from 0° (forward scattering) to 180° (backward scattering). We will be also using Sun Earth Vehicle (SEV) angle (a.k.a. Phase angle) = 180°–scattering angle.
2A threshold of 4,500 m was used to separate ice and liquid clouds.
Bi, J., Knyazikhin, Y., Choi, S., Park, T., Barichivich, J., Ciais, P., et al. (2015). Sunlight Mediated Seasonality in Canopy Structure and Photosynthetic Activity of Amazonian Rainforests. Environ. Res. Lett. 10, 064014. doi:10.1088/1748-9326/10/6/064014
Geogdzhayev, I. V., Marshak, A., and Alexandrov, M. (2021). Calibration of the DSCOVR EPIC Visible and NIR Channels Using Multiple LEO Radiometers. Front. Remote Sens 2. doi:10.3389/frsen.2021.671933
Geogdzhayev, I. V., and Marshak, A. (2018). Calibration of the DSCOVR EPIC Visible and NIR Channels Using MODIS Terra and Aqua Data and EPIC Lunar Observations. Atmos. Meas. Tech. 11, 359–368. doi:10.5194/amt-11-359-2018
Gerstl, S. A. W. (1999). Building a Global Hotspot Ecology with Triana Data. Remote Sens. Earth Science, Ocean, Sea Ice Appl. 3868, 184–194. doi:10.1117/12.373094
Hapke, B. W. (1963). A Theoretical Photometric Function for the Lunar Surface. J. Geophys. Res. 68, 4571–4586. doi:10.1029/JZ068i015p04571
Huang, D., Knyazikhin, Y., Wang, W., Deering, D., Stenberg, P., Shabanov, N., et al. (2008). Stochastic Transport Theory for Investigating the Three-Dimensional Canopy Structure from Space Measurements. Remote Sensing Environ. 112, 35–50. doi:10.1016/j.rse.2006.05.026
Knyazikhin, Y., and Marshak, A. (1991). “Fundamental Equations of Radiative Transfer in Leaf Canopies, and Iterative Methods for Their Solution,” in Photon-vegetation Interactions: Applications in Plant Physiology and Optical Remote Sensing. Editors R. B. Myneni, and J. Ross (Berlin Heidelberg: Springer-Verlag), 9–43. doi:10.1007/978-3-642-75389-3_2
Kuusk, A. (1991). “The Hot Spot Effect in Plant Canopy Reflectance,” in Photon-vegetation Interactions: Applications in Plant Physiology and Optical Remote Sensing. Editors R. B. Myneni, and J. Ross (Berlin Heidelberg: Springer-Verlag), 139–159. doi:10.1007/978-3-642-75389-3_5
Lumme, K., and Bowell, E. (1981). Radiative Transfer in the Surfaces of Atmosphereless Bodies. I - Theory. II - Interpretation of Phase Curves. I. Theor. Astron J. 86, 1694–1704. doi:10.1086/113054
Lyapustin, A., Wang, Y., Korkin, S., and Huang, D. (2018). MODIS Collection 6 MAIAC Algorithm. Atmos. Meas. Tech. 11, 5741–5765. doi:10.5194/amt-11-5741-2018
Marshak, A., Herman, J., Adam, S., Karin, B., Carn, S., Cede, A., et al. (2018). Earth Observations from DSCOVR EPIC Instrument. Bull. Amer. Meteorol. Soc. (Bams) 99, 1829–1850. doi:10.1175/BAMS-D-17-0223.1
NASA/LARC/SD/ASDC (1999). MISR Level 2 Surface parameters V003. NASA Langley Atmospheric Science Data Center DAAC. Available at: https://doi.org/10.5067/TERRA/MISR/MIL2ASLS_L2.003-23.
NASA/LARC/SD/ASDC (2018a). DSCOVR EPIC Level 2 Vegetation Earth System Data Record (VESDR), Version 1. NASA Langley Atmospheric Science Data Center DAAC. Available at: https://doi.org/10.5067/EPIC/DSCOVR/L2_VESDR.001.
NASA/LARC/SD/ASDC(2018b). DSCOVR EPIC L2 Multi-Angle Implementation of Atmospheric Correction (MAIAC) Version 02. NASA Langley Atmospheric Science Data Center DAAC. Available at: https://doi.org/10.5067/EPIC/DSCOVR/L2_MAIAC.002.
NASA/LARC/SD/ASDC (2018c). DSCOVR EPIC Level 1B Version 3. NASA Langley Atmospheric Science Data Center DAAC. Available at: https://doi.org/10.5067/EPIC/DSCOVR/L1B.003.
NASA/LARC/SD/ASDC (2018d). Multi-Angle Implementation of Atmospheric Correction (MAIAC) Atmospheric Correction data product. NASA Langley Atmospheric Science Data Center DAAC. Available at: https://doi.org/10.5067/EPIC/DSCOVR/L2_MAIAC.001.
Martonchik, J. V., Bruegge, C. J., and Strahler, A. H. (2000). A Review of Reflectance Nomenclature Used in Remote Sensing. Remote Sensing Rev. 19, 9–20. doi:10.1080/02757250009532407
Platnick, S., Meyer, K. G., King, M. D., Wind, G., Amarasinghe, N., Marchant, B., et al. (2017). The MODIS Cloud Optical and Microphysical Products: Collection 6 Updates and Examples from Terra and Aqua. IEEE Trans. Geosc. Rem. Sens. 55, 1. doi:10.1109/tgrs.2016.2610522
Ross, J. K., and Marshak, A. L. (1988). Calculation of Canopy Bidirectional Reflectance Using the Monte Carlo Method. Remote Sensing Environ. 24, 213–225. doi:10.1016/0034-4257(88)90026-0
Saatchi, S. S., Harris, N. L., Brown, S., Lefsky, M., Mitchard, E. T. A., Salas, W., et al. (2011). Benchmark Map of forest Carbon Stocks in Tropical Regions across Three Continents. Proc. Natl. Acad. Sci. 108, 9899–9904. doi:10.1073/pnas.1019576108
Schaepman-Strub, G., Schaepman, M. E., Painter, T. H., Dangel, S., and Martonchik, J. V. (2006). Reflectance Quantities in Optical Remote Sensing-Definitions and Case Studies. Remote Sensing Environ. 103 (1), 27–42. doi:10.1016/j.rse.2006.03.002
Stamnes, K., Tsay, S.-C., Wiscombe, W., and Jayaweera, K. (1988). Numerically Stable Algorithm for Discrete-Ordinate-Method Radiative Transfer in Multiple Scattering and Emitting Layered media. Appl. Opt. 27, 2502–2509. doi:10.1364/ao.27.002502
Su, W., Minnis, P., Liang, L., Duda, D. P., Khlopenkov, K., Thieman, M. M., et al. (2020). Determining the Daytime Earth Radiative Flux from National Institute of Standards and Technology Advanced Radiometer (NISTAR) Measurements. Atmos. Meas. Tech. 13, 429–443. doi:10.5194/amt-13-429-2020
Trenberth, K. E., Fasullo, J. T., and Kiehl, J. (2009). Earth's Global Energy Budget. Bull. Amer. Meteorol. Soc. 90, 311–324. doi:10.1175/2008BAMS2634.1
Wen, G., Marshak, A., Song, W., Knyazikhin, Y., Mõttus, M., and Wu, D. (2019). A Relationship between Blue and Near‐IR Global Spectral Reflectance and the Response of Global Average Reflectance to Change in Cloud Cover Observed from EPIC. Earth Space Sci. 6, 1416–1429. doi:10.1029/2019ea000664
Keywords: radiative transfer, scattering angle, clouds, ocean, vegetation
Citation: Marshak A, Delgado-Bonal A and Knyazikhin Y (2021) Effect of Scattering Angle on Earth Reflectance. Front. Remote Sens. 2:719610. doi: 10.3389/frsen.2021.719610
Received: 02 June 2021; Accepted: 30 July 2021;
Published: 17 August 2021.
Edited by:
Pavel Lytvynov, Generalized Retrieval of Atmosphere and Surface Properties (GRASP), FranceReviewed by:
Victor Tishkovets, National Academy of Sciences of Ukraine, UkraineCopyright © 2021 Marshak, Delgado-Bonal and Knyazikhin. This is an open-access article distributed under the terms of the Creative Commons Attribution License (CC BY). The use, distribution or reproduction in other forums is permitted, provided the original author(s) and the copyright owner(s) are credited and that the original publication in this journal is cited, in accordance with accepted academic practice. No use, distribution or reproduction is permitted which does not comply with these terms.
*Correspondence: Alexander Marshak, YWxleGFuZGVyLm1hcnNoYWtAbmFzYS5nb3Y=
Disclaimer: All claims expressed in this article are solely those of the authors and do not necessarily represent those of their affiliated organizations, or those of the publisher, the editors and the reviewers. Any product that may be evaluated in this article or claim that may be made by its manufacturer is not guaranteed or endorsed by the publisher.
Research integrity at Frontiers

Learn more about the work of our research integrity team to safeguard the quality of each article we publish.