
94% of researchers rate our articles as excellent or good
Learn more about the work of our research integrity team to safeguard the quality of each article we publish.
Find out more
ORIGINAL RESEARCH article
Front. Public Health , 30 May 2024
Sec. Public Mental Health
Volume 12 - 2024 | https://doi.org/10.3389/fpubh.2024.1343550
 Ziming Yin1†Maidina Jingesi1†Zhao Yin2Siyi Chen1Suli Huang3Jinquan Cheng3Xiaoheng Li4Ning Liu4Peng Wang1Ping Yin1Hongwei Jiang1*
Introduction: The precise associations between temperature-related indices and mental and behavioral disorders (MBDs) have yet to be fully elucidated. Our study aims to ascertain the most effective temperature-related index and assess its immediate impact on emergency ambulance dispatches (EADs) due to MBDs in Shenzhen, China.
Methods: EADs data and meteorological data from January 1, 2013, to December 31, 2020, in Shenzhen were collected. Distributed lag non-linear models (DLNMs) were utilized to examine the non-linear and lagged effects of temperature-related indices on EADs due to MBDs. The Quasi Akaike Information criterion (QAIC) was used to determine the optimal index after standardizing temperature-related indices. After adjusting for confounding factors in the model, we estimated the immediate and cumulative effects of temperature on EADs due to MBDs.
Results: The analysis of short-term temperature effects on EADs due to MBDs revealed Humidex as the most suitable index. Referring to the optimal Humidex (3.2th percentile, 12.00°C), we observed a significant effect of Humidex over the threshold (34.6th percentile, 26.80°C) on EADs due to MBDs at lag 0–5. The cumulative relative risks for high temperature (90th percentile, 41.90°C) and extreme high temperature (99th percentile, 44.20°C) at lag 0–5 were 1.318 (95% CI: 1.159–1.499) and 1.338 (95% CI: 1.153–1.553), respectively. No significant cold effect was observed on EADs due to MBDs.
Conclusion: High Humidex was associated with more EADs due to MBDs in subtropical regions. Health authorities should implement effective measures to raise public awareness of risks related to high temperature and protect vulnerable populations.
Mental and behavioral disorders (MBDs) are serious mental health conditions characterized by changes in cognition, emotion, and behavior. These disorders often cause distress and functional impairment, including mood disorders, neurotic disorders, schizophrenia, organic mental disorders, and others. The World Health Organization estimated that approximately 970 million individuals worldwide had a mental disorder in 2019 (1). A global prevalence study of MBDs reported that 29.2% of respondents had experienced at least one MBDs in their lifetime (2). Another study found that MBDs accounted for 13.0% of global disability-adjusted life years (DALYs) (3). DALYs, a metric utilized to evaluate the global impact of a disease or health condition, take into consideration both the years of life lost due to premature mortality and the years of life lived with disability. It is important to note that as the disease burden escalates, the value of DALYs also rises. In China, the lifetime weighted prevalence of MBDs (excluding dementia) was 16.6% among individuals (4). Furthermore, a systematic analysis conducted in 2019 indicated that the age-standardized DALYs per 100,000 due to MBDs ranged from 1150.2 to 1409.1 in China (5).
Climate change has resulted in a wide range of extreme weather events globally, including droughts, rainstorms, heat waves, cold spells, and so forth (6). These extreme weather events have had unprecedented global impacts, leading to an increase in morbidity and mortality (7). The relationship between climate change and MBDs has recently garnered increased attention. Some studies have revealed that climate change may have a direct or indirect long-term impact on MBDs (8–10). Researches conducted in Quebec and Toronto found a correlation between daily mean temperature and an increase in emergency room visits due to MBDs (11, 12). A study in England indicated that for every 1°C increase in temperature above the 93rd percentile of the yearly temperature range, the mortality of individuals with MBDs increased by 4.9% (13). Similarly, a study in Shanghai demonstrated that compared to the median temperature (18.30°C), the relative risk (RR) of extreme high temperature (33.10°C, 99th percentile) on MBDs was 1.266 (95% CI: 1.074–1.493) at lag 0–1 (14). Additionally, Niu et al. found that both high and low apparent temperatures could be risk factors for psychiatric emergency room visits (15).
While several studies have explored the relationship between ambient temperature and MBDs (13, 16, 17), few have considered a composite index that combines temperature with other meteorological factors. Besides temperature, other environmental factors, such as humidity and sunshine hours, may also influence the occurrence of mental disorders. A study conducted in New York State found that the risk of mental illnesses peaked during hot and humid conditions, particularly when there were high levels of sun radiation, relative humidity, and temperature simultaneously (18). Taniguchi et al. demonstrated that exposure to sunlight positively affects emotional and psychological health (19). Some studies have examined the relationships between weather variables and health using comprehensive indices. For example, a cross-sectional study in Italy used the humidex index as a predictor of involuntary admission in psychosis (20). Furthermore, comprehensive temperature indices such as physically equivalent temperature have also been employed to explore the links between temperature and MBDs (21). However, despite the use of composite indices in these studies, only a single index was used without any comparison between different composite indices.
Our study aims to investigate the relationships between ten commonly used temperature-related indices and emergency ambulance dispatches (EADs) due to MBDs in Shenzhen. We utilized a standardization methodology to address the scale differences among various composite indices, enabling a more straightforward comparison of models and ultimately identifying the optimal index. Our main focus is to examine low and high temperature trigger acute MBDs attacks in Shenzhen and the lagged effect of such associations. This research holds significant value for the study of MBDs in subtropical regions. By identifying the meteorological factors contributing to an increase in EADs due to MBDs, we seek to uncover the short-term and lagged impacts of specific meteorological conditions on acute episodes in MBDs patients. This enhances our understanding of health risks for MBDs patients under different meteorological conditions, providing a scientific basis for the formulation of corresponding public health policies.
This research was conducted in Shenzhen (N22°27′–22°52′, E113°46′–114°37′), a coastal city in southern China. As of the end of 2020, Shenzhen encompasses an area of 1997.47 km2 with a permanent population of 17.63 million. The city is situated at a low latitude and experiences a subtropical monsoon climate with mild temperatures and abundant rainfall and sunshine. Historical meteorological data shows an annual average temperature of 23.00°C, with the highest recorded temperature at 37.60°C and the lowest at 1.90°C (22).
The data collected for this study spanned from 2013 to 2020 in Shenzhen and included EADs data, meteorological data, and air pollutants data. EADs data, containing dispatch details such as date, time, and cause, as well as patient information like patient ID, age, gender, address, symptoms, chief complaints, initial diagnosis, and supplementary diagnosis, were provided by the Shenzhen First-aid Command Center. MBDs were defined based on the 10th Revision of the International Classification of Diseases (ICD-10), with disease codes ranging from F01 to F99. We conducted data screening according to strict diagnostic criteria, and only included cases where both the initial and supplementary diagnoses indicate mental and behavioral disorders. Daily count data were obtained by counting the number of MBD cases per day. Daily meteorological data, including mean temperature (Tmean, °C), minimum temperature (Tmin, °C), maximum temperature (Tmax, °C), relative humidity (RH, %), and wind speed (WS, m/s), were obtained from the Shenzhen Meteorological Service Center. Air pollutants variables comprised particulate matter less than 2.5 μm in aerodynamic diameter (PM2.5, μg/m3), particulate matter less than 10 μm in aerodynamic diameter (PM10, μg/m3), nitrogen dioxide (NO2, μg/m3), sulfur dioxide (SO2, μg/m3), ozone (O3, μg/m3), and carbon monoxide (CO, mg/m3). Daily levels of air pollutants were determined by averaging measurements from seven (eleven since 2017) standard monitoring stations. To ensure the quality of environmental data, both air pollutants and meteorological variables were monitored in accordance with the quality assurance and quality control (QA/QC) processes established by the China Meteorological Bureau and China Environmental Protection Administration.
Our study incorporated 10 commonly used temperature-related indices to examine the associations between meteorological factors and MBDs. Supplementary Table S1 presents a detailed description of these indices, including the daily mean, minimum, and maximum temperature (Tmean, Tmin, and Tmax), apparent temperature (AT) (23), Rothfusz’s heat index (RHI) (24), wind chill index (WCI) (25), effective temperature (ET) (26), net effective temperature (NET) (25), humidity index (Humidex) (27), and alternative temperature-humidity index (THIa) (28).
We utilized the distributed lag non-linear models (DLNMs) and Quasi Akaike Information Criterion (QAIC) to determine the most suitable index from 10 temperature-related comprehensive indices. Subsequently, we assessed the impact of the optimal index on EADs due to MBDs and conducted subgroup analysis. To account for the non-linear and lagged effect of the relationships between meteorological variables and mental health (12, 29), we employed DLNMs in conjunction with a quasi-Poisson regression model to analyze the associations between temperature-related indices (both raw measured values and their standardized values—Z score) and EADs due to MBDs. DLNMs integrate prediction and lagged effect into a cross-basis, which is a two-dimensional matrix facilitating the examination of lag-exposure-response effects over specific lag periods (30, 31). We standardize the temperature-related index X i, t (i = 1–10 for ten temperature-related indices) on the day (t) into a standardized value (Z i, t ) to eliminate the influence of different units and scales. The equation was as follows:
Where μi is the mean and σi is the standard deviation of ten temperature-related indices. The DLNMs for EADs due to MBDs at day (t) are presented as follows:
Where Yt represents the count of EADs due to MBDs at day t, and μt is the expected number of EADs due to MBDs at day t; α refers to the intercept; cbt,lrepresents a cross-basis object generated by DLNMs, which is used to estimate the non-linear and lagged effects of temperature-related indices. The l denotes the lag days. Based on previous studies, we chose a maximum lag of 14 days (32). We also conducted sensitivity analyses to evaluate the cumulative effects from lag 0–7 to lag 0–21 (14, 29). We applied a natural cubic spline with 3 degrees of freedom (df) for both temperature-related indices and lag space to construct the final model (23). Furthermore, we used natural cubic spline functions, ns(RH) and ns(WS), for relative humidity and wind speed, respectively, and assigned 3 df to each of them to control for their potential confounding effects (23). The long-term trend was modeled by a natural cubic spline function of time, ns(time), with 4 df per year, determined by the QAIC value and Partial autocorrelation coefficient (PACF) for ns(time), as shown in Supplementary Figure S1. QAIC considers the model’s goodness of fit and complexity to prevent overfitting by penalizing over-parameterization. Generally, a smaller QAIC value indicates a better fit for the model. PACF is the sum of the absolute values of the partial autocorrelation function of the residuals, used to compare the autocorrelation of residuals between different models. A lower PACF value typically signifies a lower level of autocorrelation in the residuals. Additionally, the variables pollutant, holidayt, and dowt represent air pollutant levels, public holidays (33), and day of week, respectively, with β, λ, and γ as the corresponding regression coefficients.
Notably, owing to the strong correlation between meteorological factors and air pollutants, with correlation coefficients exceeding 0.6 (Supplementary Figure S2), the final models included only RH, WS, and NO2 to avoid potential biases resulting from multicollinearity, as was undertaken in a prior study (29). It is important to highlight that either RH or WS would be excluded from the model when the temperature-related indices incorporated relative humidity or wind speed. Furthermore, NO2 was directly incorporated into the model as a linear function, in accordance with previous research suggesting a linear association between NO2 and mental health (34). For these ten temperature-related indices, estimating the risk of low and high temperature effects using the same measurement method is not feasible. Therefore, we calculated the cumulative RRs using the standardized Z values for each index (34). Subsequently, we used QAIC to select the optimal temperature-related index. RRs and corresponding 95% confidence intervals (CI) for EADs due to MBDs were then computed at the 1st, 10th, 90th, and 99th percentiles of the optimal temperature-related index, assessing the effect of extreme low temperature, low temperature, high temperature, and extreme high temperature on EADs due to MBDs.
To identify the vulnerable population, we performed subgroup analysis based on sex (male or female) and age (0–14, 15–39, 40–59, and 60+). We also employed a stratified approach to examine whether temperature-related indices affect EADs due to MBDs differently across seasons (35). Given that Shenzhen is located at a relatively low latitude and experiences a subtropical monsoon climate with a long summer and short winter, the traditional astronomical four-season method may not accurately reflect the city’s climatic characteristics. Hence, following the seasonal classification method provided by the Shenzhen Meteorological Bureau (36), we categorized the data into warm (from April 20th to November 7th) and cold seasons (remaining days), conducting separate analyses for each (37). Furthermore, we conducted sensitivity analyses to assess the robustness of our model. These analyses included the following modifications: (1) dividing the data into two periods: the first four years (2013–2016) and the last four years (2017–2020) to investigate the impact of temporal change on the results; (2) altering the df (2, 4, 5) for wind speed; (3) adjusting the df (5–8) for long-term trend; (4) modifying the lag days (7–21 days) for daily temperature-related indices; (5) substituting NO2 confounding factors with other pollutants confounding factors; (6) according to the Lancet’s paper and the official announcement of the onset date of the first COVID-19 patient (38), omitting data after December 1, 2019 to examine the potential impact of the COVID-19 epidemic on the results.
In our study, we utilized a two-dimensional smooth response surface model to investigate the interaction effect between air pollutants and meteorological variables on EADs due to MBDs. It models the joint effect of air pollutants and meteorological variables on EADs due to MBDs as a continuous function of both variables. The model was as follows:
Where Te represents smooth tensor product function, Te(air pollutants: meteorological variables) denotes the interaction term between air pollutants and meteorological variables, and other terms are consistent with DLNMs.
All statistical analyses were performed using SAS (version 9.4, Sai Shi Software, Cary, NC, United States) and R software (version 4.1.2, R Foundation for Statistical Computing, Vienna, Austria). The DLNMs were established using the “dlnm” and “splines” packages.
Tables 1, 2 present descriptive statistical results for meteorological variables, air pollutants, and EADs due to MBDs during the study period from 2013 to 2020. The average values for daily mean, minimum, and maximum temperature, relative humidity, and wind speed were 23.56°C, 21.15°C, 27.15°C, 75.72%, and 1.94 m/s, respectively. In terms of air pollutants, the mean daily concentrations of PM2.5, PM10, NO2, SO2, O3, and CO were 28.74 μg/m3, 46.87 μg/m3, 34.45 μg/m3, 8.24 μg/m3, 71.40 μg/m3, and 0.83 mg/m3, respectively. Throughout the study period, a total of 24,967 EADs due to MBDs were recorded, with an average of 8 cases and a maximum of 27 cases per day. Among these cases, approximately 51.2% were male and 43.4% were female. The age groups 15–39 and 40–59 exhibited the highest proportions of EADs due to MBDs, accounting for 62.5% and 24.8% of cases, respectively, while the age groups 0–14 and 60+ accounted for only 1.4% and 5.7%, respectively. Additionally, 1,412 cases did not have recorded age information and 1,360 cases lacked sex information. Due to the small proportion of missing data in this study, no imputation would be performed and these data would not be included in the descriptive analysis.
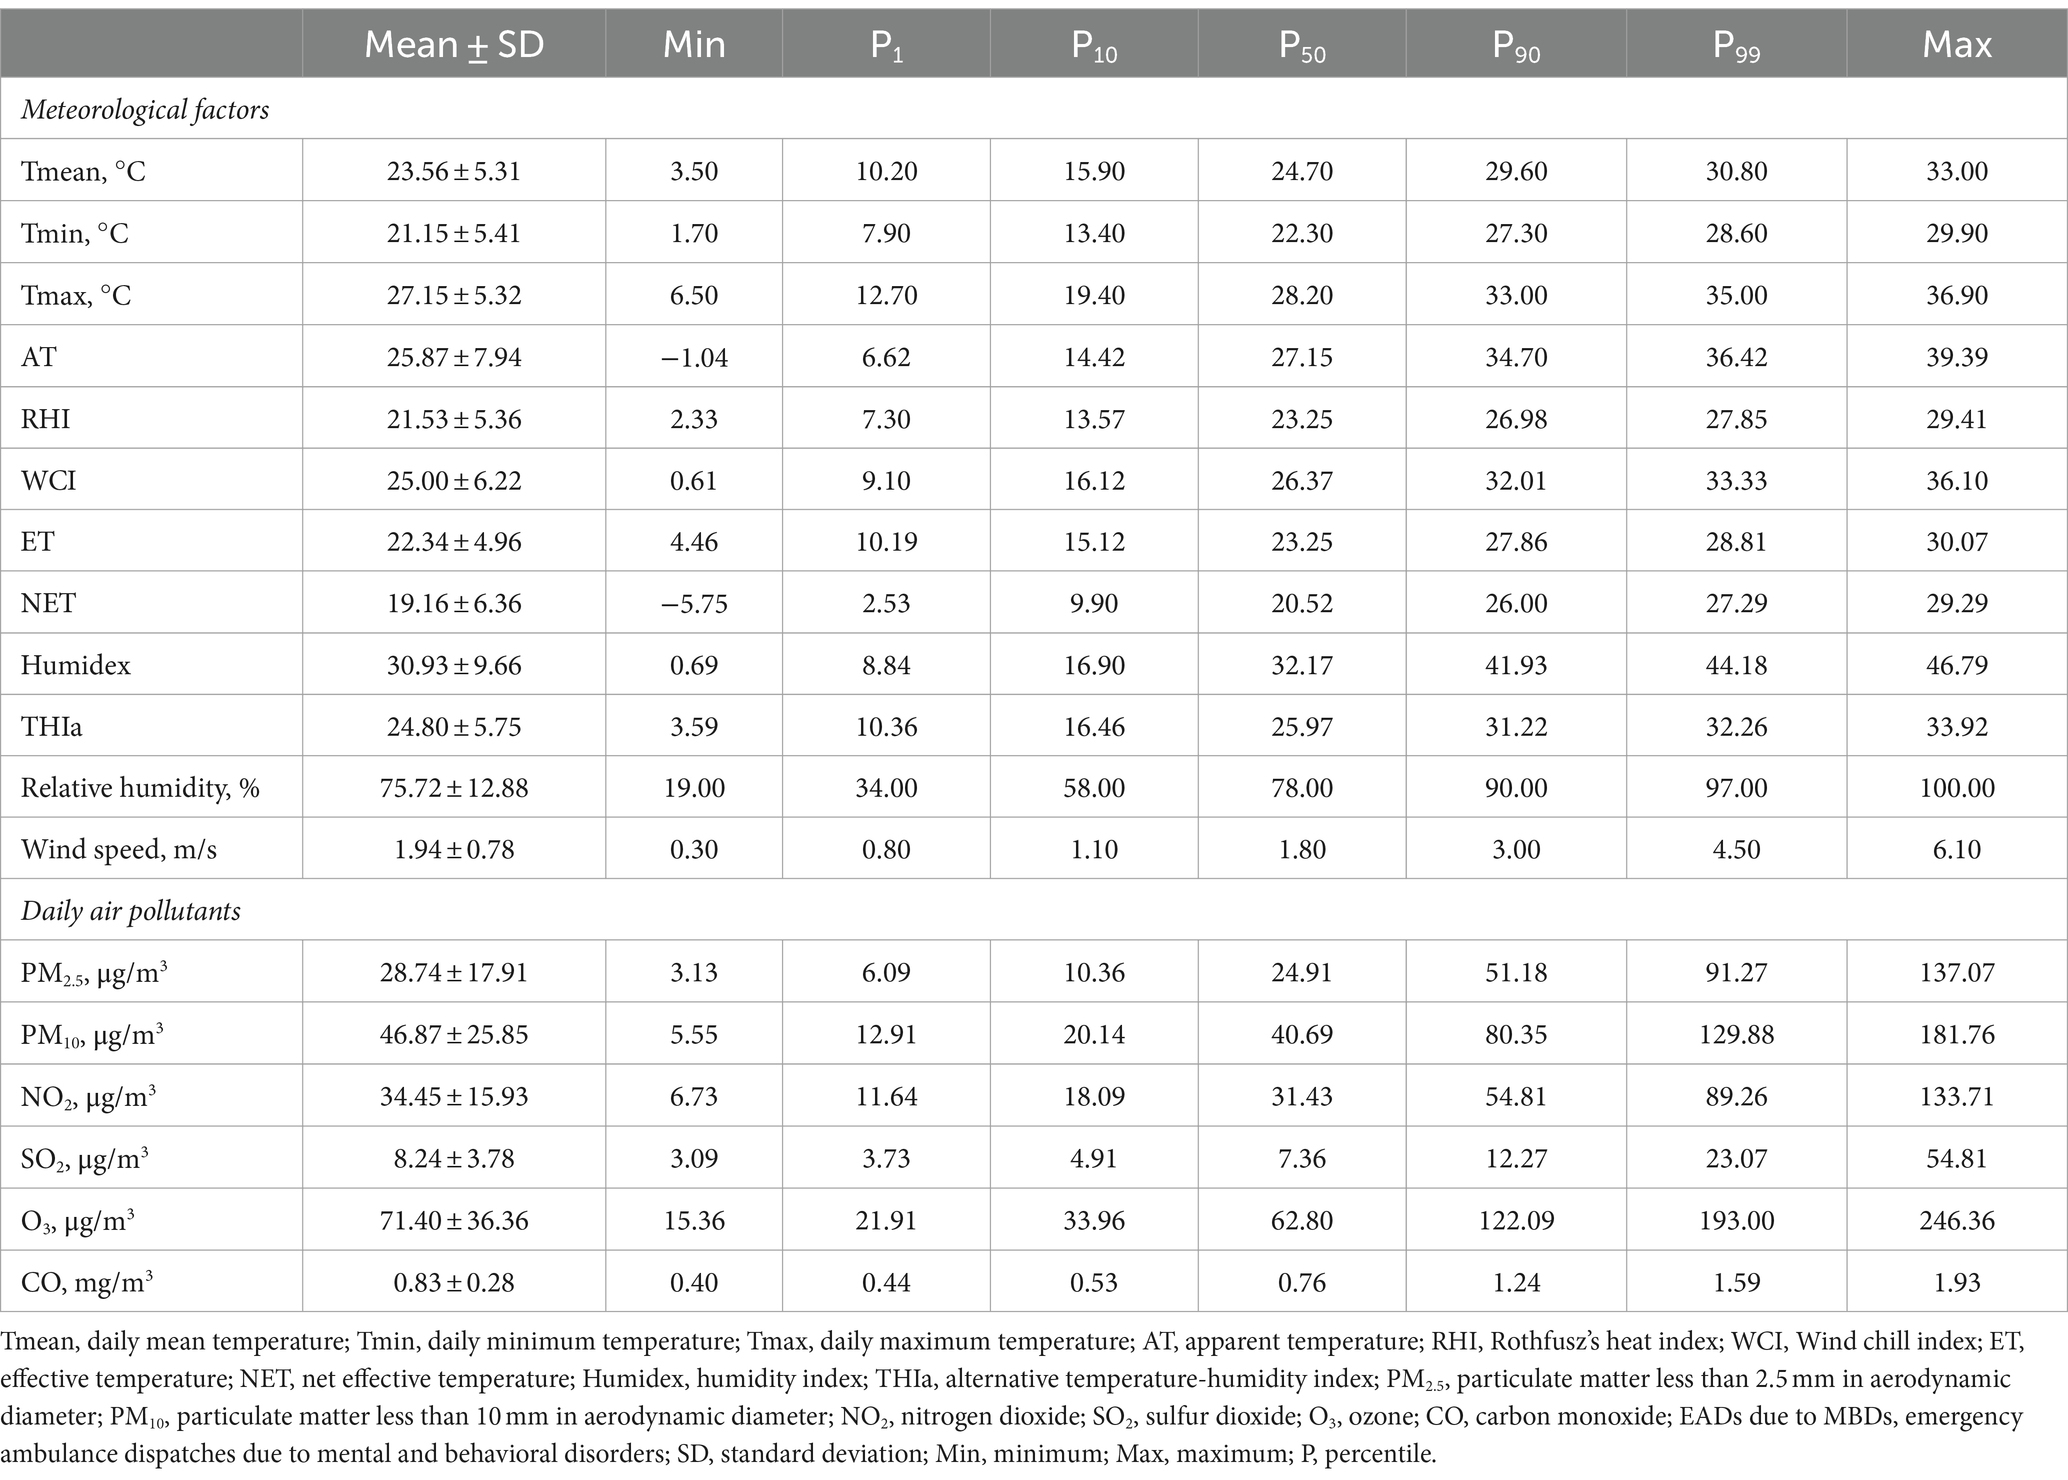
Table 1. Summary of meteorological factors and air pollutants in Shenzhen, 2013–2020.
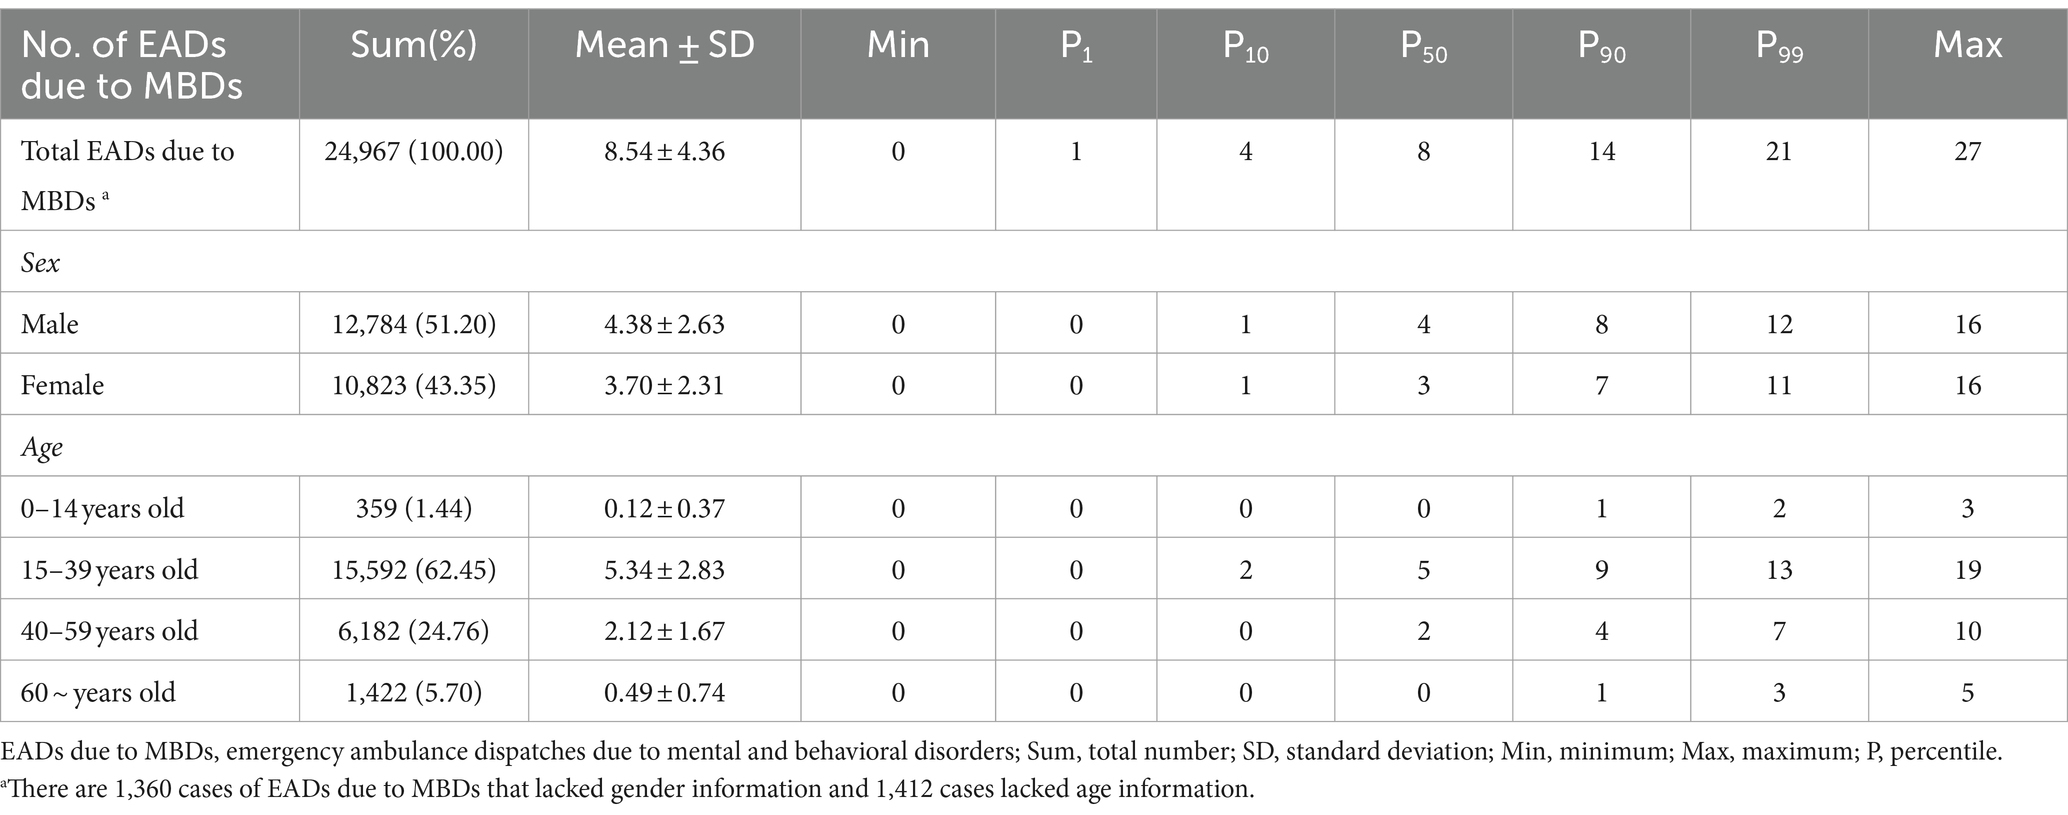
Table 2. Summary of EADs due to MBDs counts in Shenzhen, 2013–2020.
Supplementary Figure S2 illustrates the Spearman correlation coefficients between EADs due to MBDs, meteorological variables, and air pollutants. The results showed that the correlation between EADs due to MBDs and meteorological factors was not strong. A strong positive correlation was observed between the daily concentrations of NO2 and the daily concentrations of PM2.5, PM10, SO2, and CO (Spearman correlation coefficients r > 0.6, p < 0.0001). Supplementary Figure S3 presents the time-series distributions of meteorological factors, air pollutants, and daily EADs due to MBDs in Shenzhen from 2013 to 2020. EADs due to MBDs displayed a continuous increase throughout the study period. Additionally, temperature-related indices and relative humidity exhibited distinct annual cycles but no discernible trends. Supplementary Figure S4 shows the monthly characteristics of EADs due to MBDs in Shenzhen from 2013 to 2020. From the heat map, it can be seen that the incidence of mental disorders remained relatively stable in different months throughout the year, and there was no significant fluctuation.
Figure 1 depicts lag-response curves for 10 temperature-related indices. Using optimal value as the reference for each index, the analysis revealed that the cumulative effects of all indices at Z = 1 peaked at lag 0–5. No adverse effects were observed when Z = −1. Therefore, we selected lag 0–5 to examine the relationships between temperature-related indices and EADs due to MBDs. Figure 2 shows the cumulative relative risks of 10 temperature-related indices (standardized values and temperature indices) associated with EADs due to MBDs over a 5-day lag period. The optimal values (the point of lowest relative risks) were used as the reference in DLNMs. We revealed a notable influence of high temperature on EADs due to MBDs, whereas low temperature did not demonstrate any statistical significance. Table 3 summarizes the cumulative relative risks of ten temperature-related indices at Z = ±1 associated with EADs due to MBDs at lag 0–5. Based on the lowest QAIC value, Humidex was identified as the most suitable temperature-related index linked to EADs due to MBDs. The cumulative relative risk of Humidex at Z = 1 was 1.304 (95% CI: 1.158–1.469). Supplementary Table S2 displays the single-day relative risks of temperature-related indices at Z = 1 on EADs due to MBDs from 0 to 14 days. The analysis revealed that all 10 temperature-related indices had significant immediate short-term effects on EADs due to MBDs. The relative risk values of all indices peaked on the day of exposure and were mostly detectable up to lag day 3, followed by a declining trend.
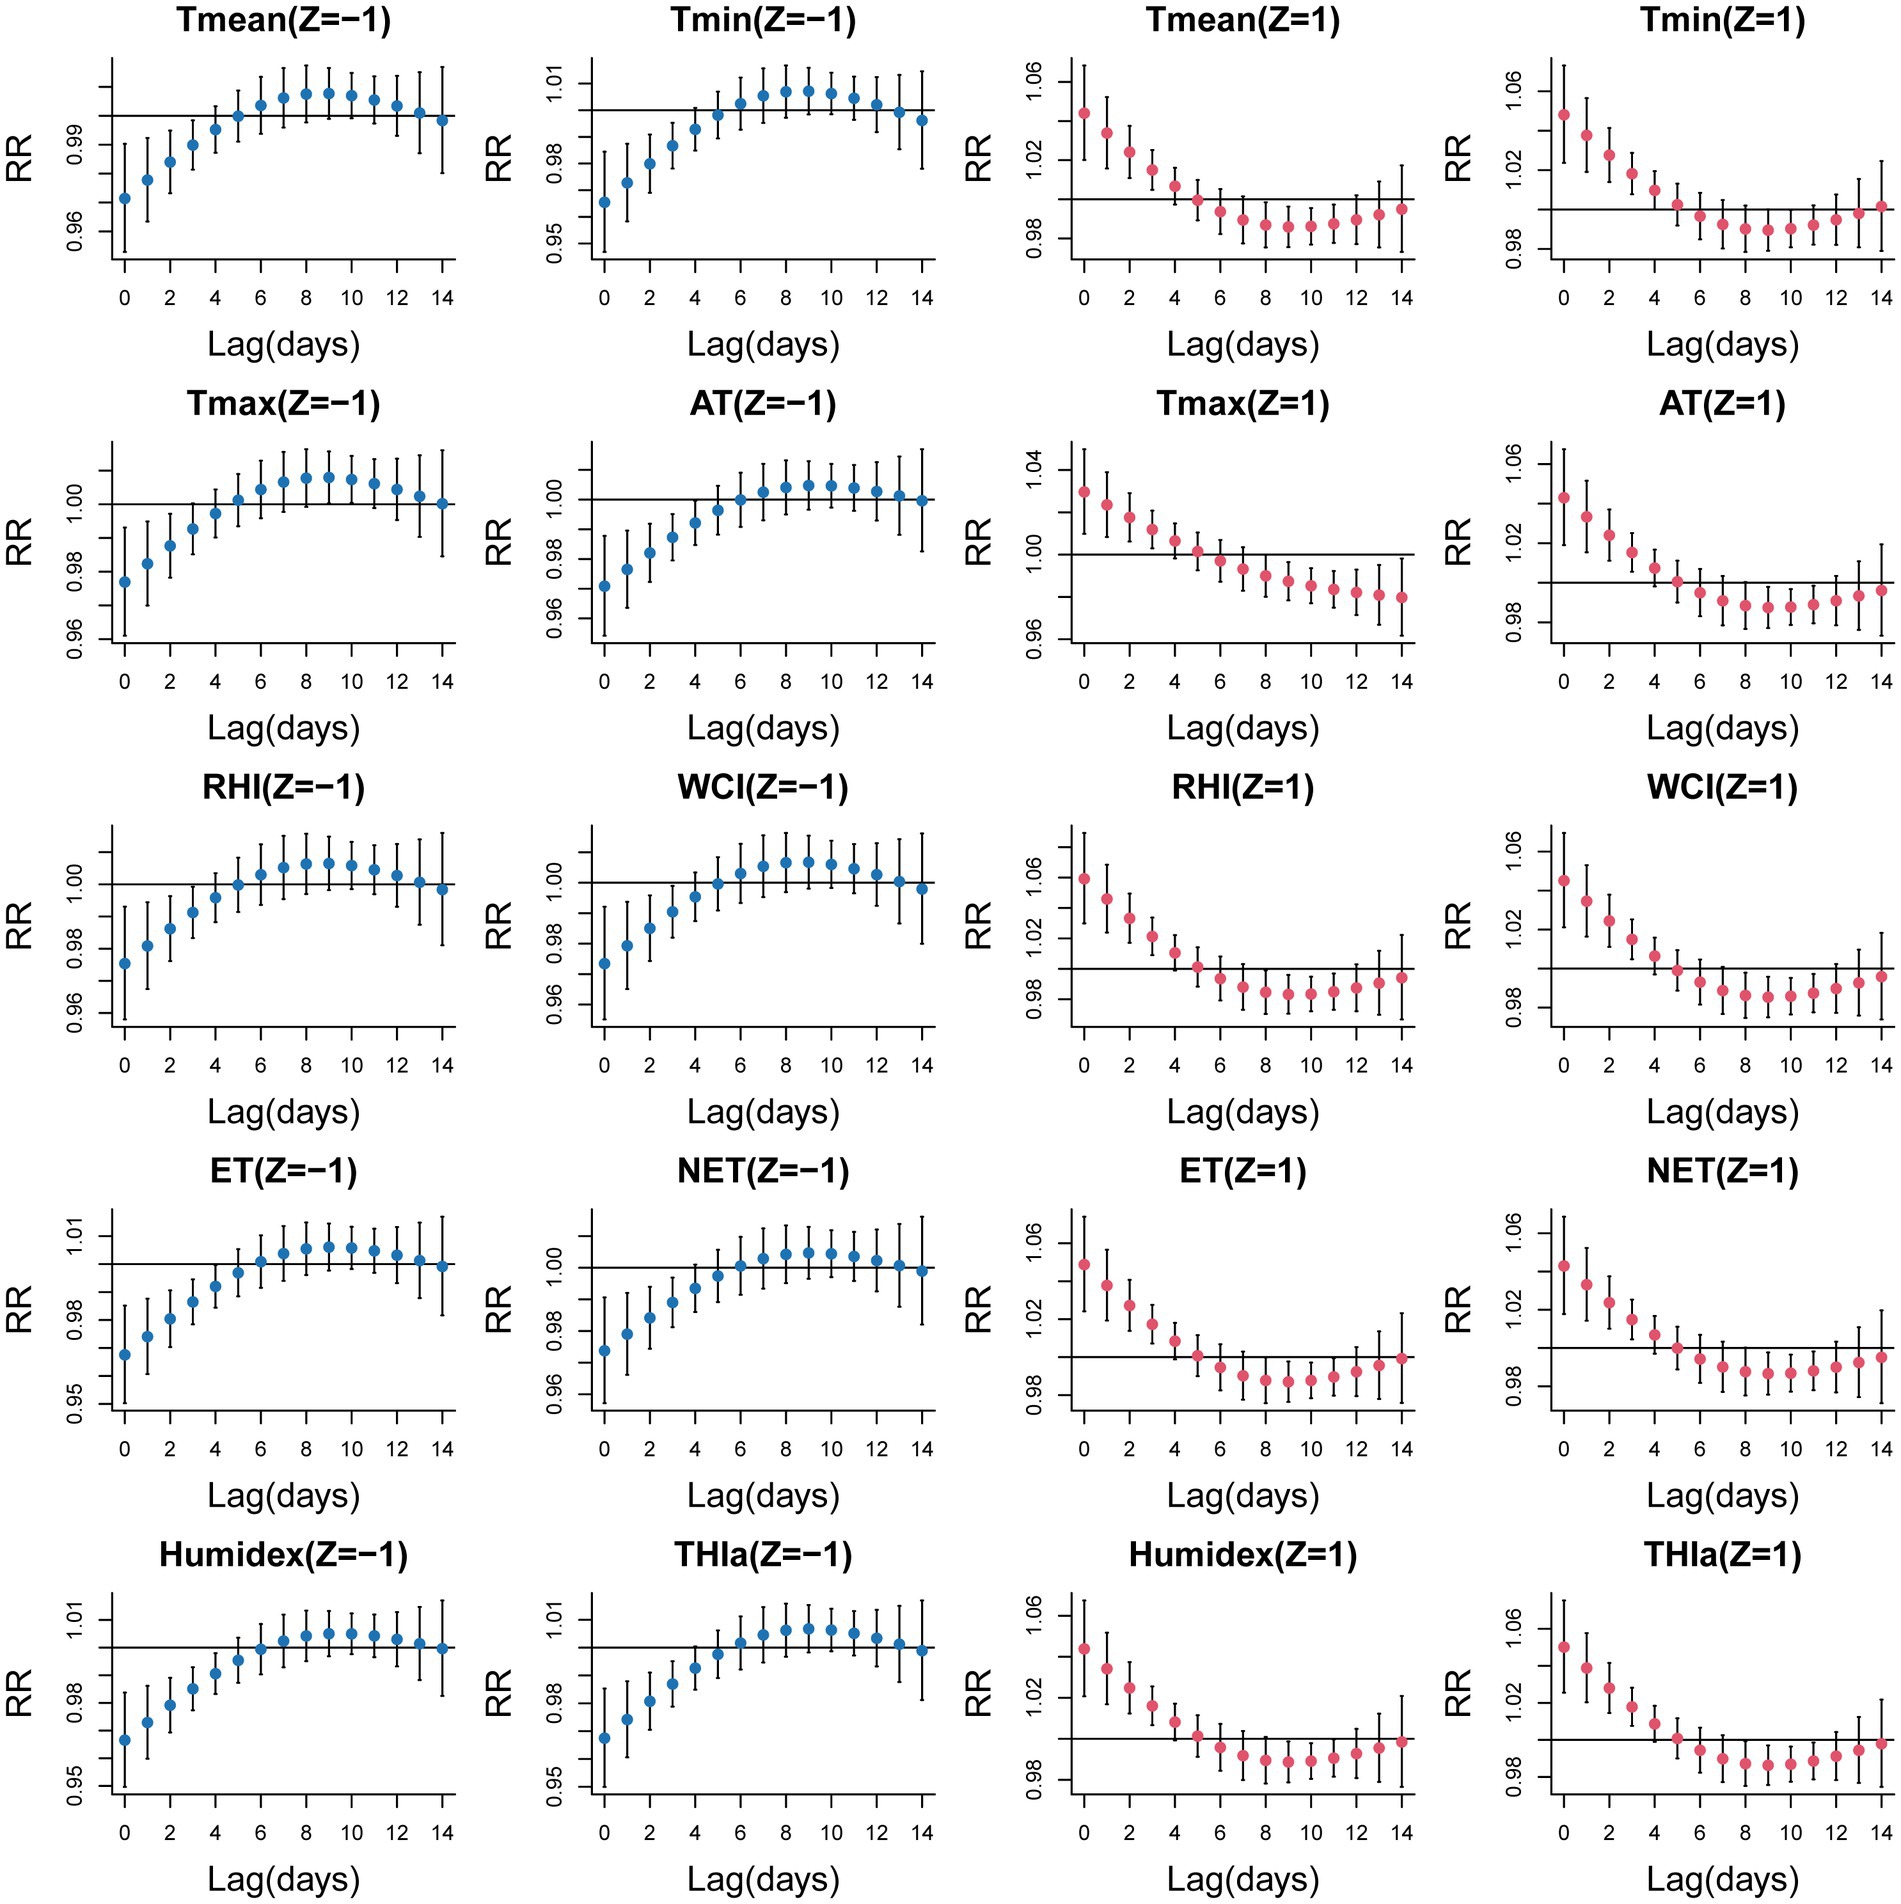
Figure 1. Lag-response curves for ten temperature-related indices associated with EADs due to MBDs at standardized Z values = 1 or −1 (With optimal value as a reference).
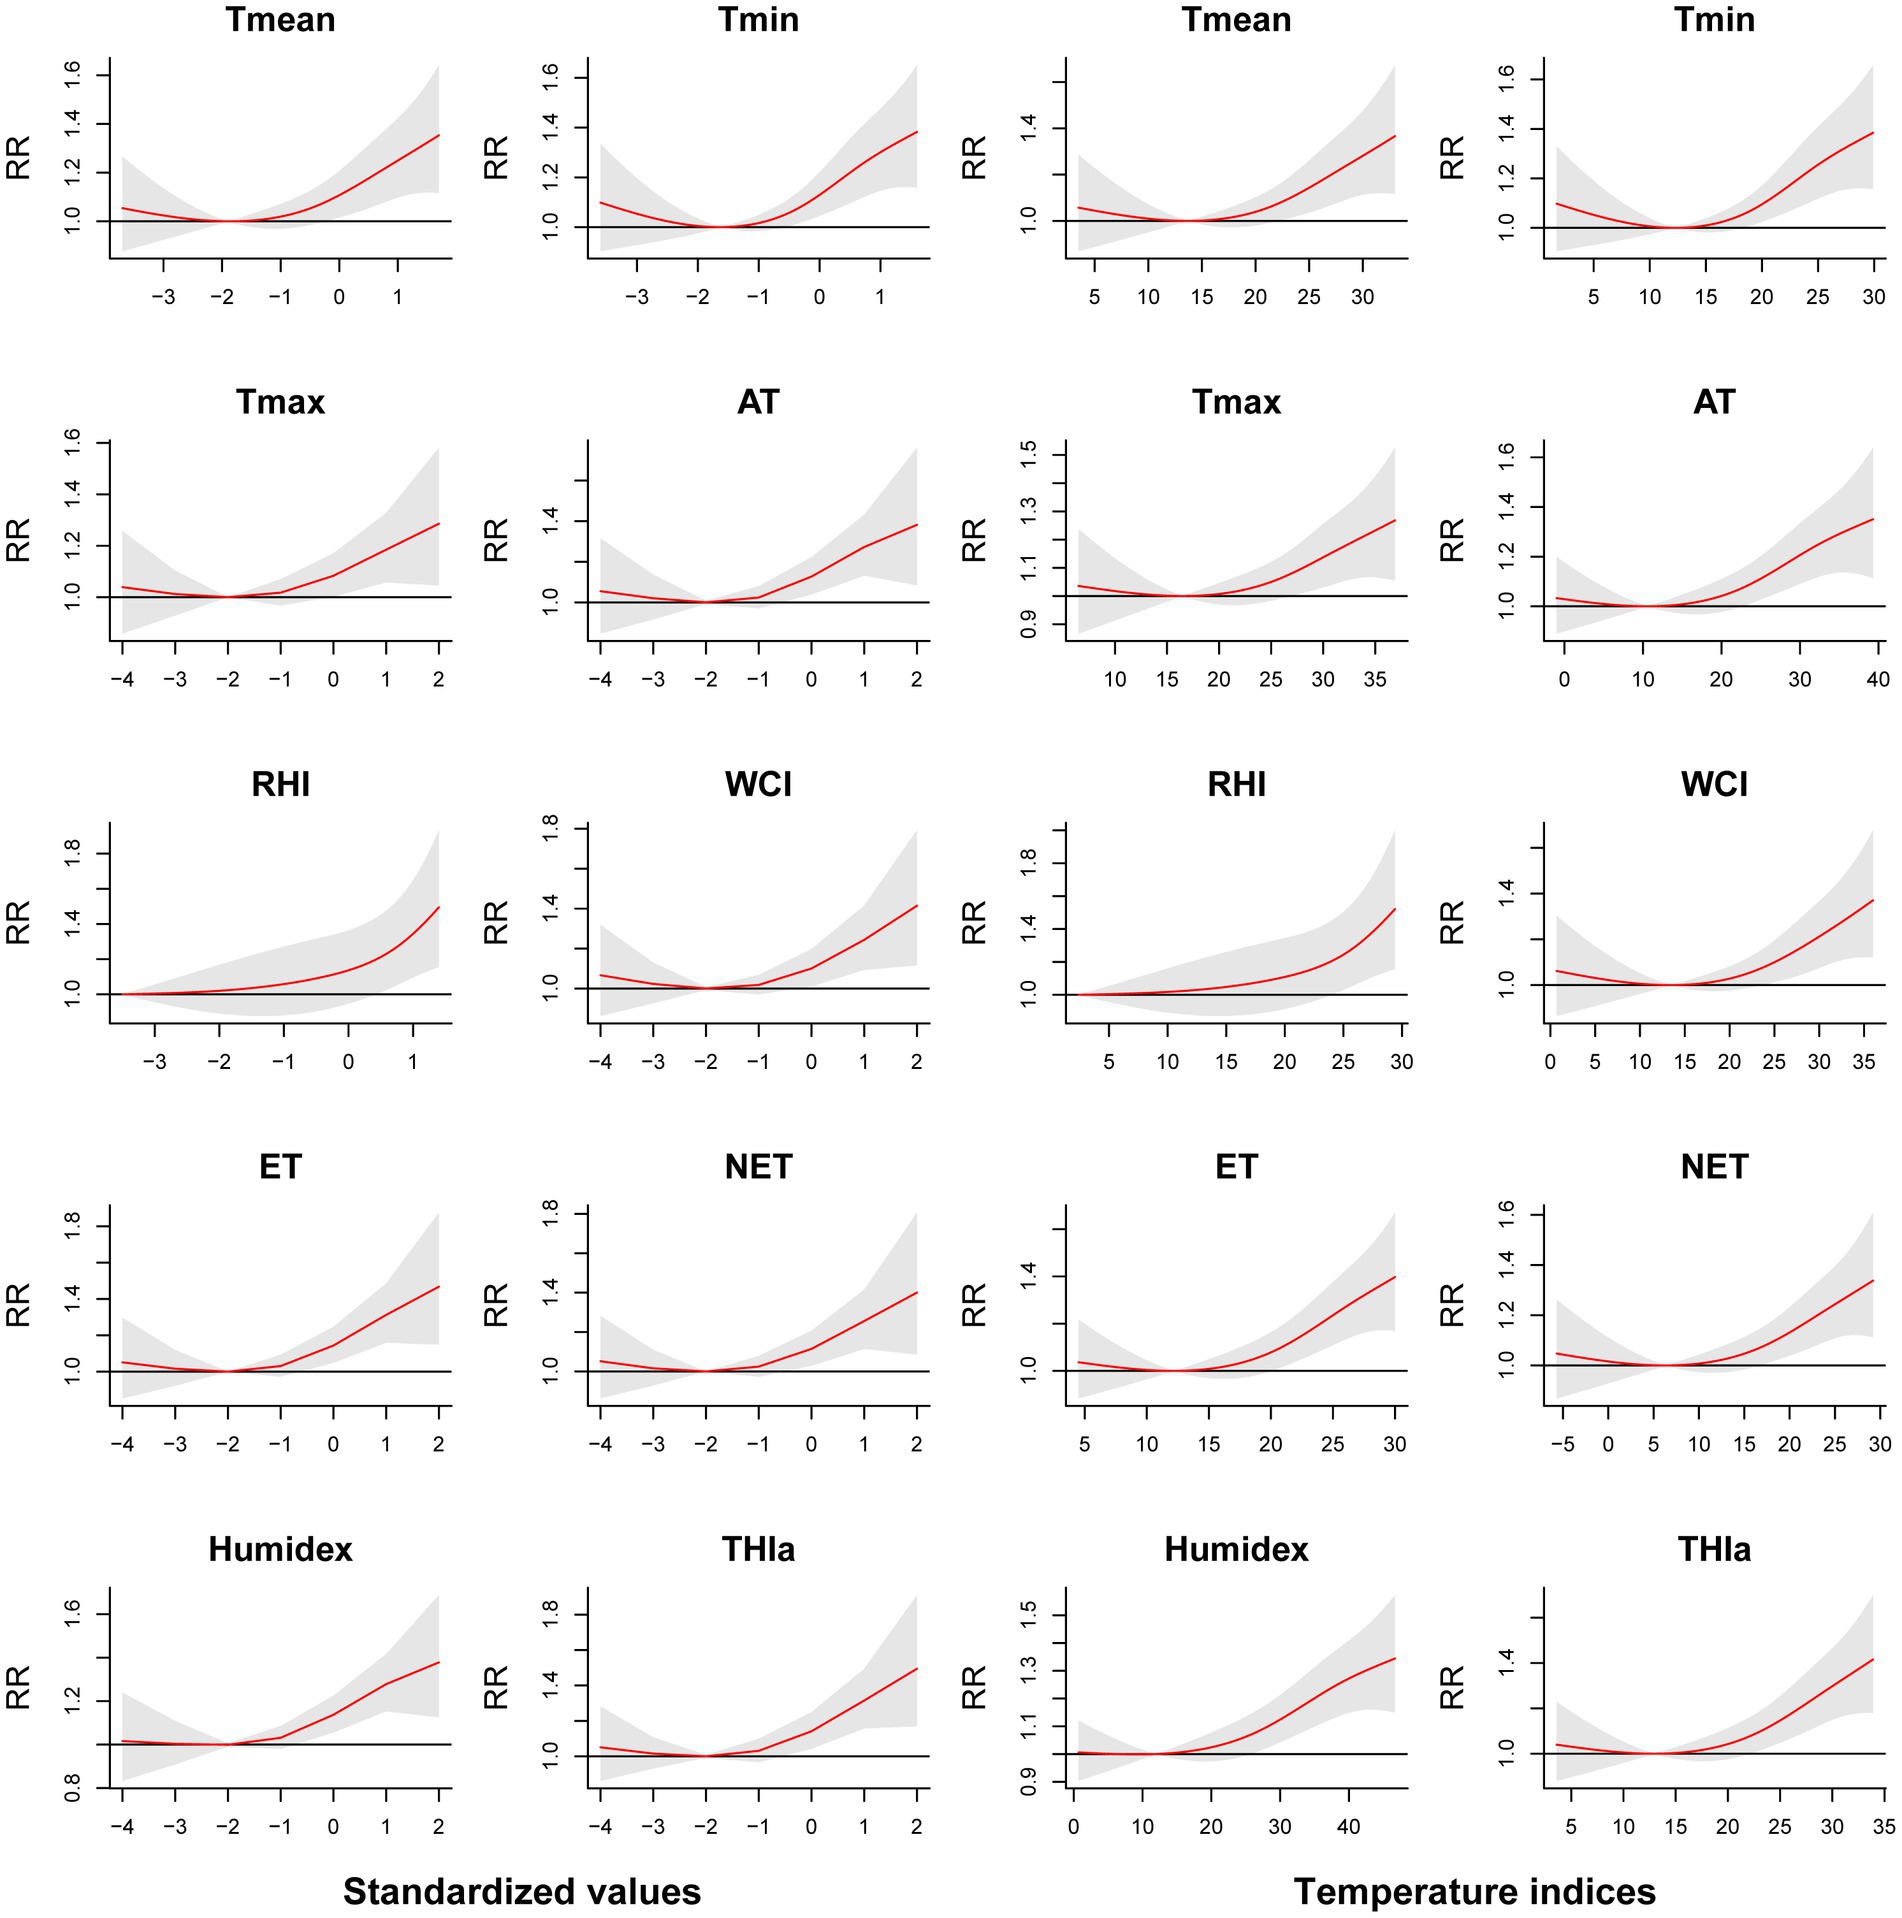
Figure 2. Cumulative relative risks of ten temperature-related indices (standardized values and temperature indices) associated with EADs due to MBDs (lag 0–5).
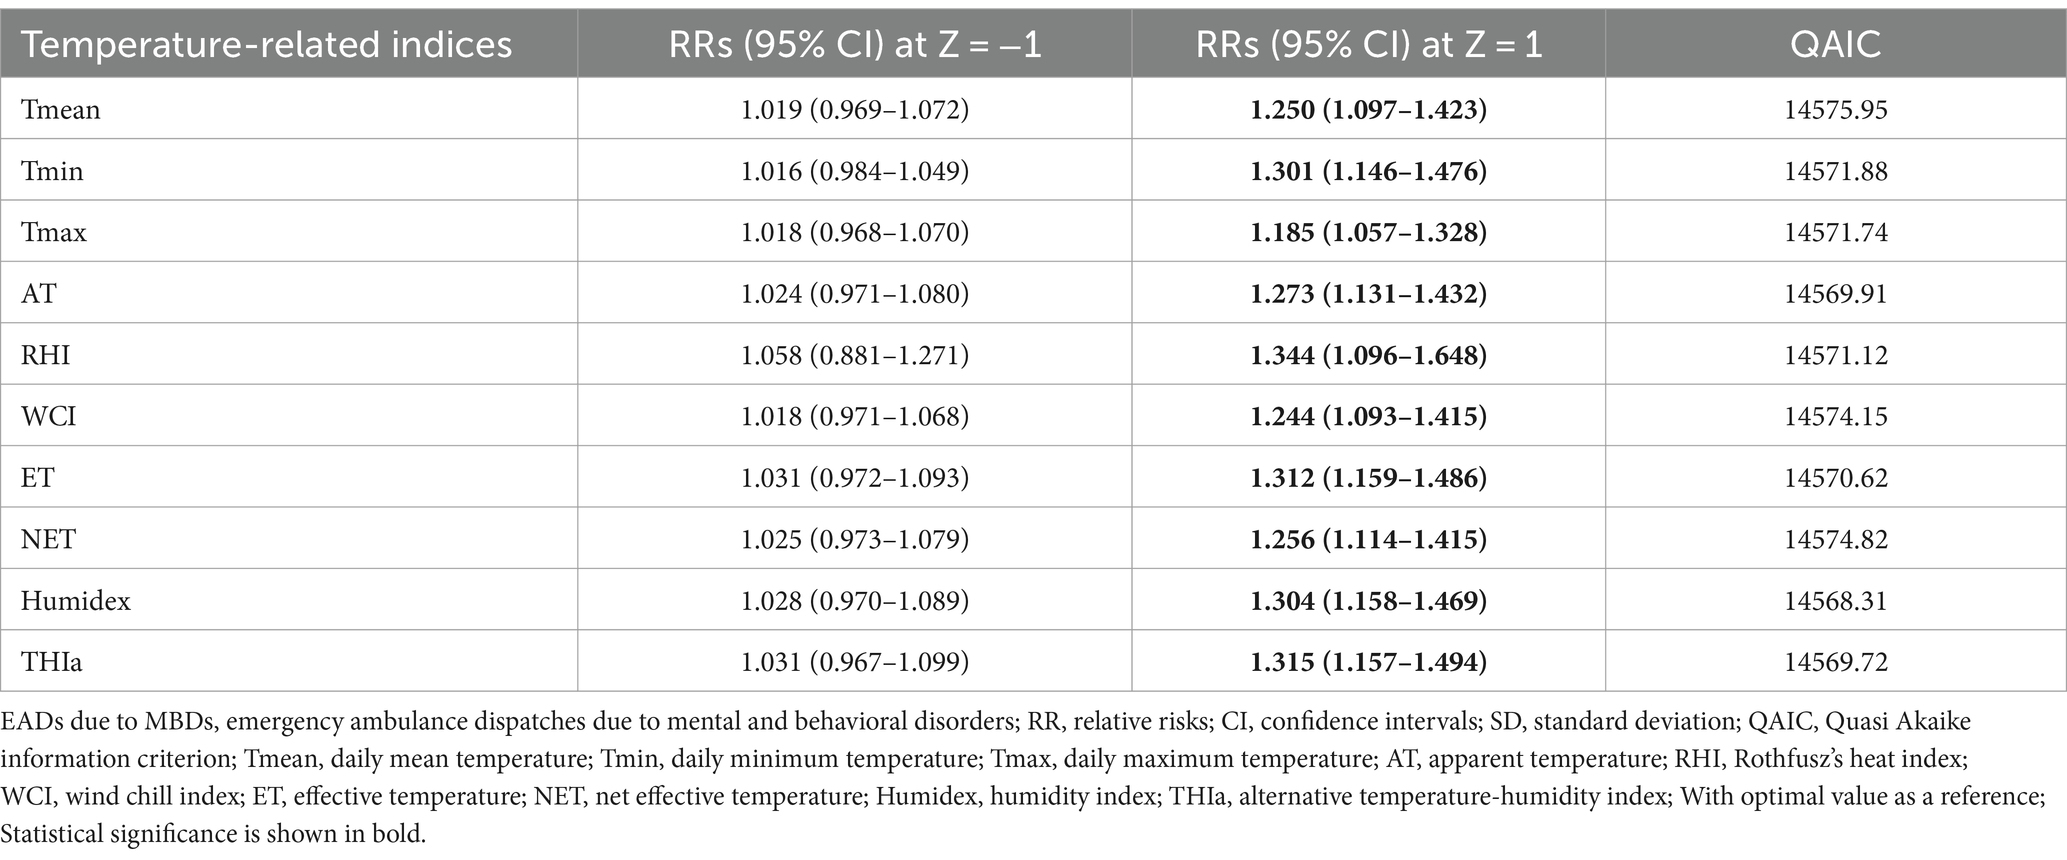
Table 3. Cumulative relative risks of ten temperature-related indices at Z = ±1 associated with EADs due to MBDs (lag 0–5).
Table 4 presents the single-day (lag 0–lag 5) and cumulative (lag 0–1—lag 0–5) effects of Humidex on EADs due to MBDs, at the 1st, 10th, 90th, and 99th percentiles of Humidex compared with Humidex at the lowest risk (3.2th percentile, 12.00°C). Our study found that the 90th percentile (RR = 1.101, 95% CI: 1.056–1.147) and 99th percentile (RR = 1.110, 95% CI: 1.058–1.165) of Humidex indicated a significant short-term effect at lag 0, lasting for 4 days. High temperature (90th percentile, 41.90°C) significantly increased the risk of EADs due to MBDs (RR = 1.318, 95% CI: 1.159–1.499), and a 33.8% increase (RR = 1.338, 95% CI: 1.153–1.553) was observed for exposure to extreme high temperature (99th percentile, 44.20°C) over lag 0–5 days. The cumulative effects between Humidex and EADs due to MBDs over 5 lag days are depicted in Figure 3. The cumulative exposure-response curve between Humidex and EADs due to MBDs exhibited a J-shaped. The result demonstrated that high temperature significantly raised the risk of EADs due to MBDs, while no significant cumulative effects of low temperature was observed at lag 0–5. Additionally, it was observed that the threshold of Humidex for the high temperature effect was 26.80°C (34.6th percentile) at lag 0–5, suggesting that the harmful effect became noticeable when the Humidex exceeded or equaled 26.80°C. Supplementary Figures S5, S6 depict the 3D graph and contour plot, respectively, illustrating the distribution of the effects of different Humidex on EADs due to MBDs across different lag periods. Both figures visually and intuitively illustrated the exposure-lag-response relationship between Humidex and EADs due to MBDs. Simultaneously, for comparison, Supplementary Figure S7 shows the cumulative relative risks of nine other temperature-related indices associated with EADs due to MBDs. It is evident from the figure that all indices exhibit a J-shaped relationship. Similar to Humidex, only high temperatures have an impact on the acute onset of MBDs, although the threshold temperature for each index varies significantly.
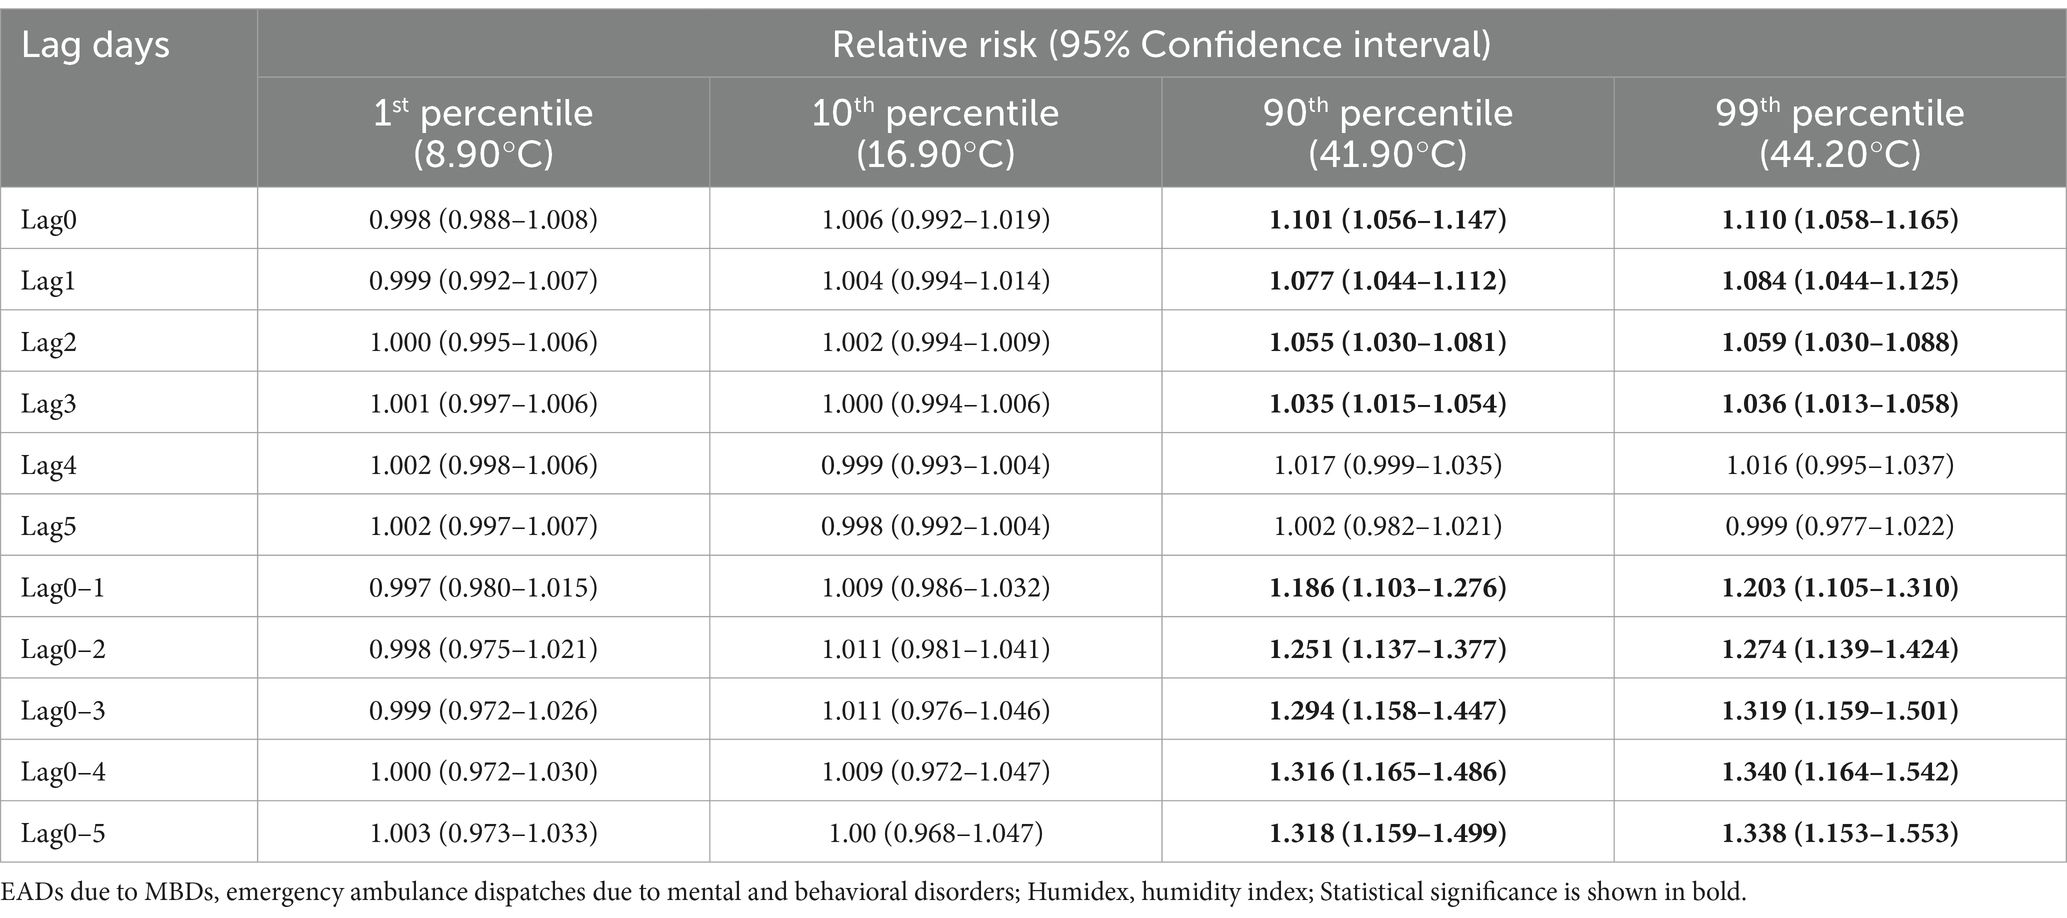
Table 4. Single-day (lag 0–lag 5) and cumulative (lag 0–1—lag 0–5) effects of Humidex on EADs due to MBDs, at different percentiles of Humidex relative to Humidex at the lowest risk (3.2th percentile, 12.00°C).

Figure 3. Cumulative relative risks of Humidex associated with EADs due to MBDs at lag 0–5.
Table 5 and Figure 4 show the findings of the subgroup analysis. The results indicate a significant association in males, females, 15–39 age group, and 40–59 age group. Among these groups, the highest relative risks were observed for extreme high temperature exposure in the 40–59 age group at lag 0–5 (RR = 1.433, 95% CI: 1.072–1.917). Notably, we did not find significant positive associations in the 0–14 and 60+ age groups. Figure 4 provides the exposure-response curves illustrating the relationship between Humidex and EADs due to MBDs at a lag of 0–5 days. Similarly, only males, females, 15–39 age group, and 40–59 age group displayed consistency with the overall population analysis outcome. The threshold temperatures for these groups were 32.20°C, 26.10°C, 28.70°C, and 36.40°C, respectively. Supplementary Table S3 presents the cumulative effects of Humidex on EADs due to MBDs during the cold and warm seasons. Clearly, the warm season predominantly contributes to this impact, with the highest RR value reaching 1.326 (95% CI: 1.119–1.572) during high Humidex in the warm season.
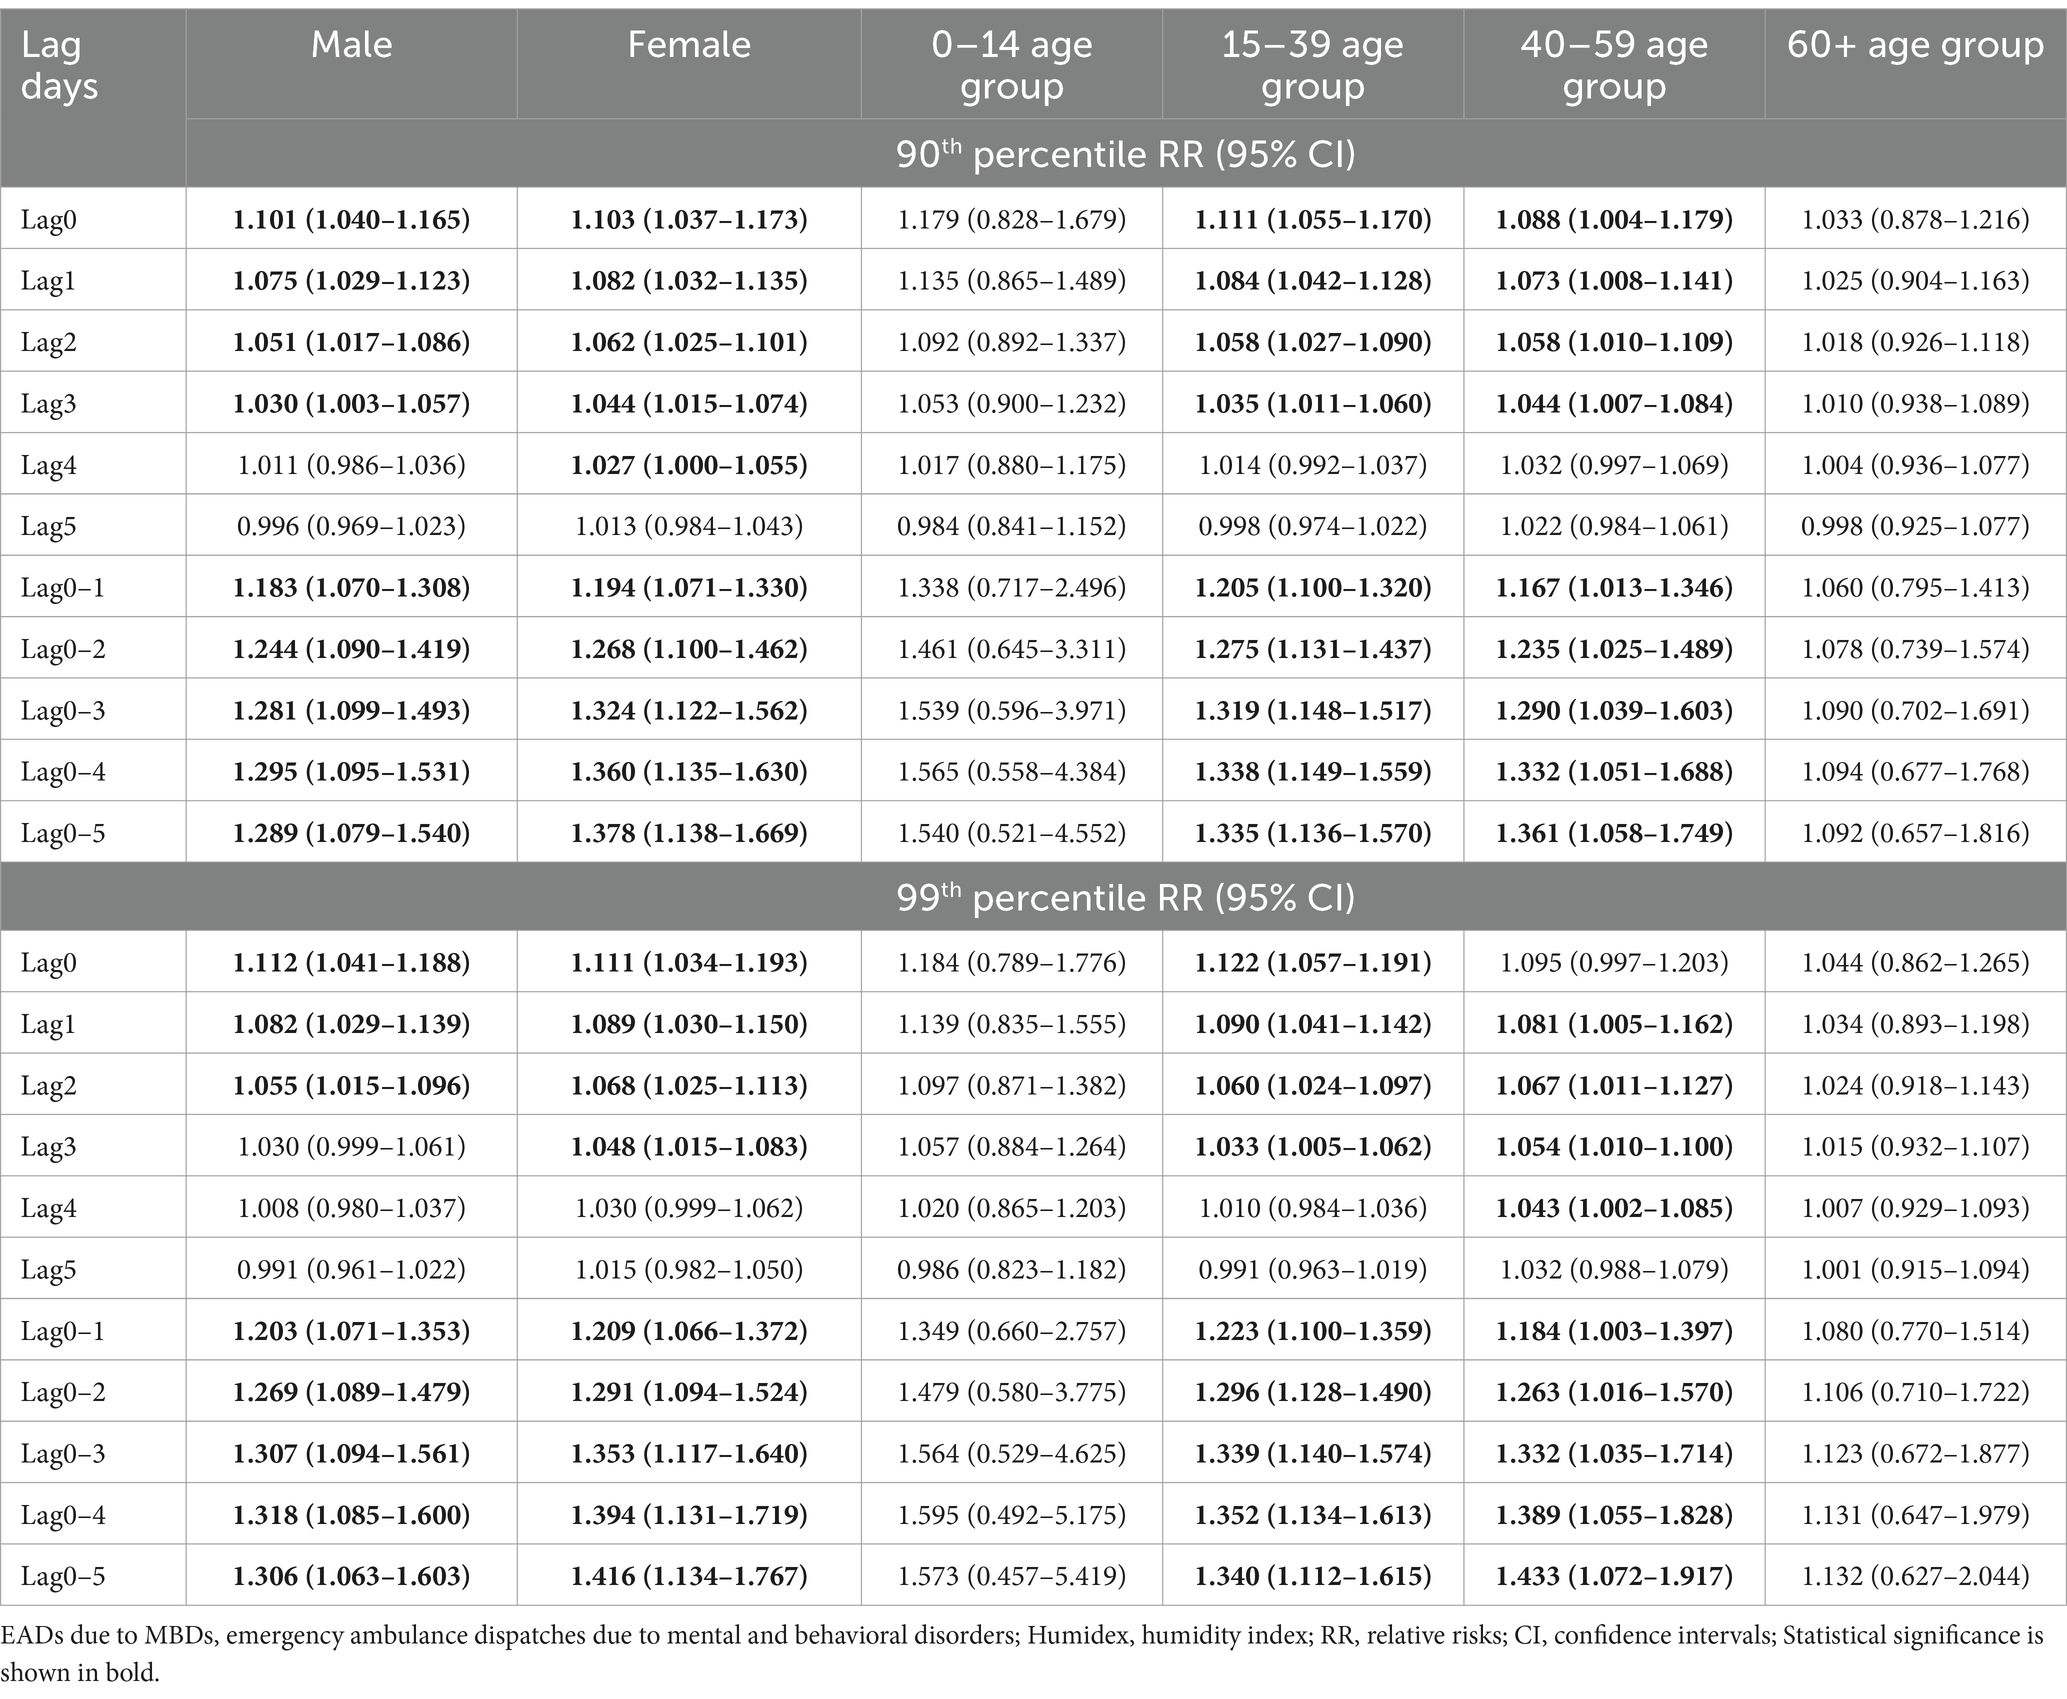
Table 5. Single-day (lag 0–lag 5) and cumulative (lag 0–1—lag 0–5) effects of Humidex on EADs due to MBDs stratified by sex and age, at the 90th and 99th percentiles of Humidex relative to Humidex at the lowest risk.
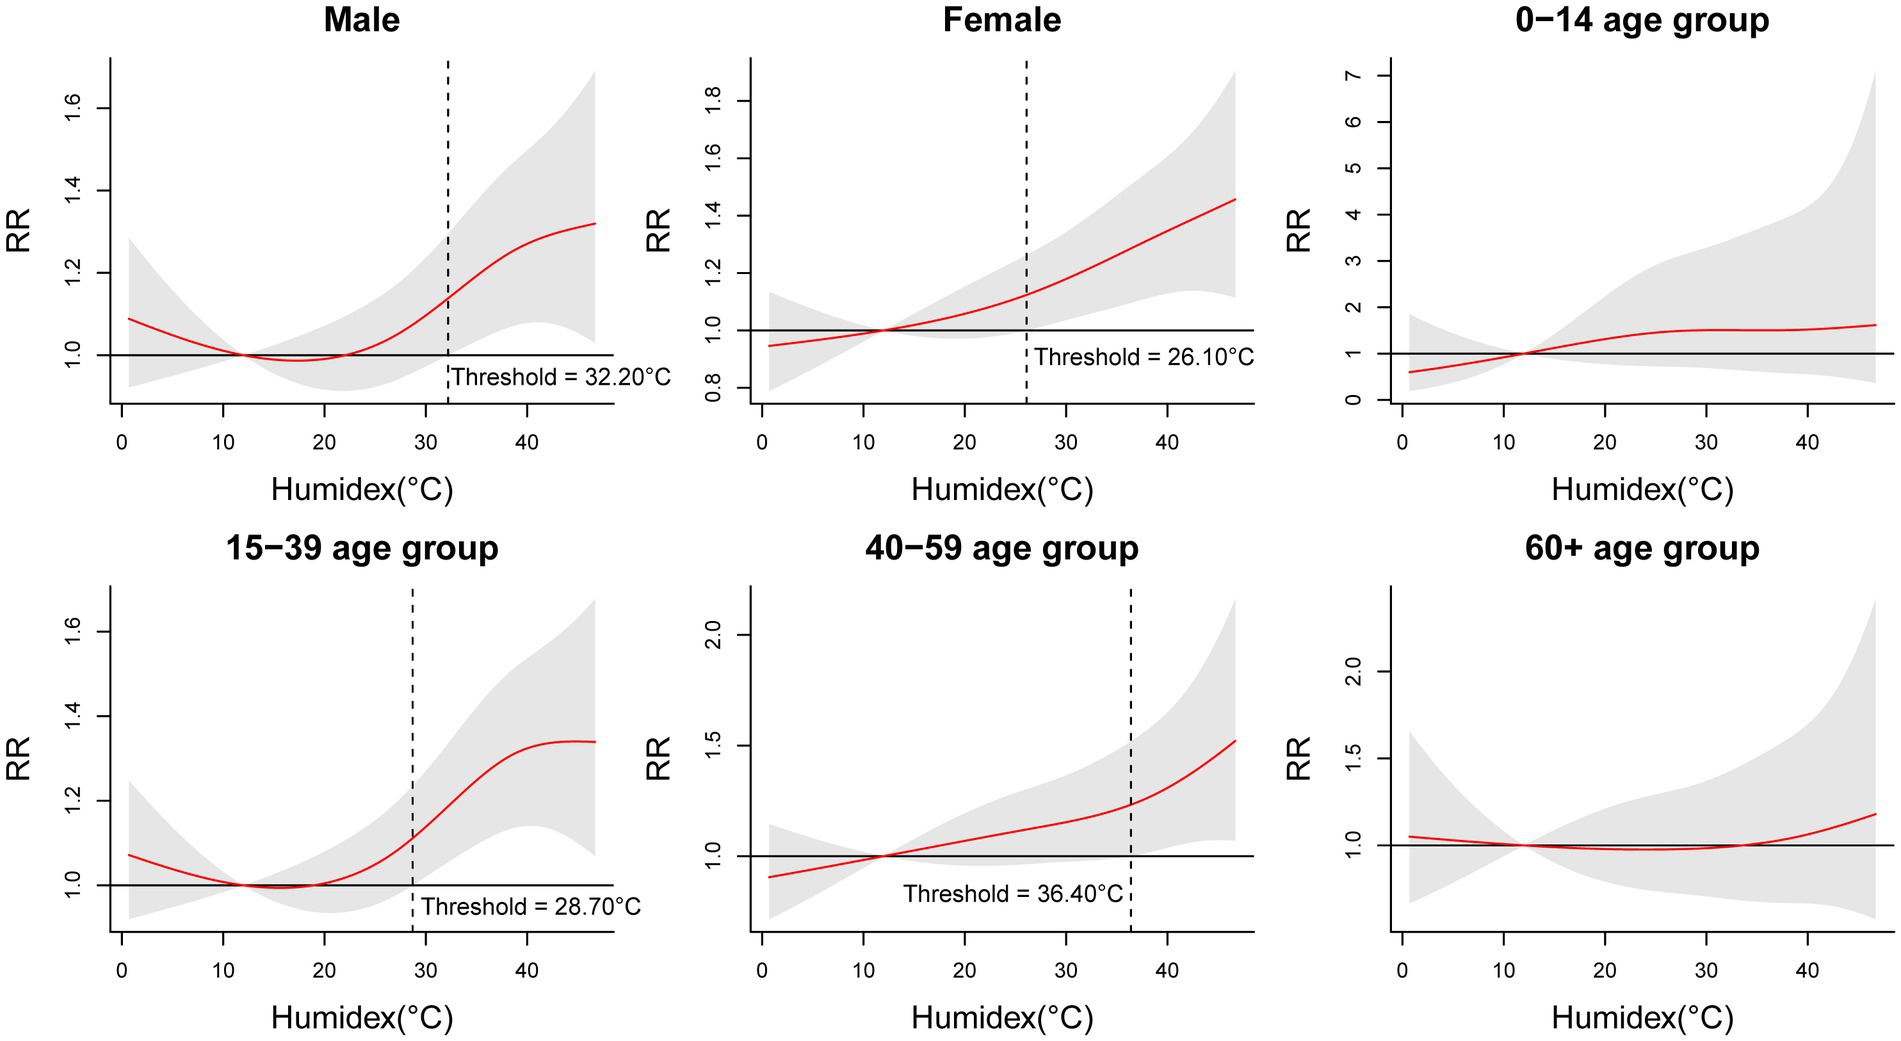
Figure 4. Cumulative relative risks of Humidex associated with EADs due to MBDs stratified by sex and age at lag 0–5.
Supplementary materials display the results of sensitivity analyses. Supplementary Figure S8 illustrates the temporal variations for two periods (2013–2016 and 2017–2020). Results for both periods exhibit a J-shaped pattern, indicating that only high Humidex values have an impact on EADs due to MBDs. The temporal change did not significantly affect the outcomes. Modifying the degrees of freedom for wind speed and long-term trend did not substantially alter the significant impact of high Humidex on EADs due to MBDs (Supplementary Figures S9, S10). Likewise, adjusting for the maximum lag days did not result in any discernible changes in the cumulative effects (Supplementary Figure S11). After substituting NO2 confounding factors with other confounding factors related to pollutants, the outcomes remained relatively unchanged (Supplementary Figure S12). Additionally, after excluding the data post the COVID-19 epidemic, no significant changes were observed in our results (Supplementary Figure S13). The aforementioned sensitivity analyses demonstrate the stability of our results.
Supplementary Figure S14 depicts the three-dimensional graph illustrating the interaction effect of air pollutants and the Humidex on EADs due to MBDs. It can be observed that for pollutants such as NO2, SO2, PM2.5, and PM10, at lower Humidex, an increase in pollutant concentration is associated with a noticeable rise in EADs due to MBDs, reaching its peak at low Humidex and high pollutant concentrations. Conversely, for CO and O3, the EADs due to MBDs peaks at high Humidex and relatively higher pollutant concentrations. Our study findings elucidate the interaction effect between pollutants and Humidex on EADs due to MBDs. Specifically, for pollutants like NO2, SO2, PM2.5, and PM10, a lower Humidex may enhance the adverse impact of air pollutants on EADs due to MBDs. On the other hand, for CO and O3, a higher Humidex may increase their adverse effects on EADs due to MBDs.
This study represents the first investigation to screen various temperature-related indices and assess the influence of the optimal index on EADs due to MBDs in Shenzhen, China. Our findings demonstrated a significant association between exposure to high Humidex and an increase in EADs due to MBDs. The QAIC results indicated that Humidex was the best index for associating with EADs due to MBDs. Additionally, the results showed that high Humidex affected EADs due to MBDs on the day of exposure and lasted for about 4 days. Subgroup analysis results revealed that the effect of high Humidex on EADs due to MBDs was more significant in males, females, 15–39 age group, and 40–59 age group. However, this study did not observe any cold effect on EADs due to MBDs.
Previous studies have primarily focused on examining the association between a single composite index and emergency room visits due to MBDs. A study conducted in Yancheng discovered a connection between increased emergency room admissions for MBDs and short-term exposure to high apparent temperature (23). In recent years, other comprehensive indices have become widely used in meteorological research. For instance, a study in Romania assessed summer thermal comfort using the net effective temperature index (39). Carder et al. found that the wind chill index is considered to be a better index than other temperature-related indices for estimating the impact of cold on health (40). However, no studies have examined comprehensive indices to determine the best index for exploring the influence of temperature on EADs due to MBDs. Consequently, there is currently no temperature index and threshold suitable for subtropical areas to protect the mental health of individuals. By utilizing a standardized method that eliminates the influence of dimensions, our study allows for direct comparisons between different temperature-related indices. Humidex, proposed by Masterton and Richardson, is a temperature-humidity combination index utilized to reflect human-perceived heat, widely employed by Canadian meteorologists to describe an individual’s thermal comfort in hot or humid weather (27). Compared with a single index, Humidex more comprehensively captures the combined impact of temperature and humidity on mental health. Compared with other comprehensive indices, it is a thermal comfort index that specifically describes hot and humid weather. Similarly, Humidex was also selected as the research index in the previous study on temperature and depression (41).
Recent studies have shown a significant association between high ambient temperatures and hospital admissions for MBDs (17, 42, 43). In Shanghai, the cumulative relative risk of high temperature (33.10°C) was 1.266 (95% CI: 1.074–1.493) at lag 0–1 (14). A study in Ho Chi Minh City demonstrated a strong correlation between the main and added effects of heat waves on MBDs (42). However, conflicting conclusions were drawn in other studies. A case-crossover study in Beijing indicated that both low and high apparent temperatures could contribute significantly to emergency visits for psychiatric disorders (15). This discrepancy may be attributed to the higher latitude and lower average temperature in Beijing compared to Shenzhen, where the effect of low temperature is more noticeable. A previous study in Shenzhen investigated the impact of ambient temperature on emergency ambulance dispatches due to MBDs, reporting relative risk values of 1.01 (95% CI: 0.61–1.70) for the heat effect and 1.26 (95% CI: 1.06–1.51) for the cold effect (44). However, this study had limitations, including a small sample size resulting from data collection only from 2015 to 2016, as well as stratification by season, which hindered the observation of existing effects. In our study, we observed J-shaped cumulative exposure–response curves, where EADs due to MBDs increased at high Humidex. Harvesting effects of high Humidex were noted in our study, leading to an overestimation of EADs due to MBDs attributable to high Humidex. Several factors were suggested to potentially impact the appearance of these harvesting effects, including the socioeconomic and baseline health status of the population, interactions between air pollutants and meteorological variables, and the choice of model parameters. High Humidex was found to hasten the onset of mental disorders in individuals already in a high-risk pool but did not cause the recruitment of new individuals into the pool, resulting in the observed harvesting effects. Shenzhen, being a relatively young economically developed city with a constant influx of population, particularly in the younger age groups, may experience an increase in the incidence of high-risk individuals due to high Humidex. However, the rate of recruitment of new individuals into the high-risk group may not increase at the same rate.
Age and sex play a crucial role in influencing the occurrence of EADs due to MBDs associated with high temperatures. Previous studies conducted in South Korea and California have suggested that the older adult constitute a susceptible population (29, 43). However, conflicting results from other studies have proposed that young individuals or those under 45 years old may be more susceptible to high temperature compared to the older adult (13, 23). Variations in the results of age subgroups may stem from differences in the demographic composition of various cities and the neglect of individual socio-economic factors. Notably, Shenzhen is an immigrant city with a sizable young population, potentially making young people more prone to mental disorders acute attacks triggered by high temperature. Regarding gender differences, some studies have suggested that women are more susceptible (14, 17), while others have indicated that men are at higher risk (15, 42). Discrepancies in these findings could be attributed to physiological variations (45), lifestyle differences (46, 47), and adaptability between genders (48, 49). Therefore, further research is necessary to enhance our understanding of the effect of gender on the relationship between temperature and mental disorders.
Furthermore, different geographical areas exhibit varying threshold temperatures for the heat effect. Our study has identified a Humidex threshold for the high temperature effect at 26.80°C. The Humidex thresholds for males, females, 15–39 age group, and 40–59 age group are 32.20°C, 26.10°C, 28.70°C, and 36.40°C, respectively. It is important to note that the ambient temperature threshold in Shanghai is reported to be 24.60°C (14), while in northern Vietnam it can be as high as 35.00°C (42). These discrepancies in results may be attributed to different statistical models, temperature indices, study locations, or demographic factors. In addition, our study also found there may be interaction between pollutants and meteorological factors, and more accurate models are needed to quantitatively analyze the impact of interaction on mental disorders in the future.
The biological mechanism underlying the associations between meteorological variables and MBDs has been widely reported. MBDs encompass disorders of brain functional activities, influencing mental aspects such as cognition, emotion, behavior, and will to varying degrees. Patients with MBDs have diverse genetic backgrounds and living environments. However, the specific mechanism by which meteorological factors increase the incidence of MBDs remains unclear. On one hand, MBDs patients often experience cognitive impairments that hinder their ability to understand and respond to extreme weather conditions. This lack of appropriate evasive measures further contributes to the development of these disorders (50). Additionally, certain psychotropic drugs may interfere with the body’s temperature regulation system, increasing susceptibility to temperature changes (51). Neurotransmitters such as dopamine, serotonin, and norepinephrine are known to regulate body temperature through the hypothalamus-pituitary-thyroid and hypothalamus-pituitary–adrenal axes (52–54). Consequently, high temperature has been found to negatively impact cognitive function, leading to increased plasma serotonin levels and dopamine suppression (55). In the context of schizophrenia, the dopamine hypothesis suggests that an excess of dopamine activity may underlie its symptoms (56). Similarly, patients with bipolar disorder commonly exhibit symptoms such as mood swings, anxiety, and insomnia, which are associated with abnormal dopamine and serotonin levels (57).
This study builds upon previous literature that explored the influence of temperature on MBDs. Our research has several strengths. Firstly, EADs data may be more responsive to temperature and humidity changes compared to hospitalization data. The EADs were collected from the Shenzhen First-aid Command Center which handles calls from the entire city and covers a significant portion of the permanent population in Shenzhen. Therefore, the results obtained in this study may accurately represent the relationship between temperature-related indices and EADs due to MBDs. Secondly, we standardized and screened ten different temperature-related indices in our study. This approach allowed us to compare these indices and identify the most suitable one for investigating the relationship between temperature and EADs due to MBDs through standardization and QAIC. Thirdly, after selecting the optimal index, we specifically studied the immediate and lagged effect of Humidex on EADs due to MBDs at different percentiles and identified the threshold temperature. However, there are some limitations that should be addressed. Firstly, the EADs data did not include detailed individual medical records, which may have resulted in inappropriate MBDs diagnoses. Detailed diagnostic data are needed in the future to enhance the reliability of the obtained MBDs patient data. Secondly, the local weather data were based on station monitoring data rather than direct measurements of individuals’ real environmental exposure. This might have contributed to exposure misclassification to some extent in our study. Additionally, we lacked information on personal lifestyle, socioeconomic status, occupation, education level, etc. Consequently, we were unable to adjust for the impact of these factors on our models and results. Future research should consider incorporating these variables into the models to enhance the accuracy of the results.
Our study indicates that Humidex was the most appropriate index for evaluating the short-term effects of temperature on EADs due to MBDs. In subtropical areas like Shenzhen, high Humidex may increase the risk of EADs caused by MBDs. When Humidex exceeds 26.80°C, the high temperature effect gradually becomes significant. With the ever-growing impact of global warming, the number of MBDs linked to high temperatures may escalate, exacerbating the disease burden. Based on this study, policymakers in the healthcare sector could enhance relevant legislation and regulations based on measurement indices, critical temperature thresholds, and vulnerable populations. Additionally, there should be a reasonable allocation of medical resources to accommodate the potential surge in emergency treatments. Social institutions specific to this issue can notify the public about anticipated hot and humid weather conditions and their duration, providing detailed information on the adverse effects of high temperature on the human body and opening public cooling centers. Individuals, especially susceptible people should receive high temperature warning information in advance and take cooling measures such as using air conditioners or drinking cold beverages, thus reducing the number of mental disorders requiring emergency treatment in high Humidex environments.
The raw data supporting the conclusions of this article will be made available by the authors, without undue reservation.
ZiY: Conceptualization, Methodology, Software, Data curation, Writing–original draft, Writing–review & editing. MJ: Data curation, Writing–review & editing. ZhY: Writing–review & editing. SC: Writing–review & editing. SH: Resources, Supervision, Writing–review & editing. JC: Resources, Supervision, Writing–review & editing. XL: Resources, Supervision, Writing–review & editing. NL: Resources, Supervision, Writing–review & editing. PW: Data curation, Writing–review & editing. PY: Supervision, Project administration, Funding acquisition, Writing–review & editing. HJ: Methodology, Writing–review & editing, Supervision.
The author(s) declare financial support was received for the research, authorship, and/or publication of this article. This work was supported by the National Natural Science Foundation of China [grant numbers 82173628 and 81973004].
The authors appreciate the contributions made to this study by every staff member of the Shenzhen First-aid Command Center, Shenzhen Meteorological Bureau, and Shenzhen Environmental Monitoring Station.
The authors declare that the research was conducted in the absence of any commercial or financial relationships that could be construed as a potential conflict of interest.
All claims expressed in this article are solely those of the authors and do not necessarily represent those of their affiliated organizations, or those of the publisher, the editors and the reviewers. Any product that may be evaluated in this article, or claim that may be made by its manufacturer, is not guaranteed or endorsed by the publisher.
The Supplementary material for this article can be found online at: https://www.frontiersin.org/articles/10.3389/fpubh.2024.1343550/full#supplementary-material
1. World Health Organization. Who Fact Sheet on Mental Disorders. (2022). https://www.who.int/en/news-room/fact-sheets/detail/mental-disorders (Accessed June 8, 2022).
2. Steel, Z, Marnane, C, Iranpour, C, Chey, T, Jackson, JW, Patel, V, et al. The global prevalence of common mental disorders: a systematic review and Meta-analysis 1980–2013. Int J Epidemiol. (2014) 43:476–93. doi: 10.1093/ije/dyu038
3. Vigo, D, Thornicroft, G, and Atun, R. Estimating the true global burden of mental illness. Lancet Psychiatry. (2016) 3:171–8. doi: 10.1016/S2215-0366(15)00505-2
4. Huang, Y, Wang, Y, Wang, H, Liu, Z, Yu, X, Yan, J, et al. Prevalence of mental disorders in China: a cross-sectional epidemiological study. Lancet Psychiatry. (2019) 6:211–24. doi: 10.1016/S2215-0366(18)30511-X
5. GBD. Mental disorders collaborators. Global, regional, and National Burden of 12 mental disorders in 204 countries and territories, 1990–2019: a systematic analysis for the global burden of disease study 2019. Lancet Psychiatry. (2019) 9:137–50. doi: 10.1016/S2215-0366(21)00395-3
6. Intergovernmental Panel on Climate Change. Ar6 Synthesis Report, Climate Change 2023. (2023). https://www.ipcc.ch/report/ar6/syr/ (Accessed March 20, 2023).
7. McMichael, AJ, Woodruff, RE, and Hales, S. Climate change and human health: present and future risks. Lancet. (2006) 367:859–69. doi: 10.1016/S0140-6736(06)68079-3
8. Page, LA, and Howard, LM. The impact of climate change on mental health (but will mental health be discussed at Copenhagen?). Psychol Med. (2010) 40:177–80. Epub 2009/11/27. doi: 10.1017/S0033291709992169
9. Berry, HL, Waite, TD, Dear, KBG, Capon, AG, and Murray, V. The case for systems thinking about climate change and mental health. Nat Clim Chang. (2018) 8:282–90. doi: 10.1038/s41558-018-0102-4
10. Palinkas, LA, and Wong, M. Global climate change and mental health. Curr Opin Psychol. (2020) 32:12–6. doi: 10.1016/j.copsyc.2019.06.023
11. Vida, S, Durocher, M, Ouarda, TBMJ, and Gosselin, P. Relationship between ambient temperature and humidity and visits to mental health emergency departments in Québec. Psychiatr Serv. (2012) 63:1150–3. doi: 10.1176/appi.ps.201100485
12. Wang, X, Lavigne, E, Ouellette-kuntz, H, and Chen, BE. Acute impacts of extreme temperature exposure on emergency room admissions related to mental and behavior disorders in Toronto, Canada. J Affect Disord. (2014) 155:154–61. doi: 10.1016/j.jad.2013.10.042
13. Page, LA, Hajat, S, Kovats, RS, and Howard, LM. Temperature-related deaths in people with psychosis, dementia and substance misuse. Br J Psychiatry. (2012) 200:485–90. doi: 10.1192/bjp.bp.111.100404
14. Peng, Z, Wang, Q, Kan, H, Chen, R, and Wang, W. Effects of ambient temperature on daily hospital admissions for mental disorders in Shanghai, China: a time-series analysis. Sci Total Environ. (2017) 590-591:281–6. doi: 10.1016/j.scitotenv.2017.02.237
15. Niu, Y, Gao, Y, Yang, J, Qi, L, Xue, T, Guo, M, et al. Short-term effect of apparent temperature on daily emergency visits for mental and behavioral disorders in Beijing, China: a time-series study. Sci Total Environ. (2020) 733:139040. doi: 10.1016/j.scitotenv.2020.139040
16. Brandl, EJ, Lett, TA, Bakanidze, G, Heinz, A, Bermpohl, F, and Schouler-Ocak, M. Weather conditions influence the number of psychiatric emergency room patients. Int J Biometeorol. (2018) 62:843–50. doi: 10.1007/s00484-017-1485-z
17. Almendra, R, Loureiro, A, Silva, G, Vasconcelos, J, and Santana, P. Short-term impacts of air temperature on hospitalizations for mental disorders in Lisbon. Sci Total Environ. (2019) 647:127–33. doi: 10.1016/j.scitotenv.2018.07.337
18. Deng, X, Brotzge, J, Tracy, M, Chang, HH, Romeiko, X, Zhang, W, et al. Identifying joint impacts of Sun radiation, temperature, humidity, and rain duration on triggering mental disorders using a high-resolution weather monitoring system. Environ Int. (2022) 167:107411. doi: 10.1016/j.envint.2022.107411
19. Taniguchi, K, Takano, M, Tobari, Y, Hayano, M, Nakajima, S, Mimura, M, et al. Influence of external natural environment including sunshine exposure on public mental health: a systematic review. Psychiatry Int (Basel). (2022) 3:91–13. doi: 10.3390/psychiatryint3010008
20. Aguglia, A, Serafini, G, Escelsior, A, Amore, M, and Maina, G. What is the role of meteorological variables on involuntary admission in psychiatric ward? An Italian cross-sectional study. Environ Res. (2020) 180:108800. doi: 10.1016/j.envres.2019.108800
21. Shiue, I, Perkins, DR, and Bearman, N. Physically equivalent temperature and mental and behavioural disorders in Germany in 2009–2011. J Ment Health. (2016) 25:148–53. doi: 10.3109/09638237.2015.1101431
22. China National Meteorological Science Data Center. The monthly standard value of ground climate in China (1981–2010). (2023). Available at: https://data.cma.cn/data/weatherBk.html (Accessed May 8, 2023).
23. Min, M, Shi, T, Ye, P, Wang, Y, Yao, Z, Tian, S, et al. Effect of apparent temperature on daily emergency admissions for mental and behavioral disorders in Yancheng, China: a time-series study. Environ Health. (2019) 18:98. doi: 10.1186/s12940-019-0543-x
24. Rothfusz, LPSSD, SRH, Worth. F, Texas. The heat index equation National Weather Service Technical Attachment. (1990). Available at: https://www.weather.gov/media/wrh/online_publications/TAs/ta9024.pdf.
25. Gómez-Acebo, I, Dierssen-Sotos, T, and Llorca, J. Effect of cold temperatures on mortality in Cantabria (northern Spain): a case–crossover study. Public Health. (2010) 124:398–03. doi: 10.1016/j.puhe.2010.03.025
26. Jauregui, E, Cervantes, J, and Tejeda, A. Bioclimatic conditions in Mexico City – an assessment. Int J Biometeorol. (1997) 40:166–77. doi: 10.1007/s004840050038
27. Masterton, JM, and Richardson, F. Humidex: a method of quantifying human discomfort due to excessive heat and humidity: environment Canada. Atmos Environ. (1979)
28. Fan, C, Liu, F, Zhao, X, Ma, Y, Yang, F, Chang, Z, et al. An alternative comprehensive index to quantify the interactive effect of temperature and relative humidity on hand, foot and mouth disease: a two-stage time series study including 143 cities in mainland China. Sci Total Environ. (2020) 740:140106. doi: 10.1016/j.scitotenv.2020.140106
29. Lee, S, Lee, H, Myung, W, Kim, EJ, and Kim, H. Mental disease-related emergency admissions attributable to hot temperatures. Sci Total Environ. (2018) 616-617:688–94. doi: 10.1016/j.scitotenv.2017.10.260
30. Gasparrini, A, Armstrong, B, and Kenward, MG. Distributed lag non-linear models. Stat Med. (2010) 29:2224–34. doi: 10.1002/sim.3940
31. Gasparrini, A . Modeling exposure–lag–response associations with distributed lag non-linear models. Stat Med. (2014) 33:881–99. doi: 10.1002/sim.5963
32. Chen, R, Li, T, Cai, J, Yan, M, Zhao, Z, and Kan, H. Extreme temperatures and out-of-hospital coronary deaths in six large Chinese cities. J Epidemiol Community Health. (2014) 68:1119–24. doi: 10.1136/jech-2014-204012
33. State Council of the People's Republic of China. Decision of the State Council on Amending the Measures for Holidays of National Festival and Memorial Day. (2013). https://www.gov.cn/gongbao/content/2014/content_2561284.htm (Accessed Apr 28, 2024).
34. Lin, Y-K, Wang, Y-C, Lin, P-L, Li, M-H, and Ho, T-J. Relationships between cold-temperature indices and all causes and cardiopulmonary morbidity and mortality in a Subtropical Island. Sci Total Environ. (2013) 461-462:627–35. doi: 10.1016/j.scitotenv.2013.05.030
35. Aboubakri, O, Shoraka, HR, Karamoozian, A, Abedi Gheshlaghi, L, and Foroutan, B. Seasonal impact of air particulate matter on morbidity: interaction effect assessment in a time-stratified case-crossover design. Hum Ecol Risk Assess Int J. (2021) 27:2328–41. doi: 10.1080/10807039.2021.1999204
36. Meteorological Bureau of Shenzhen Municipality. General Situation of Climate and Characteristics of Four Seasons in Shenzhen. (2022). Available at: http://weather.sz.gov.cn/qixiangfuwu/qihoufuwu/qihouguanceyupinggu/qihougaikuang/content/post_3573760.html (Accessed December 20, 2023).
37. Aboubakri, O, Rezaee, R, Maleki, A, Safari, M, Goudarzi, G, et al. Temporal change in cold and heat-related burden of mortality: an evidence of increasing heat impact in Iran. Air Qual Atmos Health. (2023) 16:2421–9. doi: 10.1007/s11869-023-01414-0
38. Wang, C, Horby, PW, Hayden, FG, and Gao, GF. A novel coronavirus outbreak of Global Health concern. Lancet. (2020) 395:470–3. doi: 10.1016/s0140-6736(20)30185-9
39. Velea, L, Bojariu, R, Udristioiu, MT, Sararu, SC, Gothard, M, and Dascalu, SI. Assessment of summer thermal comfort using the net effective temperature index over Romania. AIP Conf Proc. (2019) 2071:040004. doi: 10.1063/1.5090071
40. Carder, M, McNamee, R, Beverland, I, Elton, R, Cohen, GR, Boyd, J, et al. The lagged effect of cold temperature and wind chill on cardiorespiratory mortality in Scotland. Occup Environ Med. (2005) 62:702–10. doi: 10.1136/oem.2004.016394
41. Zhou, YM, Ji, AL, Tang, EJ, Liu, JH, Yao, CY, Liu, XL, et al. The role of extreme high humidex in depression in Chongqing, China: a time series-analysis. Environ Res. (2023) 222:115400. doi: 10.1016/j.envres.2023.115400
42. Trang, PM, Rocklöv, J, Giang, KB, Kullgren, G, and Nilsson, M. Heatwaves and hospital admissions for mental disorders in northern Vietnam. PLoS One. (2016) 11:e0155609. doi: 10.1371/journal.pone.0155609
43. Sherbakov, T, Malig, B, Guirguis, K, Gershunov, A, and Basu, R. Ambient temperature and added heat wave effects on hospitalizations in California from 1999 to 2009. Environ Res. (2018) 160:83–90. doi: 10.1016/j.envres.2017.08.052
44. Wang, Q, He, Y, Hajat, S, Cheng, J, Xu, Z, Hu, W, et al. Temperature-sensitive morbidity Indicator: consequence from the increased ambulance dispatches associated with heat and cold exposure. Int J Biometeorol. (2021) 65:1871–80. doi: 10.1007/s00484-021-02143-8
45. Burse, RL . Sex differences in human thermoregulatory response to heat and cold stress. Hum Factors. (1979) 21:687–99. doi: 10.1177/001872087912210606
46. Canouï-Poitrine, F, Cadot, E, Spira, A, and Spira, A. Excess deaths during the august 2003 heat wave in Paris, France. Rev Epidemiol Sante Publique. (2006) 54:127–35. doi: 10.1016/s0398-7620(06)76706-2
47. Centers for Disease Control and Prevention (CDC). Heat-Related Deaths--United States, (1999-2003). MMWR Morbidity and mortality weekly report (2006) 55:796–98.
48. Indraganti, M, Ooka, R, and Rijal, HB. Thermal comfort in offices in India: behavioral adaptation and the effect of age and gender. Energ Buildings. (2015) 103:284–95. doi: 10.1016/j.enbuild.2015.05.042
49. Mersha, AA, and Van Laerhoven, F. A gender approach to understanding the differentiated impact of barriers to adaptation: responses to climate change in rural Ethiopia. Reg Environ Chang. (2016) 16:1701–13. doi: 10.1007/s10113-015-0921-z
50. Hansen, A, Bi, P, Nitschke, M, Ryan, P, Pisaniello, D, and Tucker, G. The effect of heat waves on mental health in a temperate Australian City. Environ Health Perspect. (2008) 116:1369–75. doi: 10.1289/ehp.11339
51. Hasegawa, H, Ishiwata, T, Saito, T, Yazawa, T, Aihara, Y, and Meeusen, R. Inhibition of the preoptic area and anterior hypothalamus by Tetrodotoxin alters thermoregulatory functions in exercising rats. J Appl Physiol. (2005) 98:1458–62. doi: 10.1152/japplphysiol.00916.2004
52. Beckman, AL . Effect of Intrahypothalamic norepinephrine on thermoregulatory responses in the rat. American Journal of Physiology-Legacy Content. (1970) 218:1596–04. doi: 10.1152/ajplegacy.1970.218.6.1596
53. Clark, WG . Changes in body temperature after Administration of Amino Acids, peptides, dopamine, neuroleptics and related agents. Neurosci Biobehav Rev. (1979) 3:179–1. doi: 10.1016/0149-7634(79)90010-1
54. Lambert, GW, Reid, C, Kaye, DM, Jennings, GL, and Esler, MD. Effect of sunlight and season on serotonin turnover in the brain. Lancet. (2002) 360:1840–2. doi: 10.1016/S0140-6736(02)11737-5
55. Taylor, L, Watkins, SL, Marshall, H, Dascombe, BJ, and Foster, J. The impact of different environmental conditions on cognitive function: a focused review. Front Physiol. (2016) 6:6. doi: 10.3389/fphys.2015.00372
56. Sung, T-I, Chen, M-J, Lin, C-Y, Lung, S-C, and Su, H-J. Relationship between mean daily ambient temperature range and hospital admissions for schizophrenia: results from a National Cohort of psychiatric inpatients. Sci Total Environ. (2011) 410-411:41–6. doi: 10.1016/j.scitotenv.2011.09.028
Keywords: emergency ambulance dispatches, mental and behavioral disorders, temperature related indices, humidity index, distributed lag non-linear models
Citation: Yin Z, Jingesi M, Yin Z, Chen S, Huang S, Cheng J, Li X, Liu N, Wang P, Yin P and Jiang H (2024) Short-term effects of temperature-related indices on emergency ambulance dispatches due to mental and behavioral disorders in Shenzhen, China. Front. Public Health. 12:1343550. doi: 10.3389/fpubh.2024.1343550
Edited by:
Mario R. Louzã, University of São Paulo, BrazilReviewed by:
Omid Aboubakri, Kurdistan University of Medical Sciences, IranCopyright © 2024 Yin, Jingesi, Yin, Chen, Huang, Cheng, Li, Liu, Wang, Yin and Jiang. This is an open-access article distributed under the terms of the Creative Commons Attribution License (CC BY). The use, distribution or reproduction in other forums is permitted, provided the original author(s) and the copyright owner(s) are credited and that the original publication in this journal is cited, in accordance with accepted academic practice. No use, distribution or reproduction is permitted which does not comply with these terms.
*Correspondence: Hongwei Jiang, jhwccc@hust.edu.cn
†These authors have contributed equally to this work and share first authorship
Disclaimer: All claims expressed in this article are solely those of the authors and do not necessarily represent those of their affiliated organizations, or those of the publisher, the editors and the reviewers. Any product that may be evaluated in this article or claim that may be made by its manufacturer is not guaranteed or endorsed by the publisher.
Research integrity at Frontiers
Learn more about the work of our research integrity team to safeguard the quality of each article we publish.