 ShaoPeng Che
 Shunan Zhang
 Jang Hyun Kim
- 1Department of Human-Artificial Intelligence Interaction, Sungkyunkwan University, Seoul, South Korea
- 2Department of Interaction Science, Sungkyunkwan University, Seoul, South Korea
Objective: As life with COVID-19 became a norm in 2022, the public's demand for and perception of COVID-19-related information has changed. This study analyzed the performance and responses of Healthy China and the public at various stages of COVID-19 normalization using the crisis and emergency risk communication (CERC) theory.
Methods: This study was based on the 2022 Shanghai COVID-19 outbreak and data from “Healthy China,” the official TikTok account of the National Health Commission of the People's Republic of China (NHCC). First, we divided the Shanghai lockdown into five stages in accordance with the CERC. Second, the videos released by Healthy China were open-coded. Third, to understand the distribution of strategies across the stages, we used counts and percentages to summarize the categorical variables. Fourth, we investigated the distribution of public participation indicators using descriptive statistical analysis. Finally, the relationship between stage and communication strategy was examined using the chi-square test and negative binomial regression.
Results: (1) Healthy China adopted a more flexible approach to communication strategies; (2) new cases per day was the commonly used substrategy for uncertainty reduction; (3) there was a significant difference in the strategies used by Healthy China at different stages; (4) public participation was highest in the pre-crisis period; and (5) the stage had a significant positive impact on the number of views, favorites, likes, and shares.
Conclusions: This research provides insight into effective communication strategies for the government or public health agencies to employ during COVID-19 normalization.
Introduction
The normalization of COVID-19 means that although most countries and regions worldwide have lifted COVID-19 restrictions having achieved an “end of the epidemic” at the agenda level, from the public health perspective, the epidemic is not over, and the reality is that a large number of people are infected every day and some countries or regions are still implementing different isolation measures. In such a seemingly over, but not over, COVID-19 state, people are eager to return to the normal state of life, travel, and learning that they had before the outbreak in 2020 (1, 2).
In China, the communication strategy of new cases per day starting in 2022 seems synonymous to the “weather forecast.” People may need to speculate on whether the end of the outbreak will affect their future travel plans based on the daily new cases. The public's right to travel is heavily influenced by the local governments' classification of cities as low risk, medium risk, or high risk based on the number of new cases per day in the area. When one's own city is classified as a medium or high risk area due to an increase in the number of new cases per day, leading to an increase in the risk level and control conditions, the public can easily feel pessimistic and distressed. Therefore, it becomes increasingly important to understand if and how the government or public health agency (PHA) is using social media to communicate with the public in the context of the normalization of COVID-19 (3, 4).
As of August 2022, existing studies have focused on traditional text-based social media, such as Twitter. However, few studies have focused on other emerging video-based social media platforms, such as TikTok (5). UNESCO shows that 750 million adults worldwide are illiterate. Undoubtedly, text-based social media is not convenient for illiterate people. However, the emergence of video-based social media has solved this problem to some extent. Although such adults may not be literate, they are able to access information by watching videos and listening to sounds (6). Therefore, when illiterate or semi-literate people use the Internet to acquire knowledge, video media are given higher priority than text media. Furthermore, the most important aspect of risk and crisis communication is to reach a wide audience. In 2021, during the COVID-19 pandemic, TikTok became the world's most visited Internet domain, surpassing Google. In September 2021, TikTok's monthly active users had reached 1 billion. Therefore, TikTok has become an indispensable information source and communication channel between governments, organizations, and the public (5). Hence, this study posed the following research question:
RQ1: How is Healthy China communicating with the public via TikTok in the context of the normalization of COVID-19?
Although previous studies have examined data from 2019 to 2020, COVID-19 was still in its early stages, and no complete set of response plans or guidelines have been proposed by the government or PHA. Furthermore, as countries open up their borders and global tourism begins to recover, public fear, anxiety, and perception about COVID-19 and the demand for related information may be different. Therefore, it is necessary to re-measure the indicators related to the government, PHA, and public engagement under the normalization of COVID-19 based on the latest data from social media in 2022.
RQ2: How is the public engaged in Healthy China in the context of COVID-19 normality?
From 2019 to 2020, knowledge of COVID-19 was still in its infancy, with no proven, standardized response guidelines in place. Researchers were unable to determine when the epidemic would end, much less which stage it was currently in, leaving a virtual void in the stage-based analysis. The government, PHA, and public may behave differently at each stage of COVID-19. For example, the public may be very concerned about self-protection-related information early in the outbreak, but this concern may decline during the middle and later stages of the outbreak. In 2022, as Naveen and Gurtoo indicated, there is a greater need for people to be informed about the latest prevention policies through the news, so that they can adjust their planning in time to reduce unnecessary hassles and inconveniences (7). However, these changes may be insignificant when researchers measure the COVID-19 components without phasing. Therefore, proper phasing of COVID-19 and analysis of public engagement are essential. Based on crisis and emergency risk communication (CERC), the following research questions were posed:
RQ3a: How does stage influence communication strategies in the context of COVID-19 normalization?
RQ3b: How does stage influence public engagement in the context of COVID-19 normalization?
RQ3c: How does substrategy influence public engagement in the context of COVID-19 normalization?
Considering the significance of TikTok for illiterate or semi-literate individuals, changes in public perceptions of the outbreak, and the necessity to classify the outbreak into stages, this study explored how Healthy China and the public communicate on TikTok in the context of COVID-19 normalization based on CERC.
Literature review
TikTok users' behavior
With lockdown and social distancing restrictions in place, TikTok has become the primary public information source during the public health emergency (PHE; 1). Risk, crisis, and health information related to PHE are the main components of information obtained by the public (3, 8). Therefore, understanding how the public uses TikTok to create, disseminate, and receive information involves understanding how the government or PHA develops and disseminates communication strategies related to COVID-19.
As of September 2022, scholars found that the types of videos posted by TikTok users were diverse encompassing health information needs, mental state sharing, and vaccine concerns (4). For example, Ostrovsky and Chen analyzed 100 most popular videos related to COVID-19 on TikTok and found that videos made by healthcare professionals received the most likes and shares (9). Basch et al. analyzed top 100 videos on TikTok with the hashtag #Coronavirus and all videos posted by the World Health Organization (10). They found that anxiety and quarantine were the dominant topics within public sentiment and focus, yet < 10% of the videos mentioned how the virus was transmitted, its symptoms, and preventive measures. Baumel et al. examined the top 150 TikTok videos tagged with masks and found that increasing the number of professionals providing medically accurate information on TikTok could improve public health literacy (11). Southwick et al. conducted an encoding analysis of 750 videos tagged with #Coronavirus and found that health-related videos constituted the highest share (12). Finally, Baumel et al. analyzed the top 100 videos with the hashtags #Pfizer and #Moderna, and found that increasing public knowledge and vaccine confidence can boost vaccination rates (13).
The above studies indicate a high public demand for PHE-related information on TikTok, so there is an urgent need for governments or PHAs to develop social media communication strategies based on TikTok users' behavior.
Actions of government or PHAs
With increasing public demand for TikTok videos related to COVID-19 (14), it is essential to understand what strategies governments or PHA use to communicate with the public and how the public reacts when faced with different strategies. However, as of August 2022, few studies have explored how governments and PHA have used TikTok to communicate with the public during COVID-19.
Zhu et al. were the first to investigate how 31 provincial health councils in China used TikTok to communicate with the public (15). Focusing on how the content and format of the videos influenced the number of likes, comments, and shares of users, they showed that the public preferred to watch cartoons, documentaries, videos promoting occupational health, and videos providing health knowledge, in addition to videos with original music, mandarin, subtitles, and lasting <60 s. In addition, Chen et al. explored the factors that influenced public engagement in the TikTok account of the National Health Commission of the People's Republic of China (NHCC) between January and April 2020 (5), and indicated that video length, title, dialogic loop, and content type significantly influenced public engagement. Subsequently, with the help of a sentiment lexicon, this study also explored the sentiment-mediating role of video titles, and the results showed that sentiment tendencies could moderate the effect of video length and content type on public engagement. Li et al. investigated how the format, type, and content of videos with COVID-19-related tags posted on TikTok by eight international organizations from November 2019 to May 2022 influenced the number of views, likes, comments, and shares by users (16), and found that dance videos, as well as videos that mentioned risk information and precautionary measures, had higher engagement levels.
In general, it was found that the researchers were all from China and that the video attributes used by the researchers generally referred to the format, type, and content of the video, with the quantitative indicators of public engagement generally consisting of the number of views, likes, comments, and shares. While these studies have done their best to analyze the factors that influence public engagement, they have one common feature; they all use TikTok data from the early stages of the COVID-19 outbreak to explore how governments and PHA use the platform to communicate with the public. In 2019–2020, when the world was still in the awareness stage of COVID-19, governments and PHA focused on providing information, such as telling people what COVID-19 is and how people should respond to the outbreak (17).
In the context of constant variability (18), ups and downs, and the normalization of COVID-19, people seek to return to normal work, school, and life conditions before the epidemic is officially over (19), placing greater pressure on governments and PHA to communicate. Furthermore, the public's perception of COVID-19 and their need for different types of information have also changed dramatically. It is, therefore, necessary to explore how the government or PHA should communicate with the public based on the latest TikTok data and to discuss whether the level of public engagement in 2019–2020 was different from that in 2022 under COVID-19 normalization.
Crisis and emergency risk communication
CERC is a five-stage model developed by the Centers for Disease Control and Prevention that integrates risk and crisis communication. CERC solves the conceptual confusion between risk communication and crisis communication by perfectly merging the two into one theoretical framework, and divides the entire emergency cycle into five stages: pre-crisis, initial event, maintenance, resolution, and evaluation. On this basis, it proposes a model that uses different communication strategies at different stages (20).
The first stage is the pre-crisis period, which focuses on the use of risk messages, warnings, and preparedness strategies to inform the public and aid in the monitoring and identification of emerging risks, as well as helping to improve the public's understanding of risk.
The second stage includes strategies for reducing uncertainty, increasing self-efficacy, and providing reassurance. This stage aims to help the public build a broad understanding of the crisis based on the available information by communicating quickly with the public and affected groups.
The third stage is maintenance, which consists of ongoing uncertainty reduction, self-efficacy, and reassurance. This stage is intended to provide the public with a better understanding of the risks involved, as well as to seek support and cooperation in returning to normal life and work.
The fourth stage of the process is resolution, which includes updates on resolution, discussions about causes, and new risks/new understandings of risk. The purpose of this stage is to facilitate a broad discussion of the causes, responsibilities, and adequacy of stakeholders.
Evaluation is the final stage. Its strategy consists of discussions about the appropriateness of response, agreement on causes and new risks, and a new understanding of risks. This stage aims to improve the ability to communicate and respond to future crises by sharing the lessons learned.
Materials and methods
The research process of this study is shown in Figure 1. First, we selected the NHCC account on TikTok as the data source and crawled all the posts published by the account during the closure of Shanghai in 2022, as well as the metrics and user comments related to the posts. Second, we used our CERC model-based stage division guide to divide the 2022 Shanghai lockdown into five stages, and the CERC model-based communication strategy guidelines to openly encode the communication strategies for each stage. Third, count classification, descriptive statistics, chi-square validation, and negative binomial regression were employed to evaluate the relationship between stage and communication strategy.
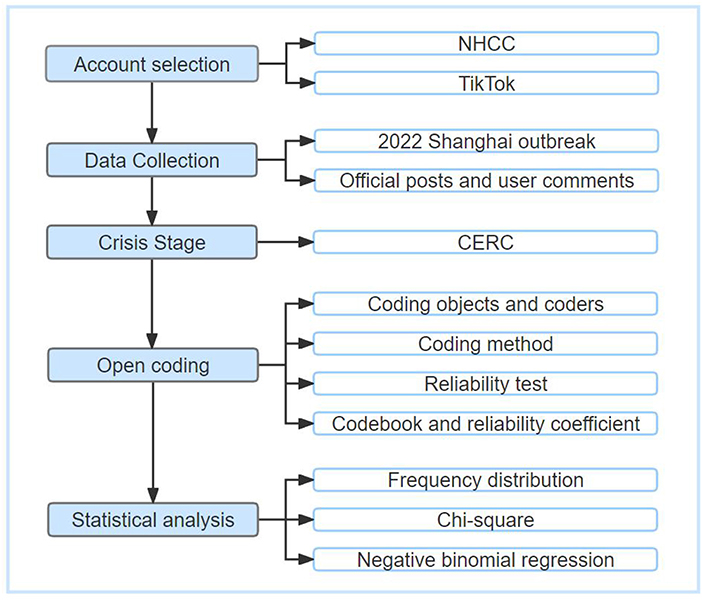
Figure 1. Method flow chart.
Account selection
In this study, Healthy China, the NHCC's official account on TikTok, was chosen as the data source. As of August 1, 2022, the account had 4.5 million followers and had posted 2,700 videos, making it the most influential official account on TikTok in the health sector in China.
Data collection
The data of 527 videos posted by Healthy China from January 1, 2022 to July 14, 2022 were collected. After filtering out data unrelated to COVID-19, 278 videos remained. The video data contained eight types of information: video title, post time, number of views, number of favorites, number of shares, number of comments, and number of likes.
Crisis stage
As shown in Figure 2, the division of stages was based on the entire period of Shanghai's closure in 2022.
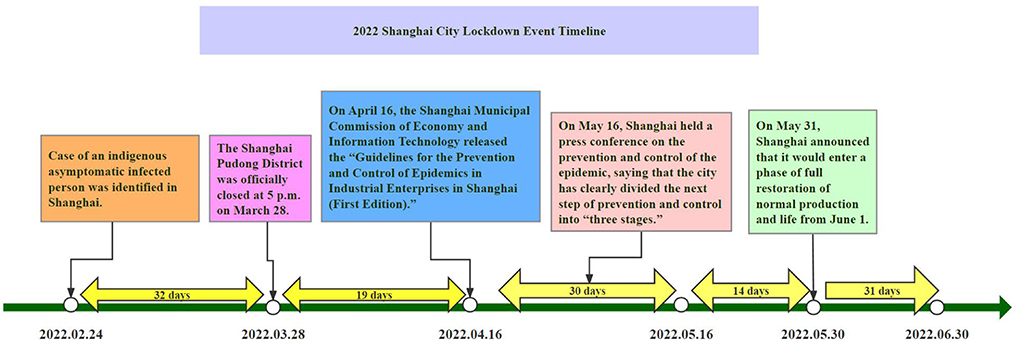
Figure 2. Timeline of the 2022 Shanghai lockdown based on the CERC model.
The pre-crisis stage was from February 24 to March 27, 2022, when a new case of an indigenous asymptomatic infection was reported in Shanghai.
The initial event stage was from March 28 to April 15, 2022, with the closure of the Shanghai Pudong New Area from 5 pm on March 28, 2022.
The maintenance stage was from April 16 to May 15, 2022. The Shanghai Municipal Commission of Economy and Information Technology issued the “Guidelines for the Prevention and Control of Epidemics in Industrial Enterprises in Shanghai (First Edition)” on April 16, 2022.
The resolution stage lasted from May 16 to 30, 2022. On May 16, 2022, Shanghai held a press conference on the prevention and control of the epidemic, and Shanghai's Vice Mayor Zong Ming stated that with the implementation of various prevention and control measures, Shanghai has clearly divided the next prevention and control work into “three stages.”
The evaluation stage was from May 30 to June 30, 2022. On May 31, 2022, Shanghai announced that it would enter a stage of full restoration of normal production and life from June 1, 2022.
Based on the above assessments, the number of videos was reduced to 207.
Open coding
Coding objects and coders
The communication strategy used for the video was identified by reading the video title and watching its content. As the content of the video was related to the fields of data science and medicine, to ensure high coding validity, two coders were recruited—a PhD student with a data science background and a PhD student with a medical background.
Coding method
This study employed an open coding approach. To avoid introducing new classes, a minimal codebook based on the CERC model was created first, and then previous studies' codebooks were integrated. In this case, the current measurements could be more easily compared to previous study results. Finally, repeated coding tests, reliability calculations, and divergence reduction were used to improve coders' perceived consistency of coding standards, and thus coding reliability. Formal coding was not begun until the Holsti's coefficient reached 0.9 or higher.
Reliability test
Inter-coder reliability is a measure of study quality. In this study, 30% of the data were randomly selected and coded by two coders who were not allowed to discuss and communicate with each other. If the test results did not meet the minimum reliability criteria, the coding was retested. Prior to retesting, the two coders were trained again, particularly in categories where there were large differences in the coding results.
Codebook and reliability coefficient
A combined inter-coder Holsti coefficient of 0.9 was obtained, and the two coders completed the remainder of the coding. Table 1 gives the definitions of the key concepts and Table 2 presents the coded classes and confidence coefficients.

Table 1. Definition of key concepts.
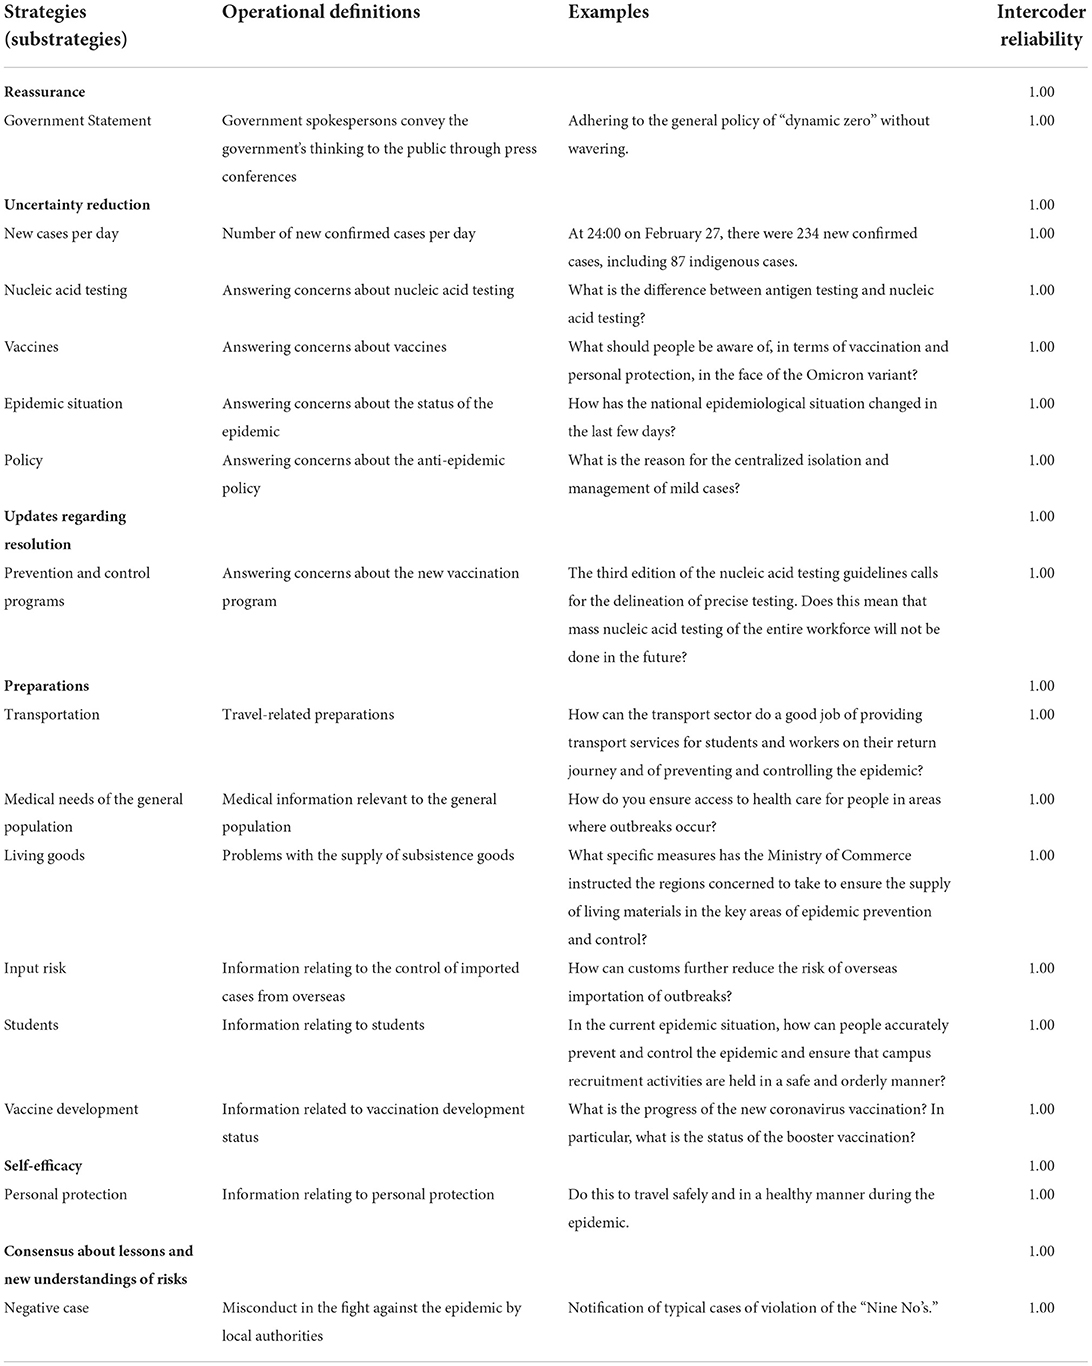
Table 2. Coded strategy categories, operation definitions, examples, and confidence coefficients.
Statistical analysis
Counts and percentages were used to summarize categorical variables to understand the distribution of strategies across stages. Descriptive statistical analysis was performed to investigate the distribution of public engagement indicators, and the relationship between stage and communication strategy was assessed by performing chi-squared tests and negative binomial regression analysis.
Results
Frequency distribution of strategies
Table 3 shows that in terms of stages, Healthy China posted the most posts in the evaluation (28.50%) and pre-crisis (26.57%) stages, followed by maintenance (20.29%), initial event (14.98%), and resolution (9.66%) stages.
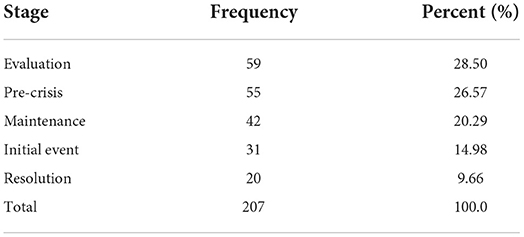
Table 3. Distribution of communication strategies in different stages.
Table 4 shows that uncertainty reduction (65.70%) was the most used strategy, followed by preparations (13.04%), reassurance (10.63%), updates regarding resolution (4.83%), self-efficacy (3.86%), and consensus about lessons (1.93%).
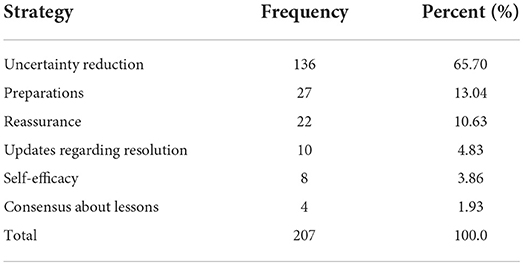
Table 4. Percentage of communication strategies.
As shown in Table 5, in terms of substrategies, new cases per day were ranked first at 38.16%. Other substrategies comprising more than 5% of the total were epidemic situations (11.59%), government statements (10.63%), policies (9.66%), and students (6.28%).
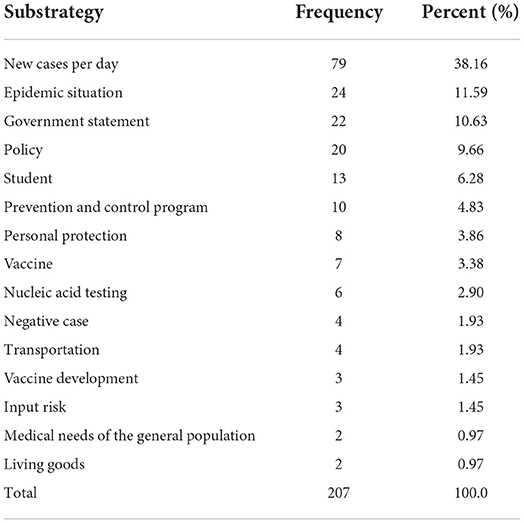
Table 5. Frequency distribution of communication substrategies.
Overall, Healthy China posted the most videos in the evaluation (28.50%) and pre-crisis (26.57%) stages, with 65.70% of the videos aimed at uncertainty reduction. New cases per day were the most widely used substrategies, accounting for 38.16% of all substrategies.
Descriptive analysis of public engagement
The descriptive analysis uses means or medians to describe the overall data. Table 6 shows that the maximum values of number of views, number of favorites, number of shares, number of comments, and number of likes exceeded the mean by three standard deviations, indicating that the data fluctuated considerably, and that it was more appropriate to use the median than the mean to describe the overall level.
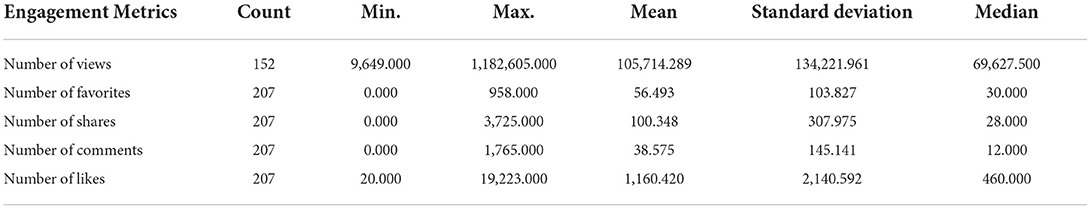
Table 6. Descriptive distribution of public engagement metrics.
Table 7 shows the medians of the five public engagement indicators for videos released by Healthy China at different stages. Pre-crisis was found to rank first in all indicators, with 120,758,500 views, 760,000 likes, 51,000 favorites, 87,000 shares, and 20,000 comments.
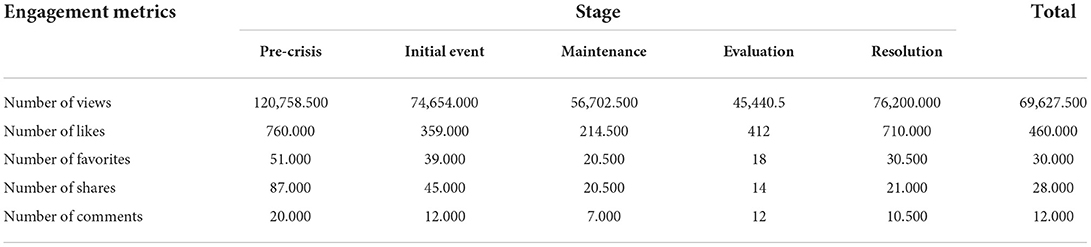
Table 7. Median distribution of public engagement indicators at different stages.
Substrategies with a high level of public engagement at each stage
As shown in Table 8, in terms of stage, in pre-crisis, government statements had the highest number of views; new cases per day had the highest number of likes and shares; and vaccines had the highest number of comments and likes. In initial event, vaccine development had the highest value of all the indicators. In maintenance, videos with medical need topics of the general population had the highest number of views, likes, shares, and comments, whereas government statements had the highest number of likes. In resolution, new cases per day had the highest number of views and likes; policies had the highest number of shares; and government statements had the highest number of comments and likes. In evaluation, personal protection ranked first in terms of number of views, favorites, shares, and likes, followed by prevention and control programs, with the highest number of comments.
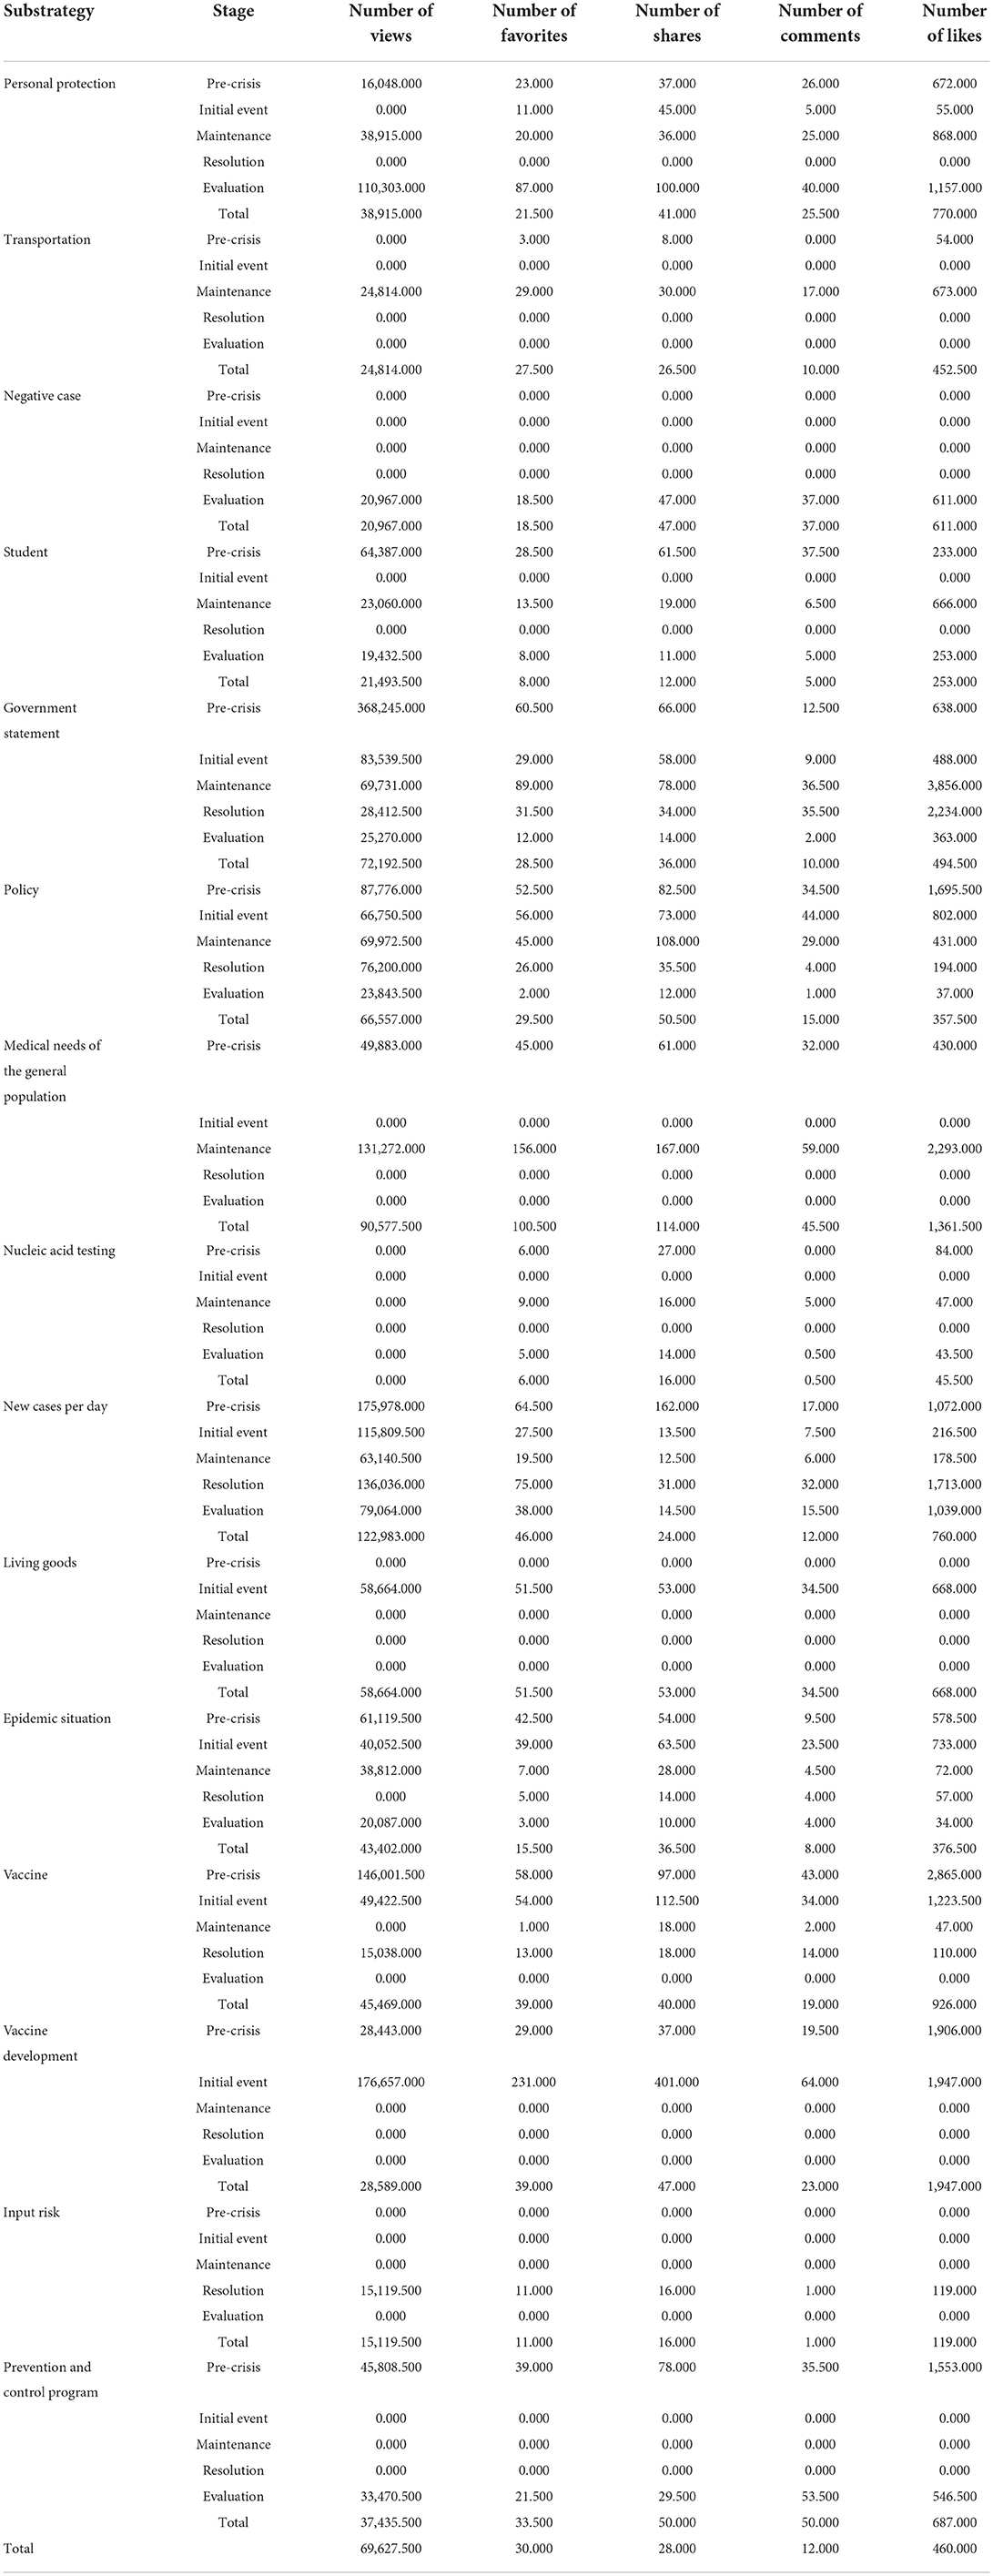
Table 8. Median distribution of public engagement indicators for communication substrategies at different stages.
Chi-square test
The chi-square test was performed to investigate the differential relationship between the stages and substrategies. As shown in Table 9, stage presented a 0.01 level of significance for substrategies (chi = 109.904, p = 0.000 < 0.01). By comparing the differences in percentages, percentage of government statements in the initial event was found to be 16.13%, significantly higher than the average of 10.63%. The percentage of new cases per day in the resolution stage was 45.00%, also significantly higher than the average of 38.16%. The percentage of epidemic situations in pre-crisis was 18.18%, significantly higher than the average of 11.59%.
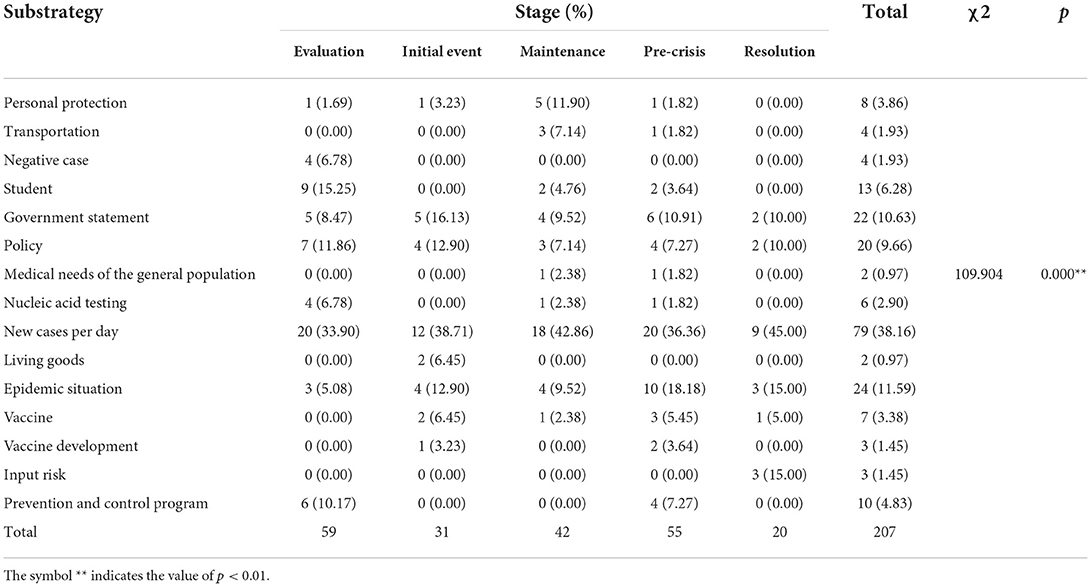
Table 9. Chi-square analysis of stage to substrategy.
In conclusion, all substrategies showed significant differences across stage.
Negative binomial regression
Table 10 shows the negative binomial regression results for the effects of substrategies and stage on public engagement indicators.
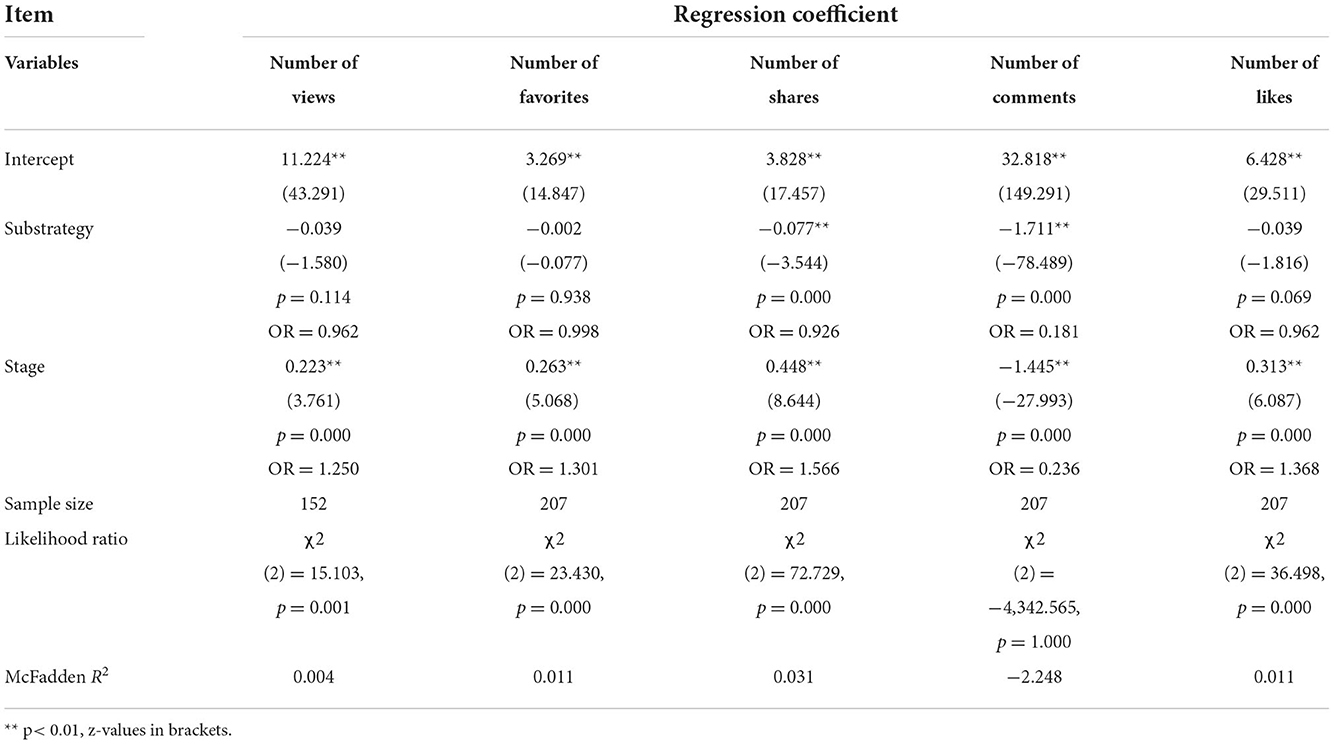
Table 10. Negative binomial regression of substrategy and stage on public engagement indicators.
The order of stages and substrategies mentioned in the results below is shown as follows.
Stage: Evaluation, initial event, maintenance, pre-crisis, and resolution.
Substrategy: Personal protection, transportation, negative case, student, government statement, policy, medical needs of the general population, nucleic acid testing, new cases per day, living goods, epidemic situation, vaccine, vaccine development, input risk, and prevention and control program.
Number of views
As per the results, the regression coefficient of the substrategy was −0.039, which was not statistically significant (z = −1.580, p = 0.114 > 0.05), implying that the substrategy did not have an impact on the number of plays.
The regression coefficient for the stage was 0.223, statistically significant at the 0.01 level (z = 3.761, p = 0.000 < 0.01), implying that the stage had a statistically significant positive effect on number of views. An odds ratio (OR) of 1.250 means that for each unit increase in stage, the change (increase) in number of views was 1.250 times greater.
The summary analysis showed that stage had a significant positive impact on number of views. However, the substrategy did not affect number of views.
Number of favorites
The regression coefficient value of the substrategy was −0.002, but it was not significant (z = −0.077, p = 0.938 > 0.05), which means that the substrategy did not have an impact on the number of favorites.
The regression coefficient value of the stage was 0.263, which was significant at the 0.01 level (z = 5.068, p = 0.000 < 0.01), which means that the stage had a significant positive impact on number of favorites. Moreover, the OR was 1.301, which means that when the stage increased by one unit, the change (increase) of the number of favorites was 1.301 times.
The summary analysis showed that the stage had a significant positive impact on number of favorites. However, the substrategy did not affect the number of favorites.
Number of shares
The regression coefficient value of substrategy was −0.077, which was significant at the 0.01 level (z = −3.544, p = 0.000 < 0.01), meaning that substrategy had a significant negative impact on the number of shares. Moreover, the OR value was 0.926, which means that when the substrategy increased by one unit, the change (decrease) in the number of shares was 0.926 times.
The regression coefficient value of the stage was 0.448, which was significant at the 0.01 level (z = 8.644, p = 0.000 < 0.01). This means that the stage had a significant positive impact on the number of shares. Furthermore, OR was 1.566, which means that when the stage increased by one unit, the change (increase) of the number of shares was 1.566 times.
The summary analysis showed that the stage had a significant positive impact on the number of shares, and substrategy had a significant negative impact on the number of shares.
Number of comments
The regression coefficient value of the substrategy was −1.711, which was significant at the 0.01 level (z = −78.489, p = 0.000 < 0.01). Hence, the substrategy had a significant negative impact on the number of comments. Moreover, the OR value was 0.181, which means that when the substrategy increased by one unit, the change (decrease) of the number of comments was 0.181 times.
The regression coefficient value of the stage was −1.445, which was significant at the 0.01 level (z = −27.993, p = 0.000 < 0.01). Hence, the stage had a significant negative impact on the number of comments. Furthermore, the OR was 0.236, which means that when the stage increased by one unit, the change (decrease) of the number of comments was 0.236 times.
The summary analysis showed that both the substrategy and stage significantly impacted the number of comments.
Number of likes
The regression coefficient value of the substrategy was −0.039, but it was not significant (z = −1.816, p = 0.069 > 0.05). Hence, the substrategy did not affect the number of likes.
The regression coefficient value of the stage was 0.313, which was significant at the 0.01 level (z = 6.087, p = 0.000 < 0.01). Hence, the stage had a significant positive impact on the number of likes. Moreover, the OR was 1.368, which means that when the stage increased by one unit, the change (increase) of the number of likes was 1.368 times.
The summary analysis showed that the stage had a significant positive impact on the number of likes, but substrategy did not impact the number of likes.
Discussion
Findings
This study is the first to explore how the PHA communicates with the public on TikTok in the context of the normalization of COVID-19.
First, based on the CERC model and the results of the chi-square test, it was found that Healthy China did not follow the CERC model's proposal to use the corresponding communication strategies in the specified stages (e.g., use of communication strategies belonging to the pre-crisis stage in the pre-crisis stage itself), but instead used a mixture of communication strategies belonging to other stages (the communication strategy originally belonging to the initial event stage was used in the pre-crisis stage). Specifically, Healthy China used uncertainty reduction, reassurance, and self-efficacy strategies in the pre-crisis stage, which was originally part of the initial event stage, and updates regarding resolution, which was originally part of the resolution stage. The current finding is in line with the results of Alhassan et al., indicating that information related to uncertainty reduction, reassurance, and effectiveness is prevalent in all stages (21).
The developers of the CERC model argued that some potential crises and emergencies might not follow the sequence of pre-crisis, initial event, maintenance, resolution, and evaluation due to a variety of factors (20). The current findings extend this idea; some potential crises and emergencies may not follow the conventional sequence in the context of epidemic normalization, during which, communication strategies are more flexible and do not adhere to the CERC model.
In the context of the normalization of COVID-19, the government and medical institutions must update their existing medical programs periodically to respond to new variants of COVID-19 and to constantly reflect on past shortcomings in the fight against the epidemic. Furthermore, the public must update their knowledge of the virus and prepare their responses in advance to prevent their work, studies, and lives from being disrupted by a new outbreak of COVID-19. This may lead to a new outbreak cycle in which the PHA may issue communication strategies such as uncertainty reduction and updates regarding resolution during the pre-crisis stage.
Second, compared to the communication strategy in the early period of COVID-19, the strategy in 2022 is significantly different. Specifically, uncertainty reduction (65.70%) was found to be the most commonly used strategy in this study, with new cases per day being the predominant substrategy, accounting for 38.16% of all substrategies. Li et al. studied eight public health and UN agencies, and the data showed that videos with a focus on individual prevention were the most prevalent (16). Furthermore, Healthy China posted the most videos during the evaluation (28.50%) and pre-crisis (26.57%) stages, whereas the official Twitter account of the Saudi Arabian Ministry of Health posted the majority of tweets during the initial event stage (65.89%) (21). Considering that the data from the previous study came from the early days of COVID-19, it is evident that the focus of PHA's communication has changed in the context of the normalization of COVID-19. It is likely that in 2020 and 2021, Chinese scientists, medical scientists, and the public were all ignorant of COVID-19; therefore, how to be safe from infection was the most critical health information. However, with the normalization of COVID-19, the vaccination rate has reached a high level, and people are not worried that they will be infected with COVID-19. On the contrary, people are more concerned about whether the recurrence of the epidemic will hinder their lives and travel. Therefore, policies to reduce uncertainties must be prioritized.
Third, the median indicator for the pre-crisis stage was the highest in terms of number of views, number of likes, number of favorites, number of shares, and number of comments, indicating a high level of public engagement during the pre-crisis stage (21). This may be because the government statements in the pre-crisis period seemed more attractive to the public. As government statements have a high degree of stability, direction, and guidance, the public tended to draw from government videos during that stage if they encountered problems related to COVID-19 in their work and life. Chen et al. found that on TikTok, the public was more interested in government posts about crisis management, which is supported by the current results (5).
Limitations
In this study, we discovered that Healthy China did not use communication strategies in accordance with the CERC model's strategic guidelines. However, we were unable to determine whether this behavior should be encouraged; therefore, future research should focus on sentiment analysis and topic models to further analyze these communication strategies.
Conclusions
This study investigated how Healthy China communicates with the public in the context of the normalization of COVID-19 based on the CERC theory, using the 2022 Shanghai city closure due to the COVID-19 outbreak as a timeline and NHCC's official account of Healthy China on TikTok as a data source. The findings were as follows:
First, based on the results of the CERC model and the chi-square test, it was discovered that Healthy China was more flexible in choosing communication strategies than the CERC model suggested.
Second, the communication strategies used by Healthy China during the normalization of COVID-19 were markedly different. Healthy China's main aim in releasing the video was to reduce uncertainty, with new cases per day being the most used substrategy.
Third, there was a clear variation in the strategies used by Healthy China at different stages.
Fourth, the public was more likely to engage with Healthy China video during the pre-crisis stage, reflecting the changing public demand for information about the outbreak.
Finally, the stages had significant positive effects on number of views, number of favorites, number of likes, and number of shares. The current findings provide insights for governments and PHA to communicate with the public in the context of COVID-19 normalization. Furthermore, these findings help the government or PHA in reducing the number of controversial topics that arise and increasing the amount of video content that makes the public feel as at ease as possible.
Data availability statement
The raw data supporting the conclusions of this article will be made available by the authors, without undue reservation.
Author contributions
SC: conceptualization, methodology, and software. SZ: writing-original draft preparation. JK: writing-reviewing, supervision, and editing. All authors contributed to the article and approved the submitted version.
Funding
This work was supported by a National Research Foundation of Korea (NRF) grant funded by the Korean Government (NRF-2020R1A2C1014957).
Conflict of interest
The authors declare that the research was conducted in the absence of any commercial or financial relationships that could be construed as a potential conflict of interest.
Publisher's note
All claims expressed in this article are solely those of the authors and do not necessarily represent those of their affiliated organizations, or those of the publisher, the editors and the reviewers. Any product that may be evaluated in this article, or claim that may be made by its manufacturer, is not guaranteed or endorsed by the publisher.
References
1. Liu H, Liu W, Yoganathan V, Osburg VS. COVID-19 information overload and generation Z's social media discontinuance intention during the pandemic lockdown. Technol Forecast Soc Change. (2021) 166:120600. doi: 10.1016/j.techfore.2021.120600
2. Nabity-Grover T, Cheung CM, Thatcher JB. Inside out and outside in: How the COVID-19 pandemic affects self-disclosure on social media. Int J Inf Manage. (2020) 55:102188. doi: 10.1016/j.ijinfomgt.2020.102188
3. Wang H, Xiong L, Wang C, Chen N. Understanding Chinese mobile social media users' communication behaviors during public health emergencies. J Risk Res. (2022) 25:874–91. doi: 10.1080/13669877.2022.2049621
4. Zhang T, Yu L. The Relationship between government information supply and public information demand in the early stage of COVID-19 in China—an empirical analysis. Healthcare. (2021) 10:77. doi: 10.3390/healthcare10010077
5. Chen Q, Min C, Zhang W, Ma X, Evans R. Factors driving citizen engagement with government TikTok accounts during the COVID-19 pandemic: model development and analysis. J Med Internet Res. (2021) 23:e21463. doi: 10.2196/21463
6. Fu X, Ghauri P, Ogbonna N, Xing X. Platform-based business model and entrepreneurs from base of the Pyramid. Technovation. (2022) 102451. doi: 10.1016/j.technovation.2021.102451
7. Naveen BR, Gurtoo A. Public transport strategy and epidemic prevention framework in the Context of Covid-19. Transp Pol. (2022) 116:165–74. doi: 10.1016/j.tranpol.2021.12.005
8. Basch CH, Basch CE, Hillyer GC, Meleo-Erwin ZC. Social media, public health, and community mitigation of COVID-19: challenges, risks, and benefits. J Med Internet Res. (2022) 24:e36804. doi: 10.2196/36804
9. Ostrovsky AM, Chen JR. TikTok and its role in COVID-19 information propagation. J Adol Health. (2020) 67:730. doi: 10.1016/j.jadohealth.2020.07.039
10. Basch CH, Hillyer GC, Jaime C. COVID-19 on TikTok: harnessing an emerging social media platform to convey important public health messages. Int J Adolesc Med Health. (2020) 34:367–9. doi: 10.1515/ijamh-2020-0111
11. Baumel NM, Spatharakis JK, Karitsiotis ST, Sellas EI. Dissemination of mask effectiveness misinformation using TikTok as a medium. J Adol Health. (2021) 68:1021–2. doi: 10.1016/j.jadohealth.2021.01.029
12. Southwick L, Guntuku SC, Klinger EV, Seltzer E, McCalpin HJ, Merchant RM. Characterizing COVID-19 content posted to TikTok: public sentiment and response during the first stage of the COVID-19 pandemic. J Adol Health. (2021) 69:234–41. doi: 10.1016/j.jadohealth.2021.05.010
13. Baumel NM, Spatharakis JK, Baumel LD, Sellas EI. Disparity in public perception of Pfizer and Moderna COVID-19 vaccines on TikTok. J Adol Health. (2022) 70:514. doi: 10.1016/j.jadohealth.2021.12.004
14. Soluk J, Miroshnychenko I, Kammerlander N, De Massis A. Family influence and digital business model innovation: the enabling role of dynamic capabilities. Entrep Theory Pract. (2021) 45:867–905. doi: 10.1177/1042258721998946
15. Zhu C, Xu X, Zhang W, Chen J, Evans R. How health communication via Tik Tok makes a difference: a content analysis of Tik Tok accounts run by Chinese provincial health committees. Int J Environ Res Public Health. (2020) 17:192. doi: 10.3390/ijerph17010192
16. Li Y, Guan M, Hammond P, Berrey LE. Communicating COVID-19 information on TikTok: a content analysis of TikTok videos from official accounts featured in the COVID-19 information hub. Health Educ Res. (2021) 36:261–71. doi: 10.1093/her/cyab010
17. Sykes DL, Holdsworth L, Jawad N, Gunasekera P, Morice AH, Crooks MG. Post-COVID-19 symptom burden: what is long-COVID and how should we manage it? Lung. (2021) 199:113–9. doi: 10.1007/s00408-021-00423-z
18. Evans JP, Zeng C, Qu P, Faraone J, Zheng YMCarlin C, Liu SL. Neutralization of SARS-CoV-2 Omicron sub-lineages BA. 1, BA. 1.1, and BA. 2. Cell Host Microbe. (2022) 30:1093–102.e3. doi: 10.1016/j.chom.2022.04.014
19. Pokhrel S, Chhetri R. A literature review on impact of COVID-19 pandemic on teaching and learning. Higher Educ Fut. (2021) 8:133–41. doi: 10.1177/2347631120983481
20. Reynolds B, Seeger Matthew W. Crisis and emergency risk communication as an integrative model. J Health Commun. (2005) 10:43–55. doi: 10.1080/10810730590904571
Keywords: COVID-19, public health emergency, public health agency, TikTok, social media, communication strategy, crisis and emergency risk communication, negative binomial regression
Citation: Che S, Zhang S and Kim JH (2022) How public health agencies communicate with the public on TikTok under the normalization of COVID-19: A case of 2022 Shanghai's outbreak. Front. Public Health 10:1039405. doi: 10.3389/fpubh.2022.1039405
Received: 08 September 2022; Accepted: 03 November 2022;
Published: 24 November 2022.
Edited by:
Stefania Salmaso, Independent Researcher, Rome, ItalyReviewed by:
Chang-Yu Hong, Pukyong National University, South KoreaValentina Possenti, National Institute of Health (ISS), Italy
Copyright © 2022 Che, Zhang and Kim. This is an open-access article distributed under the terms of the Creative Commons Attribution License (CC BY). The use, distribution or reproduction in other forums is permitted, provided the original author(s) and the copyright owner(s) are credited and that the original publication in this journal is cited, in accordance with accepted academic practice. No use, distribution or reproduction is permitted which does not comply with these terms.
*Correspondence: Jang Hyun Kim, YWxvaGFraW1Ac2trdS5lZHU=