- 1Department Neurotoxicology and Chemosensation, Leibniz Research Centre for Working Environment and Human Factors, Dortmund, Germany
- 2Human Health and Consumer Protection, Johann Heinrich von Thünen Institute of Wood Research, Hamburg, Germany
Over the recent past, tools have been developed to asses people's connection to and attitudes towards nature due to increasing interest in this topic in society and research. We translated one such questionnaire, the Nature Relatedness Scale, consisting of three subscales (NR-Self, NR-Perspective, NR-Experience) to German. We collected 251 data sets and performed a confirmatory factor analysis, followed by an exploratory factor analysis. The analyses revealed that the reliability of the German NRS as a whole was good. However, they also showed NR-Perspective to be the weakest factor, and that NR-Self was a rather vague construct, closely connected to the other two subscales. Overall, we came to the conclusion that the NRS' three subscales are not as distinct and reliable as expected, and instead suggest a two-factor solution (NR-Presence and NR-Perspective) for use in German.
1 Introduction
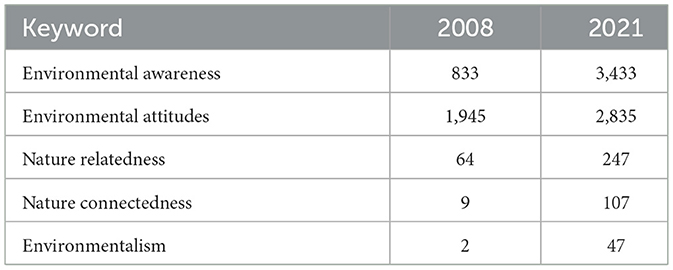
The Nature Relatedness Scale (NRS) was developed to ask about one's connection to nature and the environment (Nisbet et al., 2009). The original scale consisted of 30 candidate items on which 831 Canadian participants rated themselves. Additionally, in a second phase, a subsample of 184 participants answered questions on vegetarianism, pet ownership, consumer habits, environmental activism, and outdoor activity habits and filled in various other pre-existing scales measuring e.g., environmentalism, biophilia, and the big five personality traits. Through an exploratory factor analysis on the data yielded by the original, larger sample, the authors came to the conclusion that three distinct factors underlie an overall scale of 21 items: Nature Self (NR-Self), Nature Perspective (NR-Perspective), and Nature Experience (NR-Experience). The authors described NR-Self as one's identification and “personal connection to nature” (Nisbet et al., 2009) and included nine items. NR-Perspective was summarized as an attitude toward the environment and humans' effects on it and contained six items. Finally, they summarized NR-Experience as one's comfort in the outside and being “drawn to the wilderness” (Nisbet et al., 2009). These three factors accounted for 34.18% of the total variance. The remaining nine items were dropped. Since the authors expected these three subscales to be interrelated and thus correlated, they fitted an oblique Promax rotation (κ = 4). The overall internal consistency was high, with a Cronbach's α of 0.87 (NR-Self: 0.87, NR-Perspective: 0.66, NR-Experience: 0.80). Additionally, the test-retest reliability over 6–8 weeks was high (NR: 0.85, NR-Self: 0.81, NR-Perspective 0.65, NR-Experience: 0.85). Differences in measured NR could also predict the behavioral differences regarding vegetarianism, pet ownership, consumer habits, environmental activism, and outdoor activity habits in the subsample, lending credibility to construct validity. Similarly, there were positive correlations between NR and the environmental attitudes measured through other scales. Now, with the NRS thus established in English, the intent of our study was to create a German translation of the questionnaire to use for studies conducted in German. This is necessary because the topic has been of increasing interest in research in recent years, as can be seen by comparing topic-related article keywords between 2008 (the year the original study was first published online) and 2021 (the year of our data collection) (Table 1). Additionally, a replication in German can also produce further information about the original NRS, e.g., if the understanding of Nature Relatedness is culture-specific or otherwise tied to language.
To summarize, our goal was to translate the scale, including all three subscales, into German, and subsequently replicate the original factor structure with an independent sample to confirm its construct validity. We expected that our translated items match the same factor structure as the original data.
2 Method
2.1 Sample
The only criteria for participation were being over 18 and good German language proficiency, although it was not necessary for them to be native speakers. Participants were recruited online through university but did not have to be university students themselves. Data were collected via Tivian's survey system Unipark. Two hundred and fifty-one complete sets of responses were collected (no missing values), with 49 men, 198 women, and 4 participants identifying differently. Their mean age was 25.725 (SD = 14.255, minimum 18).
2.2 Questionnaire measurement
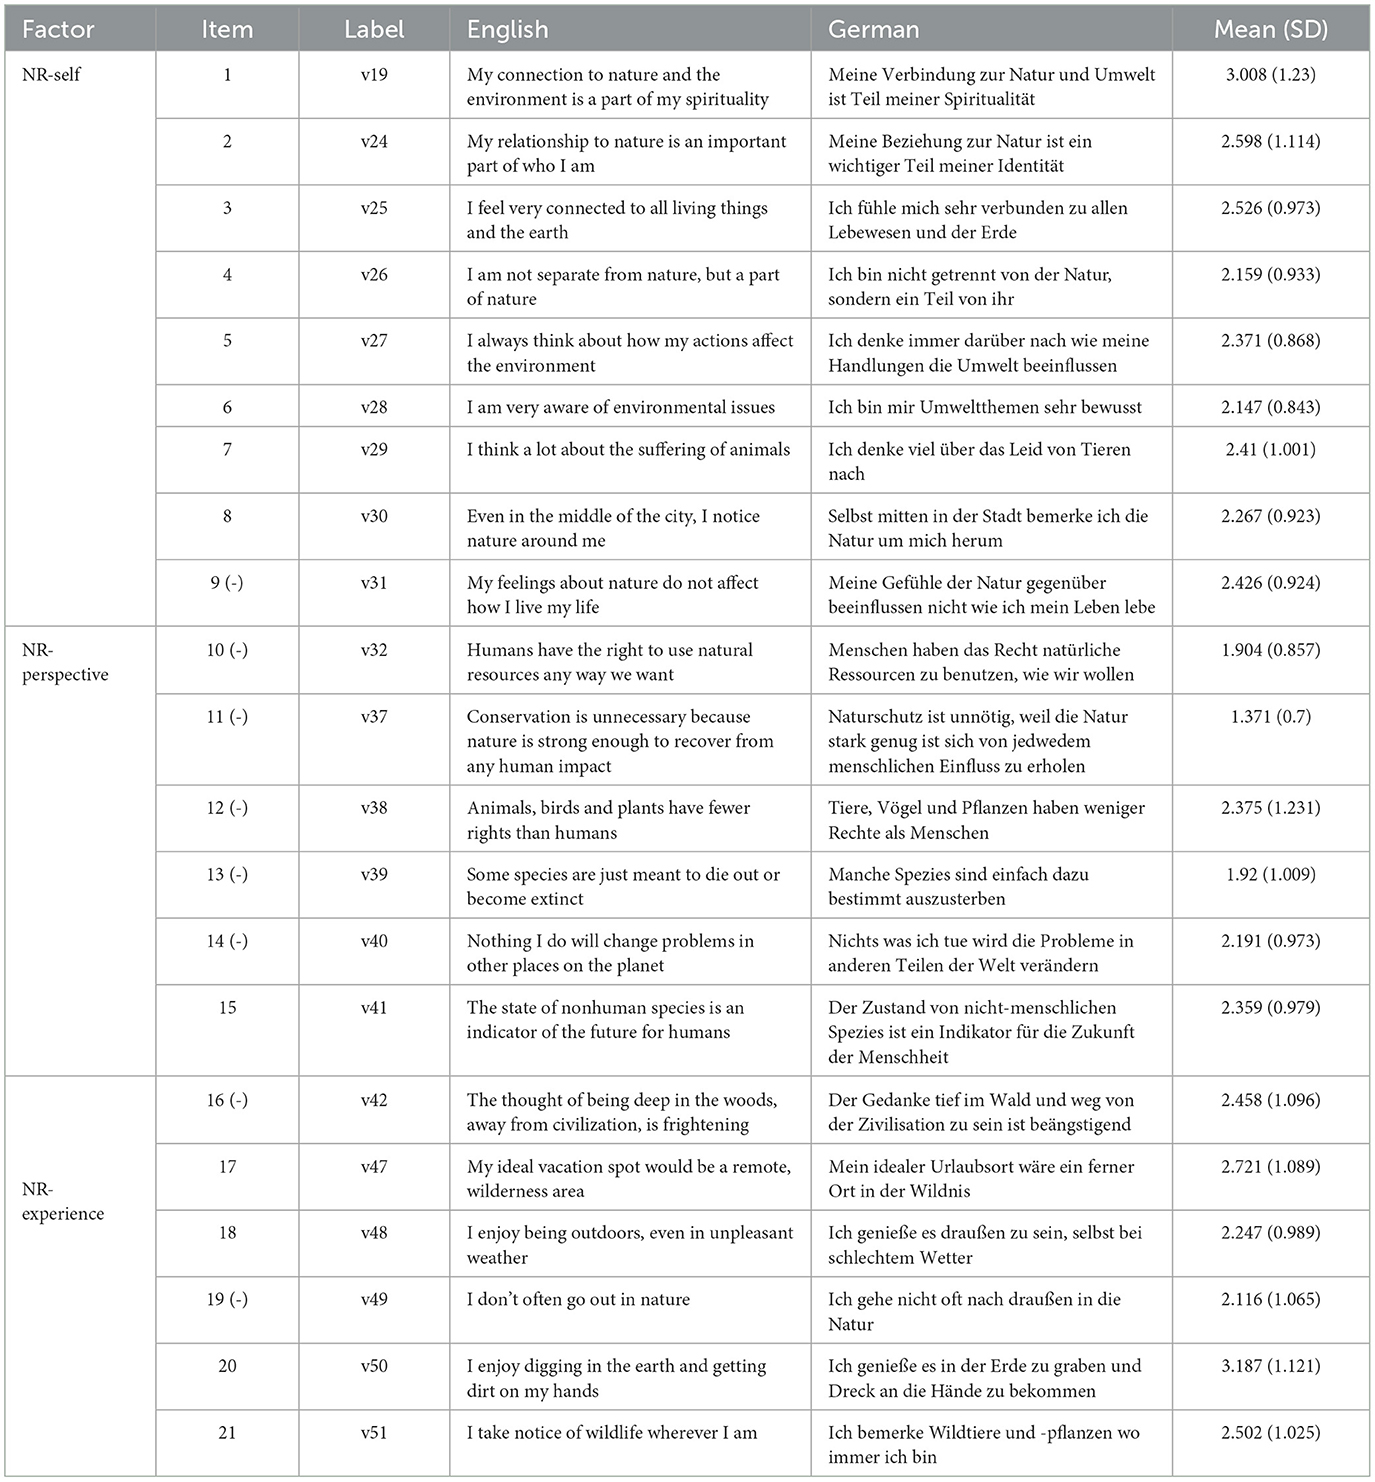
We chose a native German speaker with high English proficiency to conduct an initial translation of the NRS items. They were assisted by a native English speaker who weighed in on the precise meaning of items as they were not always unambiguous. The most contentious was item 12, “Animals, birds and plants have fewer rights than humans”, which can have an either prescriptive or descriptive reading. While it was clear from this item being inverted that it was meant as a prescriptive statement, we opted to keep the ambiguity in our translation to stay true to the original phrasing and produce similar impressions in participants. Similarly, some items included wording that has no direct equivalent in German, which was then substituted by multiple words, e.g., “wildlife” was thus paraphrased by “Wildtiere und -pflanzen” (wild animals and plants). The initial translation was then reviewed and adjusted by two other native German speakers for clarity (Table 2). Participants filled in the questionnaire on a five point Likert scale online, one meaning complete agreement, and five meaning complete disagreement.
2.3 Data analysis
We conducted most of our analyses in RStudio (RStudio Team, 2021), reading in data by using readxl (Wickham and Bryan, 2019). We began by reverse-scoring appropriate items: items 9–14, 16, and 19.
We tested for multivariate normality using the “MVN” package (Korkmaz et al., 2014) and came to the conclusion that our data did not follow a normal distribution with the Henze-Zirkler test being significant (HZ = 1.007, p < 0.05). Then, we conducted an unconstrained confirmatory factor analysis (CFA) in RStudio, using the “lavaan” package (Rosseel, 2012), figures having been created with “lavaanplot” (Lishinski, 2024). Items were sorted into the same factors as in the original study: NR-Self consisted of items 1–9, NR-Perspective consisted of items 10–15, and NR-Experience contained items 16–21 (Nisbet et al., 2009). Since the data was not normally distributed, we used the maximum likelihood with robust standard errors (MLR) estimator, which is robust to the breach of this assumption and also yields more reliable results at a small sample size (Yilmaz, 2019). Our confirmatory factor analysis used the χ2-distribution and an α-level of 0.05, testing if the factor structure differed significantly from the implied model. We also included several criteria that evaluate the fit of the model: the Comparative Fit Index (CFI), Tucker-Lewis Index (TLI), Root Mean Square Error of Approximation (RMSEA), and Standardized Root Mean Square Residual (SRMR). The two incremental fit indices indicate whether a model is a better fit to the data than the baseline model of all variables being independent (Shi et al., 2019). The RMSEA estimates how close our model's covariance matrix is to the true model's covariance matrix (Shi et al., 2019), and the SRMR is a standardized measure for average residual covariance, comparing the hypothesized model to our sample (Shi et al., 2018). We chose 0.95 as the cut-off value for the CFI, 0.95 for the TLI, 0.06 for the RMSEA, and 0.08 for the SRMR (Hu and Bentler, 1999). The analysis was run a second time, excluding participants who interrupted questionnaire completion or took longer than three standard deviations beyond the mean time. To gain more information about internal consistency, we also calculated a Cronbach's α across all subscales and for each subscale using the “ltm” package (Rizopoulos, 2006) and McDonald's ω using “semTools” (Jorgensen et al., 2022). Items with a low reliability (R2 < 0.2) were successively removed starting with the lowest R2. After each item removal, the analysis was rerun.
To gain further information about the factor structure and their items, we followed the CFA with an exploratory factor analysis (EFA). A Bartlett's test for sphericity was employed to ensure that data were not uncorrelated using the “psych” package (William Revelle, 2023). For the subsequent EFA, we used the same Promax-rotation of κ = 4 as the original study did (Nisbet et al., 2009). The number of factors extracted was based on a scree plot and a parallel analysis scree plot (factor extraction method being principal axis factor analysis), which plots factors' eigenvalues against simulated data (William Revelle, 2023). The parallel analysis scree plot was created using “ggplot2” (Wickham, 2016), based on a script provided publicly (Sakaluk and Short, 2017). Item factor loadings were calculated using the “psych” and “GPArotation” package (William Revelle, 2023; Bernaards and Jennrich, 2005), and items were dropped successively until none were R2 < 0.4.
3 Results
3.1 Descriptive statistics and data quality
Participants of the 251 complete sets used the full range of the Likert scale (1 − 5) while filling out the NRS, with no missing values. The overall mean score achieved was 2.346 (SD = 1.07), and individual mean scores ranged from 1.1 to 3.86. NR-Self had a mean score of 2.435 (SD = 1.015), NR-Perspective had a mean score of 2.02 (SD = 1.03), and experience 2.539 (SD = 1.119). Three participants took a break during testing, the remaining participants took on average 5 minutes (SD = 3.598).
3.2 CFA
The results of the initial CFA were significant [], meaning the null hypothesis that the structures specified by the model and produced by the data are the same could not be confirmed. Both incremental fit indices (CFI = 0.829 and TLI = 0.807) and the RMSEA of 0.067 were not sufficient to support the idea of the model either. However, the SRMR of 0.074 indicated an acceptable fit. Rerunning the analysis without completion time outliers yielded marginally different results, but not nearly different enough to warrant a change in decision regarding the model. For further analysis, we thus included all participants. The Cronbach's α of 0.84 showed good internal consistency across all items, similarly to McDonald's ω of 0.843.
Items 15, 13, 12, 7, and 9 were then removed in this order, only leaving items with an R2>0.2. This removal kept CFA-results significant [], meaning that the structures specified by the model and produced by the data were still not the same. Both incremental fit indices (CFI = 0.867 and TLI = 0.842) improved but were still not sufficient to support the idea of the model. The SRMR of 0.068 remained in an acceptable range and improved slightly. The RMSEA of 0.072 stayed outside of an acceptable range. The loadings of the observed variables onto the latent factors can be seen in Figure 1A. The average variance extracted was 0.396 for NR-Self, 0.35 for NR-Perspective, and 0.324 for NR-Experience. The Cronbach's α of 0.836 stayed at good internal consistency across all items, and McDonald's ω was 0.858.
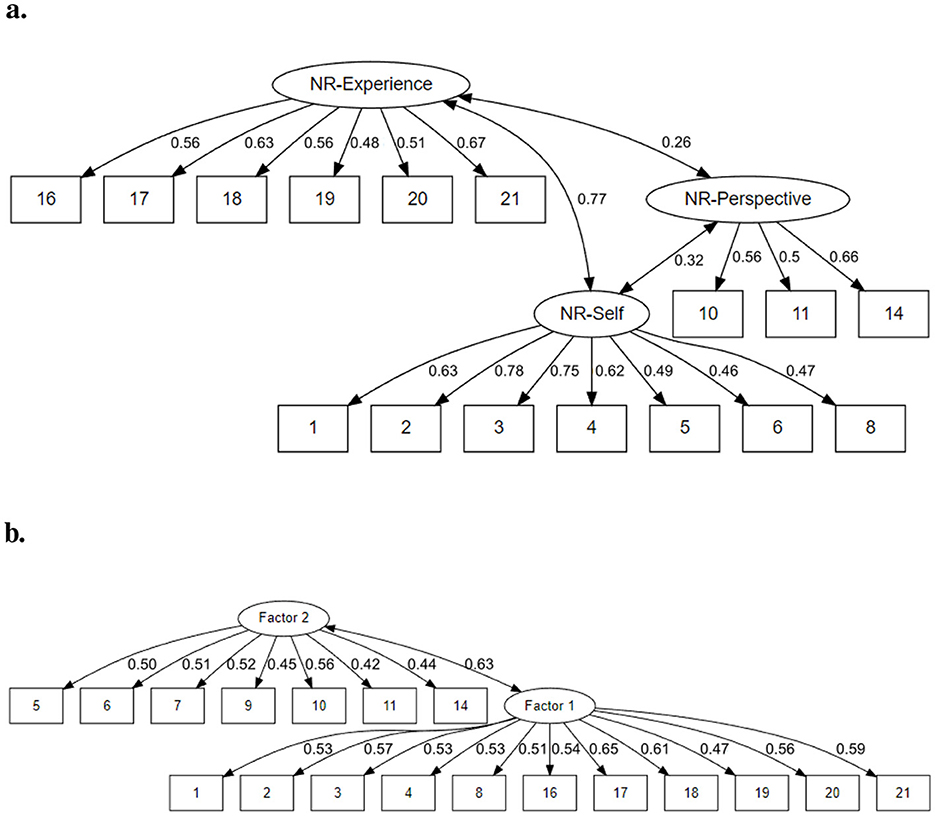
Figure 1. Path diagrams depicting both the (A) factor loadings and covariances of the CFA after item removal and (B) factor loadings and covariance of our EFA solution, with two factors and after item removal. Factor 1 was later labeled NR-Presence, and factor 2 was labeled NR-perspective.
3.3 EFA
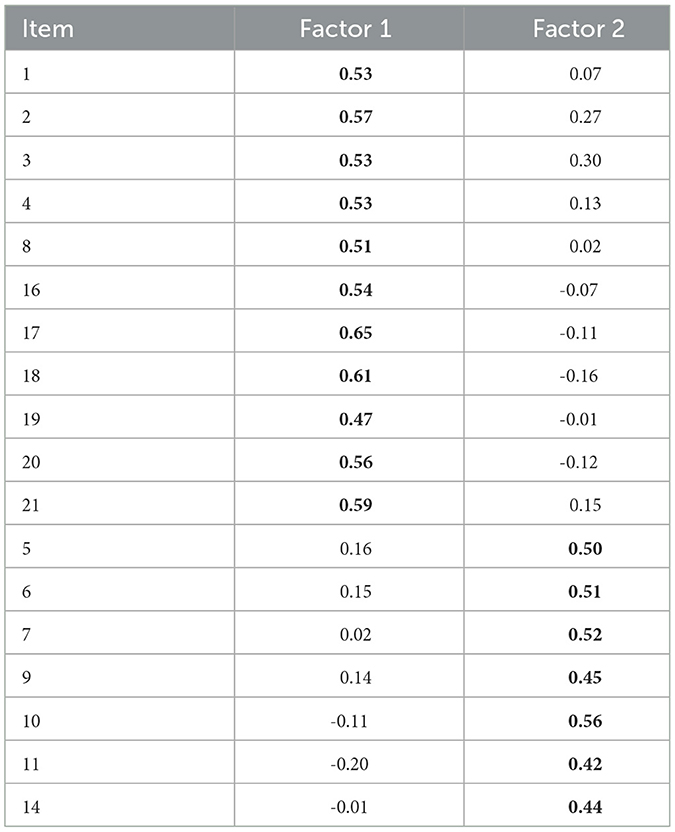
The first four extracted eigenvalues were 5.356, 2.143, 1.38, and 1.157. Based on scree plots, either two or three factors should be extracted (see Figures 2A, B), but it should be mentioned that the third factor in our sample is much weaker, with a steep drop in explanatory power after the second. We thus arrived at a two-factor solution with some dropped items (12, 13, and 15). Remaining items' factor loadings can be found in Table 3 and Figure 1B. The chosen factor structure explained 32% of the total variance. The intercorrelation between the two factors was 0.44. The overall Cronbach's α was 0.844, and the overall McDonald's ω was 0.879. The first factor had a Cronbach's α of 0.841, and the second factor's α was 0.698, meanwhile the first factor's McDonald's ω was 0.824, and the second factor's was 0.674.
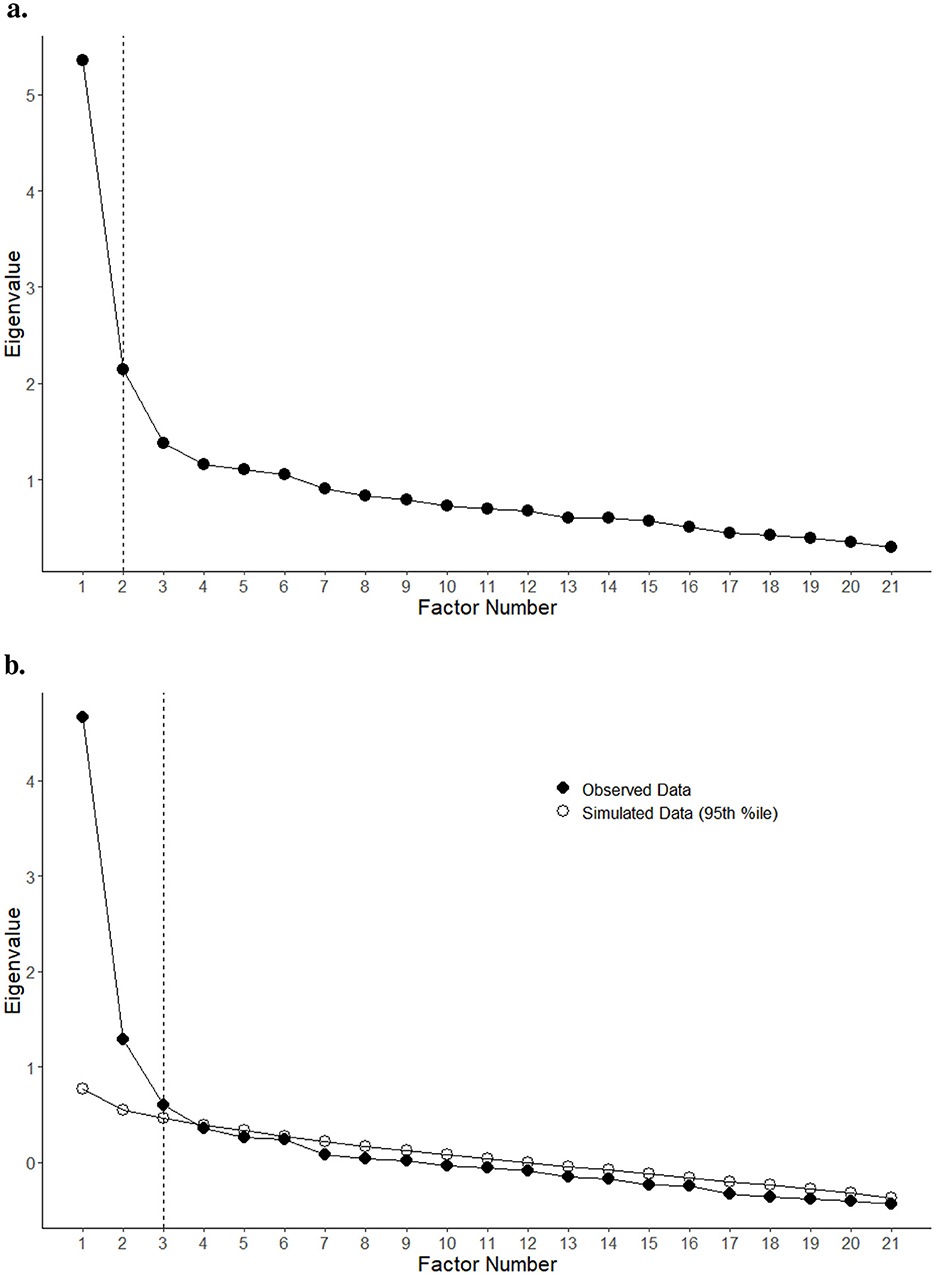
Figure 2. Different approaches to scree plotting produced slightly different results. (A) Scree plot of item ratings, suggesting two factors. (B) Parallel analysis scree plot of item ratings, suggesting two or three factors. Figures have been generated, using code adapted from Sakaluk and Short (2017).
4 Discussion
Using our data, we could not reliably replicate the factor structure of the English NRS with our German translation by means of CFA. While many criteria were on the border of being acceptable, they were not sufficient. Even after removing the items with the weakest R2, the fit indices were not ideal, and the χ2-test stayed significant. However, the SRMR was acceptable, indicating a lower difference between the residuals of our data's covariance matrix and the hypothesized model, and with dropped items both fit indices improved, moving closer to an acceptable range.
In general, the Cronbach's α and McDonald's ω showed that the German NRS as a whole had good internal consistency, similar to that of the original study (Nisbet et al., 2009). This led us to believe that even if the subscales may not apply to our translation, the overall scale is consistent enough to be considered one construct. This of course, left us wondering why we could not replicate the original factor structure. There is the obvious and straight-forward answer that our translation did not convey the same concepts as the original questions. This can be either due to our specific translation or due to general differences in understanding of the questions. Other cultural and ecological differences might also play a role, e.g., the question “The thought of being deep in the woods, away from civilization, is frightening” might be interpreted quite differently by a Canadian vs. a German sample since the two countries differ regarding forests, their inhabiting animals, and inherent dangers. We also believe that some questions like “Animals, birds and plants have fewer rights than humans” can produce very different answers depending on whether the question is interpreted as a descriptive or prescriptive statement. However, this would be less of a language problem, as the same ambiguity might be produced in both languages and, if different between Canadian and German samples, more of an issue of general cultural understanding of the sentence. Another factor may be differences between the samples. Our participants were a little older and had a large range of ages, and while both studies had more women participating than men, ours had relatively even more. Additionally, education levels may have differed. The Canadian sample consisted of undergraduate students, while we did not assess our participants' education. Since they were recruited through university, it is likely that many were enrolled students, but not necessarily all of them. As of now, we cannot say exactly what influence such differences in sample may have had on their respective responses, however, it is entirely possible that these factors contributed to a different understanding of items, or a different relation to the topic at hand, in general.
Most notably, NR-Perspective had the most items removed due to weak factor loadings, according to CFA. Differences between samples may account for some of this factor's weakness. The original sample was surveyed in 2008 while ours was surveyed in 2021. Over this time, attitudes toward nature and environmentalism, as captured by NR-Perspective, may have changed because pro-environmentalist sentiments keep becoming increasingly present in media, fictional or otherwise (Seelig, 2019). Considering mean item values, the three items with the lowest ratings were originally ascribed to this scale (items 11, 10, and 13, Table 2), and NR-Perspective had the lowest overall score as well, meaning highest nature relatedness. Thus, the scale as is may no longer be appropriate to measure interindividual differences in attitude. However, it needs to be mentioned, that the original sample also only produced a Cronbach's α of 0.66 and a retest reliability of 0.65 for this subscale. Our Cronbach's α was of a similar magnitude, casting doubt over the original subscale as well. One of the items that were dropped in our CFA (“The state of nonhuman species is an indicator of the future for humans”), only had a factor loading of 0.17 in the original study as well, so its inclusion is questionable. Taken together, this points toward the possibility that NR-Perspective with its current items never reliably captured the described attitudes to begin with.
To shed further light onto these issues, we conducted an EFA, which had different results than the CFA. Data suggested a two factor solution, rather than three, and three items were dropped, incidentally all items that originally were sorted into NR-Perspective. Additionally, items stemming from NR-Self were now split among the two factors, while NR-Experience and NR-Perspective items did not move. It is noteworthy that in the original study—while NR-Experience and NR-Perspective had no items that loaded meaningfully onto both—many NR-Self items also loaded onto another factor (Nisbet et al., 2009). This leads us to believe that NR-Self may cover a rather vague concept that either underlies and gives rise to the two other subscales or is in turn the distillation and abstraction of the other two, more concrete subscales. Either way, it is not represented in the factor structure found for the German translation. In our structure, factor 1 consisted of NR-Experience items and NR-Self items relating to one's connectedness to nature. Due to the combination not being merely related to physical experiences in nature, we instead suggest the label NR-Presence. Factor 2, which consisted of the three remaining NR-Perspective items and NR-Self items similarly asking for environmental attitudes, may well keep the label NR-Perspective. Cronbach's α and McDonald's ω attest to good overall reliability and decent reliability of the subscales, although NR-Perspective was weaker, similarly to the original NR-Perspective subscale. Additionally, the explained variance was rather low, implying there may have been other, unrecorded influences that affected survey responses.
4.1 Limitations
Overall, our approach to replicate the factor structure has its limitations. For example, we did not test participants twice, and thus cannot judge the test-retest reliability of the scale. We also did not use any other external measurement or other scales to compare our data to and further validate the NRS. There are also problems that arise from the translation method itself. We followed an intuitive and semantic approach to capture meanings, but it may have been worthwhile to use a back translation method and piloting to ensure the translated items actually conveyed the same concepts (Papadakis et al., 2022). Additionally, biculturality of the translation group could not be fully achieved since the native English speaker is a US American with German heritage, not a Canadian citizen. This may have negatively impacted the precision of the translation and possibly led to non-equivalence (Papadakis et al., 2022, 2024). Furthermore, our sample does have its differences compared to the original Canadian sample besides their difference in language and cultural background, such as the gender ratio and age range, which may have affected results as well.
4.2 Conclusion
In conclusion, we recommend splitting the German translation into two subscales (NR-Presence and NR-Perspective) rather than three, with the caveat that future study should further investigate the reliability and validity of the German NRS by retesting and comparing to other indicators. Additionally, the original, English NRS should also be revisited to further investigate scale-dilution and potential change in NR-Perspective.
Data availability statement
The datasets presented in this study can be found in online repositories. The names of the repository/repositories and accession number(s) can be found at: https://osf.io/aetvg/?view_only=0bffcd9d84554035bd704e957aa1aa4b.
Ethics statement
The studies involving humans were approved by the Ethics Committee of the Leibniz Research Centre for Working Environment and Human Factors at the TU Dortmund. The studies were conducted in accordance with the local legislation and institutional requirements. The participants provided their written informed consent to participate in this study.
Author contributions
VG: Data curation, Formal analysis, Investigation, Validation, Visualization, Writing – original draft, Writing – review & editing. CH: Conceptualization, Data curation, Formal analysis, Investigation, Methodology, Project administration, Validation, Writing – review & editing. KB: Writing – review & editing. MO: Project administration, Writing – review & editing. CT: Conceptualization, Methodology, Resources, Supervision, Writing – review & editing.
Funding
The author(s) declare financial support was received for the research, authorship, and/or publication of this article. This work was supported by funds of the Federal Ministry of Food and Agriculture (BMEL) based on a decision of the Parliament of the Federal Republic of Germany via the Fachagentur Nachwachsende Rohstoffe e. V. (FNR); FKZ: 2220HV026B.
Acknowledgments
We thank R. Becker for their assistance during data acquisition.
Generative AI statement
The author(s) declare that no Gen AI was used in the creation of this manuscript.
Conflict of interest
The authors declare that the research was conducted in the absence of any commercial or financial relationships that could be construed as a potential conflict of interest.
Publisher's note
All claims expressed in this article are solely those of the authors and do not necessarily represent those of their affiliated organizations, or those of the publisher, the editors and the reviewers. Any product that may be evaluated in this article, or claim that may be made by its manufacturer, is not guaranteed or endorsed by the publisher.
References
Bernaards, C. A., and Jennrich, R. I. (2005). Gradient projection algorithms and software for arbitrary rotation criteria in factor analysis. Educ. Psychol. Meas. 65, 676–696. doi: 10.1177/0013164404272507
Hu, L.-T., and Bentler, P. M. (1999). Cutoff criteria for fit indexes in covariance structure analysis: conventional criteria versus new alternatives. Struct. Eq. Model. 6, 1–55. doi: 10.1080/10705519909540118
Jorgensen, T. D., Pornprasertmanit, S., Schoemann, A. M., and Rosseel, Y. (2022). semTools: Useful Tools for Structural Equation Modeling. R package version 0.5–6.
Korkmaz, S., Goksuluk, D., and Zararsiz, G. (2014). MVN: an r package for assessing multivariate normality. R J. 6, 151–162. doi: 10.32614/RJ-2014-031
Lishinski, A. (2024). lavaanPlot: Path Diagrams for 'Lavaan' Models via 'DiagrammeR'. R package version 0.8.1.
Nisbet, E. K., Zelenski, J. M., and Murphy, S. A. (2009). The nature relatedness scale: linking individuals' connection with nature to environmental concern and behavior. Environ. Behav. 41, 715–740. doi: 10.1177/0013916508318748
Papadakis, N. M., Aletta, F., Kang, J., Oberman, T., Mitchell, A., and Stavroulakis, G. E. (2022). Translation and cross-cultural adaptation methodology for soundscape attributes-a study with independent translation groups from English to Greek. Appl. Acoust. 200:109031. doi: 10.1016/j.apacoust.2022.109031
Papadakis, N. M., Aletta, F., and Stavroulakis, G. E. (2024). Issues of translation for the ISO/TS 12913-2: 2018 attributes: paradox of equivalence, non-equivalence and suggested approaches to construct equivalence in cross-cultural soundscape research. Appl. Acoust. 225:110163. doi: 10.1016/j.apacoust.2024.110163
Rizopoulos, D. (2006). LTM: an R package for latent variable modelling and item response theory analyses. J. Stat. Softw. 17, 1–25. doi: 10.18637/jss.v017.i05
Rosseel, Y. (2012). lavaan: an R package for structural equation modeling. J. Stat. Softw. 48, 1–36. doi: 10.18637/jss.v048.i02
Sakaluk, J. K., and Short, S. D. (2017). A methodological review of exploratory factor analysis in sexuality research: used practices, best practices, and data analysis resources. J. Sex Res. 54, 1–9. doi: 10.1080/00224499.2015.1137538
Seelig, M. I. (2019). Popularizing the environment in modern media. Commun. Rev. 22, 45–83. doi: 10.1080/10714421.2019.1569449
Shi, D., Lee, T., and Maydeu-Olivares, A. (2019). Understanding the model size effect on sem fit indices. Educ. Psychol. Meas. 79, 310–334. doi: 10.1177/0013164418783530
Shi, D., Maydeu-Olivares, A., and DiStefano, C. (2018). The relationship between the standardized root mean square residual and model misspecification in factor analysis models. Multivariate Behav. Res. 53, 676–694. doi: 10.1080/00273171.2018.1476221
William, R. (2023). psych: Procedures for Psychological, Psychometric, and Personality Research. Evanston, IL: Northwestern University. R package version 2.3.12.
Keywords: questionnaire translation, confirmatory factor analysis, exploratory factor analysis, nature relatedness, nature connectedness, environmental attitudes
Citation: Gallus V, Hucke CI, Butter K, Ohlmeyer M and van Thriel C (2024) Translation and validation of the Nature Relatedness Scale to German. Front. Psychol. 15:1507983. doi: 10.3389/fpsyg.2024.1507983
Received: 08 October 2024; Accepted: 26 November 2024;
Published: 16 December 2024.
Edited by:
Francesco Aletta, University College London, United KingdomReviewed by:
Steffen Lepa, Technical University of Berlin, GermanyJerónimo Vida Manzano, University of Granada, Spain
Karn Watcharasupat, Georgia Institute of Technology, United States
Copyright © 2024 Gallus, Hucke, Butter, Ohlmeyer and van Thriel. This is an open-access article distributed under the terms of the Creative Commons Attribution License (CC BY). The use, distribution or reproduction in other forums is permitted, provided the original author(s) and the copyright owner(s) are credited and that the original publication in this journal is cited, in accordance with accepted academic practice. No use, distribution or reproduction is permitted which does not comply with these terms.
*Correspondence: Viviane Gallus, Z2FsbHVzQGlmYWRvLmRl
 Viviane Gallus
 Christine Ida Hucke
 Katja Butter
 Martin Ohlmeyer2
 Christoph van Thriel