 Su-Chiu Yang
 Li-Chieh Hsu
94% of researchers rate our articles as excellent or good
Learn more about the work of our research integrity team to safeguard the quality of each article we publish.
Find out more
ORIGINAL RESEARCH article
Front. Psychol., 23 July 2024
Sec. Perception Science
Volume 15 - 2024 | https://doi.org/10.3389/fpsyg.2024.1427665
Prior research on the relationship between the taste, aroma and drinking utensils of beverages tends to focus on topics such as alcohol, sparkling beverages, juice, coffee, and hot chocolate. There is limited research focused on the interdependence between the perception of teacups and the tea taste. The literature has not yet found any research covering the impact of visual shape and the tactile sensation of teacups on the perception of tea flavor. Therefore, this study proposed six hypotheses related to the teacup shape and texture, teacup preference and taste and smell of tea. This study involved experimental design and questionnaire data collection, using a convenience sampling method to recruit 102 participants voluntarily. The research results are: (1) Age and gender have an impact on the taste and aroma perception of tea; (2) The width, height, rim thickness and smoothness of the teacup surface do have an impact on the perception of taste and fragrance of tea. (3) The preference of teacup played an intermediary effect between tea taste and the shape and texture of teacup. The implications of these findings on the perception of tea flavor are discussed.
According to Joshi (2023), writing in Tea Statistics, in 2023, more than 87% of Millennials drank tea, resulting in 4 out of 5 tea consumers and 3 billion cups of tea being consumed around the globe every day. Despite the global popularity and consumption figures for tea, there has been remarkably little research on the tea drinking vessel compared to other beverages, such as coffee, hot chocolate, cola, etc. (Piqueras-Fiszman et al., 2012; Van Doorn et al., 2014, 2017; Spence and Wan, 2015; Cavazana et al., 2017). These beverages were consumed from a wide range of different receptacles, that vary in terms of their size, texture, shape, material properties, color, etc. The old saying, “you eat with your eyes” (Delwiche, 2012) reveals the truth that our experience of eating food or drinking beverage is more than just a chemical reaction between the food and our sensation (Spence and Piqueras-Fiszman, 2014; Spence, 2017; Risso et al., 2019). It is the context of the stimuli and the complex reactions among the different sensory aspects, as well as the brain integrating them into a whole experience. The process by which human sensory receptors receive external stimulation does not operate independently, but is compounded and performed simultaneously. Research on visual effects on food taste includes the effects of food color, food texture, and eating environment on the “taste” and “aroma” of food (Hogenkamp et al., 2011; Woods et al., 2011; Piqueras-Fiszman et al., 2012; Stewart and Goss, 2013). Therefore, when we eat something, in addition to smell and taste, sensory stimulation such as vision, hearing, and touch also contribute to the formation of the “flavor system” (Small et al., 2004; Shepherd, 2006). A number of studies had pointed out that, in addition to the texture and appearance of the food itself affecting the taste and aroma of the food, the visual stimulation of the containers holding food or drinks in restaurants or supermarkets is closely related to the enjoyment and charm of the food (Shepherd, 2006; Zellner et al., 2010, 2011; Mielby et al., 2012; Piqueras-Fiszman et al., 2013). Hence, over the past two decades, many studies began to investigate these important aspects. The study by Piqueras-Fiszman et al. (2012) showed that the color of food and drink containers can enhance the flavor and aroma components. The study found that subjects had different perceptions of sweetness and flavor for the same hot chocolate while they were using the different color of cups.
A number of studies (Madden et al., 2000; Piqueras-Fiszman et al., 2012; Wan et al., 2014, 2015) focusing on coffee, juice, or wine have shown that the visual shape of beverage utensils affects the judgment of drinks with a specific color, as well as the expectations for the aroma of drinks. For example, if a purple drink is placed in a wine glass, it will be considered as wine, while if a purple drink is placed in a straight glass, it will be considered as grape juice. Li et al. (2020) conducted a cross-cultural study on the impact of the visual appearance of the container on the subjective evaluation and taste expectations of tea by using 1,100 Chinese and 100 Americans as subjects. They displayed on-line photos of Chinese or British tea sets containing Chinese and British brands of green tea to explore how the subjects felt about each cup of tea and to evaluate their taste expectations. The study found that the tea set affected bitterness expectations for Chinese subjects with the Chinese brand of green tea and enjoyment expectations for the tea.
The research by Van Doorn et al. (2014) showed that the appearance color of the cup affected the subjects’ sensory perception of the intensity of the same coffee. Researchers found that the same coffee in white ceramic mug was perceived as having a richer taste than coffee in a transparent mug. Apart from the perception of taste, the color of the cup also affects the perception of coffee temperature (Guéguen and Jacob, 2012) and the judgment of the taste of regular water and sparkling water (Risso et al., 2015).
Visual and tactile stimuli have been shown to alter the perception of taste, smell and flavor. Studies tested whether how subjects saw and touched the wine glass affected the aroma of wine. The results showed that when the subjects could not see or touch the wine glass, the shape of the wine glass had little impact on the perception of the aroma of the wine. On the contrary, if the subject sees and holds the wine glass, the shape of the wine glass has a considerable impact on the perception of the aroma of the wine (Cliff, 2001; Delwiche and Pelchat, 2002; Russell et al., 2005). In addition, some studies have found that even experienced wine tasters would still be affected by the shape of the wine glass in their perception of aroma (Vilanova et al., 2008). A similar research conclusion was reached by Peng and Yang (2017), indicating that the shape of the teacup affects the tea taste. Even experienced professional tea reviewers gave different ratings to the aroma and taste of tea brewed from the same tea at the same time and in different shapes of teacups. Van Doorn et al. (2017) conducted a cross-cultural study on how the shape of coffee cups affects the taste of coffee in China, Colombia and the United Kingdom. They found that visual information such as the diameter of the coffee cup and the height of the cup is closely related to consumers’ sensory expectations. Besides the visual elements affecting the taste perception of beverages, the research also found that the taste-tactile multisensory interactions affected beverage perception. Schifferstein (2009) conducted a study by using five cups that were almost identical in shape and size but made from different materials, to have participants rate the empty cups and evaluate the experience of drinking hot tea or a chilled soft drink from these cups. The results found that the drinking experience was linked to the cups. In the study of tactile aesthetics, Kreifeldt (2013) proposed that the visual image of the appearance of an object can evoke appropriate tactile feelings and produce visual and tactile cross-module aesthetics. Therefore, whether the imagined tactile sensations and actual tactile sensations evoked by the visual design of beverage vessels also have a cross-modal impact on the smell and taste of beverages arose researchers’ curiosity.
Tea is the most widely consumed beverage globally. In 2022, China was the largest tea consumption country in the world, accounting for more than 41% of global tea consumption (China Association for the Promotion of International Agricultural Cooperation, 2022). The study by Spence and Wan (2016) specifically pointed out that, although there are a large number of tea drinkers around the world, there is little research on the issue of suitable utensils for tea drinks, and especially a lack of in-depth investigation and research on Chinese teacups. To summarize, the available literature indicates that various visual and tactile factors in drinking utensils design could be expected to have effects on a beverage, and in particular that color, shape, and texture are key aspects to consider. As a whole, however, research on the relation between perceived quality and consumer perception of tea specifically is limited. In particular, there is a gap in research on the impact of visual and tactile sensations on tea flavor perception. This research will therefore address the visual and tactile effect of teacups on consumer perception of tea quality within the theoretical motivation of the “flavor system” (Shepherd, 2006) context and uses an experimental survey and questionnaires to collect data.
Visual and tactile factors are key aspects in this study, therefore, based on the previous literature related to the impacts of the visual shape and texture of the utensils on the taste perception of tea or other beverages, research hypotheses were proposed based on the following description. First, for the visual part, according to Li et al. (2020) research, the perception of differences in the visual shapes of Chinese and Western teacups and utensils of different shapes affects subjects’ expectations for the taste of tea. Other related literature mostly focused research on wine, coffee, hot chocolate or juice, etc. The shape of the wine glass had an impact on the aroma of wine (Delwiche and Pelchat, 2002) and the “cup diameter” and “cup height” affected the characteristic aroma, bitterness, intensity and sweetness of coffee (Van Doorn et al., 2017). Even Cavazana et al. (2017) found that cola in a typical cola cup feels sweeter and more intense than cola in a water glass or a plastic cup. Therefore, the shape differences of comprehensive utensils is hypothesized to have impacts on the taste perception of tea and the following three hypotheses are made:
H1: The width difference of the teacup affects the flavor of the tea.
H2: The height difference of the teacup affects the flavor of the tea.
H3: The thickness of the teacup’s rim affects the flavor of the tea.
Secondly, the touch of hand, skin and lips were the main receptors stimulated in this study. Delwiche and Pelchat (2002) conducted a blind taste study and found that professional tasters were influenced by the visual image of the glass when judging taste and aroma. Other related literature showed that both professionals and amateurs were inevitably going to be affected by touch when tasting tea or wine (Vilanova et al., 2008; Peng and Yang, 2017). Regarding the impact of surface texture on the nasal smell and oral sensation of the wine tasting experience, Wang and Spence (2018) found that when subjects touched wine glasses with contrasting textures of velvet and sandpaper, the wine in the velvet glass had a more fruity aroma than the rough wine glass, and the taste was also sweeter and more pleasant. Schifferstein (2009) found that the materials of the utensil and the touch of the skin have a significant impact on the sensory attributes “warmth” and “sweetness” of hot Earl Gray tea or ice lemon drinks and an impact on the bitterness of coffee and the sweetness of chocolate (Van Rompay et al., 2017). Tu et al. (2015) took Chinese tea drinks as the research object and found that utensils with different tactility had an impact on the sweetness and coldness of the tea drinks. The external information of the texture of teacup is integrated with information from taste receptors through the perception of other modalities. The fourth hypothesis is made as follows:
H4: The smoothness of the teacup surface affects the flavor of the tea.
Besides the above external information, internal emotional state may also influence taste perception through awareness. Prior studies had shown that emotional states influence taste perception. Most studies found negative emotion tended to exert the opposing effect on taste perception (Noel and Dando, 2015; Wang and Spence, 2016, 2018; Reinoso-Carvalho et al., 2019, 2020; Zushi et al., 2023). Other research found that there is a metaphorical association between emotions and taste, i.e., sweetness is related to positive emotion (Liang et al., 2020; Zhou and Tse, 2020). The shape and texture of a teacup are the determinants of the consumer’s preference when choosing teacups. Therefore, teacup preference should be classified as an emotional response. The fifth and sixth hypotheses are made as follows:
H5: The shape and texture of teacup affects the preference of teacup.
H6: The preference of the teacup shape affects the flavor of the tea.
The relationship model of teacup shape and texture, teacup preference and the tea taste and smell is shown in Figure 1.
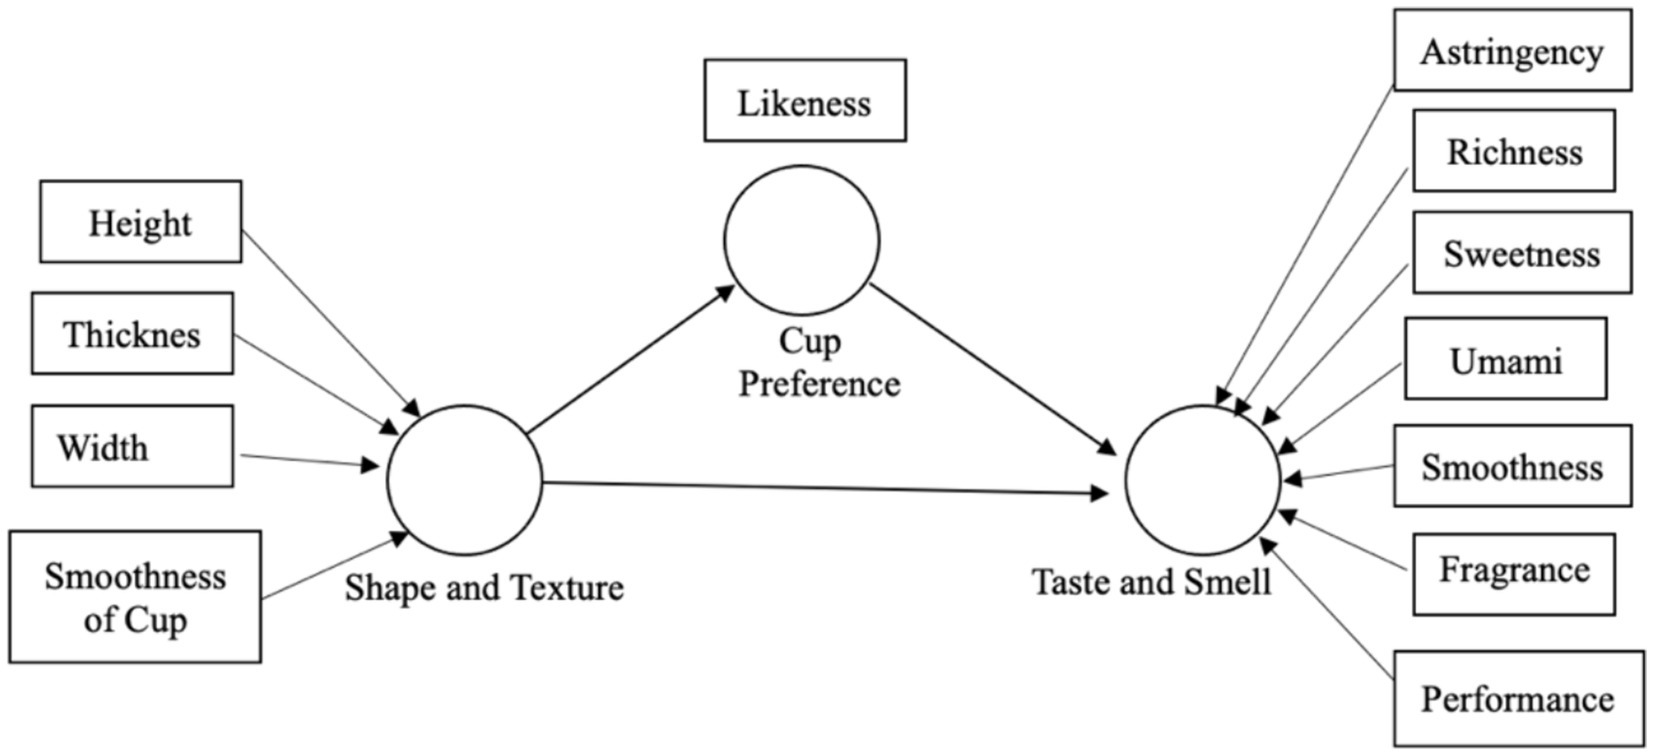
Figure 1. Relationship between teacup shape and texture, teacup preference and the tea taste and smell.
The visual shape and texture of the teacup are the independent variables in this study. The dependent variables are the taste, fragrance and overall performance of the tea. Chinese famous high mountain tea, Dahongpao, was selected as the experimental material for this study. A white porcelain evaluation cup with a capacity of 150 mL was used to hold 3 grams of tea. It was brewed with 100°C water and soaked for 5 min. According to expert evaluation standards, the flavor of tea drinks is classified into (a) the intensity of tea astringency; (b) the intensity of tea umami; (c) the intensity of tea sweetness; (d) the intensity of tea smoothness; (e) the intensity of tea richness and (f) degree of tea fragrance. This study included the overall appreciation of tea and the degree of preference for teacups, then designed a questionnaire based on the 5-point Likert scale.
Eight teacups with similar capacities but different shapes and textures were selected as materials for this study (Figure 2). The description of the eight cups are as follows: (A) Cup A with a wide mouth and shallow body (cup diameter width: 7.7 cm, cup height: 3.8 cm, cup rim thickness: 0.4 cm); (B) Cup B with outward wide a mouth and shallow body (cup diameter width: 6.7 cm, cup height: 3.5 cm, cup rim thickness: 0.3 cm); (C) Cup C with an open mouth and a narrow shallow body (cup width: 5.6 cm, cup height: 5.6 cm, cup rim thickness: 0.4 cm); (D) Cup D with a narrow deep body (cup diameter width: 4.7 cm, cup height: 6.0 cm, cup rim thickness: 0.25 cm); (E) Cup E with an open narrow shallow body (cup diameter width: 6.4 cm, cup height: 3 cm, cup rim thickness: 0.2 cm); (F) Cup F with a narrow mouth, deep body and protruding surface (cup diameter width: 5.2 cm, cup height: 4.8 cm; cup rim thickness: 0.5 cm); (G) Cup G with a wide mouth, shallow body and smooth surface (diameter width: 6.5 cm, cup height: 4.2 cm, cup rim thickness: 0.6 cm); (H) Cup H with rough surface, outward wide mouth and shallow body (cup diameter width: 7 cm, cup height: 3.8 cm, cup rim thickness: 0.25 cm).
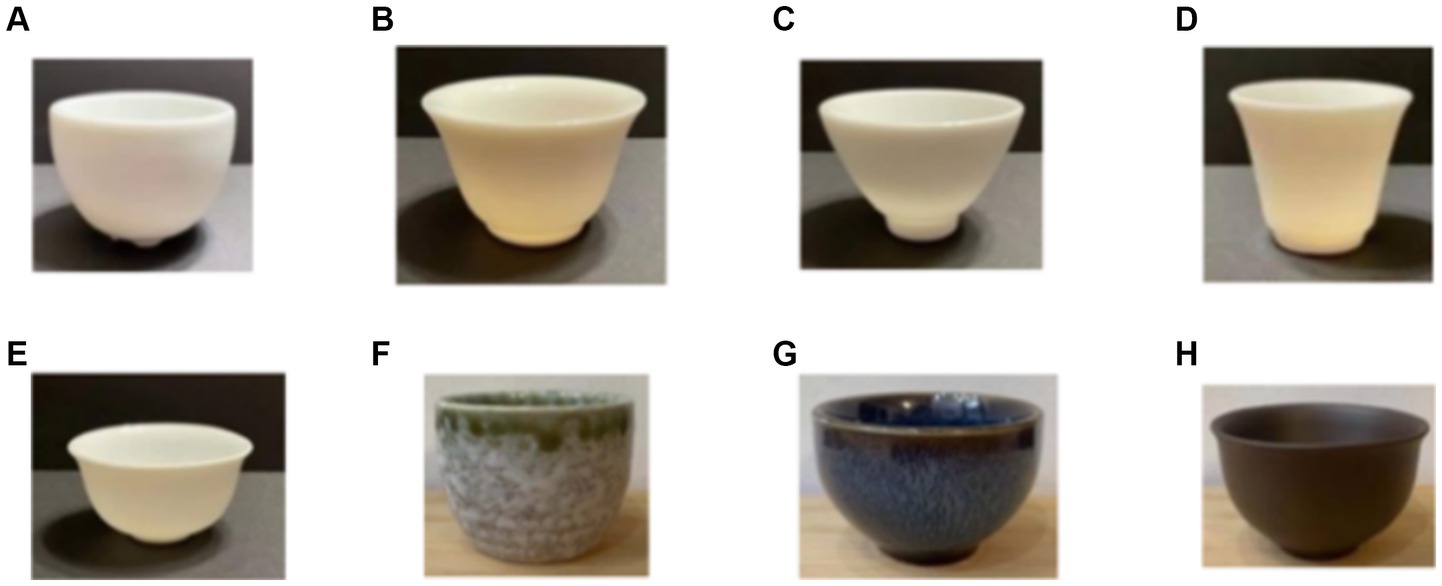
Figure 2. Cup A-H.
The professional classification of the tea flavor been described in section 2.3. It is hard for the novices or general consumer to distinguish between tea taste and fragrance according to the professional classification. In order to achieve the desired accuracy, validity and bias avoidance of the experiment for this study, therefore, participants were mainly recruited through the members of relevant tea associations or organizations or volunteers who are interested in this study recruited from the community. Therefore, participants covered everyday tea drinkers, professional tea lovers as well as novices or general consumers. One hundred and two participants took part in this study. The basic information of the subjects such as gender, age, education and frequency of tea drinking is summarized in Table 1. The sample comprised 66 females and 36 males. Their ages were mainly distributed between 45 and 64 years old, accounting for 68%. All of the participants have at least a bachelor’s degree, and 59% of the participants drink tea every day.
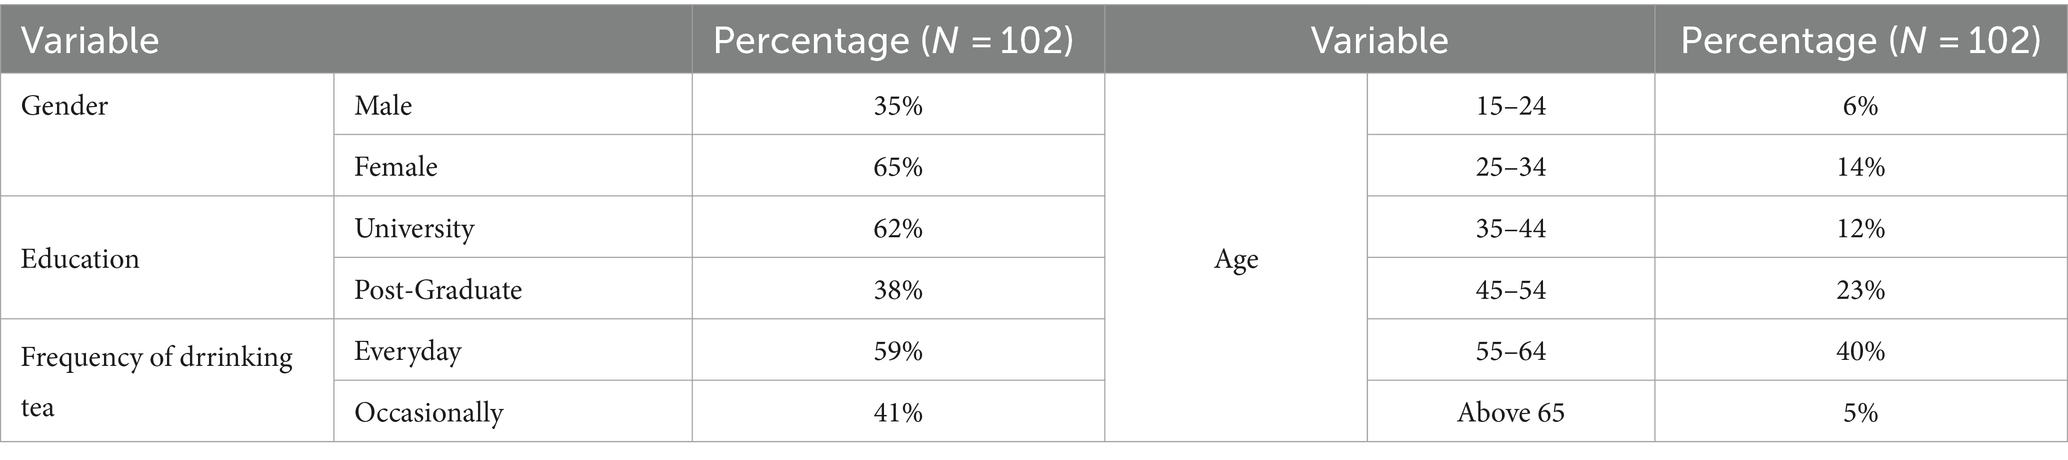
Table 1. Participant demographics.
This study collected the physiological and psychological perception of the subjects during the tea drinking process and did not involve the use of human specimens for biological behavior, physiology, psychology, genetics, medicine and other research. According to the National Taiwan Normal University Research Ethics Review Committee’s exemption case-project host self-evaluation system, the subjects in this study were all adults, and they all accepted the test freely and without coercion, and this study was exempt from ethical review by the ethical review committee. The participants provided their written informed consent to participate in this study.
Participants were informed in advance to rinse their mouths before taking the test to ensure that there were no residues in the mouth. The process of the experiment and the contents of the questionnaire were explained in advance. After that, the researcher gave the subjects 10 min to fill out their basic personal information and read the reference information of the questionnaire. To prevent the tea from getting cold, the tea was brewed within these 10 min, poured into a teacup, and placed in front of the subject. The subject drank the tea in the given teacup in order. Then, they made subjective judgments about the taste and aroma, and filled in the judgment results in the second part of the questionnaire.
SPSS quantitative statistical analysis was used to examine the correlation between variables. Single-factor variation was used to analyze the differences in flavor of tea drinks between the two groups and their correlation with other variables. Pearson’s product coefficient correlation detected whether there is an interaction or correlation between the taste of tea, the aroma of tea and teacup preference. The independent-sample T-test was used to detect whether gender differences in the subject group had an impact on the taste of the tea. For more than three variables, analysis of variance (ANOVA) was applied to determine whether the differences between groups reached a significant level.
Tea taste data from the one hundred an two subjects were analyzed. The descriptive statistical analysis found the average number of cup A was the highest in umami, smoothness and fragrance of tea taste perception. Cup B presented the highest average number in sweetness of tea taste perception. Regarding the overall performance of tea taste and teacup preference, cup D presented the highest average number. Cup F presented the highest average number in astringency and richness of tea taste perception. In terms of the appearance characteristics of the teacup, cup A, B and D are white and have a smooth surface, while the surface of cup F is smooth but granular. Conclusively, Cup A and B with the common characteristic of a wide cup mouth had a higher score on the umami, smoothness and sweetness which is found on the front part of our tongue taste map. Cup F with the characteristic of thickest cup rim and convex surface presented the highest average number in astringency and richness of tea perception which are on the inner side of the tongue taste map.
Independent sample T-tests of SPSS were employed to test to the influence of gender differences on the perception of tea taste and fragrance. Results (Table 2) revealed that there were significant differences only in the perception astringency and richness of tea taste. Male participants’ perception of the astringency and richness of the tea taste was significantly higher than that of female participants.
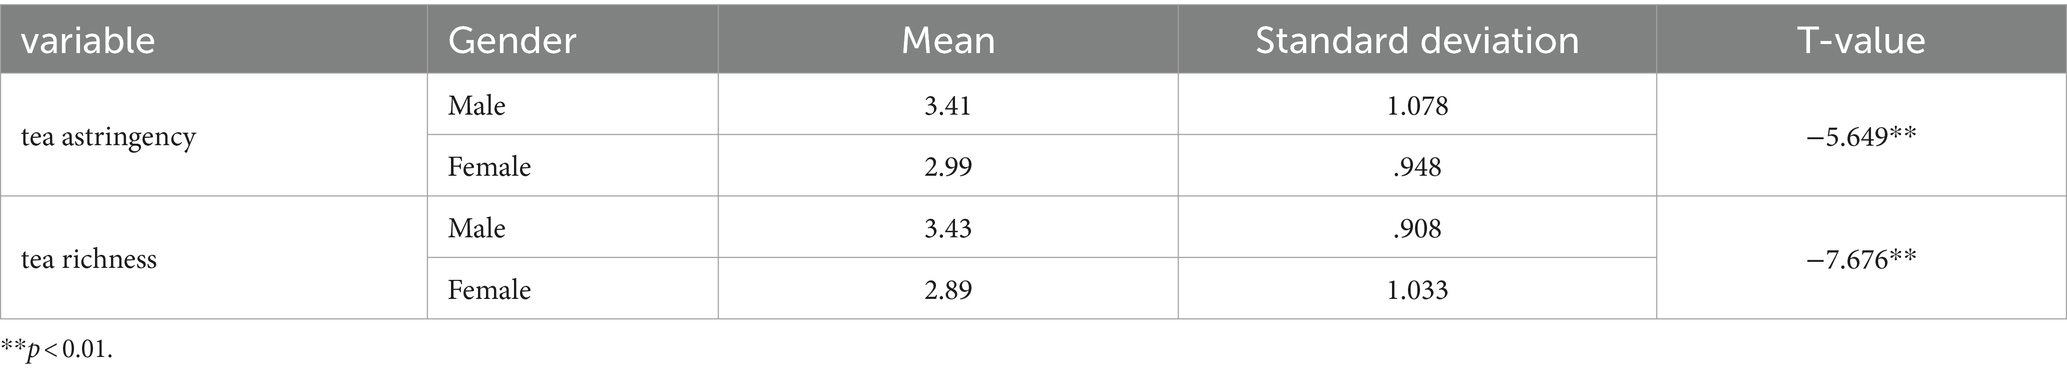
Table 2. Comparison of gender differences in the flavor of tea.
ANOVA was used to test the impact of age differences on the taste of tea. It was found that the age variables (Table 3) had significant differences in the taste, smell and overall performance of tea. Tukey HSD multiple comparisons were used to analyze the differences in the impact of different age groups on the flavor of tea.
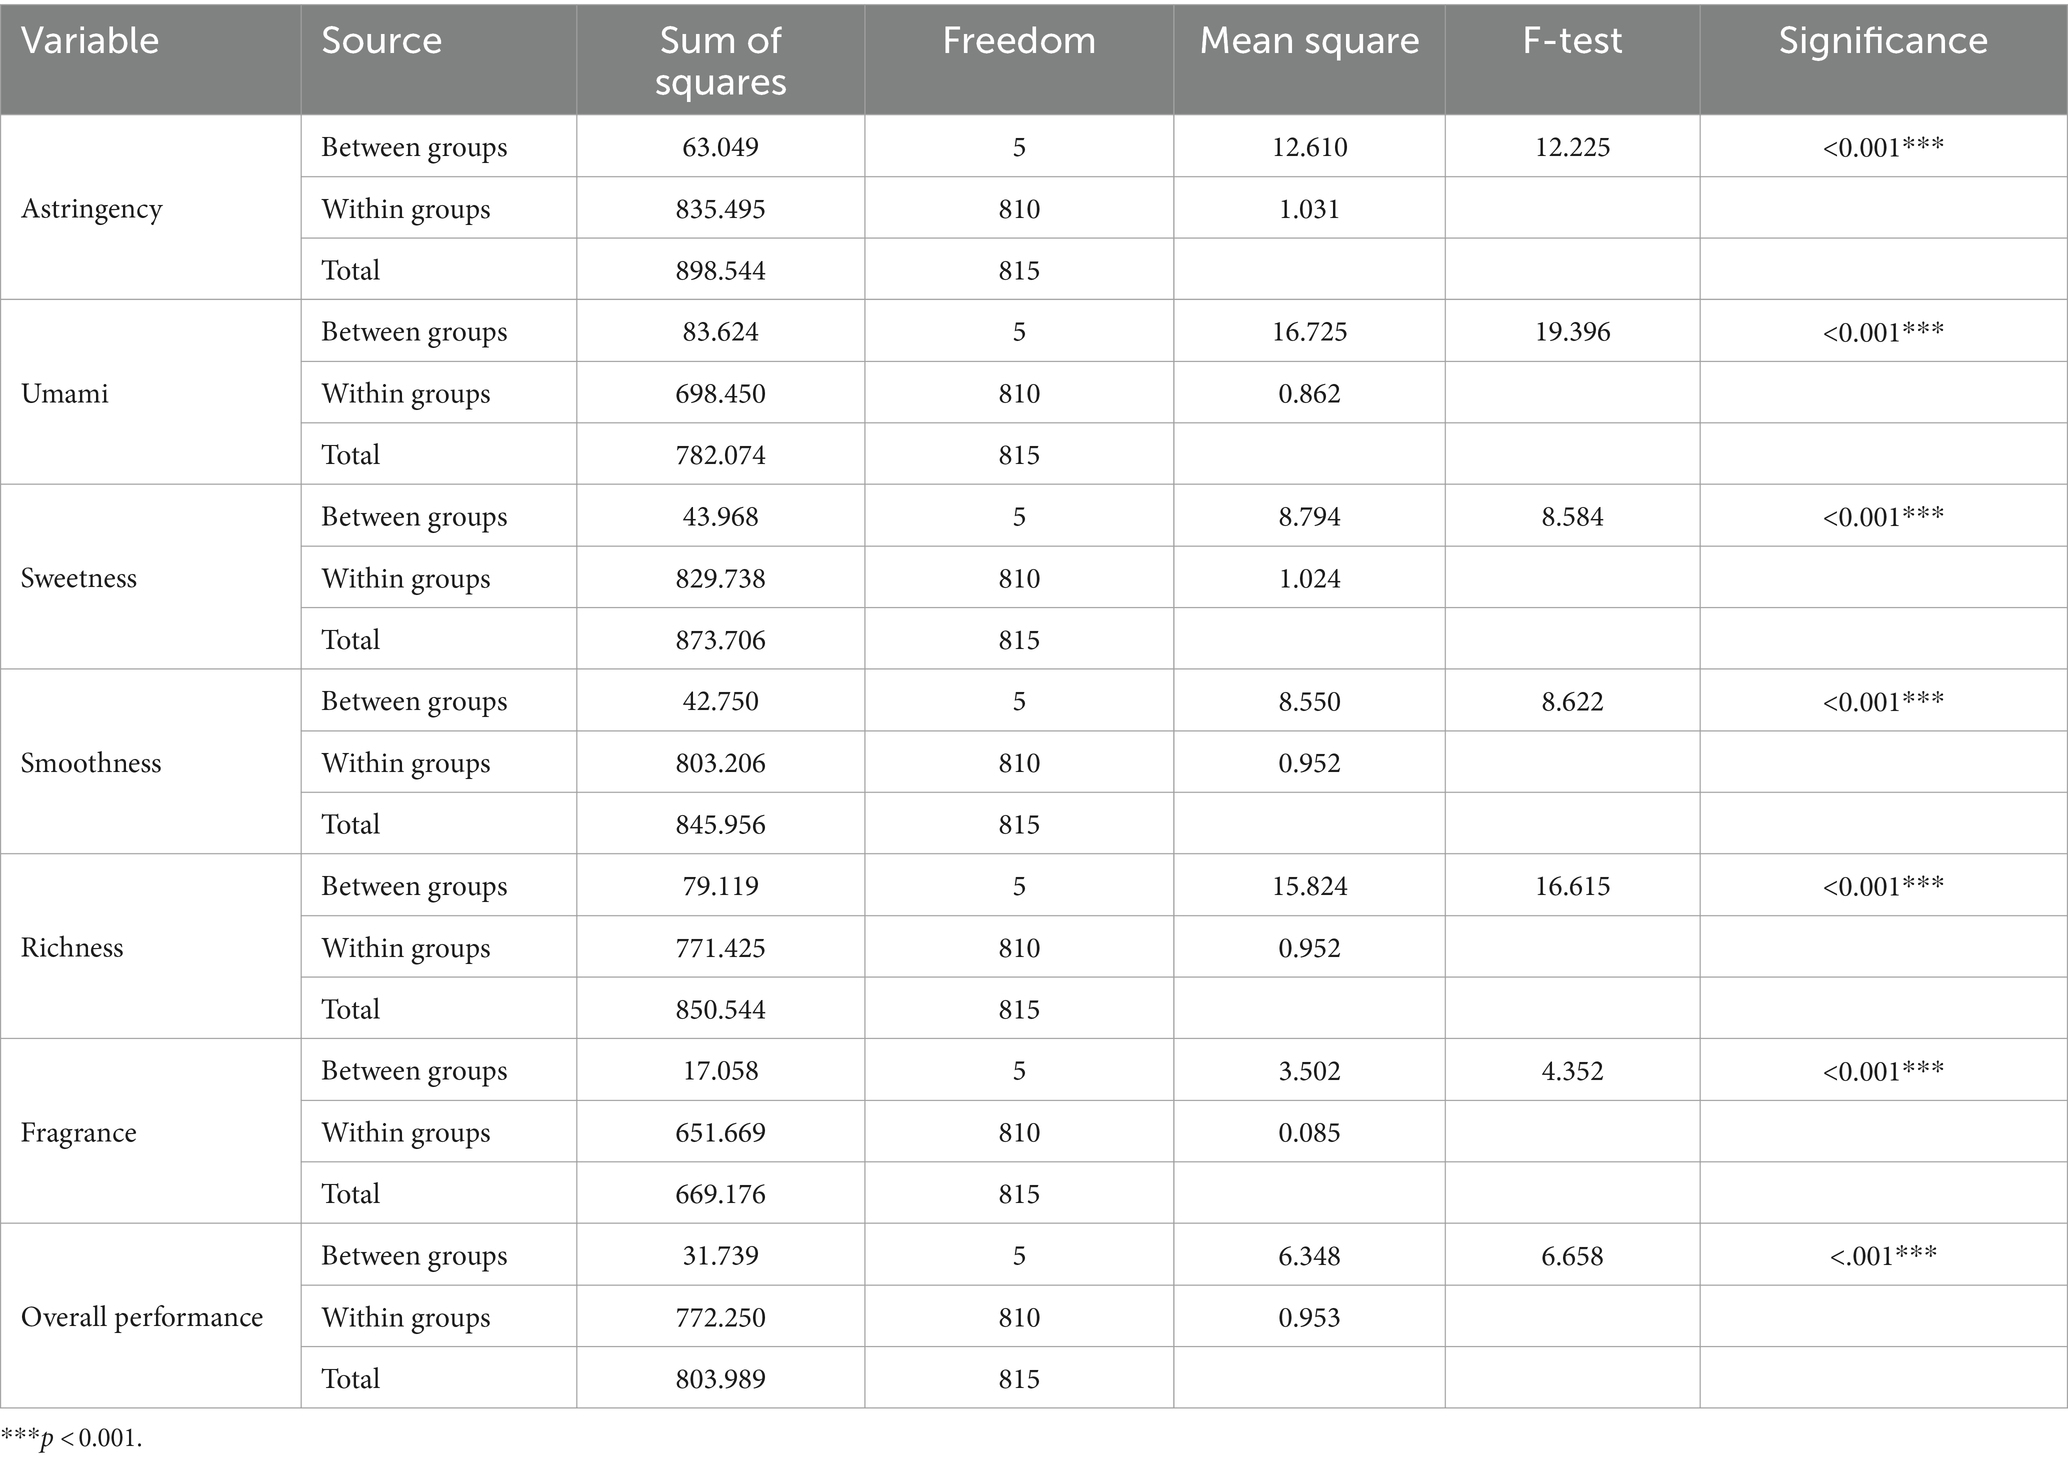
Table 3. ANOVA analysis of differences in flavor compared to age.
Table 4 showed that the younger the subjects, the stronger the astringent, rich and better overall performance of tea taste; while the older the subjects, the stronger the umami, sweet, smooth taste and better fragrance of tea taste. It could be interpreted that younger subjects, who tend to be affected by the tea beverage on the market, have less a traditional tea drinking experience than older subjects, so they might be more sensitive to the astringent and rich perception of tea taste. On the contrary, the older subjects have more tea drinking experiences, so they are more sensitive to the sense of umami, sweetness, smoothness and fragrance of tea taste. Therefore,we concluded that age differences reflect the perception of different flavor and fragrance of tea.

Table 4. Multiple comparative analysis of Tukey HSD.
The flavor and fragrance of tea do not exist as a single entity. Normally due to the production process, the flavor and fragrance are mixed into the tea and present a different level of perception in taste and smell. In order to understand whether the taste of tea, the fragrance of tea and teacup preference interact with each other, Pearson’s product coefficient correlation was used to identify the correlation between variables and the square value of the product coefficient (R2) was used as the determining coefficient to display the percentage of explanation between variables (Table 5). The coefficient of determination R2 between 0.16 and 0.47 means a moderate correlation between variables. Results showed that: (1) The astringency of the tea taste had a moderate correlation with the richness of tea taste; (2) The umami of tea taste had a moderate correlation with the sweetness and smoothness of the tea taste; (3) The sweetness of tea taste had a moderate correlation with the umami and smoothness of the tea taste; (4) The overall performance of the tea taste had a moderate correlation with the umami, sweetness, smoothness and fragrance of the tea taste; (5) Although there was a correlation between the preference of the teacup and the taste and richness, fragrance and the overall performance of tea, the correlation was low (R2 < 0.16).
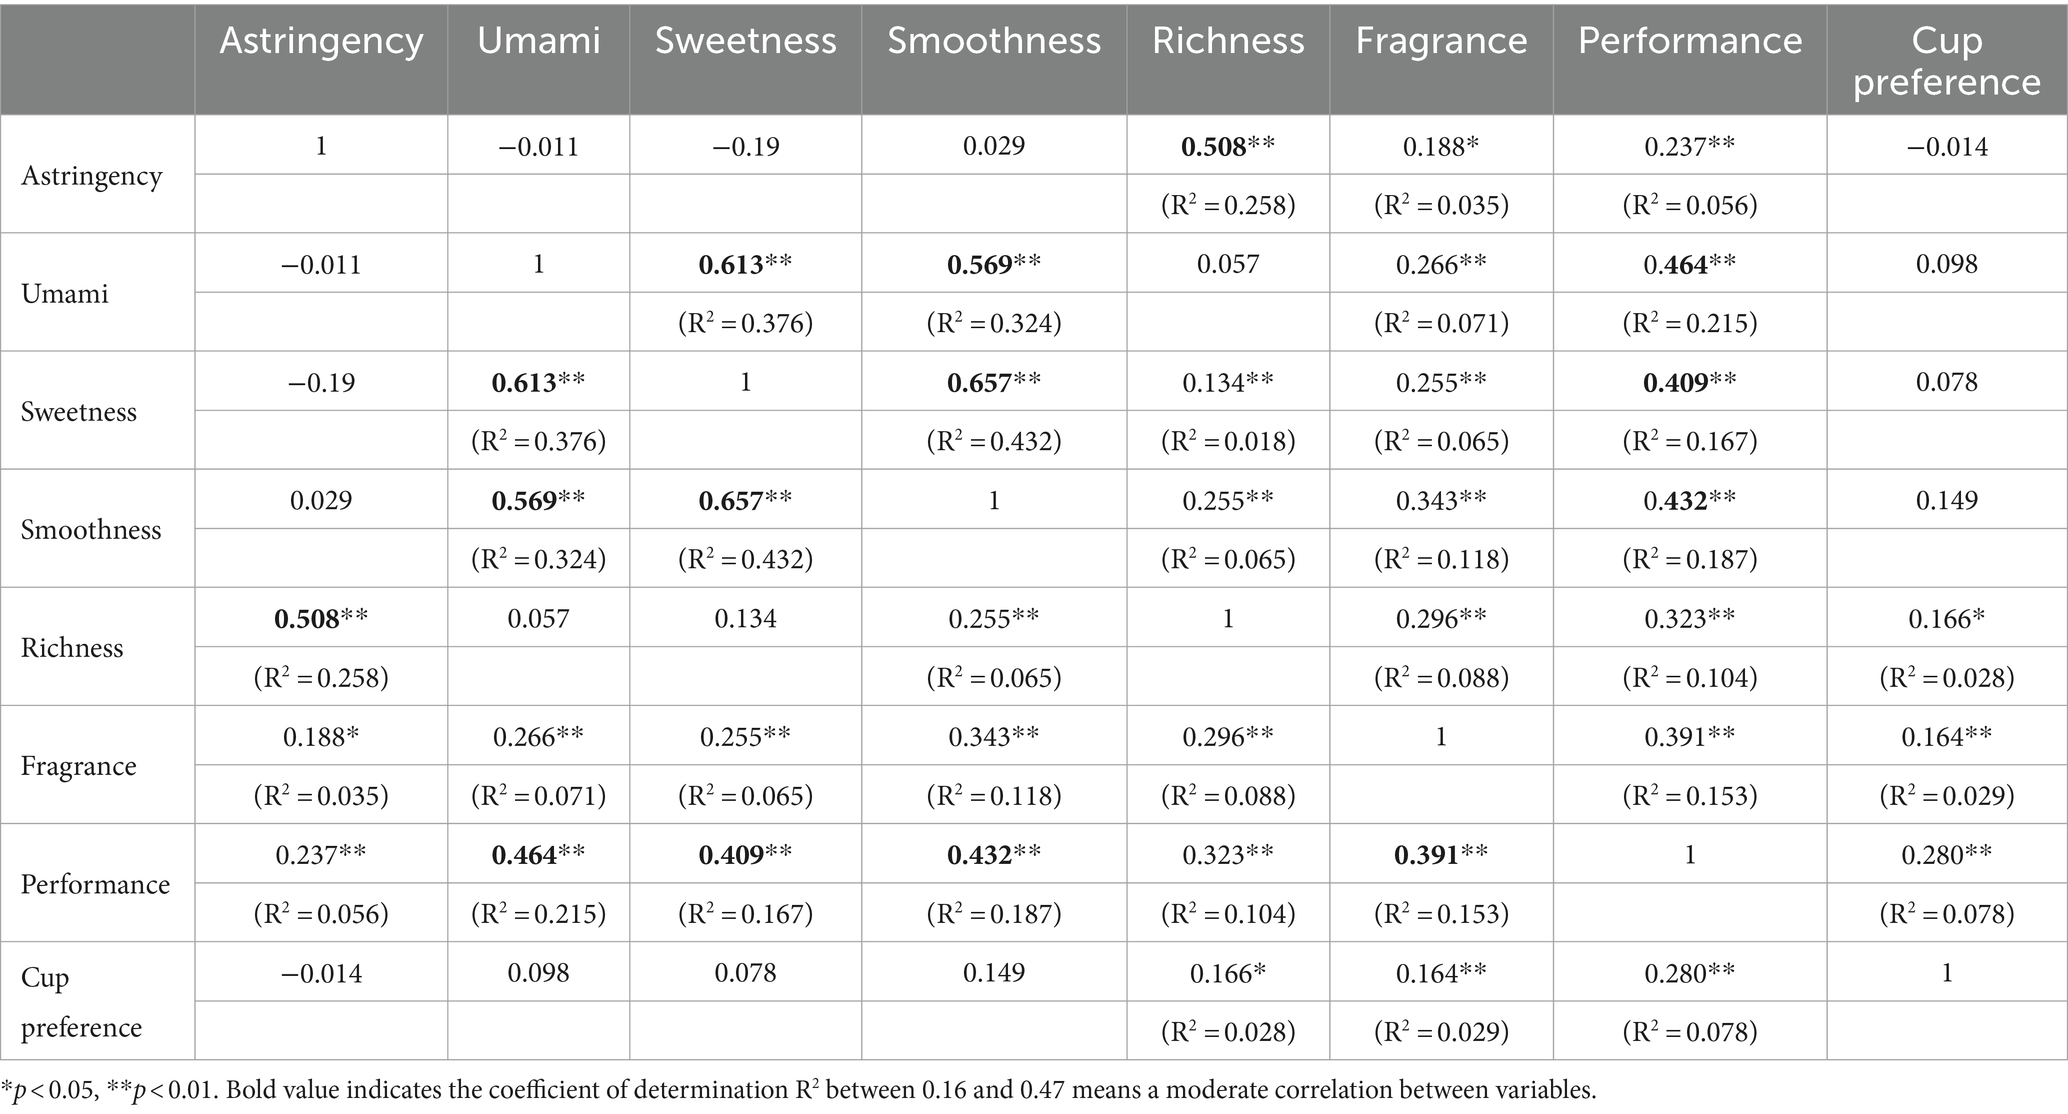
Table 5. Correlation matrix between tea flavor and teacup preference.
Pearson’s product coefficient correlation is also used to examine the influences of cup shape and texture on the flavor perception of tea. Table 6 revealed that the texture of the cup surface has impacts on the astringency, umami, sweetness, smoothness, fragrance, performance of tea taste perception and the cup preference, yet the correlation was low (R2 < 0.16).
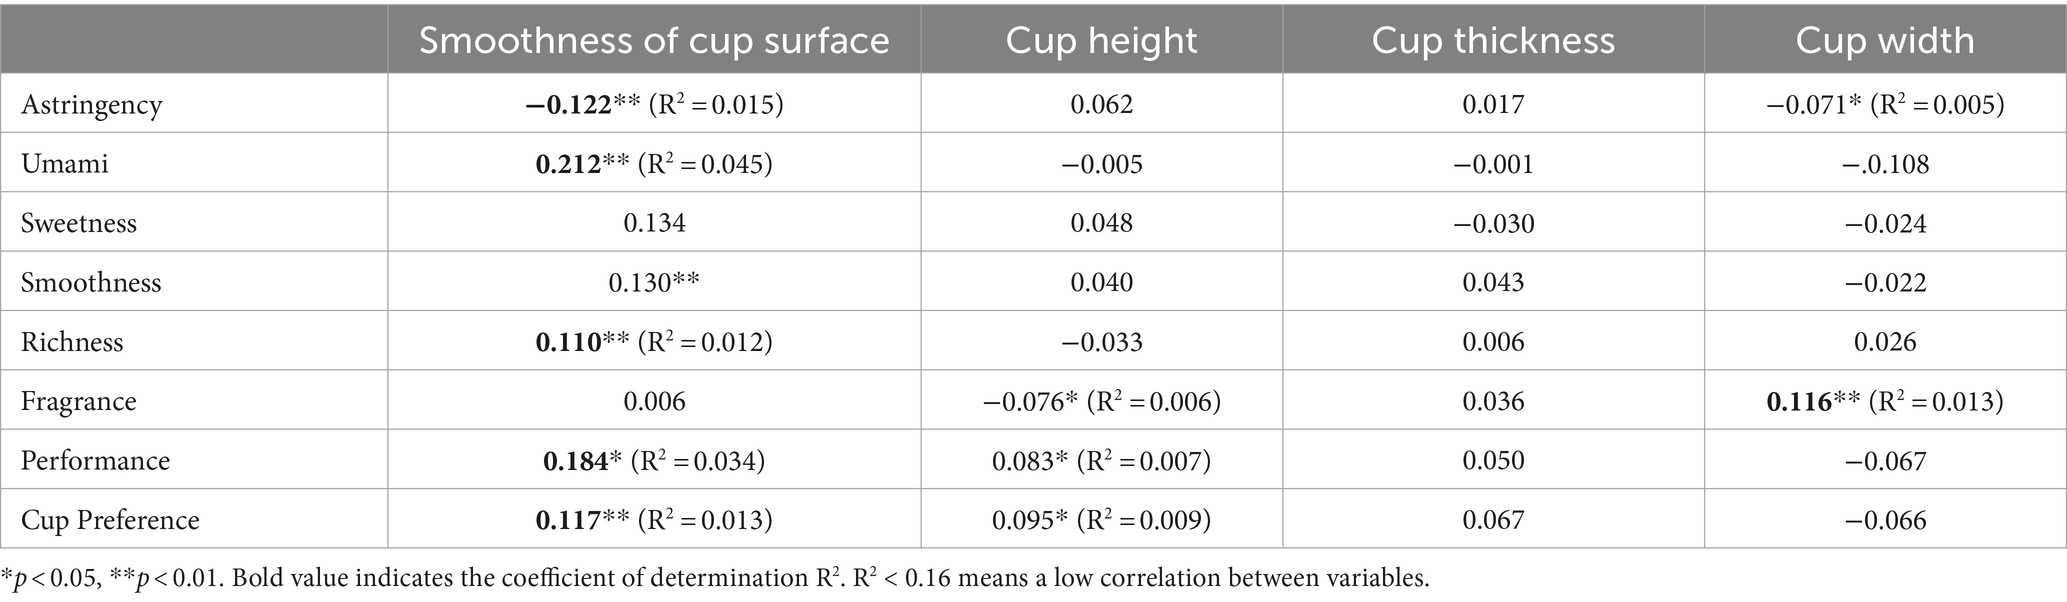
Table 6. Correlation matrix teacup shape and texture and flavor, teacup preference.
In the field of social science, many implicit behaviors and psychological traits cannot be observed and measured, and these are latent variables that exist between explicit variables. Therefore, structural equations model (SEM) uses a regression method to estimate the causal relationship between measured variables (Wu, 2013, p. 426). In this study, the non-duality of teacup appearance tea led to differences in visual and tactile sensory perception and had a complex relationship with the taste, fragrance and overall performance of the tea taste. Therefore, the proposed model (Figure 1) was tested using Smart PLS and multiple regression. The effect-cause relationship path diagram was drawn as Figure 3. Smart PLS results were shown on the solid line in Figure 3. Path coefficient indicated that the model of cause-effect relation between tea taste and the shape and texture of teacup was significant (p-value is 0.010 < 0.05). It also indicated that the relation between tea taste and the preference of teacup (p-value is 0.000) and the relation between the shape and texture of teacup and the preference of teacup (p-value is 0.005) were salient. We used multiple regression (the dotted line in Figure 3) to explore the impacts of all the independent variables of teacup shape and texture on the flavor of tea. The results showed that the height of teacup had significant influence on the smell (p-value is 0.029) and overall performance of tea (p-value is 0.018). The thickness of teacup rim influenced the overall performance (p-value is 0.029) of tea significantly. The width of teacup showed a significant effect on the astringency (p-value is 0.043) and the smell of tea (p-value is 0.000). The surface smoothness of the teacup affected the smoothness (p-value is 0.004), umami (p-value is 0.001), sweetness (p-value is 0.025) and the overall performance (p-value is 0.024) significantly. In all, the surface texture of teacup is the most influential factor on the taste of tea.
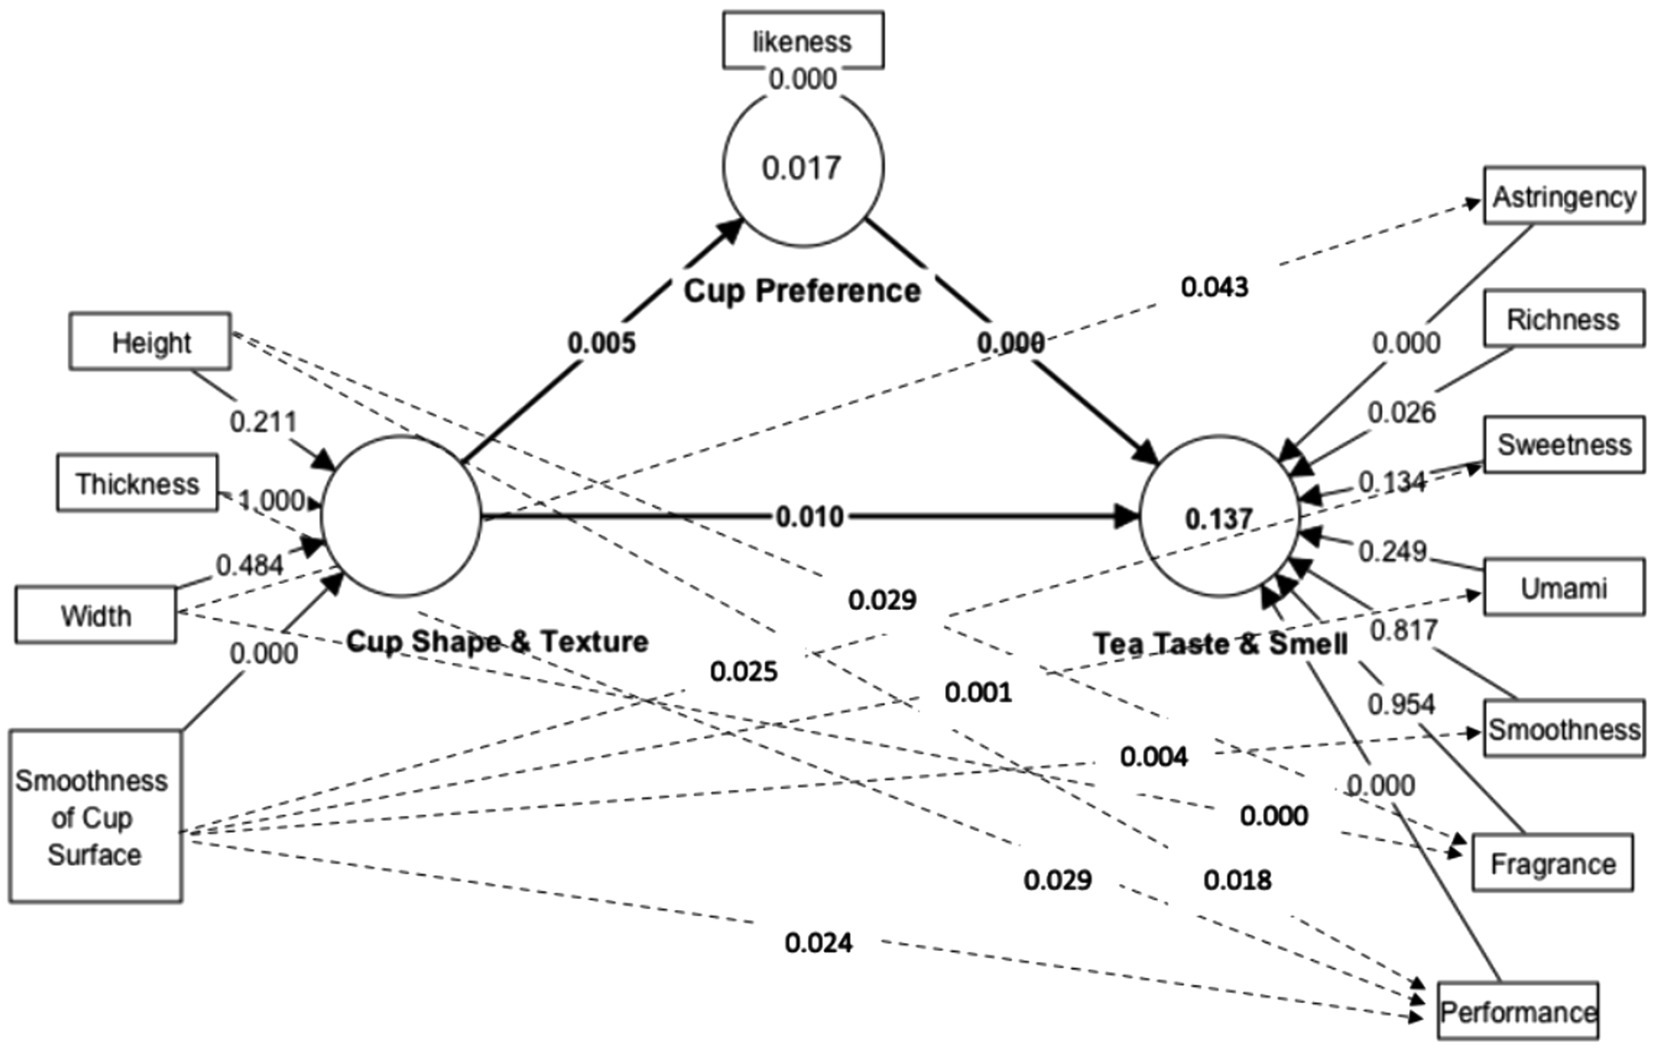
Figure 3. Findings.
From the results of Pearson’s product coefficient correlation and PLS-SEM, it was found that the visual shape and the hand-touch feelings of the teacup had influences on the preference of teacup, as well as the taste and smell of the tea. At the same time, the preference of teacups also affects the taste and smell of the tea. Figure 3 showed that the teacup preference is the independent variable which influences the tea taste perception while the shape and texture influence the perception of tea taste. The preference of teacup plays an intermediary effect (as presented in Figure 1) between tea taste and the shape and texture of the teacup. So, the hypotheses H1 to H6 were valid. Both external information of the shape and texture of teacup and internal information of the teacup preference had influences on the perception of tea taste.
Visually, the width, height, and thickness of the rim of the teacup affect the taste, fragrance and overall performance of the tea. Relevant literature (Van Doorn et al., 2017; Cliceri et al., 2018; Yang et al., 2019; Yang and Peng, 2021) showed that the flavor of coffee, beverages and tea is related to the height of the vessel. A higher height of the teacup means that the color of the tea will be darker. The cross-modal correspondence between vision and taste may affect the intensity of the tea. Therefore, the results of integrating the diameter width, height of the teacup and the thickness of the teacup rim affecting the taste, fragrance and overall performance of the tea are consistent with the research of Van Doorn et al. (2017), which involved “cup diameter,” “cup height” and “cup thickness” with coffee flavor expectations.
Van Doorn et al. (2017) found that “cup diameter” and “cup height” can affect the aroma, bitterness, intensity and sweetness of coffee, but “cup thickness” only affects the temperature of coffee. However, this present study found that “teacup thickness” had impact on the flavor of tea. Normally, cups with a thick rim are also thicker on the overall cup shape. Although there is a significant difference in size between Chinese teacups and western coffee cups, the thickness of the Chinese teacup has a thermal insulation effect on maintaining the temperature of the tea as well as better expressing the taste, fragrance and overall performance of Chinese tea.
In this study, it was concluded that the width, height, the rim thickness and the smoothness surface of the teacup do have impacts on the performance of the tea. Chinese tea is always served hot. The standard procedure of drinking Chinese tea is to observe the color of the tea first, then smell the aroma of the tea, and taste the tea last. Therefore, Table 7 showed that cup A with a thick mouth and cup B with a wide mouth performed better in the umami, sweetness, smoothness and fragrance of tea taste. For a consumer, the high cup D may be difficult to observe the color of the tea and smell it unfavorably, but the shape of cup D is more likeable and has better overall performance of tea taste. The visual system preattentively extracts pattern features might help to predict the haptic qualities of surfaces, such as grain size, density, or regularity (see Di Stefano and Spence, 2022, for a multisensory review on roughness). Therefore, cup F, with a deep and protruding ventral surface, appears as visually rough and performed better on astringency and richness taste of tea in line with the findings of Carvalho et al. (2020). Carvalho et al. found that rough coffee cups enhanced professional subjects’ perception of the original sour taste of specialty coffee. It can be inferred that participants drank tea with a teacup having a non-smooth surface, the sensory transfer intensified the astringent taste of the tea, resulting in a strong irritation due to the intensity of the taste of tea in Chinese tea products sometimes being interpreted as a strong taste or astringency (Tea Industry Improvement Center of the Council of Agriculture, Executive Yuan, 2001). Therefore, cup F with a smooth, protruding surface and deep body has an amplifying and strengthening effect on other taste sensations of the tea due to sensory transfer, such as the astringency and richness of taste.
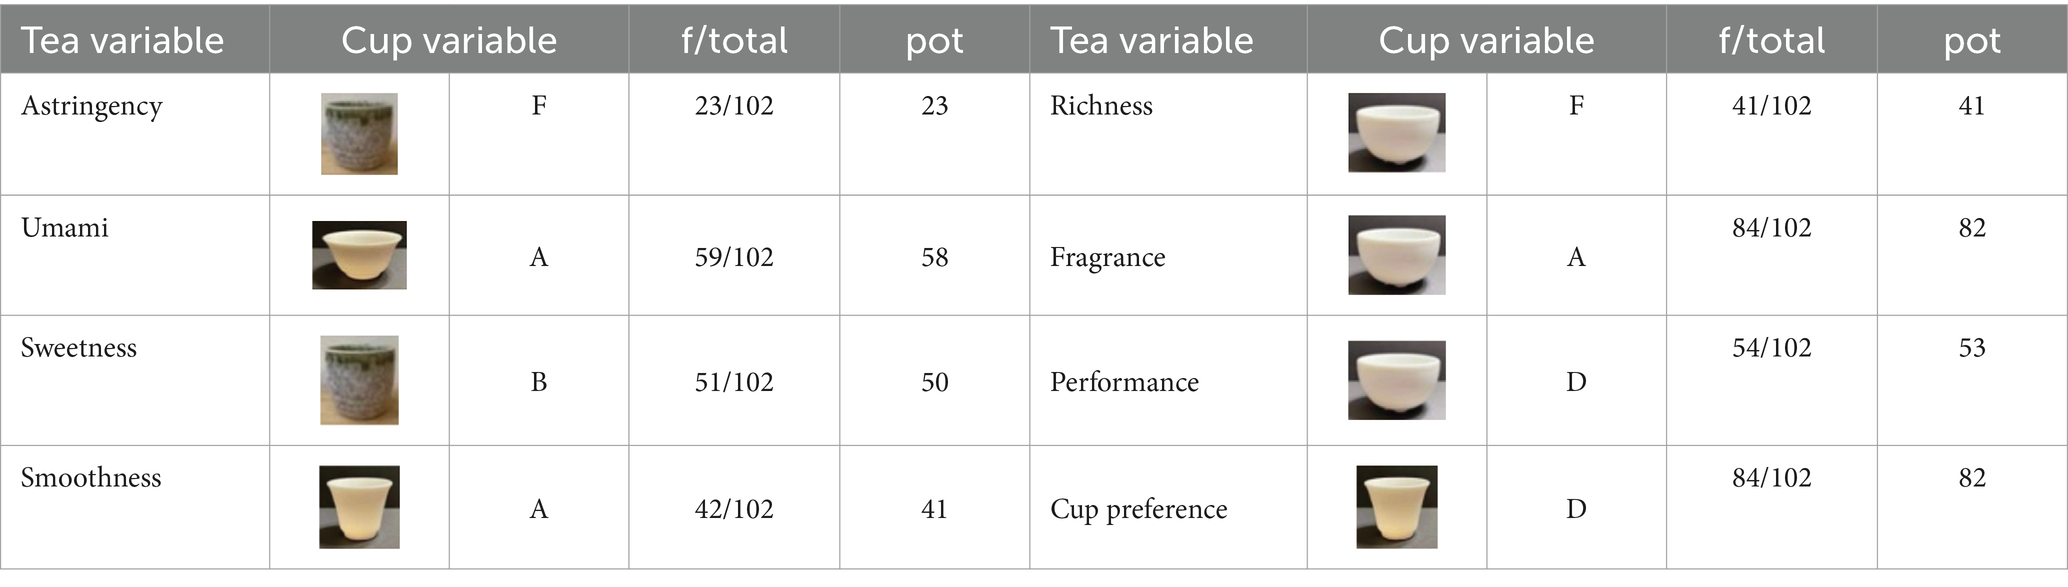
Table 7. The percentage of measurement results of (A–E) teacup and tea performance by the subject.
Results of this study showed that hypotheses 1 to 6 were valid, demonstrating the height, width, thickness and smoothness of the teacups had effects on the flavor of the tea perception, the shape and texture of teacup influenced the preference of teacup, and the preference of teacup had an effect on the flavor of the tea perception. It showed that the teacup preference is the independent variable which influences the tea taste perception while the shape and texture influence the tea taste perception. Teacup preference played an intermediary effect (as presented in Figure 1) between tea taste and the shape and texture of teacup. In other words, that is in line with prior studies that consumers’ emotions might effect taste perception (Noel and Dando, 2015; Carvalho et al., 2020; Zushi et al., 2023). Therefore, both external information regarding the shape and texture of teacup and internal information of the teacup preference influenced the perception of tea taste.
Since the shape and texture of the teacup affects the preference and the perception of tea taste, the research results are of strong commercial value. From a marketing perspective, it suggests considering choosing appropriate teacups for specific consumers to increase the sales of tea. Combing the results of age and gender factors, male subjects have significantly stronger feelings about the astringency and richness of tea than female subjects. Therefore, for general female consumers, a narrow mouth and deep body and a smooth pattern on the surface of teacup, like cup F, is recommended because this kind of teacup can enable ordinary female consumers to increase the astringency and richness of the tea during the tea tasting process. For younger consumers, who have a weaker sense of the umami, sweetness and smoothness of the tea taste, it is suggested to choose a wide mouth cup (like cup A) or a wide mouth with shallow body (like cup B) to increase the freshness, sweetness and smoothness of the taste of the tea.
There are a variety of teas, each with their own unique characteristics. Moreover, tea is a subjective drink, and preferences vary from person to person. Therefore, the findings of this study can provide tea sellers, tea manufacturers or tea consumers with a basis for choice when brewing tea. According to different tea characteristics or different consumers’ preferences, these findings can provide suggestions for choosing a suitable teacup to appropriately express the characteristics of the tea.
The original contributions presented in the study are included in the article/supplementary material, further inquiries can be directed to the corresponding author.
This study used the National Taiwan Normal University Research Ethics Review Board's self-assessment system for project supervisors. This study uses the physiological and psychological reaction data of the subjects during the tea drinking process to obtain, investigate, and analyze, but does not involve the use of human specimens for biological behavior, physiology, psychology, genetics, medicine, etc. research. The subjects of this study are all adults, and the subjects are not interns, aboriginals, pregnant women, people with physical or mental disabilities, or mentally ill people. All subjects accepted the test freely and without coercion. And this research conforms to "a non-named, non-interactive and non-invasive research conducted in a public place, and no specific individual can be identified from the information collected", "the use of information that has been legally disclosed to the public, and the use of the information complies with its disclosure "well-known purpose" and "the research project is of the lowest risk, and the risk to the research subjects is no higher than that of people who do not participate in the research." Therefore, according to the regulations of the Department of Health Medical No. 1010265075, it is exempted from the ethics review committee after evaluation.
S-CY: Writing – review & editing, Writing – original draft, Investigation, Data curation, Conceptualization. L-CH: Writing – review & editing, Data curation, Conceptualization.
The author(s) declare that financial support was received for the research, authorship, and/or publication of this article. This research was funded by Fujian Provincial Social Science Fund Achievements Project (grant numbers: FJ2022T015 and FJ2024B160) and Sanming University National Fund Cultivation Program Project (grant number: PYS2206). Sanming University’s Scientific Research Start-Up Funds for the Introduction of High-Level Scholars (grant number: 19YG13S).
The authors declare that the research was conducted in the absence of any commercial or financial relationships that could be construed as a potential conflict of interest.
All claims expressed in this article are solely those of the authors and do not necessarily represent those of their affiliated organizations, or those of the publisher, the editors and the reviewers. Any product that may be evaluated in this article, or claim that may be made by its manufacturer, is not guaranteed or endorsed by the publisher.
Carvalho, F. M., Moksunova, V., and Spence, C. (2020). Cup texture influences taste and tactile judgments in the evaluation of specialty coffee. Food Qual. Prefer. 81:103841. doi: 10.1016/j.foodqual.2019.103841
Cavazana, A., Larsson, M., Hoffmann, E., Hummel, T., and Haehner, A. (2017). The vessel’s shape influences the smell and taste of cola. Food Qual. Prefer. 59, 8–13. doi: 10.1016/j.foodqual.2017.01.014
China Association for the Promotion of International Agricultural Cooperation (2022). Available at: https://mp.weixin.qq.com/s?__biz=MzI1NTE1MDQ3OA==&mid=2652287840&idx=4&sn=cbf6a05510fe6308ace6d58c2e815701&chksm=f1d84381c6afca9731887fc96469757b1ee8115aace209c4a4117e52ab322759aeed6bb81ece&scene=27. (Accessed January 31, 2024).
Cliceri, D., Petit, E., Garrel, C., Monteleone, E., and Giboreau, A. (2018). Effect of glass shape on subjective and behavioral consumer responses in a rea-life context of drinking consumption. Food Qual. Prefer. 64, 187–191. doi: 10.1016/j.foodqual.2017.09.008
Cliff, M. A. (2001). Influence of wine glass shape on perceived aroma and colour intensity in wines. J. Wine Res. 12, 39–46. doi: 10.1080/09571260120069741
Delwiche, J. F. (2012). You eat with your eyes first. Physiol. Behav. 107, 502–504. doi: 10.1016/j.physbeh.2012.07.007
Delwiche, J. F., and Pelchat, M. L. (2002). Influence of glass shape on the perception of wine aroma. J. Sens. Stud. 17, 19–28. doi: 10.1111/j.1745-459X.2002.tb00329.x
Di Stefano, N., and Spence, C. (2022). Roughness perception: a multisensory/crossmodal perspective. Atten. Percept. Psychophysiol. 84, 2087–2114. doi: 10.3758/s13414-022-02550-y
Guéguen, N., and Jacob, C. (2012). Coffee cup color and evaluation of a beverage’s warmth quality. Color. Res. Appl. 39, 79–81. doi: 10.1002/col.21757
Hogenkamp, P. S., Stafleu, A., Mars, M., Brunstrom, J. M., and De Graaf, C. (2011). Texture, not flavor, determines expected satiation of dairy products. Appetite 57, 635–641. doi: 10.1016/j.appet.2011.08.008
Joshi, K.. (2023). Tea Statistics – By Country, Region, Type, Demographic, Consumption, Revenue in the US, Sales Channel. Available at: https://www.enterpriseappstoday.com/stats/tea-statistics.html
Kreifeldt, J. (2013). Some thoughts on haptic aesthetics for design transmodal aesthetics. Paper presented at the human-computer interaction international conference, theme: Cross-cultural design. Methods, practice, and case studies, Las Vegas, USA.
Li, X., Qi, Y., Spence, C., and Wan, X. (2020). Influence of teaware on subjective ratings of, and taste expectations concerning, tea. Food Qual. Prefer. 80:10383. doi: 10.1016/j.foodqual.2019.103834
Liang, P., Jiang, J. Y., Liu, Q., Zhang, S. L., and Yang, H. J. (2020). Mechanism of cross-modal information influencing taste. Curr. Med. Sci. 40, 474–479. doi: 10.1007/s11596-020-2206-0
Madden, T. J., Hewett, K., and Roth, M. S. (2000). Managing images in different cultures: a cross-national study of color meanings and preferences. J. Int. Mark. 8, 90–107. doi: 10.1509/jimk.8.4.90.19795
Mielby, L. H., Kildegaard, H., Gabrielsen, G., Edelenbos, M., and Thybo, A. K. (2012). Adolescent and adult visual preferences for pictures of fruit and vegetable mixes – effect of complexity. Food Qual. Prefer. 26, 188–195. doi: 10.1016/j.foodqual.2012.04.014
Noel, C., and Dando, R. (2015). The effect of emotional state on taste perception. Appetite 95, 89–95. doi: 10.1016/j.appet.2015.06.003
Peng, L. H., and Yang, S. C.. (2017). “Investigation into the relationship between cup shape and tea test.” in Proceedings of the 2017 international conference on applied system innovation. Sapporo, Japan.
Piqueras-Fiszman, B., Giboreau, A., and Spence, C. (2013). Assessing the influence of the color of the plate on the perception of a complex food in a restaurant setting. Flavour 2:24. doi: 10.1186/2044-7248-2-24
Piqueras-Fiszman, B., Velasco, C., and Spence, C. (2012). Exploring implicit and explicit cross modal colour-flavour correspondences in product packaging. Food Qual. Prefer. 25, 148–155. doi: 10.1016/j.foodqual.2012.02.010
Reinoso-Carvalho, F., Dakduk, S., Wagemans, J., and Spence, C. (2019). Not just another pint! The role of emotion induced by music on the consumer’s tasting experience. Multisens. Res. 32, 367–400. doi: 10.1163/22134808-20191374
Reinoso-Carvalho, F., Gunn, L. H., Horst, E. T., and Spence, C. (2020). Blending emotions and cross-modality in sonic seasoning: towards greater applicability in the design of multisensory food experiences. Foods (Basel, Switzerland) 9:1876. doi: 10.3390/foods9121876
Risso, P., Maggioni, E., Etzi, R., and Gallace, A. (2019). The effect of the tactile attributes of a container on mineral water perception. Beverages 5:23. doi: 10.3390/beverages5010023
Risso, P., Maggiono, E., Olivero, N., and Gallace, A. (2015). The association between the colour of a container and the liquid inside: an experimental study on consumers’ perception, expectations and choices regarding mineral water. Food Qual. Prefer. 44, 17–25. doi: 10.1016/j.foodqual.2015.03.010
Russell, K., Zivanovic, S., Morris, W. C., Penfield, M., and Weiss, J. (2005). The effect of glass shape. On the concentration of polyphenolic compounds and perception of merlot wine. J. Food Qual. 28, 377–385. doi: 10.1111/j.1745-4557.2005.00041.x
Schifferstein, H. N. J. (2009). The drinking experience: cup or content? Food Qual. Prefer. 20, 268–276. doi: 10.1016/j.foodqual.2008.11.003
Shepherd, G. M. (2006). Smell images and the flavour system in the human brain. Nature 444, 316–321. doi: 10.1038/nature05405
Small, D. M., Voss, J., Mak, Y. E., Simmons, K. B., Parrish, T. B., and Gitelman, D. R. (2004). Experience-dependent neural integration of taste and smell in the human brain. Neurophysiology 92, 1892–1903. doi: 10.1152/jn.00050.2004
Spence, C. (2017). Gastrophysics: the new science of eating. Viking, Penguin Random House: London, UK.
Spence, C., and Piqueras-Fiszman, B. (2014). The perfect meal: The multisensory science of food and dining. Chichester, UK: John Wiley & Sons, Ltd.
Spence, C., and Wan, X. (2015). Beverage perception and consumption: the influence of the container on the perception of the contents. Food Qual. Prefer. 39, 131–140. doi: 10.1016/j.foodqual.2014.07.007
Spence, C., and Wan, X. (2016). “Assessing the influence of the drinking receptacle on the perception of the contents” in Multisensory flavor perception: From fundamental neuroscience through to the marketplace. eds. B. Piqueras-Fiszman and C. Spence (Woodhead Publishing: Woodhead Publishing Series in Food Science, Technology and Nutrition), 269–295.
Stewart, P. C., and Goss, E. (2013). Plate shape and colour interact to influence taste and quality judgements. Flavour 2:27. doi: 10.1186/2044-7248-2-27
Tu, Y., Yang, Z., and Ma, C. (2015). Touching tastes: the haptic perception transfer of liquid food packaging materials. Food Qual. Prefer. 39, 124–130. doi: 10.1016/j.foodqual.2014.07.001
Van Doorn, G. H., Woods, A., Levitan, C. A., Wan, X., Velasco, C., Bernal-Torres, C., et al. (2017). Does the shape of a cup influence coffee taste expectations? A cross-Cultural,on-line study. Food Qual. Prefer. 56, 201–211. doi: 10.1016/j.foodqual.2016.10.013
Van Doorn, G. H., Wuillemin, D., and Spence, C. (2014). Does the colour of the mug influence the taste of the coffee? Flavour 3:10. doi: 10.1186/2044-7248-3-10
Van Rompay, T. J. L., Finger, F., Saakes, D., and Fenko, A. (2017). “See me, feel me”: effects of 3D-printed surface patterns on beverage evaluation. Food Qual. Prefer. 62, 332–339. doi: 10.1016/j.foodqual.2016.12.002
Vilanova, M., Vidal, P., and Cortés, S. (2008). Effect of the glass shape on flavor perception of “toasted wine” from Ribeiro (NW Spain). J. Sens. Stud. 23, 114–124. doi: 10.1111/j.1745-459X.2007.00145.x
Wan, X., Velasco, C., Michel, C., Mu, B., Woods, A. T., and Spence, C. (2014). Does the type of receptacle influence the crossmodal association between colour and flavour? A cross-cultural comparison. Flavour 3:3. doi: 10.1186/2044-7248-3-3
Wan, X., Wood, A., Seoul, K.-H., Butcher, N., and Spence, C. (2015). When the shape of the glass influences the flavour associated with a coloured beverage: evidence from consumers in three countries. Food Qual. Prefer. 39, 109–116. doi: 10.1016/j.foodqual.2014.07.004
Wang, Q. J., and Spence, C. (2016). Striking a sour note’: assessing the influence of consonant and dissonant music on taste perception. Multisens. Res. 29, 195–208. doi: 10.1163/22134808-00002505
Wang, Q. J., and Spence, C. (2018). A smooth wine? Haptic influences on wine evaluation. Int. J. Gastron. Food Sci. 14, 9–13. doi: 10.1016/j.ijgfs.2018.08.002
Woods, A. T., Poliakoff, E., Lloyd, D. M., Kuenzel, J., Hodson, R., Gonda, H., et al. (2011). Effect of background noise on food perception. Food Qual. Prefer. 22, 42–47. doi: 10.1016/j.foodqual.2010.07.003
Wu, M. L. (2013). Questionnaire statistical analysis practice - SPSS operation and application. Chongqing: Chongqing University Press.
Yang, S. C., and Peng, L. H. (2021). Preliminary research into the sustainable responsibility of teaware design- a fs/QCA analysis of the influence of the smell and taste of tea through visual and tactile perception. Sustain. For. 13:8884. doi: 10.3390/su13168884
Yang, S. C., Peng, L. H., and Hsu, L. C. (2019). The influence of teacup shape on the cognitive perception of tea, and the sustainability calue of the aesthetic and practical design of a teacup. Sustain. For. 11:6895. doi: 10.3390/su11246895
Zellner, D. A., Lankford, M., Ambrose, L., and Locher, P. (2010). Art on the plate: effect of balance and color on attractiveness of, willingness to try and liking for food. Food Qual. Prefer. 21, 575–578. doi: 10.1016/j.foodqual.2010.02.007
Zellner, D. A., Siemers, E., Teran, V., Conroy, R., Lankford, M., Agrafiotis, A., et al. (2011). Neatness counts. How plating affects liking for the taste of food. Appetite 57, 642–648. doi: 10.1016/j.appet.2011.08.004
Zhou, Y., and Tse, C.-S. (2020). The taste of emotion: metaphoric association between taste words and emotion/ emotion-laden words. Front. Psychol. 11:986. doi: 10.3389/fpsyg.2020.00986
Keywords: tea culture, visual, tactile, tea perception, intermediary effect
Citation: Yang S-C and Hsu L-C (2024) Is the tea or teacup good? The effect of visual and haptic sensory processing of teacups on the perception of tea flavor. Front. Psychol. 15:1427665. doi: 10.3389/fpsyg.2024.1427665
Edited by:
Branka Spehar, University of New South Wales, AustraliaReviewed by:
Nicola Di Stefano, National Research Council (CNR), ItalyCopyright © 2024 Yang and Hsu. This is an open-access article distributed under the terms of the Creative Commons Attribution License (CC BY). The use, distribution or reproduction in other forums is permitted, provided the original author(s) and the copyright owner(s) are credited and that the original publication in this journal is cited, in accordance with accepted academic practice. No use, distribution or reproduction is permitted which does not comply with these terms.
*Correspondence: Li-Chieh Hsu, MjAxODAyMjVAZmpzdW0uZWR1LmNu
Disclaimer: All claims expressed in this article are solely those of the authors and do not necessarily represent those of their affiliated organizations, or those of the publisher, the editors and the reviewers. Any product that may be evaluated in this article or claim that may be made by its manufacturer is not guaranteed or endorsed by the publisher.
Research integrity at Frontiers
Learn more about the work of our research integrity team to safeguard the quality of each article we publish.