 Laszlo Fekete1†
 Laszlo Barna Iantovics
 Gyula Laszlo Fekete
94% of researchers rate our articles as excellent or good
Learn more about the work of our research integrity team to safeguard the quality of each article we publish.
Find out more
ORIGINAL RESEARCH article
Front. Psychol. , 30 May 2024
Sec. Quantitative Psychology and Measurement
Volume 15 - 2024 | https://doi.org/10.3389/fpsyg.2024.1333723
According to many studies, vitiligo has a negative psychological influence on the patient's life. Multiple factors contribute to the severity of the vitiligo disease burden, among which the most important are self-esteem, stress, and stigma. We aimed to measure the importance of health-related life quality in assessing disease burden in patients with vitiligo. We formulated an HA, which is the principal hypothesis, claiming a single fundamental factor that characterizes the life quality of patients with vitiligo. We also formulated 10 important research questions related to the quality of life that can be generally formulated for patients with dermatological illnesses but particularly suited for vitiligo patients. These research questions capture fundamental aspects of the health-related quality of life of vitiligo patients influenced by symptoms and feelings, daily activities, leisure, job and education, personal relationships, and treatment. These also cover specific aspects related to the quality of life, such as skin-caused sexual difficulties, difficulties in social relationships, and difficulties in performing sports, among others. The Dermatology Life Quality Index (DLQI) questionnaire measures the health-related quality of life of persons suffering from skin diseases. We applied this generic questionnaire to patients with vitiligo. Following a set of inclusion and exclusion criteria, we obtained 114 carefully selected patients who responded to all the questions. This study also validated the DLQI questionnaire on persons who suffer from vitiligo. We investigated whether DLQI has acceptable internal consistency by applying Cronbach's alpha internal consistency indicator (Cα). The obtained Cα = 0.914 indicates excellent internal consistency. We also examined whether all the questions in the questionnaire were mathematically consistent, which we finally proved. It was not necessary to remove any of the questionnaire questions. To prove our HA, a Principal Axis Factoring (PAF) was applied, verifying the assumptions regarding the Average Variance Extracted (AVE) and Convergent Validity (CV). HA proved that applying PAF on DLQI resulted in extracting a single general vitiligo latent factor of life quality, with an initial eigenvalue = 5.671, SS loadings = 5.2, and 52 % of the total cumulative variance explained. Diverse statistical analyses were applied to analyze the 10 formulated research questions. The results of the analysis of the research questions are presented and discussed in the manuscript. One of the conclusions related to the analysis of a research question was that sex had the lowest correlation with the latent life quality factor identified for vitiligo patients.
Vitiligo is the most commonly acquired complex disorder of pigmentation, with a prevalence of ~1% in the world population (Ezzedine et al., 2015; Ye et al., 2022; Yu et al., 2022). It is characterized by well-circumscribed depigmented macules and patches that result from a progressive loss of functional melanocytes. Yang et al. (2021) studied the morphological alterations and increased S100B expression in epidermal Langerhans cells detected in the skin of patients who suffer from progressive vitiligo. Aguilera-Durán and Romo-Mancillas (2021) studied the behavior of chemokine receptor 6 (CXCR6) complex with CXCL16 soluble form chemokine by molecular dynamic simulations (Bhuptani et al., 2020). Factors that contribute to the severity of the vitiligo disease burden are multiple, among which the most important are quality of life, self-esteem, stress, and stigma. In the context of health and illness, quality of life is a multidimensional concept that addresses wellbeing and satisfaction with how health is affected, including emotional state, physical functioning, and social wellbeing (Simons et al., 2020). These aspects affect the patient's judgment of how the disease affects their life and the impact of the disease on their professional and personal goals (Divyesh, 2017; Elbuluk and Ezzedine, 2017). The impact of this disease on the patient's quality of life has been compared with serious pathologies, such as malignant diseases, hypertension, diabetes, and other diseases (Rapp et al., 1999; Tatu et al., 2022). Some autoimmune diseases associated with vitiligo can also impact the quality of life (Brǎnişteanu et al., 2017). One study (Brihan et al., 2020) investigated the implications of self-esteem in the quality of life of patients with psoriasis. Another (Stanescu et al., 2020) studied the extreme situations of assessment of suicidal behavior in dermatology. While one research (Arabkermani et al., 2022) studied the development of a minimum data set required to create a registry system for patients with vitiligo, another (Raimondi et al., 2023) presented a network analysis study of the life quality levels of Hidradenitis Suppurativa severity, and yet another (Clarke et al., 2022) studied the effect of self-compassion in adjusting skin conditions.
Various tools have been developed to measure the quality of life by focusing on different conditions and diseases. The Dermatology Life Quality Index (DLQI) questionnaire is designed for patients over 16 years of age (Finlay and Khan, 1994). It can be used to measure the impact of many dermatological diseases on quality of life (Ingordo et al., 2011). The DLQI questionnaire has been successfully used in many countries to study skin disease and the influence of the disease on quality of life. For instance, in a previous study (Ferraz et al., 2006), the Brazilian–Portuguese version of DLQI was used to study the impact of Lupus Erythematosus Cutaneous on the quality of life. One study (Bali et al., 2018) used the DLQI questionnaire to study the association between quality of life and clinical characteristics in patients with morphea. Another study (Rencz et al., 2022) used it to measure the properties of the ICECAP, a capability wellbeing instrument among dermatological patients.
The DLQI questionnaire is self-explanatory and can be simply handed to the patients without the need for detailed explanations. It has been translated worldwide and extensively applied.
The health status and health-related quality of life of patients with vitiligo in Romania and worldwide are understudied. We performed a study on health-related quality of life in a cohort of patients suffering from vitiligo, using the DLQI questionnaire to assess the disease burden. One of our aims was to perform a validation study of the DLQI questionnaire responses on persons who suffer from vitiligo to prove that it has appropriate internal consistency and that all the questions included in the questionnaire were internally consistent. It was not necessarily aimed at removing any of them. We used Exploratory Axis Factoring (EAF), a method of Exploratory Factor Analysis (EFA). We also formulated and analyzed 10 research questions related to the principal aspects of the life quality of vitiligo patients, including the following classes: symptoms and feelings, daily activities, leisure, job and education, personal relationships, and treatment. At the same time, this study can be considered a guide for the correct application of EAF and interpretation of the results; EAF involves many assumptions that researchers frequently fail to verify. A difficult aspect of EFA is establishing the number of factors to be extracted. In a previous study (Iantovics et al., 2019), we offered a comprehensive overview of the current state regarding the decision on the number of factors to be extracted. We presented a solution for establishing the number of factors that must be extracted. The proposal consisted of considering the total cumulative variances explained by the factors that must reach a certain value, which also depends on the specificity of the research. The decision rule used in this study is based on our previous work (Iantovics et al., 2019), which is also being presented as a validation method. We (Dobai et al., 2022) used the decision rule proposed earlier (Iantovics et al., 2019) and applied EFA to study cardiac implantable electronic devices of patients during the COVID-19 pandemic in Europe.
Patients diagnosed with vitiligo from outpatient offices and the outpatient department of the Dermatology Clinic from Târgu Mureş participated in the study, following the inclusion and exclusion criteria. The study period was between March 2021 and March 2022. Inclusion criteria: patients over 18 years of age, confirmed with vitiligo of any form, and who sign the informed consent form. Exclusion criteria: patients under 18 years of age, confirmed with vitiligo of any form, and those who do not sign the informed consent. Further, cases with missing responses to one or more questions were excluded. To carry out the study, the approval of the Ethics Commission of the Faculty of Medicine was obtained with no. 1255/2021, and that of the Mureş County Clinical Hospital with no. 16501/2021. Patients completed the DLQI (Cho, 2016) questionnaire. The questionnaire contained 10 questions, each with 4 or 5 answer options.
DLQI intends to assess the quality-of-life impairment of adult patients (aged ≥ 16 years) in the preceding week. It has 10 items covering the following six aspects of health-related quality of life: symptoms and feelings (questions 1, 2), daily activities (Q.3, 4), leisure (Q. 5, 6), work/school (Q.7), personal relationships (Q. 8, 9), and treatment (Q. 10). Each item is answered on a 4-point scale scored as follows: “not at all” = 0, “a little” = 1, “a lot” = 2, and “very much” = 3. Not relevant response (NRR) options are available for items 3–10. Item scores are added up to give a minimum score of 0 and a maximum score of 30, where a higher DLQI total score indicates a greater degree of health-related quality-of-life impairment. The Romanian version of the paper-based DLQI was used in the surveys.
The questionnaire was paper- and pencil-based, with unlimited time. At the same time, the complete dermatological clinical examination was performed voluntarily by experienced dermatologists involved. All patients signed the informed consent form. The data collected from the questionnaires and the clinical examination were entered into Excel worksheets. The data was encoded in compliance with the General Data Protection Regulation (GDPR).
In this section we introduce the 10 research questions, RQ = {RQ1, RQ2, RQ3, RQ4, RQ5, RQ6, RQ7, RQ8, RQ9, RQ10}, that were studied. Some questions are generally applicable to people with skin diseases. Based on this fact, we found them formulated in a certain way in the DLQI questionnaire. The motivations for their appropriateness for vitiligo patients are discussed. Finally, we analyze these research questions for vitiligo patients based on the survey questionnaire responses that we collected.
Itchy, sore, painful, or stinging skin symptoms are present in almost all patients with vitiligo and can negatively influence their quality of life in their daily lives. Yang et al. (2022) highlighted this issue in their work.
Based on our bibliographic and observational study, the following research questions were formulated.
RQ1. For vitiligo patients, itchy, sore, painful, and stinging of the skin negatively influences their quality of life.
For responding to RQ1, we will analyze the result of Q1 from the DLQI questionnaire.
Q1. Over the last week, how itchy, sore, painful, or stinging has your skin been?
Patients with vitiligo constantly experience embarrassment and self-consciousness, especially among younger age groups. This could decrease with the chronicity of the disease, as concluded in an article by Dev et al. (2022).
RQ2. Vitiligo increases embarrassment or self-consciousness
For responding to RQ2, we will analyze the result of Q2 from the DLQI questionnaire.
Q2. Over the last week, how embarrassed or self-conscious have you been because of your skin?
Shopping or undertaking regular activities at home can be challenged by this disease due to its visibility. It could seriously impact the person's quality of life, as Elbuluk and Ezzedine (2017) determined in their study.
RQ3. Vitiligo has a negative influence on going shopping or doing usual activities at home or in the garden.
For responding to RQ3, we will analyze the result of Q3 from the DLQI questionnaire.
Q3. Over the last week, how much has your skin interfered with you going shopping or looking after your home or garden?
Camouflaging the disease condition by wearing appropriate clothes is important for these patients. It can increase the quality of their life worldwide, especially in some parts of the world, such as Al-Shammari et al. (2021) mentioned in a paper.
RQ4. Vitiligo influences the choice of clothes that a person wears
For responding to RQ4, we will analyze the result of Q4 from the DLQI questionnaire.
Q4. Over the last week, how much has your skin influenced the clothes you wear?
According to Picardo et al. (2022), social and recreational activities may be disturbed and have a negative impact due to disease-related stigma in young patients with a recently diagnosed condition.
RQ5. Vitiligo negatively influences social or leisure activities
For responding to RQ5, we will study the result of Q5 from the DLQI questionnaire.
Q5. Over the last week, how much has your skin affected any social or leisure activities?
Engaging in sports activities may be limited in persons with vitiligo wearing camouflage clothes because it is embarrassing for them. In time, these patients will refrain from sports activities altogether, diminishing their quality of life, as suggested by Bhandarkar and Kundu (2012).
RQ6. Vitiligo negatively influences playing sports
For responding to RQ6, we will analyze the result of Q6 from the DLQI questionnaire.
Q6. Over the last week, how much has your skin made it difficult for you to do any sport?
In general, working or study activities do not influence the quality of life, except for those with the visible form of the disease, as concluded by Peralta-Pedrero et al. (2022).
RQ7. Vitiligo has a negative influence on working or studying
For responding to RQ7, we will analyze the result of Q7 from the DLQI questionnaire.
Q7. Has your skin prevented you from working or studying over the last week? If “No,” how much has your skin been a problem at work or studying?
At the beginning stages of the disease, a severe negative influence on the quality of life can appear in social relations, which in time will decrease, especially with partners and close friends, as highlighted by Alikhan et al. (2011).
Based on the bibliographic study and the observational study that we performed, the following research question can be formulated.
RQ8. Vitiligo creates social problems with the partner, friends, or relatives.
For responding to RQ8, we will study the result of Q8 from the DLQI questionnaire.
Q8. Over the last week, how much has your skin created problems with your partner or any of your close friends or relatives?
Usually, sexual activities are not influenced by the disease in the case of married people. However, for those who would like to establish a new relationship, this issue could be a problem, as described by Bibeau et al. (2022).
RQ9. Vitiligo can cause sexual difficulties
For responding to RQ9, we will study the result of Q9 from the DLQI questionnaire.
Q9. Over the last week, how much has your skin caused sexual difficulties?
On patients with chronic dermatoses, such as vitiligo, local treatment difficulties do not have a severe impact on quality of life, as concluded by Cortés et al. (2022).
RQ10. Vitiligo has a negative influence on making the home messy or taking up time
For responding to RQ10, we will study the result of Q10 from the DLQI questionnaire.
Q10. Over the last week, how much of a problem has the treatment for your skin been, for example, by making your home messy or by taking up time?
Table 1 presents the interpretation of the internal consistency that we calculated using the Cronbach alpha (Cα) (Cho, 2016) reliability indicator. For additional validation, we used the McDonald's Omega coefficient value (ω) = 0.915 (McDonald, 1999).
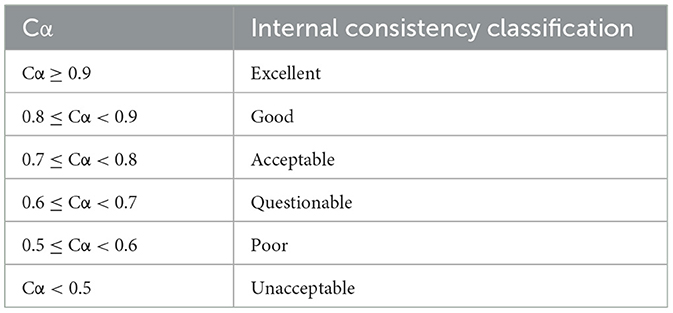
Table 1. Internal consistency interpretation.
Initially, a statistical scale Cα reliability analysis was performed on the questionnaire outcomes. The data normality assumption of the variables was realized using the Lilliefors (Lill) test, which is an adaptation of the Kolmogorov-Smirnov goodness-of-fit test (Dallal and Wilkinson, 1986). For visual validation of the normality analysis result, the interpretation of the Q-Q plot (Wilk and Gnanadesikan, 1968) visual representation was performed. This was applied for each of the variables (these representations are not included in this paper). For the verification of each variable's influence on the internal consistency, we calculated the value of Cα in case each variable was removed. The correlations between each of the variables were analyzed. We applied nonparametric correlation coefficient r calculus (Stigler, 1989; Bonett and Wright, 2000). For each case/patient, the measured quality of life using the DLQI questionnaire with results retained in the variable ResultLifeQuality was calculated. On the ResultLifeQuality variable, we performed descriptive statistics and normality analysis, finally calculating the correlation of all the variables that constituted the DLQI.
Table 2 presents the usual interpretation of the Kaiser–Meyer–Olkin measure of sampling adequacy (KMO) test results that are adopted in many types of research (Hauben et al., 2017).
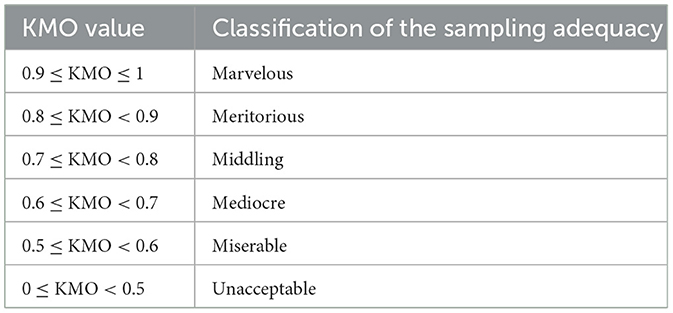
Table 2. Interpretation of Kaiser–Meyer–Olkin (KMO) measure results.
Based on the principle that a causal model exists, we performed a Principal Axis Factoring (PAF) (Prather et al., 1997; Grieder and Steiner, 2022) that can be used to determine the underlying latent factor structure of a set of variables. We analyzed that for the interpretation of the results, it is necessary to have a certain rotation in case more factors can be extracted. We verified all the necessary assumptions for the correct application of the PAF, including the value of the determinant of a correlation matrix, which should be higher than 0.0001 (Field, 2000), Kaiser–Meyer–Olkin Measure (KMO) (Hauben et al., 2017) test assumption, where KMO ≥ 0.6, Bartlett's Test of Sphericity (BTS) (Hauben et al., 2017) test assumption, corresponding to the p-value of BTS, where p < 0.05.
Additionally, we analyzed the anti-image matrices to see if there were candidate variables for removal (Hauben et al., 2017). We applied the decision rule that each value from the diagonal must pass the threshold by 0.6; otherwise, the corresponding variable was to be removed.
For an in-depth study, we analyzed the communalities (McDonald, 1985). Initial communalities represent the proportion of variance accounted for in each variable by the rest of the variables. Extracted communalities are estimations of the variance in each variable accounted for by the factors in the factor solution. It must be noted that the extracted communality is specific to each variable; it represents the common variance explained in each variable by the extracted factors. As a decision rule for removing a variable, we considered the extracted communality that has a value lower than or equal to 0.2.
For the precise establishment of the number of factors, we considered the decision rule based on the following combination of criteria (Choi et al., 2017; Iantovics et al., 2019):
(A) the Kaiser rule that claims the selection of only those factors that have eigenvalues ≥ 1 (Kaiser, 1960);
(B) visual interpretation of the Scree plot (Cattell, 1966) by searching for the inflation points; and
(C) considering the total cumulative variances explained by the factors we indicated in previous research (Iantovics et al., 2019).
This rule was applied and then validated using Parallel Analysis, a simulation based on the Monte Carlo method (Horn, 1965).
Finally, the Corresponding Residuals (Hauben et al., 2017) and the Reproduced Correlations (Hauben et al., 2017) were calculated. There were verified assumptions regarding the Average Variance Extracted (AVE) (Nia et al., 2020) and Convergent Validity (CDV) (Nia et al., 2020).
In this section, we share the results obtained and discuss them.
Richard et al. (2022) presented a population-based study of the prevalence of the most common skin diseases in Europe. Vitiligo is a rare condition found in 0.5%−4% of the world's population (Krüger and Schallreuter, 2012; Al-Harbi, 2013). The highest incidence has been reported in India, followed by Mexico and Japan (Sehgal and Srivastava, 2007).
The 114 patients in our study were all Caucasians (people from the Caucasus) with phototypes between I-III on the Fitzpatrick's skin type scale. Of these, 56 (49.12%, 95% CI 39.81%−58.44%) were male, and 58 (50.88%, 95% CI 41.56%−60.19 %) were female. The mean age was 49, with 95% CI [45.8, 52.3], a median of 49, between 19 and 78 years, and a range of 59. Most of the patients, 76 (66.67%), lived in urban areas, and 38 (33.33%) in rural areas. Regarding marital status, 77 (67.54%) patients were married, and 37 (32.46%) were unmarried.
Experimental setup: number of items/questions/variables = 10, denoted LQ = {LQ1, LQ2, LQ3, LQ4, LQ5, LQ6, LQ7, LQ8, LQ9, LQ10}; number of valid cases n = 114, 100%, no missing values in the questions. Cα = 0.915 indicates an excellent internal consistency, 0.915 > 0.9. Table 3 shows the results of the descriptive statistics of the LQ variables. Each variable takes a value between 0 and 4, with the significance of increasing effect with each unit increase. The rest of the columns are labeled as follows: Mean presents the mean; SD denotes the standard deviation; 95% CI of mean represents the 95% CI of the mean; Min denotes the smallest; Max denotes the largest; Range is calculated as max-min; Median denotes the median. meanLQ denotes the average of LQ, with meanLQ = 1.331
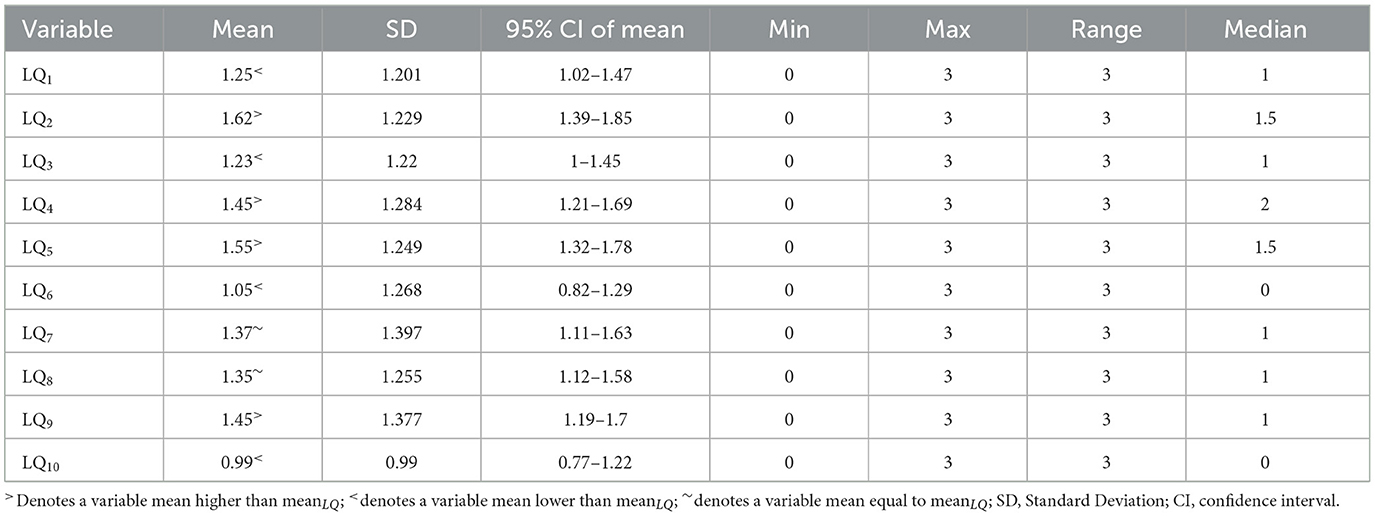
Table 3. Descriptive statistical characterization of the LQ variables.
As a next step, we studied the statistical differences between the means of the variables. First, we verified the LQ data normality using the Shapiro-Wilk test (Shapiro and Wilk, 1965) because the LQ sample size is small. The obtained p (p-value), p = 0.767 (p > 0.05), indicates that the normality assumption passed. Based on this fact, it is appropriate to apply the Grubbs (Stefansky, 1972) outlier detection (the studied LQ variable passed the expected normality). The Grubbs test has the specificity that each application can detect a single statistical outlier or a value that is not an outlier but is statistically furthest from the rest. At the first application, it detected (0.99), representing the mean of LQ10 as a value that is furthest from the rest. In the applications that followed, the Grubbs test, by removing the previously identified furthest from the rest, detected only other values that were furthest from the rest. Removing LQ10 and applying it again detected 1.05 (mean of LQ6). Removing LQ6 detected LQ2. Removing LQ2 detected LQ5. Removing LQ5 detected LQ3. Removing LQ3 detected LQ1. Removing LQ1 detected LQ8. Removing LQ8 detected LQ7. For the remaining LQ4 and LQ9, it was not possible to apply the Grubbs test since its application requires at least three values.
For the LQ1, LQ2,…..LQ10 variables normality analysis was undertaken using the Lilliefors test (Table 4). According to the results, none of the variables LQ1, LQ2,…..LQ10 passed the assumption of normality even at the 0.001 significance level (p < 0.001). For final visual validation, we used the Q-Q plot representation for each studied variable (the manuscript does not present Q-Q plot representations). The visual analysis of the normality of each variable led to the same conclusion as the numerical evaluation results.
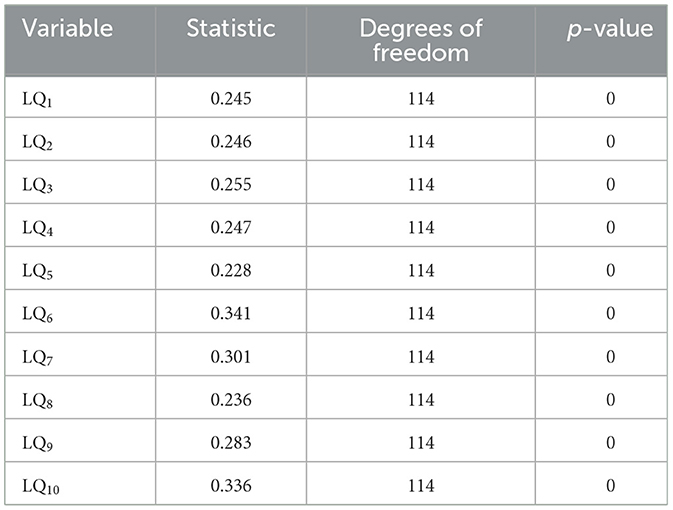
Table 4. Lilliefors test results.
To verify each variable's influence on the scale consistency, the value of Cronbach's alpha for each variable was calculated (Table 5), and the column labeled “Cronbach's Alpha if Item Removed.” The differences of these values from Cα = 0.915 show the amount of change in the reliability in case of variable deletion.
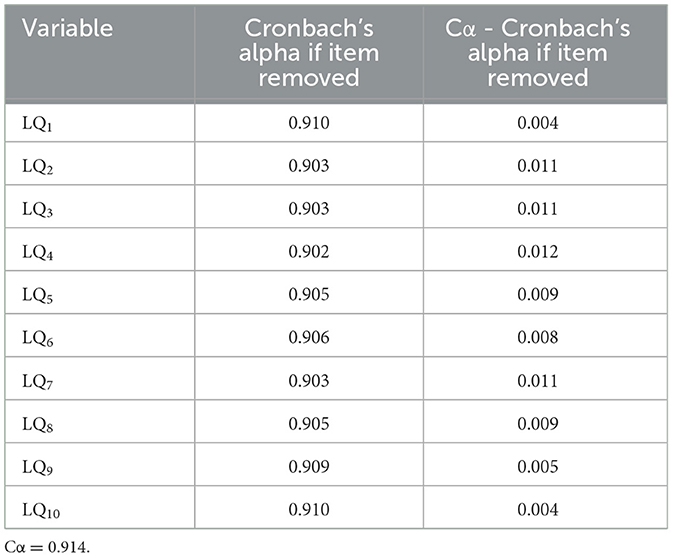
Table 5. Cronbach's alpha if an item/variable is removed.
Table 6 presents the nonparametric Spearman correlation analysis of all the LQ variables since none passed the normality assumption. r denotes the calculated Spearman correlation coefficient. All the correlations were significant at the 0.01 significance level (2-tailed). p denotes the obtained p-value based on whether the correlation is significant.
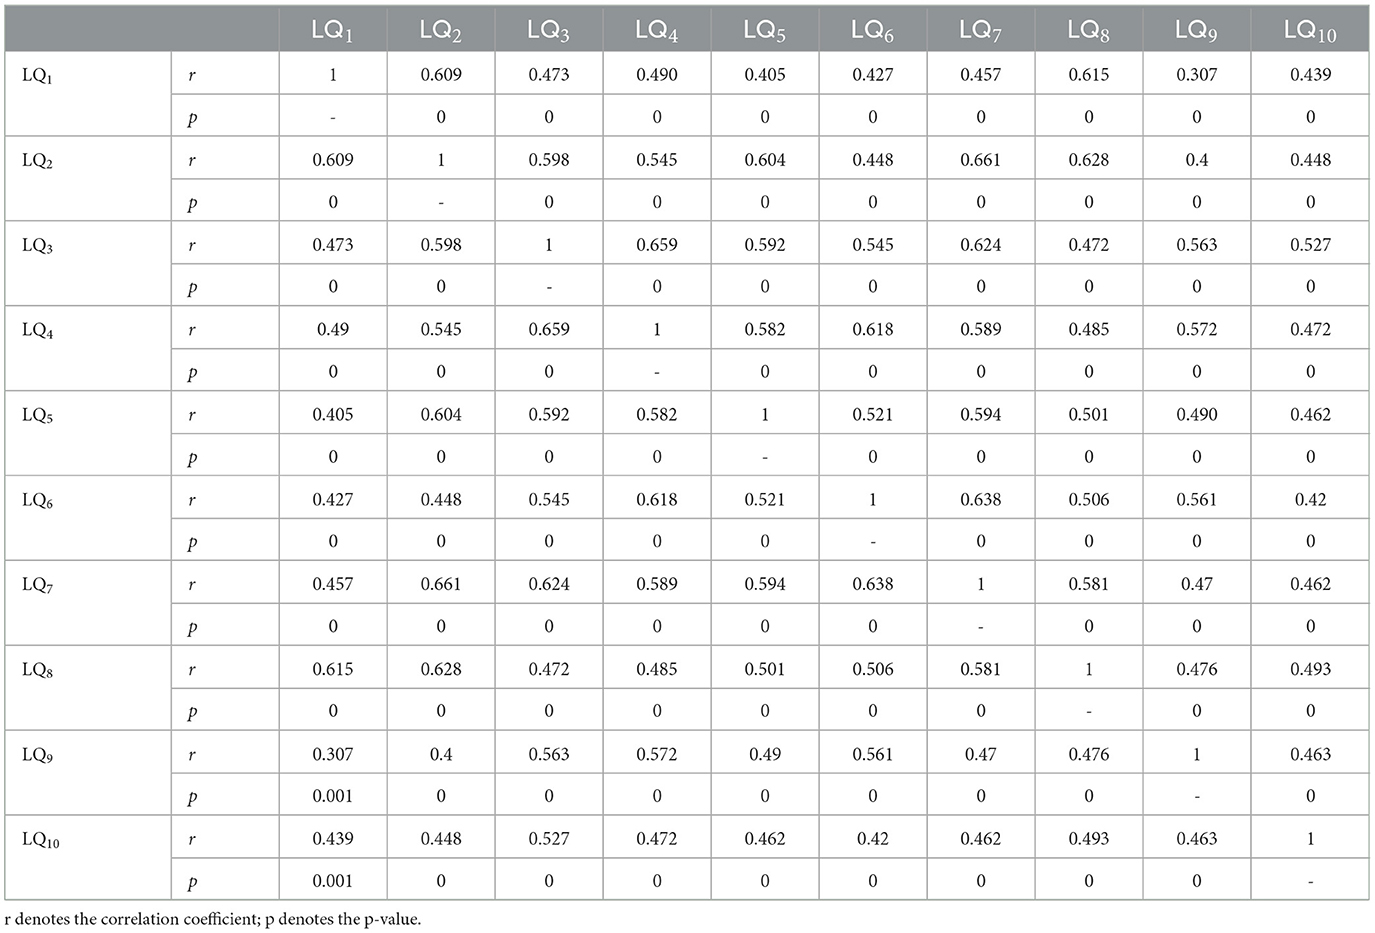
Table 6. Non-parametric correlations between LQ variables.
LQI is the variable that centralizes the DLQI questionnaire test results. Table 7 presents the descriptive statistical characterization of LQI.
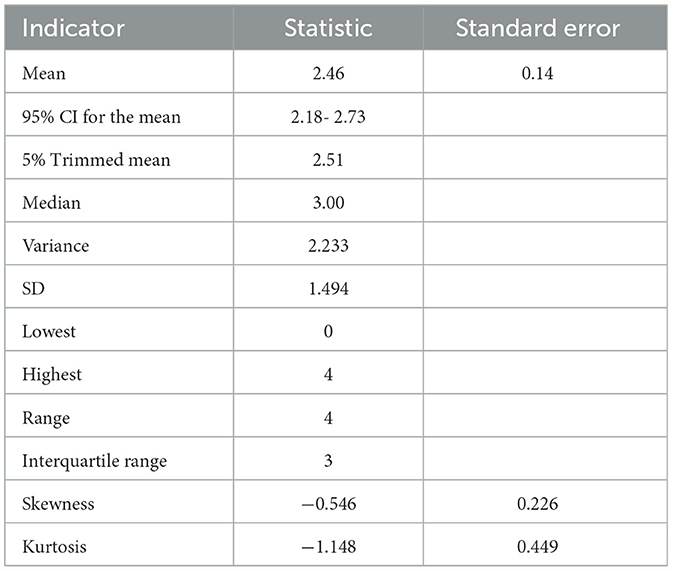
Table 7. Descriptive statistical characterization of LQI.
To verify if the LQI variable was normally distributed, we applied the Lilliefors (Lill) (Lilliefors, 1969) (Table 8) and the Shapiro-Wilk (SW) tests (Razali and Wah, 2011) (Table 8) since the SW test power is highest than those of most other normality tests (Hu and Bentler, 1999). The Lill and SW test results indicated that LQI failed to pass the normality assumption even at the 0.001 significance level. Additionally, the Q-Q plot of LQI (Figure 1) visually validated the numerical normality test results.
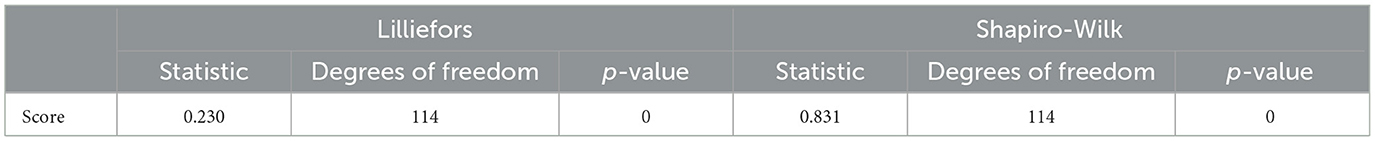
Table 8. Lilliefors and Shapiro–Wilk normality test results for the LQI variable.
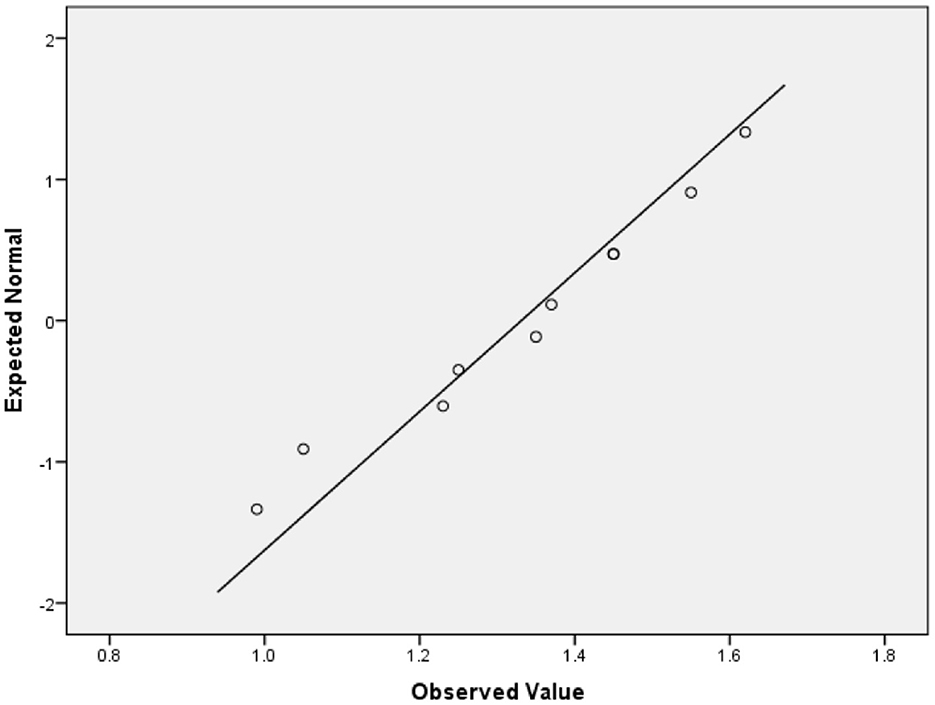
Figure 1. Q-Q plot of LQI for visual validation of the normality.
Table 9 shows the nonparametric correlation of the variable LQI with each studied variable LQ1, LQ2……LQ10. We calculated the Spearman r correlation coefficient. To verify the statistical significance of r, we calculated the 95% CI. Each correlation was proved statistically significant even at the 0.001 significance level (2-tailed).
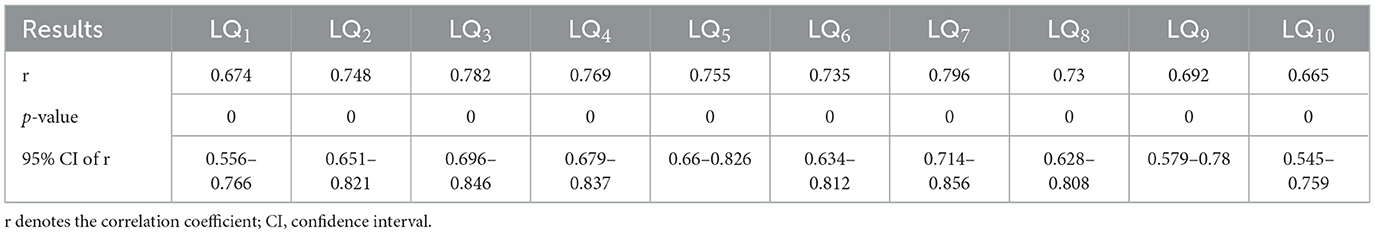
Table 9. Spearman correlations between LQ1, LQ2,……LQ10 and LQI.
After that, we created a dummy variable denoted LQIClass with the following values: LifeQual0, indicating without effect on the life quality; LifeQual1, indicating a low effect on the life quality; LifeQual2, indicating a moderate effect on the life quality; LifeQual3, indicating an important effect on the life quality; and LifeQual4, indicating a very important effect on the life quality. As seen in Figure 2, there were 38 respondents (33.33%) with LifeQual0, 29 (25.44%) with LifeQual1, 15 (13.16%) with LifeQual2, 11 (9.65%) with LifeQual3, and 21 (18.42%) with LifeQual4.
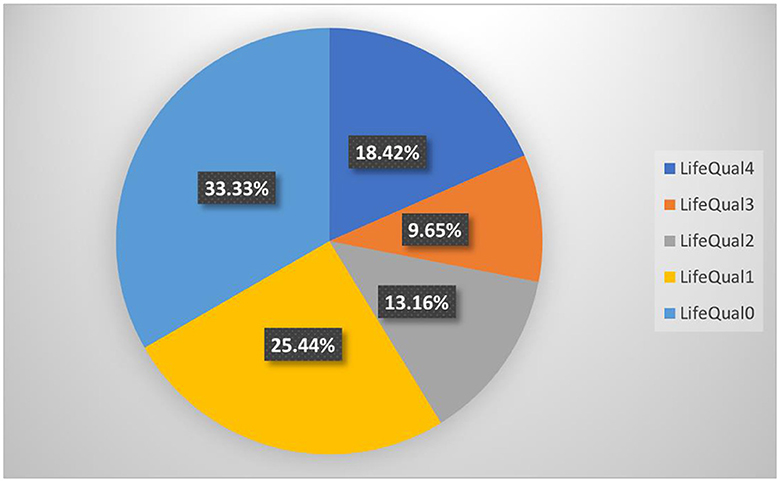
Figure 2. Vitiligo influence on life quality percentual distribution.
Based on the principle that a causal model exists, we performed Principal Axis Factoring (PAF) without any rotation premised on the initial hypothesis that a single factor exists. Preliminarily, all the mandatory assumptions necessary for the correct application of PAF were applied. To avoid premature convergence, we set the maximum iterations for convergence to 1000, the usual value being 25.
The determinant of the correlation matrix of the variables LQ1,….LQ10 was 0.004, which passed the assumption to be higher than 0.0001. KMO = 0.912 test assumption passed, KMO = 0.912 >0.6, corresponding to Table 2, can be considered marvelous. The BTS test passed, and p = 0 (approximate chi-square = 611.298, df = 45) indicated significance. It must be mentioned that this test indicates significance in the case of a large sample size. Here, it indicated that our data is accurate based on the relatively smaller sample size.
The values from the diagonal of the anti-image matrices (Table 10) passed the threshold by 0.5 (even 0.6), which shows that none of them should be removed.
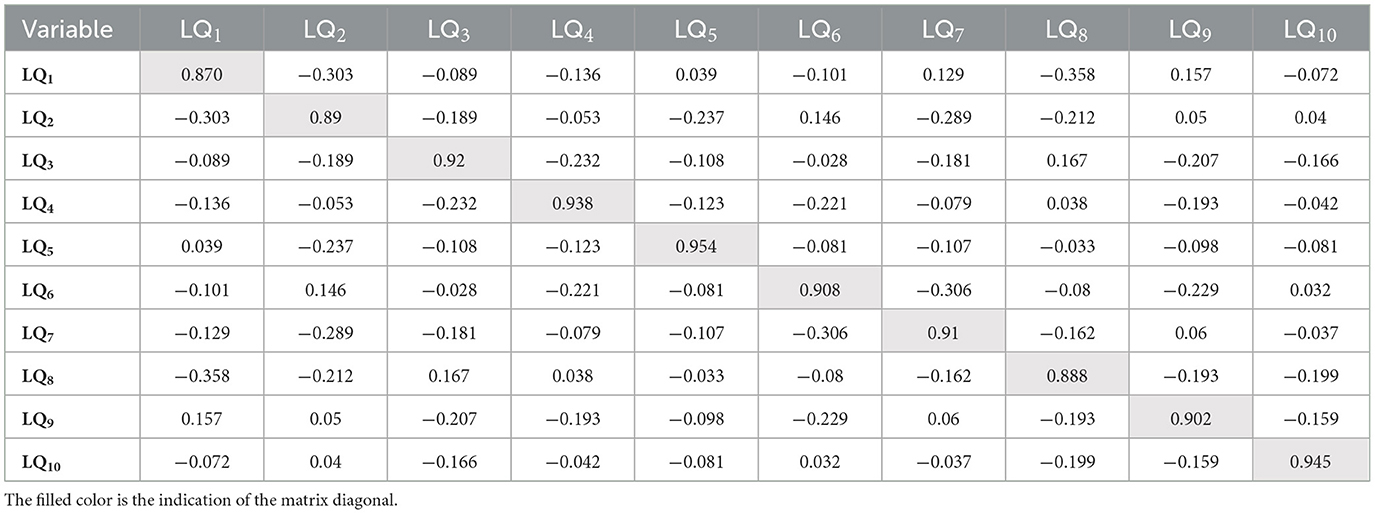
Table 10. The anti-image correlation matrices.
Table 11 presents the initial and extracted communalities. All the items passed the threshold by 0.2 (communality after extraction). Based on this result, removing any of them is not necessary.
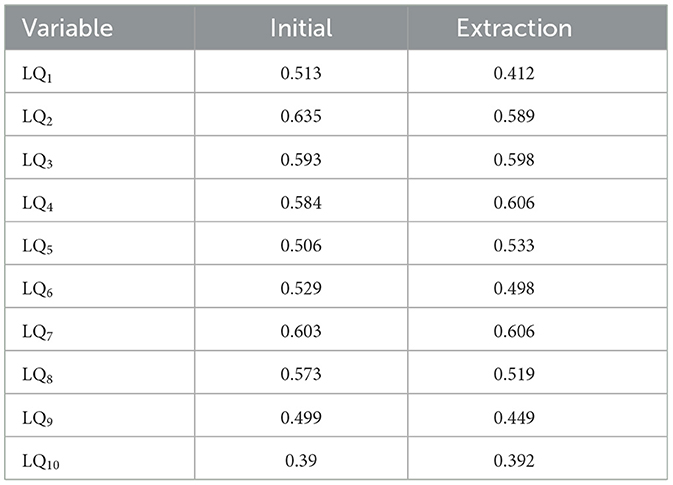
Table 11. Initial and extracted communalities.
For the identification of the number of factors, we considered the decision rule composed of the following criteria:
(A) the Kaiser rule should be selected just for the factors that have eigenvalues ≥ 1;
(B) the Scree plot visual interpretation by searching for the inflation point;
(C) the total cumulative variance is explained according to the indications (Iantovics et al., 2019).
Table 12 shows the results of factor extraction, which includes, among other things, the eigenvalues of the extracted prospective factors and the percentage of cumulative variance. Figure 3 presents the Scree plot. Applying the decision rules extracted a single factor, denoted VitiligoLifeQuality (VLQ), with an initial eigenvalue = 5.671, SS Loadings = 5.2, and 52% total cumulative variance explained.
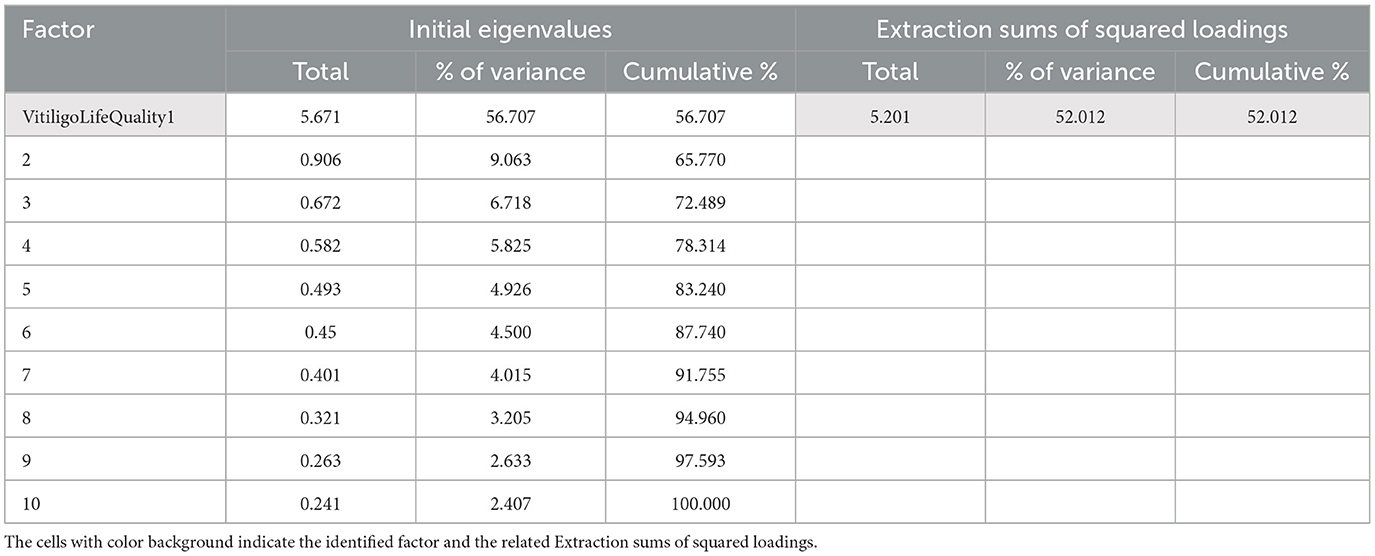
Table 12. Factor extraction and variance explained.
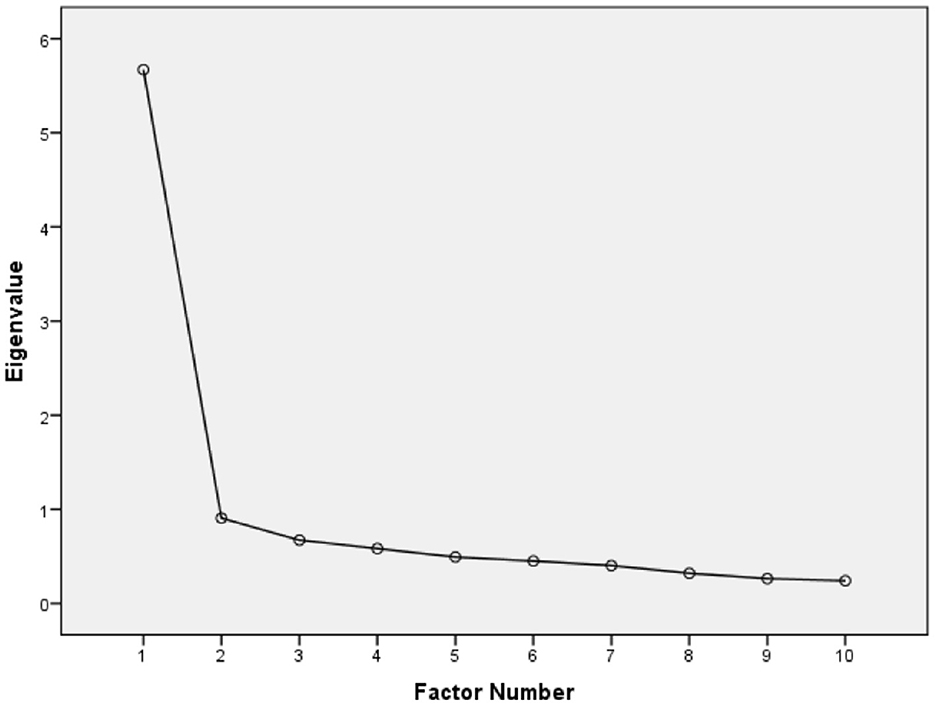
Figure 3. Scree plot used for visual evaluation of the number of factors.
Since only one factor could be extracted, we consider VLQ to be the only factor that can characterize the level of quality of life. We named the latent factor VLQ general life quality factor.
A single factor was obtained to validate the correctness of the number of extracted factors. We performed a parallel analysis based on Monte Carlo simulation (Table 13) with the following parameters: 900 replications, 10 variables, and 114 subjects. The columns labeled Eigenvalue number, Random Eigenvalue, and Standard Deviation present the results of the Monte Carlo simulation. The column labeled “Prospective factor number indicates the prospective factor number, which, if the decision passes, is indicated to be selected. The column labeled Initial eigenvalues represents the initial eigenvalues that are shown in Table 13. The last column, labeled Decision rule, presents the result of the decision rule applied for selecting a factor with a certain number. *Indicates a value that is lower than 0.5 (Figure 4 also includes the representation of these values). According to the decision rule, if the eigenvalue after extraction is greater than the random eigenvalue, then the corresponding factor to the eigenvalue number should be selected. However, the number of selected factors using the decision rule was validated. Figure 4 shows the Scree plot for visual interpretation of the parallel analysis results.
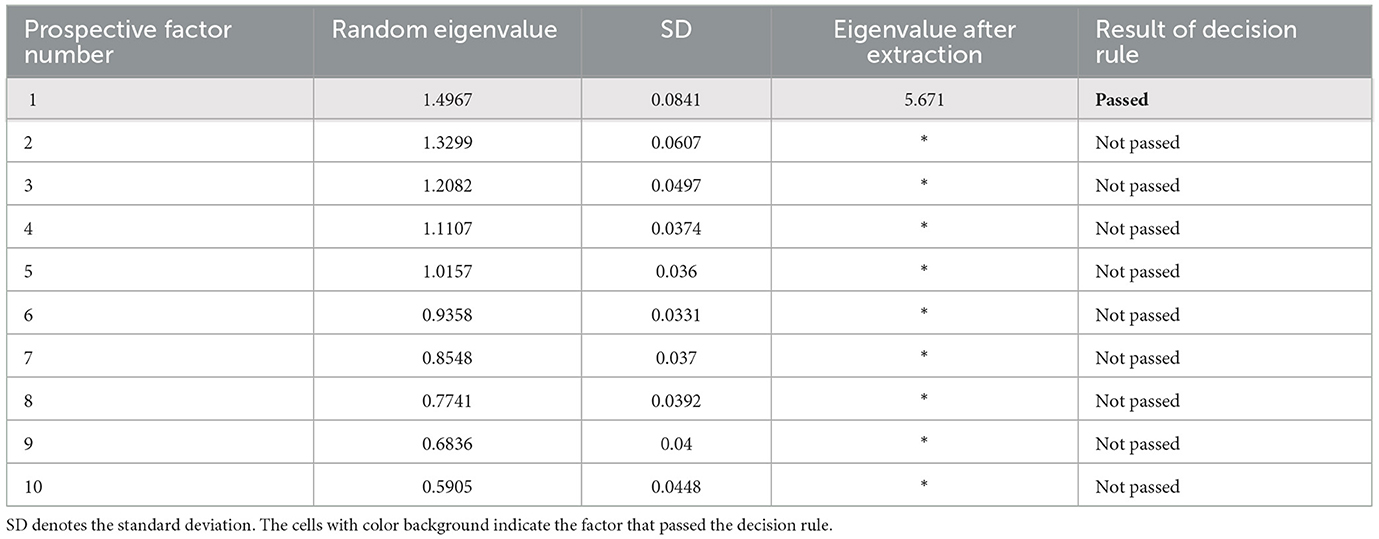
Table 13. Results of parallel analysis using Monte Carlo simulation.
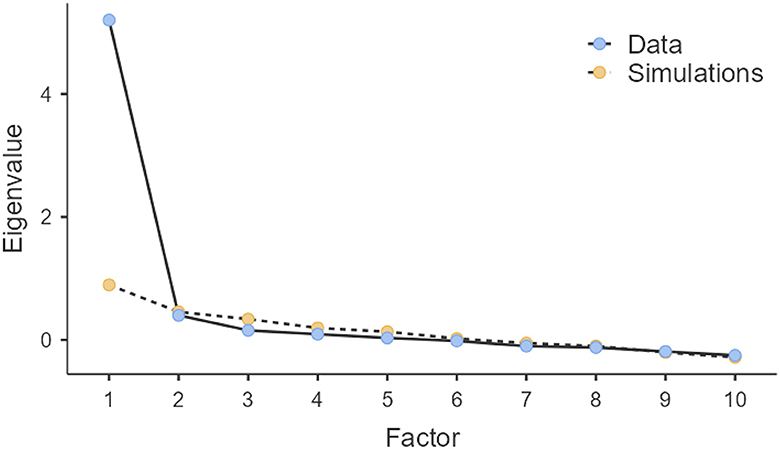
Figure 4. Scree plot for visual interpretation of parallel analysis results.
Since a single factor was extracted, it was not necessary to apply a rotation that could be oblique or orthogonal; however, the decision not to make rotation proved to be correct.
Table 14, the Factor Matrix, presents the factor loadings and the proportion of variance accounted for by the factor. In Table 14, the variables are ordered descending based on the value of loading into the factor. According to Table 11, LQ10 has the lowest extracted communality with a value of 0.392, but this value is appropriate to others and is much higher than 0.2. According to Table 14, all the factor loadings passed the threshold of 0.5, including LQ10, which was 0.626, 0.626 > 0.5. More precisely, for a sample size of 100, the required factor loading should be at least 0.55 (for a sample size of 120, the factor loading should be 0.5). All the factor loading passed this threshold. Based on this result, it can be concluded that it was not necessary to remove any of the variables. Since a single factor was identified, using the usual visual Factor Plot in the Rotated Factor Space representation was not necessary.

Table 14. Factor matrix.
We calculated the Reproduced Correlations (Table 15) and the corresponding residuals (Table 16). *Represents the reproduced communalities. Table 16 shows the values of residuals that are computed between observed and reproduced correlations.
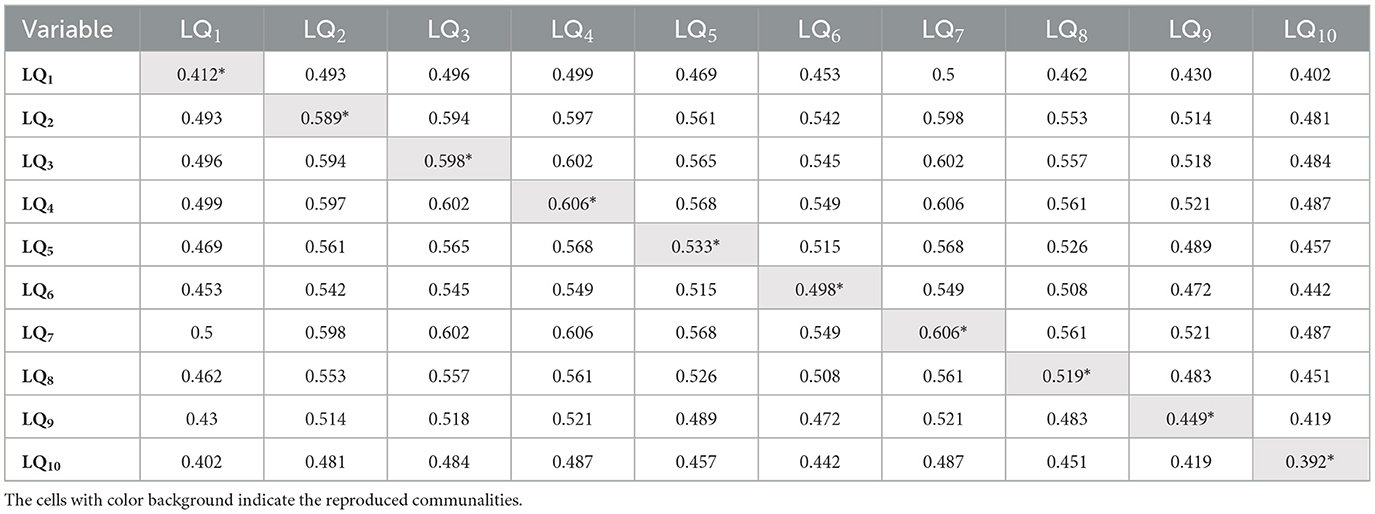
Table 15. Reproduced correlations.
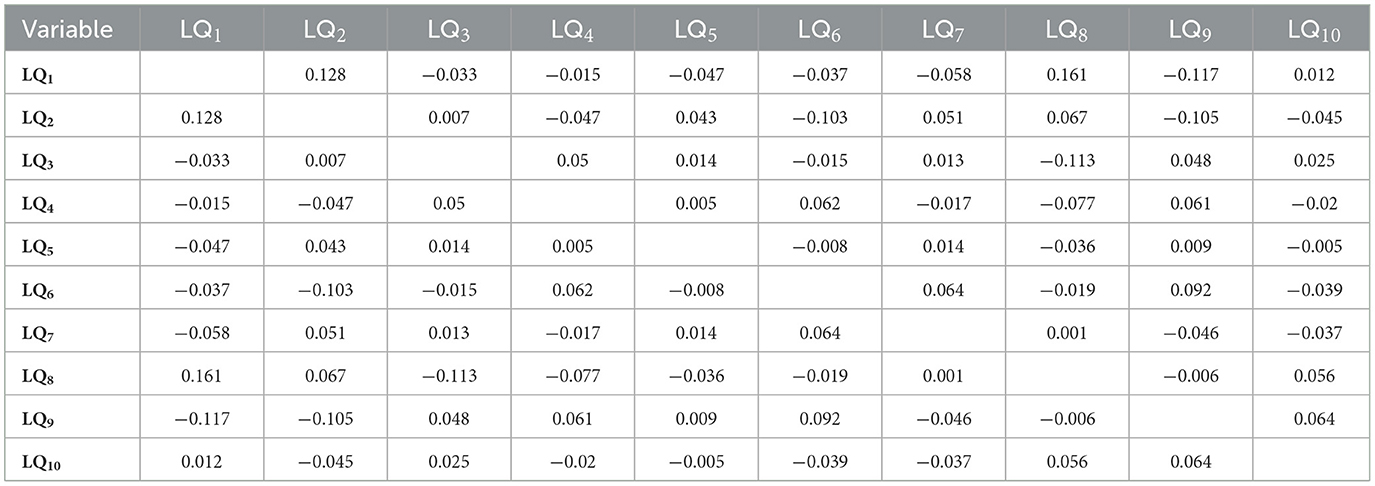
Table 16. Residuals corresponding to the reproduced correlations.
According to the results, 33.33% of the residuals are non-redundant, with absolute values greater than the threshold of 0.05. This finding indicates the passing of the threshold by 60%, which we considered 33.33% < 60%.
Using the results obtained in Table 11, we computed the AVE and performed a construct validity by making a CV validity verification. The average loading VLQ was 0.7191 (calculated as the average of values from column VLQ from Table 14), which passed the threshold by 0.7. The variance extracted from VLQ was 0.51710481 (calculated as the square of 0.7191, 0.71912), which passed the threshold by 0.5. This proved the convergent validity assumption to be true.
A model fit measure analysis was performed. The root mean square error of approximation (RMSEA) and Tucker–Lewis index (TLI) were calculated. TLI = 0.917, TLI > 0.9, which indicates a good model fit for one factorial design (Fabrigar et al., 1999). RMSEA = 0.0952, RMSEA 90%CI = 0.0638 - 0.128. indicates an acceptable model fit (Kline, 1998).
A model test with Df = 35 was performed, obtaining CMIN = 71.5, p < 0.001. Where CMIN denotes the χ2 value. CMIN/Df = 2.04, 2.04 < 3 indicates acceptable fit (Tabachnick and Fidell, 2007) (it corresponds even to the constraint that is considered 2 in some research).
Cα = 0.914 obtained for the DLQI questionnaire shows excellent internal scale consistency. ω = 0.915 allows the formulation of the same conclusion. The results presented in Table 5 prove that removing any of the variables does not significantly influence the modification of internal consistency. Based on this result, the questions are mathematically consistent. According to Table 14, since all the factor loadings are positive, it can be concluded that the numbering/coding of the values that can be chosen in the questions is realized appropriately (we did not use reverse coding for any of the variables).
We presented and verified all the necessary assumptions that must be passed for the application of PFA to be correct (Iantovics et al., 2019). The selection of the optimal number of factors is a complex problem. Many researchers have studied this problem. We presented a proposed decision rule for selecting the appropriate number of factors and also presented a method for validating the number of extracted factors.
Applying PFA, a single factor was obtained that proved the hypothesis HA of the existence of a single life quality factor LQV. According to Table 11, the factor accounted for 52% of the variance, which is considered appropriate.
Table 3 presents a descriptive statistical characterization of the LQ variables, which are questions formulated in the DLQI questionnaire. According to the results, the min = 0, max = 3, and range = 3 were the same for all the variables. This indicates that the responses were diverse, including all the values 0, 1, 2, and 3 in the case of all the variables. The median of each of the variables was 0 or 1. Each of the LQ variables has a specific standard deviation.
Initial communalities represent the proportion of variance accounted for in each variable by the rest of the variables. Extracted communalities are estimates of the variance in each variable accounted for by the factors in the factor solution. The extracted communality is specific to each variable; it represents the common variance explained in each variable by the factors. According to Table 11, the lowest extracted communality is for LQ10, 0.392; it represents the low common variance explained in the variable by the latent factor. This value is much lower than other variables.
Table 14 presents the factor loading matrix, showing the correlation between variables and the factors. LQ7 (Load 0.778), LQ4 (Load 0.778), LQ3 (Load 0.773), LQ2 (Load 0.768), LQ5 (Load 0.73), LQ8 (Load 0.721), LQ6 (Load 0.705), LQ9 (Load 0.67), LQ1 (Load 0.642), and LQ10 (Load 0.626). It is evident that the variables LQ7, LQ4, LQ3, LQ2, LQ5, LQ8, and LQ6 have the highest factor loadings, between 0.705 and 0.778. They are followed by the variables LQ9, LQ1, and LQ10, with factor loadings between 0.626 and 0.670. Based on the specificity of the questions and the correlation between them, we made the following classifications.
With r = 0.609, the correlation between LQ1, LQ2 is significant (p = 0). Based on this result and the specifics of the questions, we classified RQ1 and RQ2 as symptoms and feelings. With r = 0.659, the correlation between LQ3, LQ4 is also significant (p = 0). Based on this and the specifics of the questions, we classified RQ3 and RQ4 as daily activities. The correlation between RQ5 and RQ6 was r = 0.521, which was also significant (p = 0). Based on this fact and the specifics of the questions, we classified RQ5 and RQ6 as leisure.
Dermatological diseases, which are often externally visible, particularly vitiligo, have a significant negative impact on the quality of life of these patients. In this research, we studied the life quality of vitiligo patients using data provided by the validated questionnaire Dermatology Life Quality Index (DLQI). The Principal Axis Factoring clearly indicated a single factorial structure, a latent factor that we called the vitiligo life quality index (VLQ) that captures the entire phenomenology of life quality. The Average Variance Extracted and Convergent Validity assumptions were passed.
The psychometric properties of the DLQI questionnaire proved to have excellent internal consistency. The statistical analysis of the results provided by the DLQI questionnaire included questions that proved to be internally consistent. Based on this result, our study also validated this questionnaire on vitiligo. In conclusion, we can say that the questions are consistent and the answers valid. The performed EAF analysis was necessary and important for correctly interpreting the results.
We formulated 10 research questions that apply generally to people with skin diseases. Motivations were presented for their appropriateness for vitiligo. We analyzed and discussed the results based on the DLQI questionnaire. Finally, we analyzed these research questions for vitiligo patients based on the survey questionnaire responses that we collected.
At the same time, this study gives some extended explanations for the correct application of the EAF, which involves many assumptions that frequently are missed and need to be verified by researchers. It also involves some decisions, such as establishing the number of factors to be extracted that are often difficult (Choi et al., 2017; Iantovics et al., 2019). As a decision rule, for the establishment of the correct number of extracted factors, we presented a combination of criteria that included the Kaiser criterion, Scree plot visual interpretation, and Total Variance Explained (criterion previously approached by us Iantovics et al., 2019), followed by validation using parallel analysis using Monte Carlo simulation.
The raw data supporting the conclusions of this article will be made available by the authors, without undue reservation.
The studies involving humans were approved by the Ethics Commission of the Faculty of Medicine with no. 1255/2021, respectively of the Mureş County Clinical Hospital with no. 16501/2021. The studies were conducted in accordance with the local legislation and institutional requirements. The participants provided their written informed consent to participate in this study.
LF: Conceptualization, Formal analysis, Investigation, Methodology, Resources, Validation, Visualization, Writing – original draft, Writing – review & editing. LI: Conceptualization, Data curation, Formal analysis, Methodology, Resources, Software, Supervision, Validation, Visualization, Writing – original draft, Writing – review & editing. GF: Conceptualization, Formal analysis, Funding acquisition, Investigation, Methodology, Project administration, Resources, Supervision, Validation, Visualization, Writing – original draft, Writing – review & editing.
The author(s) declare that no financial support was received for the research, authorship, and/or publication of this article.
We would like to thank the Research Center on Artificial Intelligence, Data Science, and Smart Engineering (ARTEMIS) for the research infrastructure support.
The authors declare that the research was conducted in the absence of any commercial or financial relationships that could be construed as a potential conflict of interest.
All claims expressed in this article are solely those of the authors and do not necessarily represent those of their affiliated organizations, or those of the publisher, the editors and the reviewers. Any product that may be evaluated in this article, or claim that may be made by its manufacturer, is not guaranteed or endorsed by the publisher.
Aguilera-Durán, G., and Romo-Mancillas, A. (2021). Behavior of chemokine receptor 6 (CXCR6) in complex with CXCL16 soluble form chemokine by molecular dynamic simulations: general protein–ligand interaction model and 3D-QSAR studies of synthetic antagonists. Life 11:346. doi: 10.3390/life11040346
Alikhan, A., Felsten, L. M., Daly, M., and Petronic-Rosic, V. (2011). Vitiligo: a comprehensive overview Part I. Introduction, epidemiology, quality of life, diagnosis, differential diagnosis, associations, histopathology, etiology, and work-up. J. Am. Acad. Dermatol. 65, 473–491. doi: 10.1016/j.jaad.2010.11.061
Al-Shammari, S. A., Alotaibi, H. M., Assiri, M. A., Altokhais, M. I., Alotaibi, M. S., Alkhowailed, M. S., et al. (2021). Quality of life in vitiligo patients in central Saudi Arabia. Saudi Med. J. 42, 682–687. doi: 10.15537/smj.2021.42.6.20200833
Arabkermani, Z., Sheikhtaheri, A., Aryanian, Z., Bastani, P., Esmaeli, N., Bashiri, A., et al. (2022). Developing a minimum data set required to create a registry system for patients with vitiligo. Heliyon 8:e12641. doi: 10.1016/j.heliyon.2022.e12641
Bali, G., Kárpáti, S., Sárdy, M., et al. (2018). Association between quality of life and clinical characteristics in patients with morphea. Qual. Life Res. 27, 2525–2532. doi: 10.1007/s11136-018-1897-1
Bhandarkar, S. S., and Kundu, R. V. (2012). Quality-of-life issues in vitiligo. Dermatol. Clin. 30, 255–268. doi: 10.1016/j.det.2011.11.013
Bhuptani, N. V., Parmar, P. J., Selot, N. K., and Patel, B. K. (2020). Quality of life in patients with vitiligo. Int. J. Res. Dermatol. 6, 388–391. doi: 10.18203/issn.2455-4529.IntJResDermatol20201586
Bibeau, K., Pandya, A. G., Ezzedine, K., Jones, H., Gao, J., Lindley, A., et al. (2022). Vitiligo prevalence and quality of life among adults in Europe, Japan, and the USA. J. Eur. Acad. Dermatol. Venereol. 36, 1831–1844. doi: 10.1111/jdv.18257
Bonett, D. G., and Wright, T. A. (2000). Sample size requirements for estimating Pearson, Kendall and Spearman correlations. Psychometrika 65, 23–28. doi: 10.1007/BF02294183
Brǎnişteanu, D. E., Pintilie, A., Dimitriu, A., Cerbu, A., Ciobanu, D., Oantǎ, A., et al. (2017). Clinical, laboratory and therapeutic profile of lichen planus. Med. Surg. J. 121, 25–32.
Brihan, I., Ianoşi, S. L., Boda, D., Hǎlmǎjan, A., Zdrîncǎ, M., Fekete, G. L., et al. (2020). Implications of self-esteem in the quality of life in patients with psoriasis. Exp. Ther. Med. 20:202. doi: 10.3892/etm.2020.9332
Cattell, R. B. (1966). The scree test for the number of factors. Multivar. Behav. Res. 1, 245–276. doi: 10.1207/s15327906mbr0102_10
Cho, E. (2016). Making reliability reliable. Organ. Res. Methods 19, 651–682. doi: 10.1177/1094428116656239
Choi, Y., Taylor, J., and Tibshirani, R. (2017). Selecting the number of principal components: Estimation of the true rank of a noisy matrix. Ann. Statist. 45, 2590–2617. doi: 10.1214/16-AOS1536
Clarke, E. N., Norman, P., and Thompson, A. R. (2022). How does self-compassion help people adjust to chronic skin conditions? A template analysis study. Front. Med. 9:974816. doi: 10.3389/fmed.2022.974816
Cortés, H., Rojas-Márquez, M., Del Prado-Audelo, M. L., Reyes-Hernández, O. D., et al. (2022). Alterations in mental health and quality of life in patients with skin disorders: a narrative review. Int. J. Dermatol. 61, 783–791. doi: 10.1111/ijd.15852
Dallal, G. E., and Wilkinson, L. (1986). An analytic approximation to the distribution of Lilliefors's test statistic for normality. Am. Stat. 40, 294–296. doi: 10.1080/00031305.1986.10475419
Dev, A., Narayan, V., Vinay, K., Bishnoi, A., Parsad, D., Kumaran, M. S., et al. (2022). Quality of life assessment in childhood vitiligo in a tertiary care center in India. Pediatr Dermatol. 39, 931–933. doi: 10.1111/pde.15128
Divyesh, B. (2017). Study of correlation among de-pigmented body areas and sex of vitiligo patients on their self esteem and quality of life. Indian J. Psychiatr. 59, S176–S176.
Dobai, B. M., Iantovics, L. B., Paiu, A., and Dobreanu, D. (2022). Exploratory factor analysis for identifying CIEDs patients' concerns during the COVID 19 pandemic in Europe. Interdis. Des. Compl. Syst. 20, 50–56. doi: 10.7906/indecs.20.1.7
Elbuluk, N., and Ezzedine, K. (2017). Quality of life, burden of disease, comorbidities, and systemic effects in vitiligo patients. Dermatol. Clin. 35, 117–120. doi: 10.1016/j.det.2016.11.002
Ezzedine, K., Eleftheriadou, V., Whitton, M., Hons, B. A., and van Geel, N. (2015). Vitiligo. Lancet 386, 74–84. doi: 10.1016/S0140-6736(14)60763-7
Fabrigar, L. R., MacCallum, R. C., Wegener, D. T., and Strahan, E. J. (1999). Evaluating the use of exploratory factor analysis in psychological research. Psychol Methods 4, 272–299. doi: 10.1037/1082-989X.4.3.272
Ferraz, L. B., Almeida, F. A., Vasconcellos, M. R., et al. (2006). The impact of lupus erythematosus cutaneous on the quality of life: the Brazilian–Portuguese version of DLQI. Qual. Life Res. 15, 565–570. doi: 10.1007/s11136-005-2638-9
Finlay, A. Y., and Khan, G. K. (1994). Dermatology life quality index (DLQI)—a simple practical measure for routine clinical use. Clin. Exp. Dermatol. 19, 210–216. doi: 10.1111/j.1365-2230.1994.tb01167.x
Grieder, S., and Steiner, M. D. (2022). Algorithmic jingle jungle: A comparison of implementations of principal axis factoring and promax rotation in R and SPSS. Behav. Res. 54, 54–74. doi: 10.3758/s13428-021-01581-x
Hauben, M., Hung, E., and Hsieh, W. Y. (2017). An exploratory factor analysis of the spontaneous reporting of severe cutaneous adverse reactions. Ther. Adv. Drug Saf. 8, 4–16. doi: 10.1177/2042098616670799
Horn, J. L. (1965). A rationale and test for the number of factors in factor analysis. Psychometrika 30, 179–185. doi: 10.1007/BF02289447
Hu, L., and Bentler, P. M. (1999). Cutoff criteria for fit indexes in covariance structure analysis: conventional criteria versus new alternatives. Struct. Equ. Model. 6, 1–55. doi: 10.1080/10705519909540118
Iantovics, L. B., Rotar, C., and Morar, F. (2019). Survey on establishing the optimal number of factors in exploratory factor analysis applied to data mining. Wires Data Min. Knowl. 9:e1294. doi: 10.1002/widm.1294
Ingordo, V., Cazzaniga, S., Gentile, C., Iannazzone, S. S., Cusano, F., Naldi, L., et al. (2011). Dermatology life quality index score in vitiligo patients: a pilot study among young Italian males. Dermatol. Venerol. 146, 1–2.
Kaiser, H. F. (1960). The application of electronic computers to factor analysis. Educ. Psychol. Meas. 20, 141–151. doi: 10.1177/001316446002000116
Kline, R. B. (1998). Principles and Practice of Structural Equation Modeling. New York, NY: Guilford Press.
Krüger, C., and Schallreuter, K. U. (2012). A review of the worldwide prevalence of vitiligo in children/adolescents and adults. Int. J. Dermatol. 51, 1206–1212. doi: 10.1111/j.1365-4632.2011.05377.x
Lilliefors, H. (1969). On the Kolmogorov-Smirnov test for the exponential distribution with mean unknown. J. Am. Stat. Assoc. 64, 387–389. doi: 10.1080/01621459.1969.10500983
McDonald, R. P. (1985). Factor Analysis and Related Methods. Hillside, NJ: Lawrence Erlbaum Associates, Inc.
Nia, H. S., Sharif, S. P., Koocher, G. P., Yaghoobzadeh, A., Haghdoost, A. A., Win, M. T. M., et al. (2020). Psychometric properties of the death anxiety scale-extended among patients with end-stage renal disease. Omega 80, 380–396. doi: 10.1177/0030222817733220
Peralta-Pedrero, M. L., Guerrero-Oliva, G., Morales-Sánchez, M. A., Chirino-Castillo, G. Q., Marín-Rivera, D., Núñez-Benítez, M. A., et al. (2022). What is the quality of life of adults with vitiligo in Mexico? Gac. Med. Mex. 158, 393–400. doi: 10.24875/GMM.22000120
Picardo, M., Huggins, R. H., Jones., H, Marino, R., Ogunsola, M., and Seneschal, J. (2022). The humanistic burden of vitiligo: a systematic literature review of quality-of-life outcomes. J. Eur. Acad. Dermatol. Venereol. 36, 1507–1523. doi: 10.1111/jdv.18129
Prather, J. C., Lobach, D. F., Goodwin, L. K., Hales, J. W., Hage, M. L., Hammond, W. E., et al. (1997). Medical data mining: knowledge discovery in a clinical data warehouse. Proc. AMIA Annu. Fall Symp. 22, 101–105.
Raimondi, G., Samela, T., Fania, L., and Abeni, D. (2023). Item-specific patterns of the Skindex-17 in individuals with different levels of Hidradenitis Suppurativa severity: a network analysis study. Front. Public Health 11:1284365. doi: 10.3389/fpubh.2023.1284365
Rapp, S. R., Feldman, S. R., Exum, M. L., Jr Fleischer, A. B., and Reboussin, D. M. (1999). Psoriasis causes as much disability as other major medical diseases. J. Am. Acad. Dermatol. 41, 401–407. doi: 10.1016/S0190-9622(99)70112-X
Razali, N., and Wah, Y. B. (2011). Power comparisons of Shapiro-Wilk, Kolmogorov-Smirnov, Lilliefors and Ander-son-Darling tests. J. Stat Mod and Anal 2, 21–33.
Rencz, F., Mitev, A. Z., Jenei, B., et al. (2022). Measurement properties of the ICECAP-A capability well-being instrument among dermatological patients. Qual. Life Res. 31, 903–915. doi: 10.1007/s11136-021-02967-2
Richard, M. A., Paul, C., Nijsten, T., Gisondi, P., Salavastru, C., Taieb, C., et al. (2022). EADV burden of skin diseases project team, Prevalence of most common skin diseases in Europe: a population-based study. J. Eur. Acad. Dermatol. Venereol. 36, 1088–1096. doi: 10.1111/jdv.18050
Sehgal, V. N., and Srivastava, G. (2007). Vitiligo: compendium of clinico-epidemiological features. Ind. J. Dermatol. Venereol. Leprol. 73, 149–156. doi: 10.4103/0378-6323.32708
Shapiro, S. S., and Wilk, M. B. (1965). An analysis of variance test for normality (complete samples). Biometrika 52, 591–611. doi: 10.1093/biomet/52.3-4.591
Simons, R. E., Zevy, D. L., and Jafferany, M. (2020). Psychodermatology of vitiligo: Psychological impact and consequences. Dermatol. Ther. 33, 65–70. doi: 10.1111/dth.13418
Stanescu, A. M. A., Totan, A., Mircescu, D., Diaconescu, S., Bratu, O. G., Fekete, L., et al. (2020). Assessment of suicidal behavior in dermatology (Review). Exp. Ther. Med. 20, 73–77. doi: 10.3892/etm.2019.8145
Stefansky, W. (1972). Rejecting outliers in factorial designs. Technometrics 14, 469–479. doi: 10.1080/00401706.1972.10488930
Stigler, S. M. (1989). Francis Galton's account of the invention of correlation. Stat. Sci. 4, 73–79. doi: 10.1214/ss/1177012580
Tabachnick, B. G., and Fidell, L. S. (2007). Using Multivariate Statistic, 5th Edn. New York, NY: Allyn and Bacon.
Tatu, A. L., Nadasdy, T., and Nwabudike., L. C. (2022). Koebner phenomenon with lichen planus in an area of previous vitiligo after COVID-19 vaccination and the creation of a locus minoris resistentiae. J. Eur. Acad. Dermatol. Venereol. 36, e265–e266. doi: 10.1111/jdv.17864
Wilk, M. B., and Gnanadesikan, R. (1968). Probability plotting methods for the analysis of data. Biometrika 55, 1–17. doi: 10.2307/2334448
Yang, F., Yang, L., Teng, L., Zhang, H., and Katayama, I. (2021). Morphological alterations and increased S100B expression in epidermal langerhans cells detected in skin from patients with progressive vitiligo. Life 11:579. doi: 10.3390/life11060579
Yang, T. T., Lee, C. H., and Lan, C. E. (2022). Impact of vitiligo on life quality of patients: assessment of currently available tools. Int. J. Environ. Res. Public Health 19:14943. doi: 10.3390/ijerph192214943
Ye, Z., Chen, J., Du, P., Ni, Q., Li, B., Zhang, Z., et al. (2022). Metabolomics signature and potential application of serum polyunsaturated fatty acids metabolism in patients with vitiligo. Front. Immunol. 13:839167. doi: 10.3389/fimmu.2022.839167
Keywords: health-related quality of life, vitiligo, psychometric properties of a questionnaire, Dermatology Life Quality Index, symptoms and feelings, treatment, burden of vitiligo, Principal Axis Factoring
Citation: Fekete L, Iantovics LB and Fekete GL (2024) Validation of the DLQI questionnaire in assessing the disease burden and principal aspects related to life quality of vitiligo patients. Front. Psychol. 15:1333723. doi: 10.3389/fpsyg.2024.1333723
Received: 07 November 2023; Accepted: 15 May 2024;
Published: 30 May 2024.
Edited by:
Luca Mastorino, University of Turin, ItalyReviewed by:
Adrian Baican, University of Medicine and Pharmacy Iuliu Hatieganu, RomaniaCopyright © 2024 Fekete, Iantovics and Fekete. This is an open-access article distributed under the terms of the Creative Commons Attribution License (CC BY). The use, distribution or reproduction in other forums is permitted, provided the original author(s) and the copyright owner(s) are credited and that the original publication in this journal is cited, in accordance with accepted academic practice. No use, distribution or reproduction is permitted which does not comply with these terms.
*Correspondence: Laszlo Barna Iantovics, YmFybmEuaWFudG92aWNzQHVtZnN0LnJv
†These authors have contributed equally to this work
Disclaimer: All claims expressed in this article are solely those of the authors and do not necessarily represent those of their affiliated organizations, or those of the publisher, the editors and the reviewers. Any product that may be evaluated in this article or claim that may be made by its manufacturer is not guaranteed or endorsed by the publisher.
Research integrity at Frontiers
Learn more about the work of our research integrity team to safeguard the quality of each article we publish.