 Fathima Jaffari
 Jennifer Koran
- 1Department of Tests and Measurement, National Center for Assessment, Education and Training Evaluation Commission (ETEC), Riyadh, Saudi Arabia
- 2Quantitative Methods Program, Southern Illinois University Carbondale, Carbondale, IL, United States
In the field of structural equation modeling (SEM), all commonly used case influence measures are model-based measures whose performance are affected by target-model-misspecification-error. This problem casts light on the need to come up with a model-free measure which avoids the misspecification problem. the main purpose of this study is to introduce a model-free case influence measure, the Deleted- One-Covariance-Residual (DOCR), and then evaluating its performance compared to that of Mahalanobis distance (MD) and generalized Cook’s distance (gCD). The data of this study were simulated under three systematically manipulated conditions: the sample size, the proportion of target cases to non-target cases, and the type of model used to generate the data. The findings suggest that the DOCR measure generally performed better than MD and gCD in identifying the target cases across all simulated conditions. However, the performance of the DOCR measure under a small sample size was not satisfactory, and it raised a red flag about the sensitivity of this measure to small sample size. Therefore, researchers and practitioners should only use the DOCR measure with a sufficiently large sample size, but not larger than 600.
1 Introduction
In structural equation modeling (SEM), normal-distribution-based maximum likelihood (NML) is commonly used as a default estimation method for estimating the parameter values. The NML procedure yields reasonable parameter estimates if the assumption of normality holds in the data distribution. Alternatively, the existence of influential cases in the data might make NML yield biased parameter estimates and affect overall model assessment since these cases could alter the standard error value and the test statistic (Yuan and Bentler, 1998).
One tool that is used for investigating the influence of these cases on the model results is the case influence measures. These measures are built based on the case deletion technique. The case deletion technique is based on the quantification of the impact of the ith case by finding the difference between the value of the measure before and after the deletion of the ith case to evaluate the impact of this case on the overall model fit. The result obtained from this measure gives information on which case is more influential. In other modeling frameworks, such as OLS regression, there is extensive development and widespread use of case diagnostics for identifying cases, which is not the case with confirmatory factor models, path analysis models, and other models in the SEM framework.
Several regression-based case influence measures have been applied to the SEM field and used with the confirmatory factor models. However, all applied case influence measures are model-based measures that require a theoretical model to be fitted into the data to identify the influential cases. Because case influence measures are model-based, the accuracy of their performance could be impacted by specification errors (Bollen and Arminger, 1991). Since influence measures rely on the structure of the model, they highlight any case that does not fit the model. The determination of one case fits to the model changes depending on the model that has been fitted to the data. Thus, if the model is misspecified, the case influence measure is expected to yield many cases that cause a poor overall model fit. On the contrary, if the case influence measure reflects a few influential cases, it could be expected that the model was correctly specified, and the actual problem of the influential cases existed among the data (Pek and MacCallum, 2011).
The case influence measures that are commonly used in the field of SEM are all model-based measures. Up to this point, no model-free case influence measure has been proposed in the SEM field. Therefore, the main purpose of this study is to avoid the misspecification problem associated with the performance of model-based measures by developing a model-free case influence measure. The proposed Deleted-One-Covariance-Residual (DOCR) measure is based on the covariance matrix of the observed data, which allows the DOCR to avoid requiring any specific model to fit the data. The DOCR uses the deletion technique by comparing the sample covariance matrix that resulted from deleting the ith case from the original sample with the sample covariance matrix that resulted from considering all cases in the original sample For standardizing the residuals, the residual difference between the two sample covariance matrices, , is divided by observed variances ( . After algebraic arranging, the final formula, as seen in Eq. (1), as follows:
Where S and Si are the sample covariance matrices obtained from original and deleted ith case samples, respectively. vm and vj are the observed variances of each pair of variables in the covariance matrix, and p is the number of observed variables. Since the DOCR measure would otherwise yield small values that range between 10−4 and 10−5 for the influence of the cases, the formula of this measure includes multiplying by 1000 to make these values more readable. Our goal is to determine whether the purposed model-free measure DOCR precisely identifies the influential cases compared to generalized Cook’s distance (gCD) and Mahalanobis distance (MD), which are extensively used in multivariate applications to detect outliers. We present the results of two Monte Carlo simulation studies that compared the performance of the proposed measure to the performance of MD and gCD in identifying the target cases. We hypothesized that the DOCR measure would perform better than MD and gCD in identifying the target cases across variations in sample size, proportion of target cases, and model specifications.
1.1 Background
In SEM, the case influence measures aim to evaluate the degree of the model fit at the person level; stated differently, they aim to identify unusual cases under the model (Reise and Widaman, 1999). Corresponding to regression, the following factor analysis model as seen in Eq. (2) is considered a latent predictor’s multivariate regression model:
Where μ is a population mean vector, Ʌ is a p × q factor loadings matrix, fi is a vector of q-variate latent factors, and ei is a vector of measurement errors. Based on this factor model, Yuan and Zhong (2008) stated that the cases with large absolute values of measurement error (ei) are termed outliers, disregarding the values of the factor scores (fi). The cases with extreme absolute values on the exogenous latent variables’ factor scores are termed leverage cases. Leverage cases with a small magnitude of measurement errors (ei) are considered Good Leverage Cases, while leverage cases with a large magnitude of measurement errors (ei) are considered Bad Leverage Cases. In SEM, unusual cases with large are considered influential on both the model fit and the parameters since they cause a large change in the off-diagonal elements of S (sample covariance matrix). Case influence measures use the deletion technique to quantify the influence of these cases by comparing the value of the statistic before and after the deletion of the ith case from the data. Most of these measures have been proposed and developed in the regression field (Belsley et al., 1980; Cook and Weisberg, 1982). However, some of these statistics have been applied to the SEM field to identify the influential cases and quantify their influence on the model findings.
One of the deletion measures that have been applied to SEM is gCD. gCD is a model-based measure that is used to quantify the influence of the unusual case on the parameter estimates. This measure is a generalized version of Cook’s distance (Cook, 1977, 1986). Atkinson (1981) modified Cook’s distance for influential case detection by adding the values of the parameter estimates after deleting the ith case and controlling for the sample size effect. Then, Lee and Wang (1996) used the generalized least square function to generalize Cook’s distance measure to the SEM application.
gCD has been introduced and used in some studies (Zhao and Lee, 1998; Pek and MacCallum, 2011) to examine the case influence on a set of l parameters on a set of l parameters, as seen in Eq. (3).
Where and i are vectors of parameter estimates that are calculated from all cases in the original sample and the sample with the ith case deleted, respectively. The ( i) is the estimated asymptotic covariance matrix of the parameter estimates calculated from the sample with the ith case deleted. Assuming that k is the full set of the model parameters and l is the number of the desirable subset of the model parameters, one can calculate gCD for any subset of parameters l instead of the full set of model parameters k.
Given the gCD quadratic form, the lower bound of gCD is equal to zero, which means that this statistic always takes positive values, and that makes gCD give us information on the level of change rather than the direction of the change on the model parameters. Thus, a small amount of gCD means that a small change in the l subset of parameter estimates is associated with the exclusion of the ith case from the sample. On the other hand, a large amount of gCD means that a large change in the l subset of parameter estimates is associated with the exclusion of the ith case from the sample.
To obtain information about the direction of change in an individual parameter, the scaled difference is used for this specific purpose (Zhao and Lee, 1998; Pek and MacCallum, 2011) as seen in Eq. (4).
Where j and j(i) are the parameter estimates obtained from the original and deleted ith samples, respectively. Positive values of difference indicate that small change is associated with the exclusion of the ith case and vice versa.
Other case diagnostic measures have been developed for latent variable models (Pek and MacCallum, 2011; Sterba and Pek, 2012). However, these three measures (i.e., LD, , and gCD) are currently the most readily available due to their inclusion in the R package influence. SEM (Pastore and Altoé, 2022).
Due to the slow development of case influence measures in SEM, MD is routinely used in multivariate applications to detect unusual cases. MD, as seen in Eq. (5), is the distance between the ith case and the remaining cases while accounting for the correlation in the data (Mahalanobis, 1936). Some studies used the main and derived versions of this test mainly for detecting the potential multivariate outliers and leveraged cases (Pek and MacCallum, 2011; Yuan and Zhang, 2012).
Where Y is an N × p data matrix containing N cases on p variables, is a 1 × p vector of p variables for the ith case, is the column-centered data matrix, is an N × p matrix of the column means, f and and C, as seen in Eq. (6), is the variance–covariance matrix (De Maesschalck et al., 2000, p.2). MD2 distributes as a central chi-square distribution with degrees of freedom (df) equal to the number of variables. A significantly low value of p of high MDi2 in the corresponding (df) means that the ith case is a potential outlier (Kline, 2016, p. 73).
However, MD is a model-free measure of outlying status rather than case influence, and it is generally used in multivariate applications to detect outliers (Mahalanobis, 1936). In practice, some researchers use MD to identify the outliers and delete them prior to fitting the model to the data. The problem with this practice is that influential cases could be outlying cases (i.e., outliers), but not all outlying cases are influential. That is, some outlying cases are not regression outliers because they do not deviate from the linear pattern of the data, so they are considered good cases since their inclusion in the estimation process could lead to a better overall model fit and precise parameter estimates (Rousseeuw and van Zomeren, 1990). Based on this fact, Pek and MacCallum (2011) recommended against using such practice since the removal of good cases, because MD identifies them as outlying cases, might lead to worsening the overall model fit. Thus, this practice sheds light on the limitations of using MD in the case influence analysis to identify influential cases. On the contrary, model-based measures demand to fit a theoretical model to the data for quantifying the impact that each case exerts on the findings of modeling. The latter measures consider the structure of the model, and their values change as the model structure and set of independent variables change (Belsley et al., 1980).
The purpose of this study is to introduce a model-free case influence measurement that overcomes the problem of specification error and the limitations of using an outlying status measure (i.e., MD) in identifying the influential cases. This proposed measure is compared to MD and gCD to evaluate its ability to identify target cases under a variety of systematically manipulated conditions while accounting for sampling variability using Monte Carlo simulation.
2 Methods
2.1 Data generation
2.1.1 Simulation study 1
The data for this simulation study were generated under a population confirmatory factor analysis (CFA) model with two factors and three indicators per factor. For scaling the factors, the unit variance identification method was used. Target cases were generated from a distribution (c.f., Lee and Wang, 1996), where is a 6 × 6 identity matrix. Non-target cases were generated using the common factor model , where is the 6 × 6 population covariance matrix, is the loading matrix with , is the factor correlation matrix, and is the 6 × 6 diagonal matrix of unique variances.
2.1.2 Simulation study 2
The data for this simulation study were generated under a population path model with five observed variables. Data sets were simulated with target cases from distribution, where is the 5 × 5 identity matrix, and 6.49 was the result of multiplying the largest variance in the diagonal of the covariance matrix of the data by 4 following the same process of generating the target cases used within the first simulation study (c.f., Lee and Wang, 1996). Non-target cases were generated using the population path model from , where
Y = X + BY+ , = , B = ,
is the v × v population covariance matrix, is a parameter matrix of the direct effect of exogenous variables on the endogenous variables, B is the parameter matrix of the direct effect of endogenous variables on each other, and is the matrix of the disturbances.
2.2 Case diagnostics
The DOCR, MD, and gCD were compared. The confirmatory factor analysis models fit in Study 1 are shown in Figures 1, 2. The path analysis models fit in Study 2 are shown in Figures 3, 4. Since model misspecification can affect the identification of target cases, both correctly specified models, shown in Figures 1, 3, and misspecified models, shown in Figures 2, 4, were fit to the simulated data using the R package lavaan (Rosseel, 2012). The DOCR was calculated using basic matrix functions from the matlib package in R (Friendly et al., 2022). The MD was calculated using the mahalanobis function from the stats package that is part of base R. The gCD was calculated using the genCookDist and explore.influence functions from the R package influence.SEM (Pastore and Altoé, 2022) for both the correctly specified model and the misspecified models in both studies.
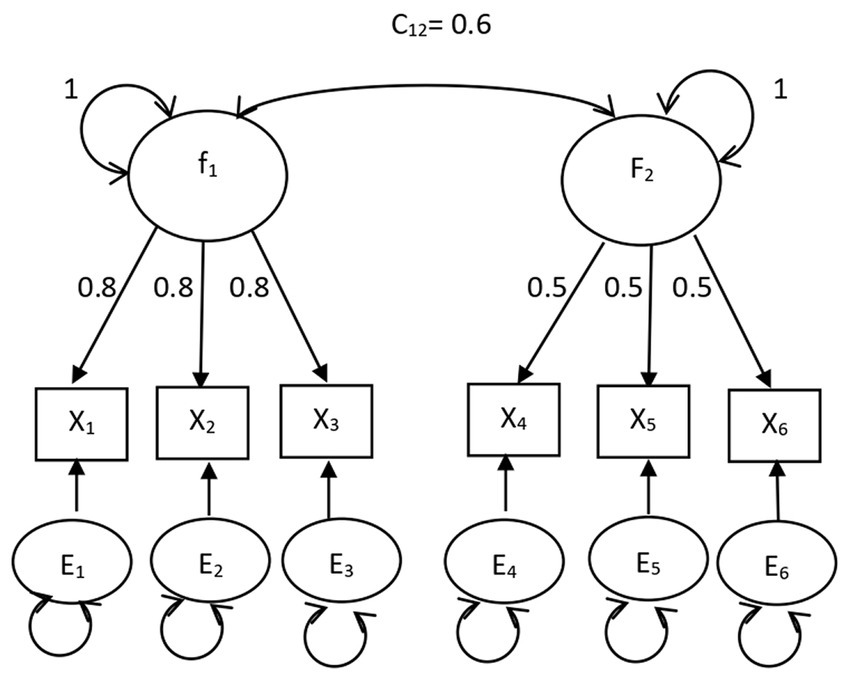
Figure 1. The correctly specified common factor model.
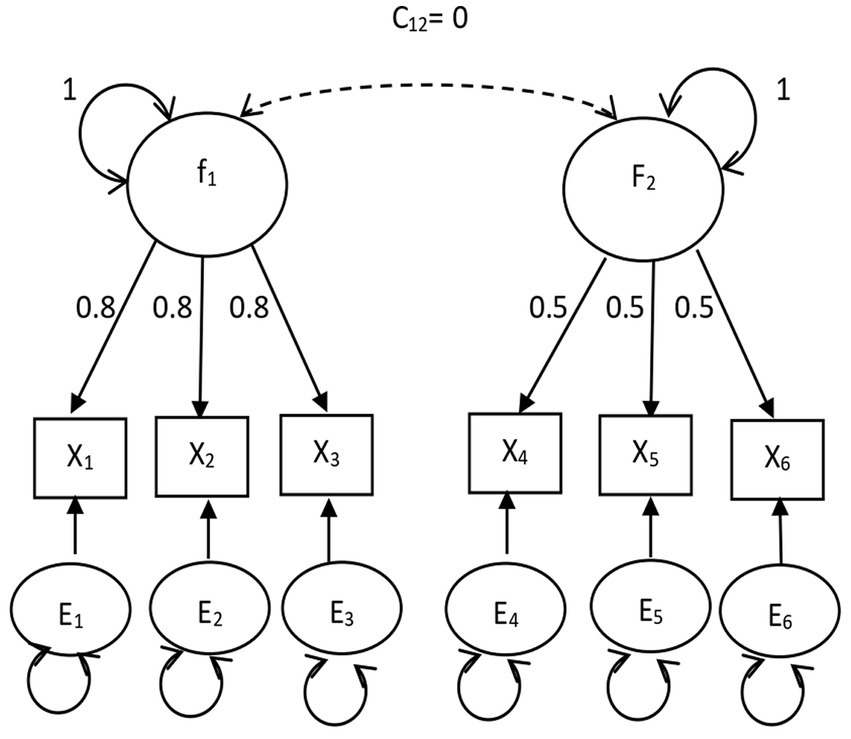
Figure 2. The orthogonal common factor model.
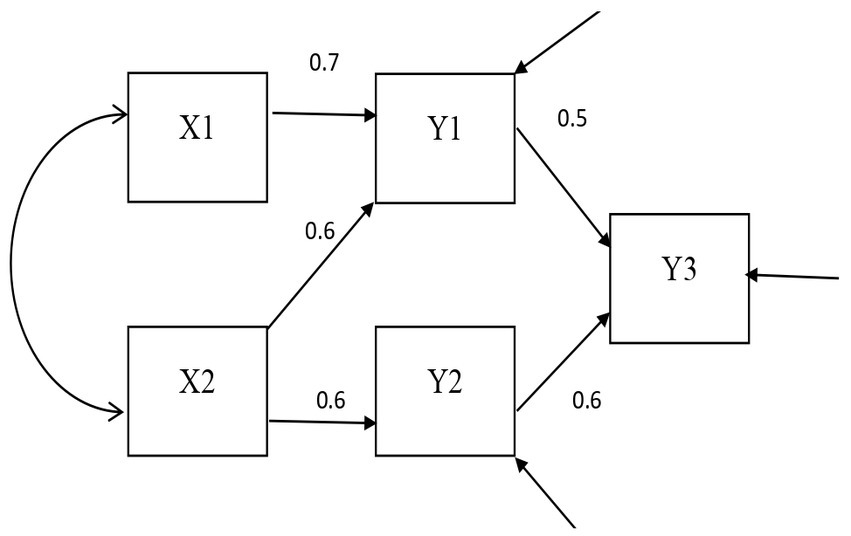
Figure 3. The correctly specified path model.
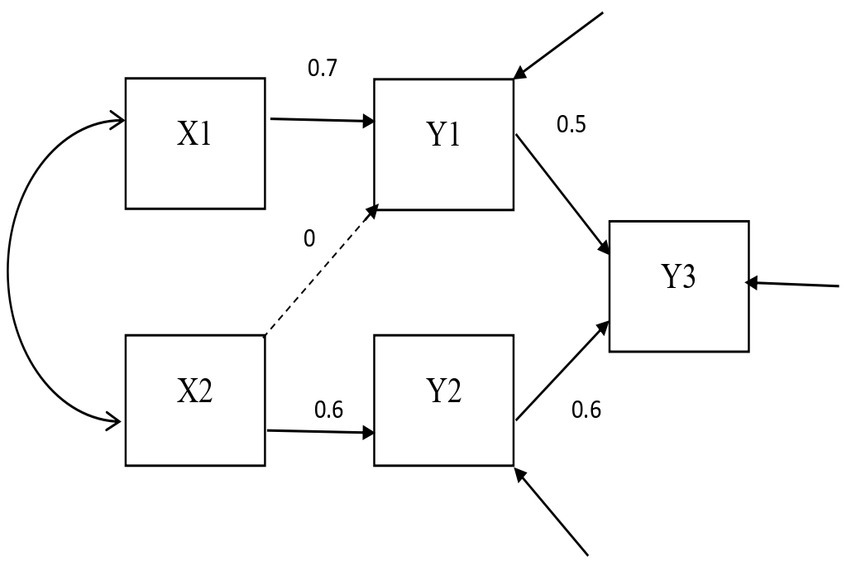
Figure 4. The misspecified path model.
2.3 Implementation
Data were simulated in R v3.4.1 (R Core Team, 2017) with three different sample sizes: 200, 400, and 600. Four proportions of target cases to the number of non-target cases were applied: 0.10, 0.05, 0.02, and 0.01. The sample size and proportion of target cases were fully crossed for a factorial design with 12 conditions. The correctly specified models and misspecified models in both studies were fitted to the data using the R package lavaan (Rosseel, 2012). The default boxplot criterion was used to determine cases with high influence (Pastore and Altoé, 2022). The cut-off that determined multivariate outlier cases using MD was 12. A preliminary cut-off for DOCR was set at 0.01. The miss rate (MR) is the ratio of missed target cases to generated target cases, and the false alarm rate (FAR) is the ratio of flagged non-target cases to generated non-target cases. Their 95% confidence intervals were computed for each statistic for each replication using R package psych (Revelle, 2023). Results were averaged over 100 replications in R with confidence intervals computed using the standard error of the mean and the inverse t distribution. Averages were compared across different statistics and systematic manipulations of the conditions. Example R syntax for computing DOCR, as well as gCD and MD, has been provided in Appendix A. The example in Appendix A has been expanded from the package “influence.SEM” (Pastore and Altoé, 2022).
3 Results
The Study 1 results with the confirmatory factor analysis models are shown in Tables 1, 2, and the Study 2 results with the path analysis models are shown in Tables 3, 4. Tables 1, 3 summarize the miss rates of the three measures, MD, DOCR, and gCD, by sample size. The DOCR measure had the smallest miss rates compared to MD, gCD-CS, and gCD-MS for all sample sizes and under the four proportions of the target cases to non-target cases. In addition, the miss rate of the DOCR increased significantly as the sample size increased from 200 to 600 under all proportions of target cases to non-target cases. On the other hand, the miss rates of the MD and gCD remained the same when the sample size increased from 200 to 600 since their miss rates did not differ significantly with the increase in sample size for all proportions of target cases to non-target cases.
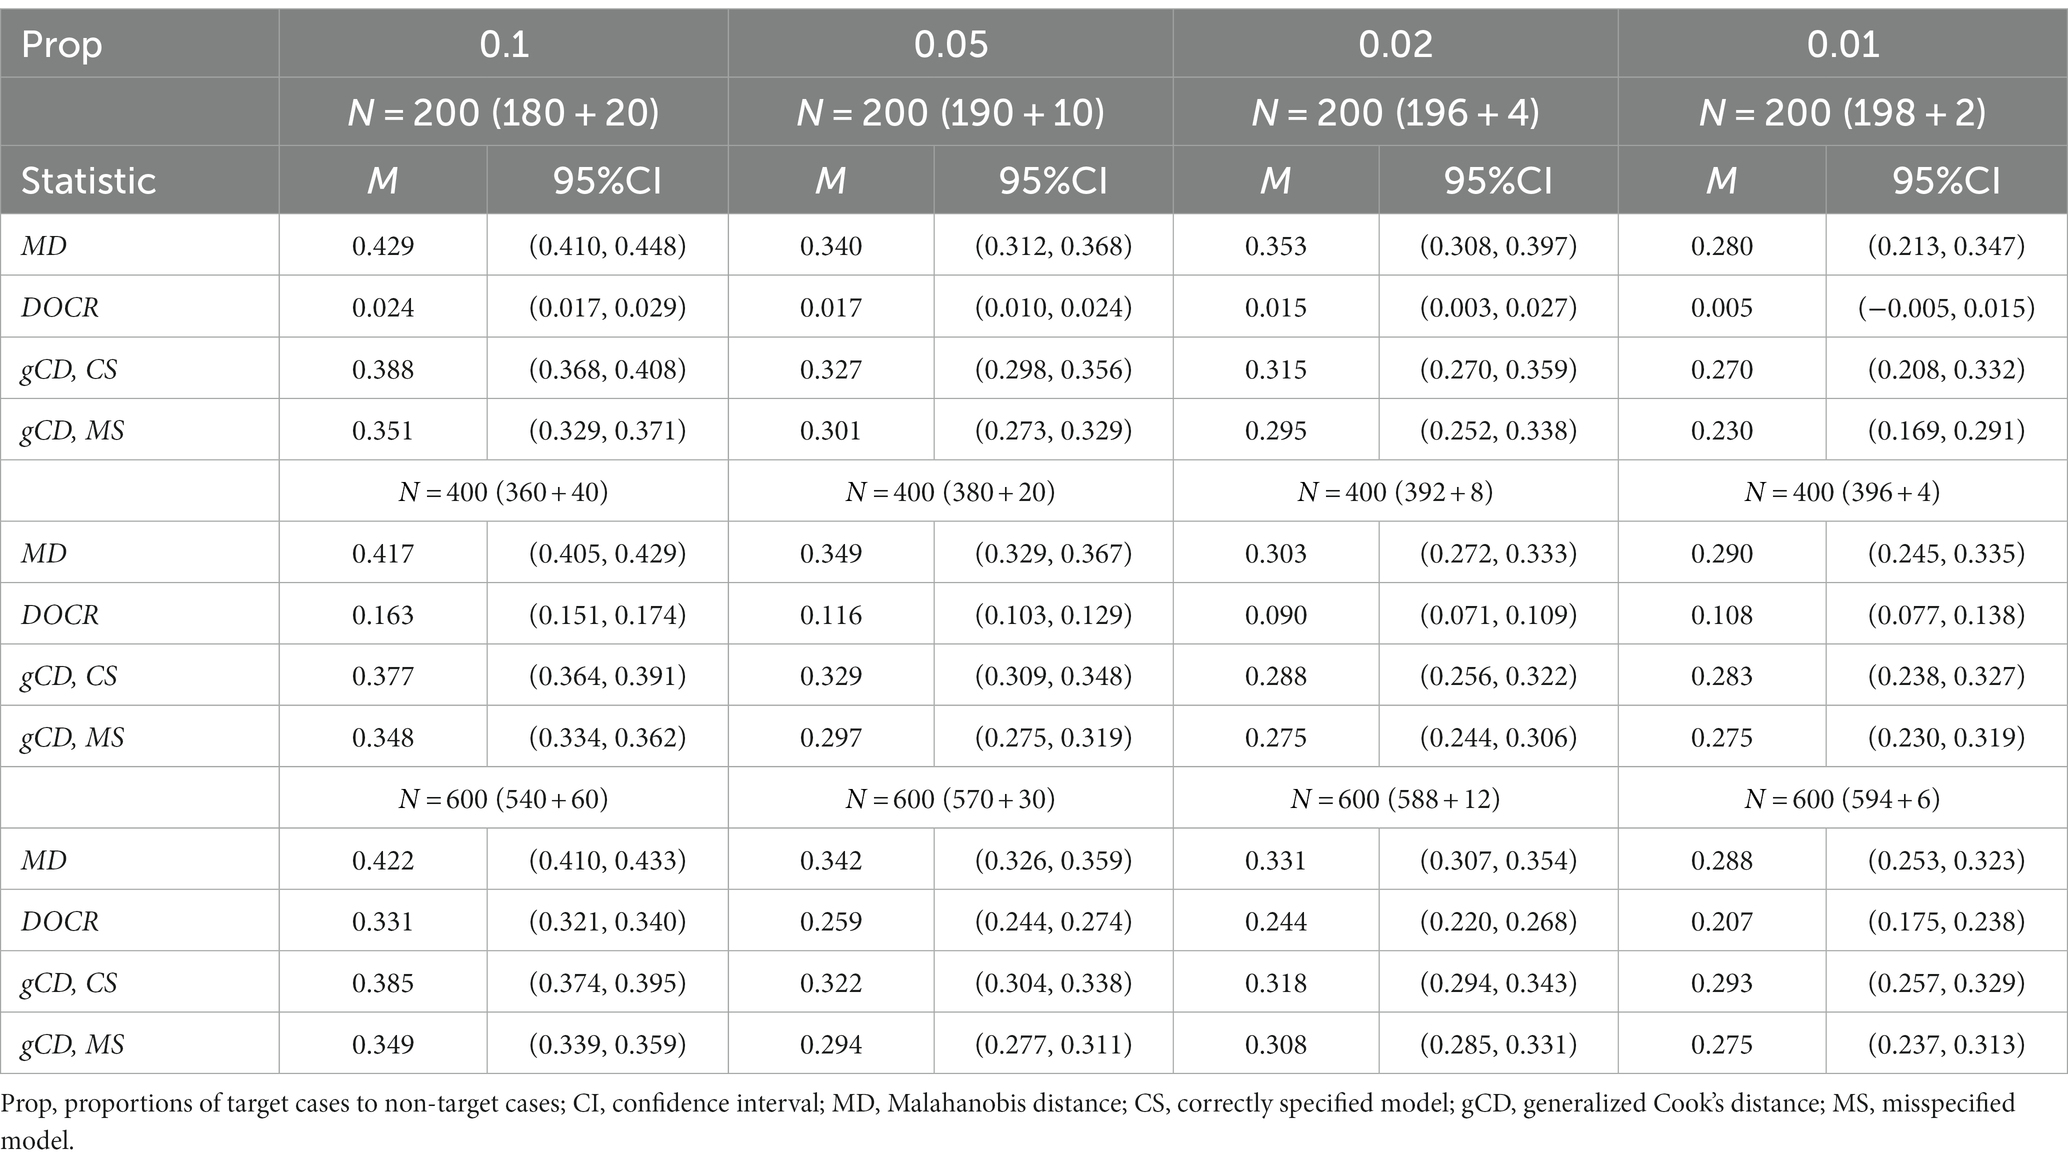
Table 1. Miss rates for three case detection statistics by proportions of the target to non-target cases for the CFA model.
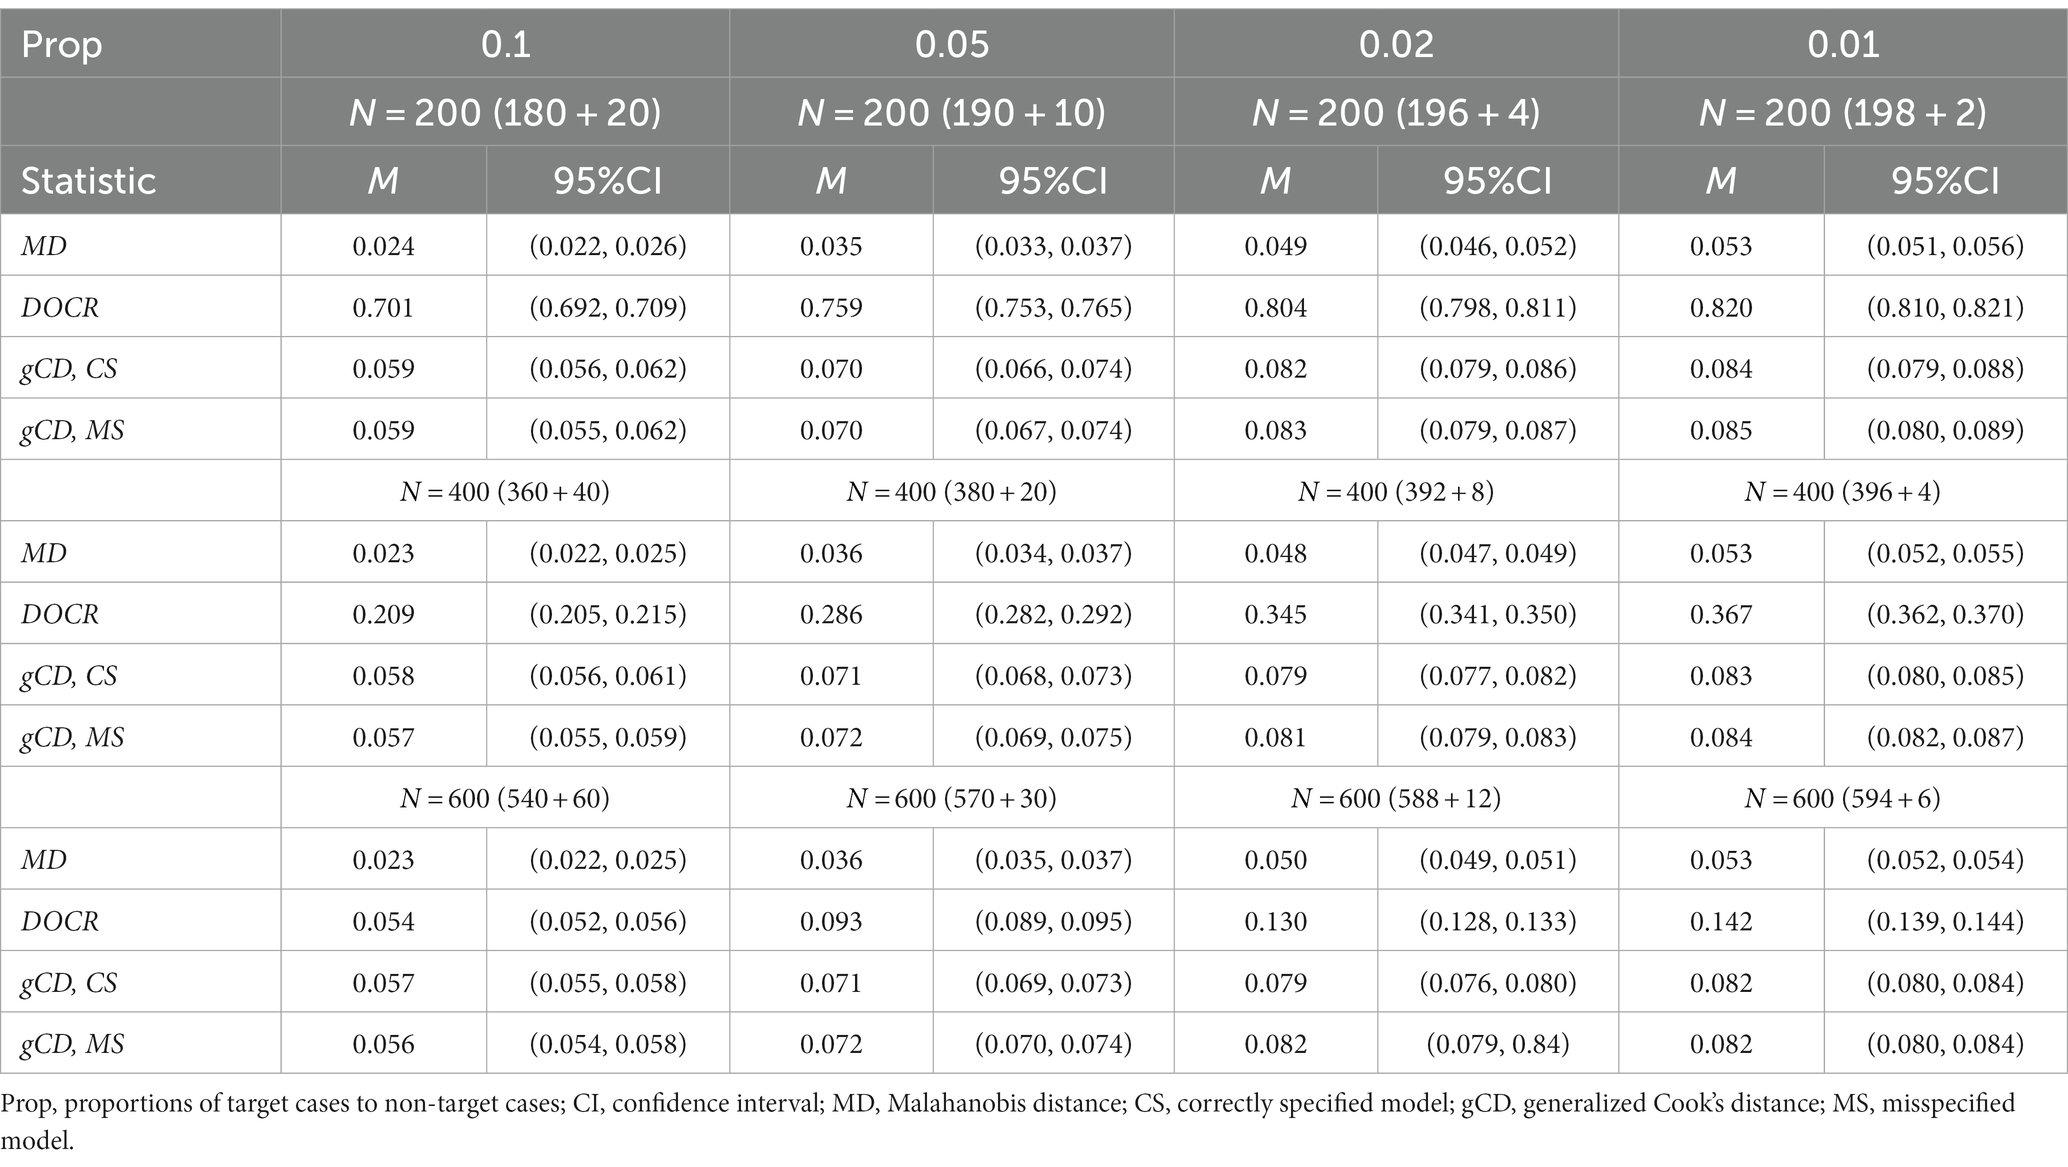
Table 2. False alarm rates for three case detection statistics by proportions of the target to non-target cases for the CFA model.
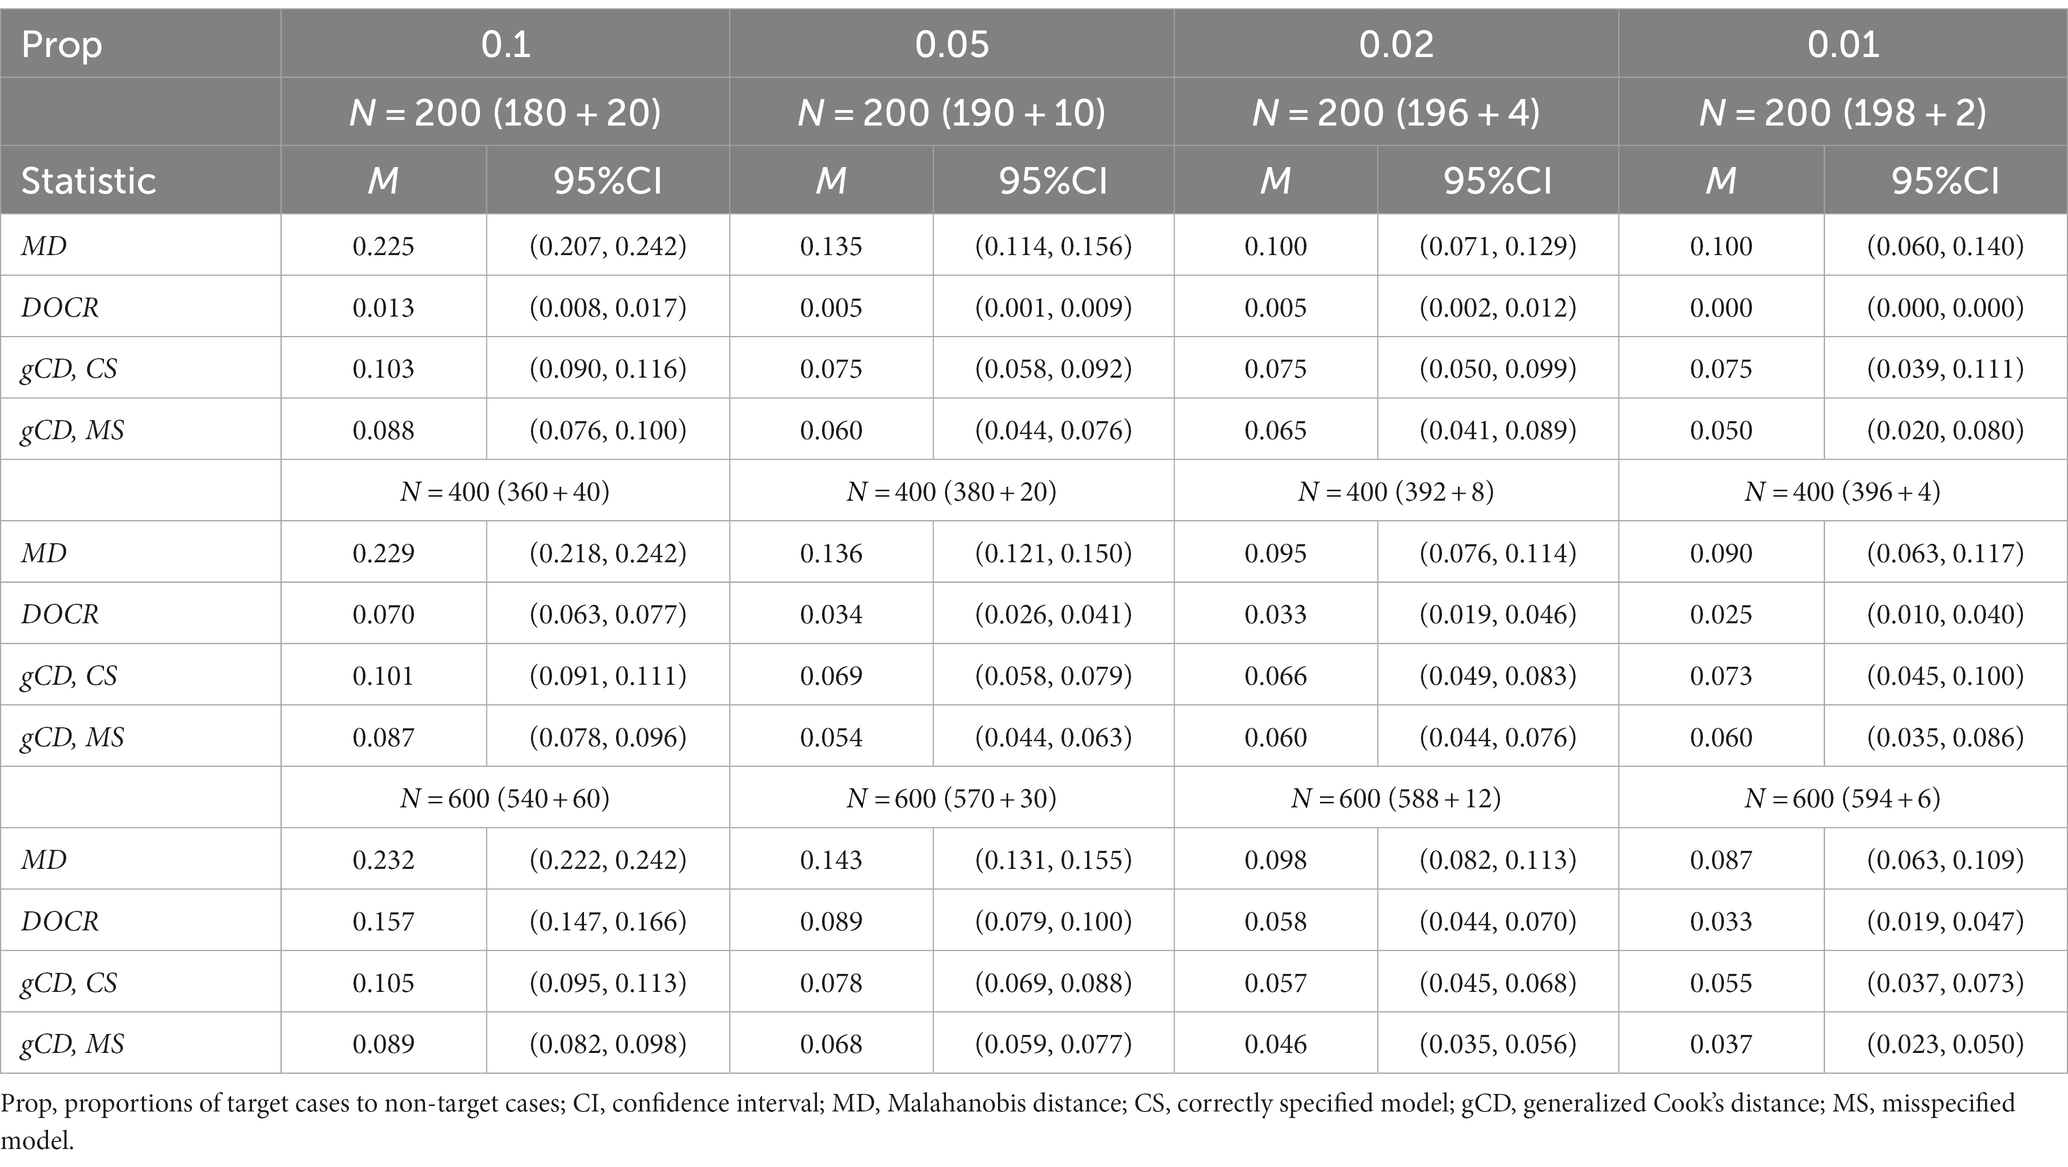
Table 3. Miss rates for three case detection statistics by proportions of target cases to non-target cases for the path model.
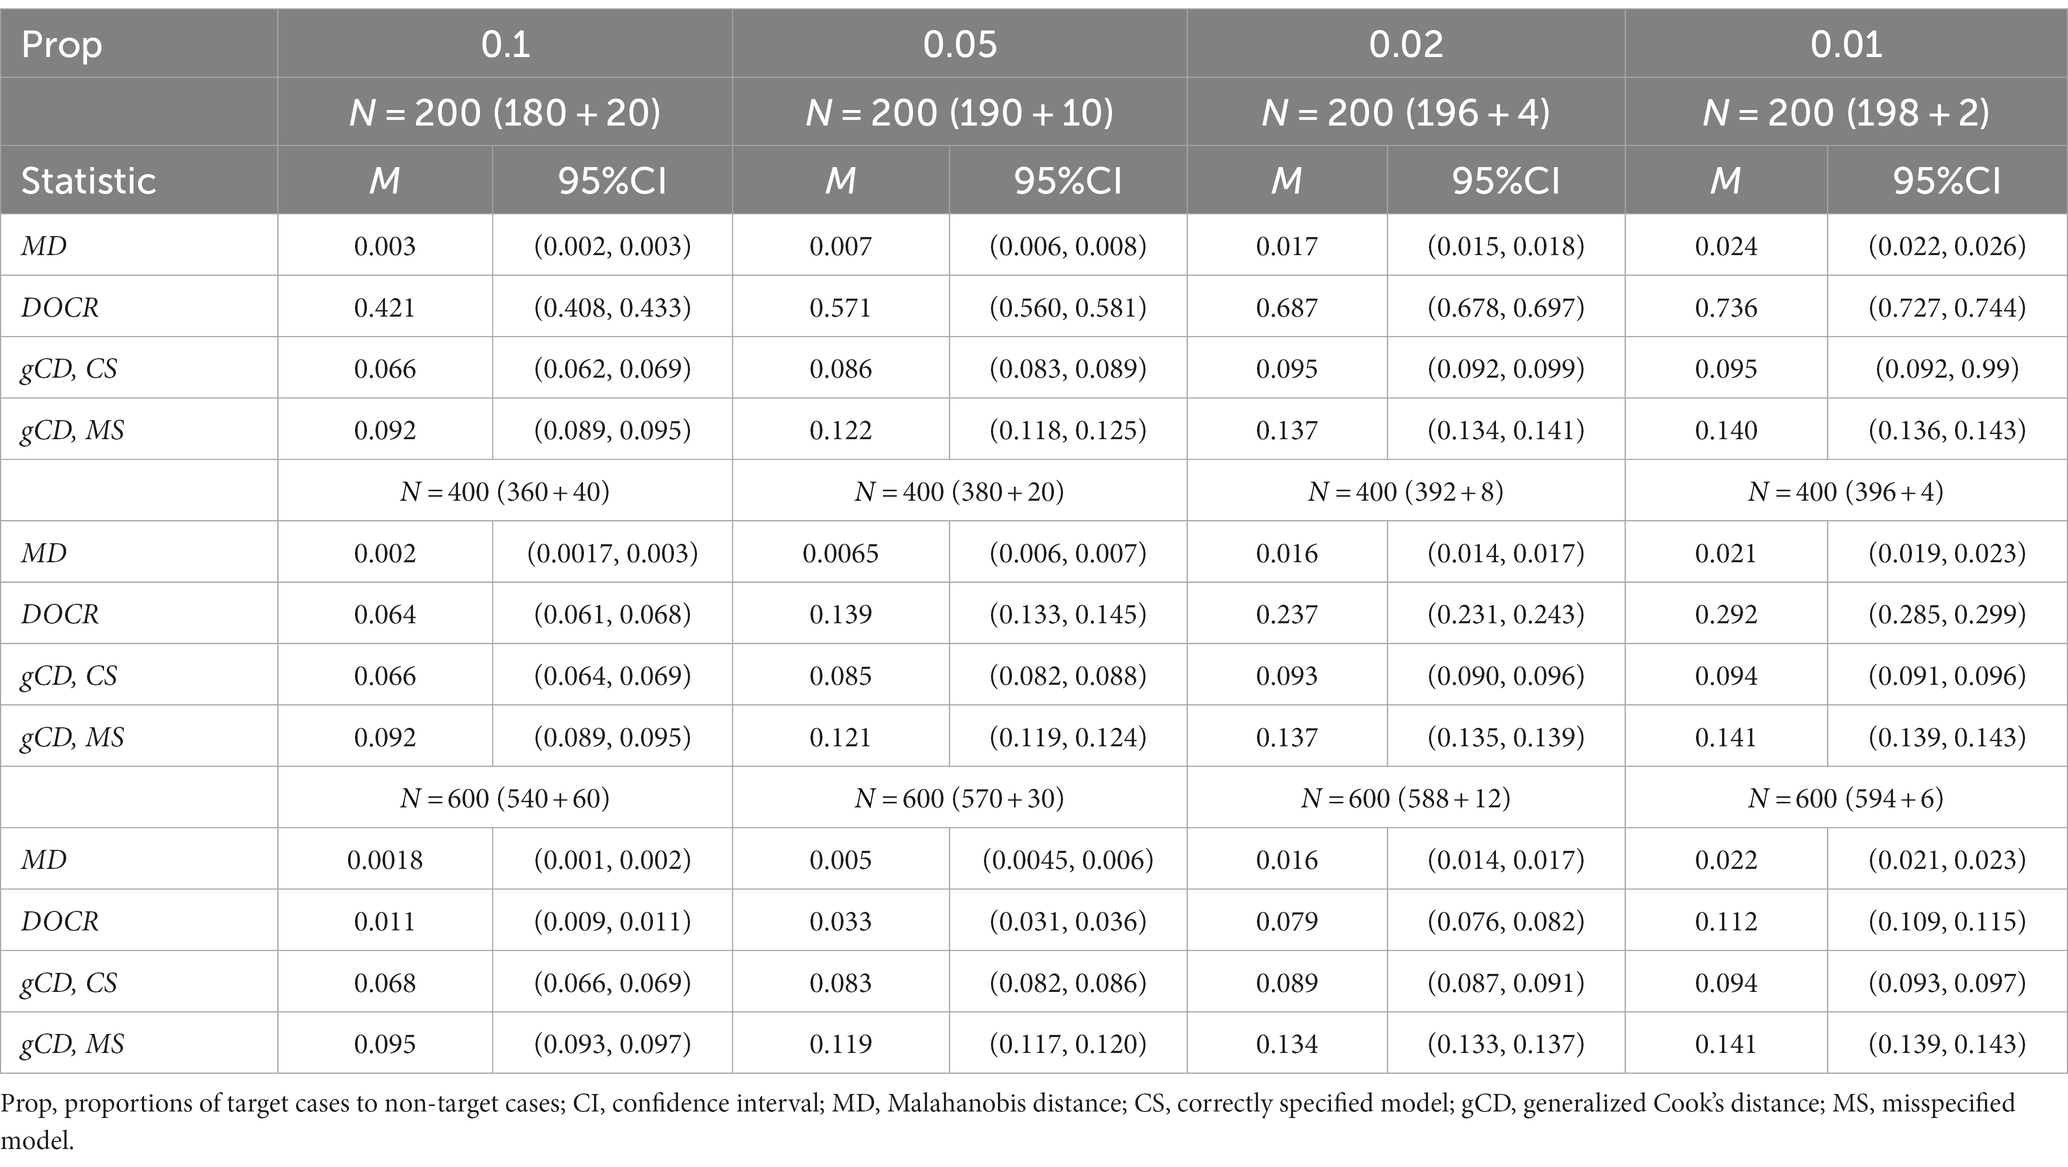
Table 4. False alarm rates of three case detection statistics by proportions of target cases to non-target cases for the path model.
Tables 1, 3 show that the miss rate of the DOCR decreased as the proportion of target cases to non-target cases decreased. The DOCR measure also showed the same pattern of performance under all proportions of target cases to non-target cases through all sample sizes. Similarly, the MD and gCD measures showed the same pattern of performance under all proportions of target cases to non-target cases. However, the pattern of performance for the three measures (MD, DOCR, and gCD) was not always statistically significant, mainly when the sample size was small.
Tables 2, 4 show the false alarm rates of the three measures, MD, DOCR, and gCD, by sample size. As these tables show, the DOCR measure had the highest false alarm rates compared to MD, gCD–CS, and gCD–MS for all sample sizes and under the four proportions of the target cases to non-target cases. Unlike the miss rate, the false alarm rate of the DOCR decreased as the sample size increased from 200 to 600 under all four proportions of target cases to non-target cases. In addition, the false alarm rate of the DOCR measure differed significantly with the increase in sample size. In other words, there was a significant decrease in the false alarm rate of the DOCR measure with the increase in sample size. Conversely, the false alarm rates of the MD and gCD measures did not change significantly with the increase in sample size.
Tables 2, 4 show that the false alarm rate of the DOCR increased as the proportion of target cases to non-target cases decreased. The DOCR and MD measures reflected the same performance pattern under all four proportions of target cases to non-target cases through all sample sizes. That is, within the same sample size, the false alarm rates of the DOCR and MD increased significantly as the proportion of the target cases to non-target cases decreased. Similarly, the gCD measure reflected the same performance pattern under all proportions of target cases to non-target cases. However, this performance pattern was not always statistically significant, mainly when the small sample size was relatively small.
4 Discussion
This study introduced the DOCR, a new model-free case influence measure appropriate for SEM analysis. Two simulation studies compared the performance of the DOCR with the performance of two other statistics that may be employed to screen cases in this context. The first was gCD, which is a model-based measure of case influence. Like other similar model-based case influence measures, such as likelihood distance and chi-square difference, gCD is sensitive to model misspecification. The greater the extent of the model misspecification, the less accurately gCD will identify influential cases.
The new DOCR statistic was also compared with the performance of MD. MD is a model-free measure. Thus, it is not sensitive to model misspecification. However, MD is a measure of outlying status rather than case influence. Thus, this statistic is less appropriate for detecting cases that will ultimately influence the model results.
The DOCR overcomes problems with both of these alternative measures employed to screen cases in SEM analysis. The DOCR is model-free. Thus, it is not sensitive to model misspecification. The DOCR is also a true case influence measure for SEM analysis, in which the model is fit to the sample covariance matrix. By detecting cases that exert a strong influence on the covariance matrix, the DOCR detects cases that will impact the results for the model fit to that covariance matrix.
The results of the two simulation studies suggest that more work is needed to find the optimal cut point for the DOCR. The DOCR performed better than the other measures in flagging target cases because it recorded the lowest miss rate across all conditions. However, the false alarm rate of the DOCR was not reasonable since it incorrectly flagged 42–80% of cases as target cases under a sample size of 200 cases. Although this percentage dropped to 10–30% when the sample size increased, it was still not satisfactory compared to other measures.
With all such measures, there is a compromise between the miss rate and the false alarm rate. Thus, the values of the false alarm rate for the DOCR can be made more reasonable by adjusting the cut point to yield a better balance between the miss rate and the false alarm rate. Since establishing a criterion cut point for the DOCR measure was outside the scope of this study, it is recommended that future studies establish an optimal cut point criterion for this measure.
The results of the two simulation studies also suggest that the DOCR is sensitive to sample size. The DOCR’s miss rate increased, and the false alarm rate decreased significantly with an increase in sample size, while the miss rate and false alarm rate of MD and gCD remained the same. This finding was consistent with previous studies. Previous studies have noted how sample size may affect the performance of case influence measures because the influence of the individual case is weighted by the inverse of the sample size (Pek and MacCallum, 2011). Therefore, a large influence is expected from individual cases in small samples. The findings of this study were consistent with studies that showed the performance of some measures, such as chi-square, that were extremely sensitive to sample size (Boomsma, 1982; Fan et al., 1999). Future studies should investigate methods for reducing the sensitivity of the DOCR to sample size.
Given these two limitations, practitioners are recommended not to use the DOCR measure with overly small sample sizes (i.e., N ≤ 200) or overly large sample sizes (i.e., ). Instead, practitioners should use the range of sample sizes recommended for SEM studies (Kline, 2016) to obtain the best performance of the DOCR measure. Care should be exercised in investigating the cases that are flagged, considering that some of the influential cases identified may be due to sampling variability alone. However, used within these guidelines, the DOCR shows promise as a model-free case influence measure appropriate for SEM analysis due to its ability to overcome the limitations of existing measures. Example R syntax for computing DOCR has been provided in the Appendix.
Data availability statement
The raw data supporting the conclusions of this article will be made available by the authors, without undue reservation.
Author contributions
FJ and JK designed the study and created the routine. FJ contributed to the write-up of the manuscript, the R code for the DOCR and other indices, the analysis of the data, and summarizing the results. JK contributed to the write-up of the manuscript and to the improvement of all sections of this manuscript. All authors contributed to the article and approved the submitted version.
Conflict of interest
The authors declare that the research was conducted in the absence of any commercial or financial relationships that could be construed as a potential conflict of interest.
Publisher’s note
All claims expressed in this article are solely those of the authors and do not necessarily represent those of their affiliated organizations, or those of the publisher, the editors and the reviewers. Any product that may be evaluated in this article, or claim that may be made by its manufacturer, is not guaranteed or endorsed by the publisher.
Supplementary material
The Supplementary material for this article can be found online at: https://www.frontiersin.org/articles/10.3389/fpsyg.2023.1245863/full#supplementary-material
References
Atkinson, A. C. (1981). Two graphical displays for outlying and influential observations in regression. Biometrika 68, 13–20. doi: 10.1093/biomet/68.1.13
Belsley, D. A., Kuh, E., and Welsch, R. E. (1980). Regression Diagnostics: Identifying Influential Data and Sources of Collinearity, Vol. 571. Hoboken, New Jersey: John Wiley & Sons.
Bollen, K. A., and Arminger, G. (1991). Observational residuals in factor analysis and structural equation models. Sociol. Methodol. 21, 235–262. doi: 10.2307/270937
Boomsma, A. (1982). “The robustness of LISREL against small sample sizes in factor analysis models” in Systems under Indirect Observation: Causality, Structure, Prediction. eds. K. G. Jöreskog and H. Wold (Amsterdam: North-Holland), 149–173.
Cook, R. D. (1977). Detection of influential observation in linear regression. Technometrics 19, 15–18. doi: 10.1080/00401706.1977.10489493
Cook, R. D. (1986). Assessment of local influence. J. R. Stat. Soc. Series B 48, 133–155. doi: 10.1111/j.2517-6161.1986.tb01398.x
Cook, R. Dennis, and Weisberg, Sanford. Residuals and Influence in Regression. New York: Chapman and Hall, (1982).
De Maesschalck, R., Jouan-Rimbaud, D., and Massart, D. L. (2000). The Mahalanobis distance. Chemom. Intell. Lab. Syst. 50:18. doi: 10.1016/S0169-7439(99)00047-7
Fan, X., Thompson, B., and Wang, L. (1999). Effects of sample size, estimation methods, and model specification on structural equation modeling fit indexes. Struct. Equ. Model. Multidiscip. J. 6, 56–83. doi: 10.1080/10705519909540119
Friendly, M., Fox, J., Chalmers, P., Monette, G., and Sanchez, G. (2022). Matlib: Matrix Functions for Teaching and Learning Linear Algebra and Multivariate Statistics. R package version 0.9.6.
Kline, R. B. (2016). Principles and Practice of Structural Equation Modeling (4th ed.). New York, NY: The Guilford Press.
Lee, S.-Y., and Wang, S.-J. (1996). Sensitivity analysis of structural equation models. Psychometrika 61, 93–108. doi: 10.1007/BF02296960
Mahalanobis, P. C. (1936). On the generalized distance in statistics. Proc. Natl Inst. Sci. India 2, 49–55.
Pastore, M., and Altoé, G. (2022). Influence. SEM: Case Influence in Structural Equation Models. R package version 2.3. Available at: https://CRAN.R-project.org/package=influence.SEM
Pek, J., and MacCallum, R. C. (2011). Sensitivity analysis in structural equation models: cases and their influence. Multivar. Behav. Res. 46, 202–228. doi: 10.1080/00273171.2011.561068
R Core Team (2017). R: A Language and Environment for Statistical Computing. Available at: https://www.R-project.org/
Reise, S. P., and Widaman, K. F. (1999). Assessing the fit of measurement models at the individual level: a comparison of item response theory and covariance structure approaches. Psychol. Methods 4, 3–21. doi: 10.1037/1082-989X.4.1.3
Revelle, W. (2023). psych: Procedures for Psychological, Psychometric, and Personality Research. Northwestern University, Evanston, Illinois. R package version 2.3.12. Available at: https://CRAN.R-project.org/package=psych
Rosseel, Y. (2012). Lavaan: an R package for structural equation modeling. J. Stat. Softw. 48, 1–36. doi: 10.18637/jss.v048
Rousseeuw, P. J., and Van Zomeren, B. C. (1990). Unmasking multivariate outliers and leverage points. J. Am. Stat. Assoc. 85, 633–639. doi: 10.1080/01621459.1990.10474920
Sterba, S. K., and Pek, J. (2012). Individual influence on model selection. Psychol. Methods 17, 582–599. doi: 10.1037/a0029253
Yuan, K.-H., and Bentler, P. M. (1998). Structural equation modeling with robust covariances. Sociol. Methodol. 28, 363–396. doi: 10.1111/0081-1750.00052
Yuan, K.-H., and Zhang, Z. (2012). Structural equation modeling diagnostics using R package semdiag and EQS. Struct. Equ. Model. Multidiscip. J. 19, 683–702. doi: 10.1080/10705511.2012.713282
Yuan, K.-H., and Zhong, X. (2008). 8. Outliers, leverage observations, and influential cases in factor analysis: using robust procedures to minimize their effect. Sociol. Methodol. 38, 329–368. doi: 10.1111/j.1467-9531.2008.00198.x
Keywords: influence analysis, deletion statistics, Mahalanobis distance, generalized Cook’s distance, Deleted-One-Covariance-Residual (DOCR)
Citation: Jaffari F and Koran J (2024) Model-free measurement of case influence in structural equation modeling. Front. Psychol. 14:1245863. doi: 10.3389/fpsyg.2023.1245863
Edited by:
Nikolaos Tsigilis, Aristotle University of Thessaloniki, GreeceReviewed by:
Zhenqiu Lu, University of Georgia, United StatesMichalis Linardakis, University of Crete, Greece
Copyright © 2024 Jaffari and Koran. This is an open-access article distributed under the terms of the Creative Commons Attribution License (CC BY). The use, distribution or reproduction in other forums is permitted, provided the original author(s) and the copyright owner(s) are credited and that the original publication in this journal is cited, in accordance with accepted academic practice. No use, distribution or reproduction is permitted which does not comply with these terms.
*Correspondence: Fathima Jaffari, Zi5qYWZmYXJpQGV0ZWMuZ292LnNh