 Erhua Zhang1
 Feifan Yu
 Ting Jiang
 Shouzhen Zeng
94% of researchers rate our articles as excellent or good
Learn more about the work of our research integrity team to safeguard the quality of each article we publish.
Find out more
ORIGINAL RESEARCH article
Front. Psychol. , 15 March 2023
Sec. Quantitative Psychology and Measurement
Volume 14 - 2023 | https://doi.org/10.3389/fpsyg.2023.1152333
This article is part of the Research Topic Data-Driven Behavioral Decision-Making Innovation and Application View all 4 articles
Introduction: Common prosperity is a major research project in China, and the scientific measurement and evaluation of common prosperity is very important.
Methods: In this study, firstly, we construct a comprehensive evaluation index system for the common prosperity level (CPL). We then develop an evaluation model of CPL based on prospect theory, probabilistic linguistic ordered weighted distance measure, and the TOPSIS method, wherein we use a probabilistic linguistic term set (PLTS) to describe the uncertainty and complexity of the assessment process. Above all, we use prospect theory to reflect the preferences of experts to meet the unique needs for the evaluation of common prosperity. Moreover, we apply the proposed evaluation index system and model to evaluate the CPL of Zhejiang Province, China's first common prosperity demonstration zone, as an example to conduct relevant research. The advantages and effectiveness of the proposed method are verified by the sensitivity and comparative analysis.
Results: The findings prove that the application of the new PLTS evaluation framework in CPL assessment is robust.
Discussion: We propose specific suggestions for improving the development of common prosperity.
The idea of common prosperity in China can be traced back to the Spring and Autumn and the Warring States Periods, approximately 2,000 years ago. Originally, it represented absolute egalitarianism. However, in contemporary China, the purpose of common prosperity is to promote fair income distribution and improve people's living standards, which also includes ideas such as sharing and development (Chen et al., 2022). In the existing research, some scholars highlight that social progress should simultaneously examine the overall development level and the living conditions of people with low standards of living (Kakwani et al., 2022; Zhang J. et al., 2022). Therefore, common prosperity is the achievement of a well-fed standard of living for all members of society. It is a differential wealth based on universal wealth but not egalitarianism. Common prosperity is the integration of two aspects—common and prosperity. The latter can be expressed as the abundance of social wealth and advanced productivity. Common prosperity means that members of society achieve a good standard of living through labor, thereby eliminating the polarization between the rich and the poor (Qian et al., 2021).
Common prosperity is an important requirement of socialism and an essential feature of Chinese-style modernization (Ja, 2022). The practice of common prosperity in China spans two centuries. As early as the 1950s, it is frequently mentioned by the Chinese government. The implementation of reform and opening up and the slogan first wealth to drive wealth later indicate that the construction of common prosperity has entered a new stage (Kong, 2022). In recent years, in the context of building a moderately prosperous society in China, the government is vigorously promoting the ideal of achieving common prosperity. In 2021, Zhejiang province was designated a common prosperity demonstration zone, shouldering the important historical mission of developing and building a high-quality and common prosperity area.
However, exploring the implementation and development of the common prosperity level (CPL) is more complicated than addressing other practical problems. In the context of modern research problems of increasing depth, there are obvious restrictions on traditional evaluation methods based on accurate values. The main reason is that the accurate evaluation information makes it difficult to describe policymakers' preferences for indicators and programs and also does not reveal the uncertainty of prospects. In the face of relatively complex evaluation objects, evaluators or decision-makers may be hesitant to evaluate, which leads to the lack of a certain basis for the results. Therefore, the traditional evaluation methods based on accurate values have obvious shortcomings in dealing with complex problems; that is, the data in the evaluation process cannot be completely and accurately obtained in practical cases. Therefore, we adopt the fuzzy evaluation method in which experts describe their evaluations and preferences through various fuzzy assessments in a complex multi-index comprehensive evaluation environment.
The fuzzy set theory (Zadeh, 1965) was first invented by Zadeh in 1965. Later, fuzzy evaluation branch methods evolved, including using language variables (Zadeh, 1974), which is one of the more understandable methods to represent fuzzy concepts. To solve the problem of choosing among multiple linguistic terms, Rodriguez combined the linguistic term set (Rodriguez et al., 2012) and the hesitant fuzzy set (Torra, 2010) and proposed a hesitant fuzzy linguistic term set (HFLTS) that includes multiple linguistic variables of the same weight. However, due to the limitations of the weights of linguistic terms, HFLTSs lack applicability in practical problems that need to reflect different degrees of importance. Therefore, considering the diversity and flexibility of linguistic information expression, Pang et al. (2016) proposed a probability linguistic term set (PLTS) by introducing probability information based on the HFLTS. PLTS has been widely used for its special advantages, such as project evaluation (Peng et al., 2020; Shen et al., 2020), environmental impact assessment (Tian et al., 2020; Su et al., 2023), and text sentiment analysis (Song et al., 2020; Yu and Pan, 2021).
Considering the great fuzziness of the concept of common prosperity, there exist difficulties in determining the weight of fuzzy indicators when using fuzzy evaluation to solve the problem of common prosperity. While prospect theory (Kahneman and Tversky, 1979) has a good performance in dealing with such problems, which is specifically embodied in that it can reflect the different psychological characteristics of decision-makers when they face gains and losses in actual decisions. Prospect theory can help people make decisions under uncertain circumstances and can reflect the preferences of decision-makers. Hence, prospect theory has attracted extensive attention and has been gradually applied in various areas, so it is introduced in the process of CPL evaluation and the fuzzy set theory in this study.
Similar to other evaluation problems (Zeng et al., 2013a, 2017), using the classic distance between PLTS as the basis for the evaluation and measurement of CPL problems is inadequate. Therefore, we need to explore a suitable distance measure to handle the CPL problems. There exist various distance metrics to choose from when the decision-maker makes a decision, such as the Minkowski distance (Merigó and Gil-Lafuente, 2008), Hamming distance (Hamming, 1950), and ordered weighted distance (OWD) (Xu and Chen, 2008; Merigo and Casanovas, 2011). Among these, the OWD, a useful extension of the ordered weighted operator (OWA) (Yager, 1988), has the advantage of obtaining better results and reaching a consensus faster. Then, the weight of the OWD measure can be set according to the requirements of the problem to enhance or alleviate the influence of large or small differences in the integrated results. In addition, Xu and Xia (2011) combined the OWD method with a hesitant fuzzy case and extended the theory of hesitant fuzzy OWD. Zeng et al. (2013a) extended the OWD to an intuitionistic fuzzy environment and proposed the intuitionistic fuzzy OWD measure. Recently, Liu et al. (2022) proposed a combination of PLTS and OWD and developed the probabilistic linguistic term OWD (PTLOWD) measure enriching distance theory in the context of PLTSs. Additional extensions and research concerning the OWD measure are available (Zeng et al., 2012, 2013b, 2017, 2023; Peng et al., 2014; Dai, 2020; Yang et al., 2022).
Based on the above literature review, we find that there are still few studies on the application of the prospect theory in the direction of PLTOWD. In this study, the prospect theory endows the PLTOWD operator with the ability to consider the influence of psychological factors on experts in decision-making procedures, meaning that it can overcome the subjective value cognition caused by decision anticipation to reflect the preference of decision-makers.
The gap between rural and urban areas has been narrowing, and the residents' happiness index has steadily increased, indicating that the common prosperity of Zhejiang province has begun to materialize. However, we identified the following several issues to be addressed as follows:
(1) The CPL evaluation process is ambiguous and complex, and a scientific evaluation index system for the level of common prosperity is required.
(2) The improvement of the overall prosperity of Zhejiang province does not mean that all prefecture-level cities have reached this level, and there is a lack of an effective method for common prosperity evaluation in complex environments.
(3) The existing PLTOWD has the disadvantage of not considering the preferences of the decision-makers.
Therefore, we select the prospect theory to solve the current drawback in this study. Furthermore, we apply the PTLTOWD measure to the TOPSIS model to evaluate the common prosperity level of cities in Zhejiang province. We derive an evaluation of construction experience and institutional models, leading to scientific and objective conclusions. The contributions of this study are reflected in the following four aspects:
(1) We build a set of scientific evaluation index systems for the development of common prosperity;
(2) We propose a new PLTOWD measure based on prospect theory;
(3) We present a new evaluation framework based on the proposed PTPLTOWD measure to TOPSIS;
(4) We extend the application of the presented method to the field of common prosperity evaluation and use it to evaluate the common prosperity level of cities in Zhejiang province, obtaining a scientific evaluation result.
The rest structure of this manuscript is organized as follows: Section 2 presents a basic knowledge review. In section 3, the comprehensive evaluation index system for CPL is introduced. Section 4 offers a new evaluation framework based on PTPLTOWD and TOPSIS tool. Section 5 provides an empirical test on the common prosperity practice in Zhejiang province in China. Section 6 offers conclusions, main limitations, and future directions.
We introduce some basic concepts of PLTSs and then outline the concepts of PLTOWD and prospect theory in this section.
Definition 1 (Pang et al., 2016): Let S = {sα |α = 0, 1, 2, ⋯ , τ } be a language term set (LTS); then, a probabilistic linguistic term set (PLTS) is defined as follows:
where L(k) (p(k)) denotes the language term L(k) with probability information p(k) and #L(p) is the number of different language terms in set L(p ).
Definition 2 (Pang et al., 2016): Given a PLTS (p), satisfying the condition: , then its associated PLTS
is called the standardized set of PLTSs, where .
Definition 3 (Pang et al., 2016): Suppose L1 (p) and L2 (p) are two different PLTSs denoted as and , respectively. #L1 (p) and #L2 (p) represent the number of language terms in L1 (p) and L2 (p), respectively. For #L1 (p) > #L2 (p), we add #L1 (p)−#L2 (p) terms to L2 (p), making the number of language terms in L1 (p) and L2 (p). The newly added language term is the smallest in L2 (p), and its probability is 0.
Definition 4 (Pang et al., 2016): Let L(p) = {L(k) (p(k))|k = 1, 2, ⋯ #L(p) } be a PLTS and r(k) be the subscript of the language term L(k). Then, the score function of L (p) is defined as follows:
Among them, .
Definition 5 (Pang et al., 2016): Let L(p) = {L(k) (p(k))|k = 1, 2, ⋯ #L(p)} be a PLTS and r(k) be the subscript of the language terms L(k), , and . Then, we can define the deviation function L (p) as follows:
Definition 6 (Pang et al., 2016): Let Li (p) (i = 1, 2) be any two PLTSs, then
(1) If E (L1 (p)) > E (L2 (p)), then L1 (p) ≻ L2 (p) ;
(2) If E (L1 (p)) = E (L2 (p)), then
(a) If σ (L1 (p)) > σ(L2 (p)), then L1 (p) ≺ L2 (p );
(b) If σ (L1 (p)) = σ(L2 (p)), then L1 (p) ~ L2 (p ).
Definition 7 (Pang et al., 2016): Assuming that given a set of probabilistic linguistic terms , where #L1 = #L2, the Hamming distance of L1 (p) and L2 (p) is as follows:
Given a probabilistic linguistic vector Li = (Li1 (p), Li2 (p), ⋯ , Lin (p)) (i = 1, 2), the weighted Hamming distance of L1 and L2 is as follows:
where d (L1j (p), L2j (p)) is the Hamming distance of L1j (p) and L2j (p), and ωj is the corresponding weight that satisfies ωj ∈ [0, 1] and .
The current method for the probabilistic linguistic distance measurement is complicated and tedious. In this context, the PLTOWD operator is introduced (Liu et al., 2022). PLTOWD can simplify the operation between elements of probabilistic linguistic terms, thereby improving operational efficiency. Assuming that L1 (p) and L2 (p) are two PLTSs, then
is the ordered weighted distance of the PLTSs a and b, where is the weight vector associated with the PLTOWD measure satisfying ωj ∈ [0, 1] and . The subscript (σ (1), σ (2), ⋯ , σ (n)) is a permutation of (1, 2, ⋯ , n) such that d (aσ(j−1), bσ(j−1)) ≥ d (aσ(j), bσ(j)), where dPLT (aj, bj) is the distance between the probabilistic linguistic terms aj and bj.
Prospect theory describes the psychological changes of decision-makers when gains or losses are contemplated, thereby showing changes in subjective value perceptions and reflecting the preferences of decision-makers. The specific form of the prospect theory value function is defined as follows (Kahneman and Tversky, 1979):
where Δx is the size of the deviation of x from a certain reference point x0; Δx ≥ 0 denotes the gain; and Δx < 0 represents the loss. α, β reflects the sensitivity of decision-makers to gains and losses, while θ is the loss aversion coefficient. According to the analysis and research of Tversky and Kahneman (Tversky and Kahneman, 1992), α = β = 0.88 and θ = 2.25 iare congruent with human decision-making psychology.
Based on current research about CPL, we construct a novel evaluation index system including seven aspects (Figure 1) that can best reflect the development of common prosperity, namely, income gap, economic level, culture and recreation, infrastructure, urbanization rate, life expectancy, and employment rate in this section.
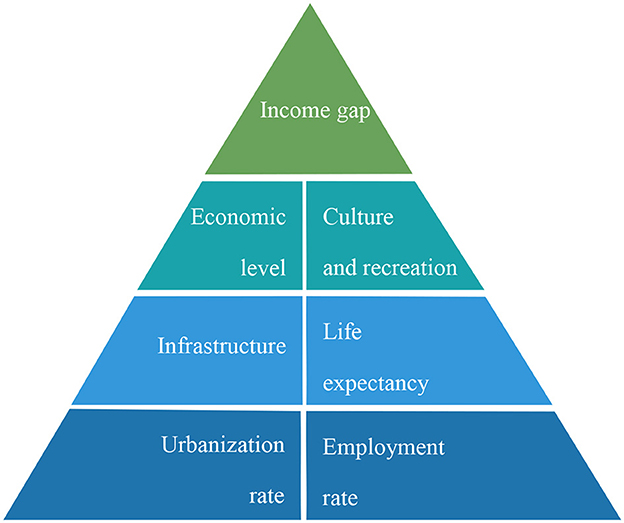
Figure 1. Evaluation system of CPL.
Common prosperity means “rich for all,” which represents the common prosperity of all the people, not the prosperity of some regions or groups. To achieve common prosperity, it is necessary to deal with the problem of unbalanced and inadequate development, and the outstanding manifestation of this problem is the income gap among citizens. In addition, the income gap significantly reflects the degree of sharing of the development fruits of common prosperity. It is an important indicator to measure the implementation effect of common prosperity (Zhao and Jiao, 2022).
Economic level: Common prosperity is based on a higher level of social productive forces, and the emancipation and development of productive forces can build a material foundation for the realization of common prosperity, which is also a prerequisite. Therefore, it is in line with our research to choose the overall economic level of society as an important evaluation index (Li et al., 2022).
While considering the material standard of living, we should also think about whether the spiritual life of citizens is rich. For example, whether the various activities, cultural exchanges, and socializing organized by the government can meet the recreational needs of citizens in their spare time (Wang et al., 2022). This is also an important dimension of the evaluation of common prosperity.
Infrastructure denotes the material engineering facilities that provide public services for social production and people's life, including water and electricity, transportation, medical care, education, and other general material conditions to ensure social survival and economic development. In modern society, the more economic and social development, the higher the demand for infrastructure; a sound infrastructure also plays a big role in achieving common prosperity and improving citizens' satisfaction (Tang et al., 2022).
The urbanization rate is a measure of the urbanization level. From the perspective of equalization of factor remuneration, with the increase of urbanization rate, the income gap between rural and urban areas will gradually narrow in the process of transferring rural labor to cities; that is, the development of urbanization will do well to narrow the income gap between rural and urban areas, thus promoting the realization of common prosperity. Therefore, the urbanization rate can be regarded as an important variable in measuring common prosperity (Guan et al., 2022).
Economic conditions and the level of healthcare limit people's longevity. The average life expectancy is a key indicator to measure the health level of the residents of a region, a country, or a nation. It can clearly reflect the quality of life of a society and is also an important embodiment of common prosperity (Pu et al., 2022).
A high employment rate indicates that people live and work in peace and contentment, which is important for increasing incomes and promoting social stability. Since the epidemic, the proportion of flexible employment in China has been on the rise, improving the employment rate and the quality of employment and contributing to the expansion of the middle-income group and the realization of common prosperity (Meng et al., 2022).
The PLTOWD measure is an effective tool for processing qualitative information and its corresponding probability or importance. Although the PLTOWD expands the distance measure of probabilistic language, it is still too rigid in algorithmic composition and thinking, ignoring the psychological conditions and preferences of decision-makers, making the overall decision flexibility limited. In view of the above considerations, we have combined PLTOWD with the prospect theory, which has clear advantages: (1) It can incorporate the psychological factors of experts in the decision-making process; (2) it accounts for the expected gains and losses of the decision generating subjective value perceptions.
In this section, combined with the prospect theory, we proposed the prospect theory PLTOWD (PTPLTOWD) operator enriching the distance theory under the condition of probabilistic linguistics and applying it to the TOPSIS method. Let A = a1, a2, ⋯ , am be the scheme set, C = c1, c2, ⋯ , cn be the attribute set, and construct a decision matrix = [Pij]m×n. The main steps of construction of the PTPLTOWD are presented below:
Step 1: Selection of reference points. When applying the prospect theory, the choice of reference points directly affects the calculation of the value function. In practice, decision-makers have different subjective preferences, thus determining different reference points.
Assumption 1: For optimistic decision-makers, when the distance measure is cost type, the decision reference point is ; when the distance measure is of the benefit type, then the decision reference point is
Assumption 2: For pessimistic decision-makers, when the distance measure is cost type, the decision reference point is ; when the distance measure is of benefit type, then the decision reference point is
Assumption 3: For neutral decision-makers, whether the distance measure is cost or benefit, the decision reference point is
In this study, we suppose the decision-makers are neutral and then construct a PTPLTOWD based on prospect theory and PLTOWD.
Step 2: Calculate the distance from each scheme to the reference point. In this step, we need to calculate the Δx in Equation (8), which represents the distance of each scheme from the reference point in prospect theory.
For optimistic decision-makers of assumption 1:
For pessimistic decision-makers of assumption 2:
For neutral decision-makers of assumption 3:
Step 3: Acquire the prospect value and weight. The calculation process of the prospect value is as follows: With DZ as the reference point, Equation (8) is used to calculate the prospect value function of each scheme. For Vj can be positive or negative, and distance measurement can be divided into cost and benefit types. To make the prospect value all positive, the following conversion rules are implemented for all prospect values:
The above Equation (9) represents the conversion of the prospect value calculated in the case of benefit-based distance measurement, and Equation (10) represents the conversion of the foreground value calculated in the case of cost-based distance measurement. After the conversion, and are both positive numbers, and the higher the value, the better.
For convenience, we utilize Vj to represent and . Furthermore, in the case application, all indicators are converted uniformly into benefit-based distance measurement in advance; that is, the prospect value Vj will be transformed according to Equation (9). The weight calculation method associated with the ordered weighted distance measure based on prospect theory is shown as follows:
After the foreground value calculated in different situations is converted, it is normalized to satisfy φj ∈ [0, 1] and
Step 4: Determine the index weight. In this study, we construct a multi-objective programming model to minimize and maximize dω (Pij, P#j) to acquire the weight of attributes:
Furthermore, the above multi-objective programming model can be converted into
Let , then we construct the Lagrange function , where λ is the Lagrange multiplier. When the partial derivative of F with respect to ωj (j = 1, ⋯ , n) is 0, we have:
After solving the above equation, the optimal solution can be obtained as follows:
Considering the normalization constraint of attribute weight, the final attribute weight can be obtained by referring to the following mathematical expression:
Step 5: Construct the PTPLTOWD measure. Combining the PLTOWD measure [Equation (7)] with the weights obtained from the prospect theory [Equation (11)], we have
where, φj is the weight obtained from prospect theory as well as the OWD position weight, ωj is the index weight.
The PTPLTOWD-TOPSIS evaluation framework is mainly composed of introducing the TOPSIS method into the PTPLTOWD measure, not only achieving the orderly aggregation of diverse information but also reflecting the subjective value perception of decision-makers.
Suppose a multi-attribute decision problem in a PLT environment contains m alternatives and n decision attributes. Let A = A1, A2, ⋯ , Am be the scheme set and C = c1, c2, ⋯ , cn be the attribute set. Let the attribute weight vector be , satisfying ω ∈ [0, 1] and . Using S = {sα|α = 0, 1, ⋯ , τ}, the decision-maker provides the evaluation value of the alternatives in the form of PLT values under the evaluation attribute and thus constructs the decision matrix R = [Pij]m×n expressed as follows:
Based on the above-mentioned information, then the main steps referring to the PTPLTOWD-TOPSIS method can be described in Figure 2:
Step 1: Construct evaluation matrix R = [Pij]m×n according to the experts' assessment, where Pij is the decision result given by the decision-maker in evaluating the attribute cj ∈ C regarding the alternative Ai ∈ A. , where L(k) represents k, the linguistic term in Pij, represents its corresponding probability, and #L(pij) means the number of linguistic terms in Pij. In addition, we suppose the decision-makers are neutral in this study.
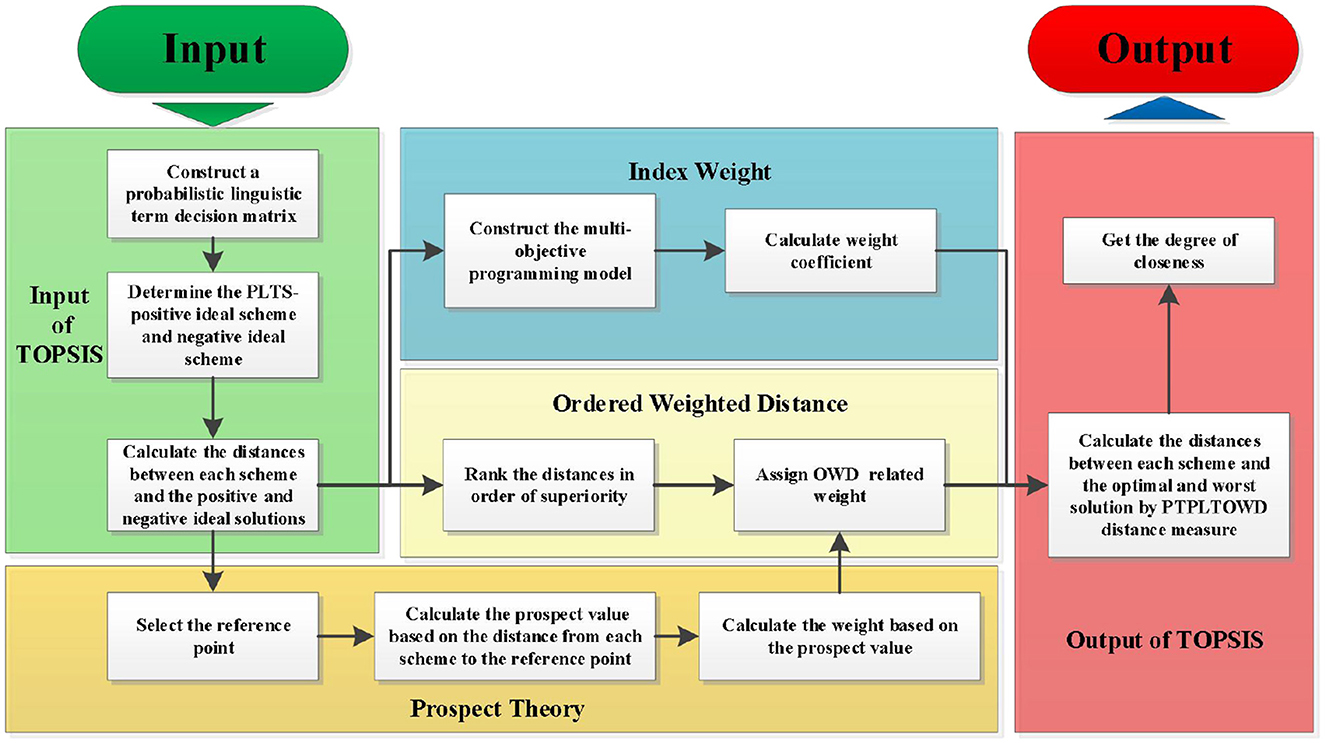
Figure 2. Flowchart of the PTPLTOWD-TOPSIS method.
Step 2: Determine the PLTS-positive ideal scheme and the PLTSs negative ideal scheme L#, which are determined as follows:
where and P#j are defined as follows:
Again, all indexes have been converted into benefit indexes before calculation, which means and P#j = min Pij.
Step 3: Calculate the distances and d (Pij, P#j) between each scheme ai and the positive and negative ideal solutions.
Step 4: Calculate the index weights according to Equation (12).
Step 5: Select the reference point. For neutral decision-makers, the reference points in the case of cost- and benefit-based distance measures are , respectively.
Step 6: Calculate the distance Δx = (dx+, dx−) between each scheme and the reference points according to the above reference points.
Step 7: According to Equation (8), the prospect value is calculated based on Δx:
To ensure that the prospect value is positive, we make the following transformation to the prospect value: . After that, is still denoted as Vj.
Step 8: According to Equation (11), the prospect value Vj is used to calculate the corresponding weight.
Step 9: The obtained weights from the above step are assigned to the distances and sd (Pij, P#j) from each scheme to the optimal and worst solutions in order from the largest to smallest.
Step 10: Calculate the weight associated with the distance measure based on Step 6, then obtain the and between each alternative and the positive and negative ideal solutions according to Equation (13). (In general, λ equals 2. Other cases are discussed later in this article.)
Step 11: Calculate the relative closeness based on PTPLTOWD.
Among them, Ri is the relative closeness of each alternative, and the larger the value, the closer the scheme Ai is to the positive ideal solution and the farther it is from the negative ideal solution.
In this section, we explore the application of the innovative index system and the proposed PTPLTOWD-TOPSIS method in the evaluation of the common prosperity level of cities in the Zhejiang province.
On 19 July 2021, the “Zhejiang High-quality Development and Construction of Common Prosperity Demonstration Zone Implementation Plan (2021–2025)” was officially released, which proposes to widen the effective path of the “getting rich first” strategy by promoting the coordinated development of rural and urban areas as a first demonstration. This strategy of the central government was designed to achieve a mutually beneficial, balanced development solution. Zhejiang province needs to achieve institutional reforms to share the fruits of economic development.
“Between different regions in Zhejiang province, between big cities and small cities, and between cities and rural areas, it is vital to promote the reform of public services and social security by following the process of urbanization.” By 2021, Zhejiang province was destined to become a model for common prosperity in China. Zhejiang province has a solid foundation in terms of economy, society, and the rule of law, and the awareness of reform and innovation is strong in various regions. Its construction space and potential are significant. Therefore, to demonstrate the practicability and effectiveness of the above methods, we conducted an empirical test on the common prosperity practice in Zhejiang province.
This example considers 11 prefecture-level cities in Zhejiang province, including Hangzhou, Ningbo, Jiaxing, Huzhou, Wenzhou, Jinhua, Quzhou, Zhoushan, Shaoxing, Taizhou, and Lishui, for evaluation, named A1−A11, respectively. Factors are named as follows: c1—income gap, c2— economic level, c3—culture and recreation, c4—infrastructure, c5—urbanization rate, c6—life expectancy, and c7—employment rate.
Each expert in the evaluation team used seven-value language terms to evaluate each index attribute—using seven-level criteria: extremely poor, poor, relatively poor, average, good, better, and excellent for independent evaluation. For convenience, the seven-valued language term set is denoted as S = (s0, s1, s2, s3, s4, s5, s6). Based on the language evaluation of each expert on each attribute index of each evaluation object, the probabilistic linguistic evaluation matrix is obtained, as shown in Table 1.
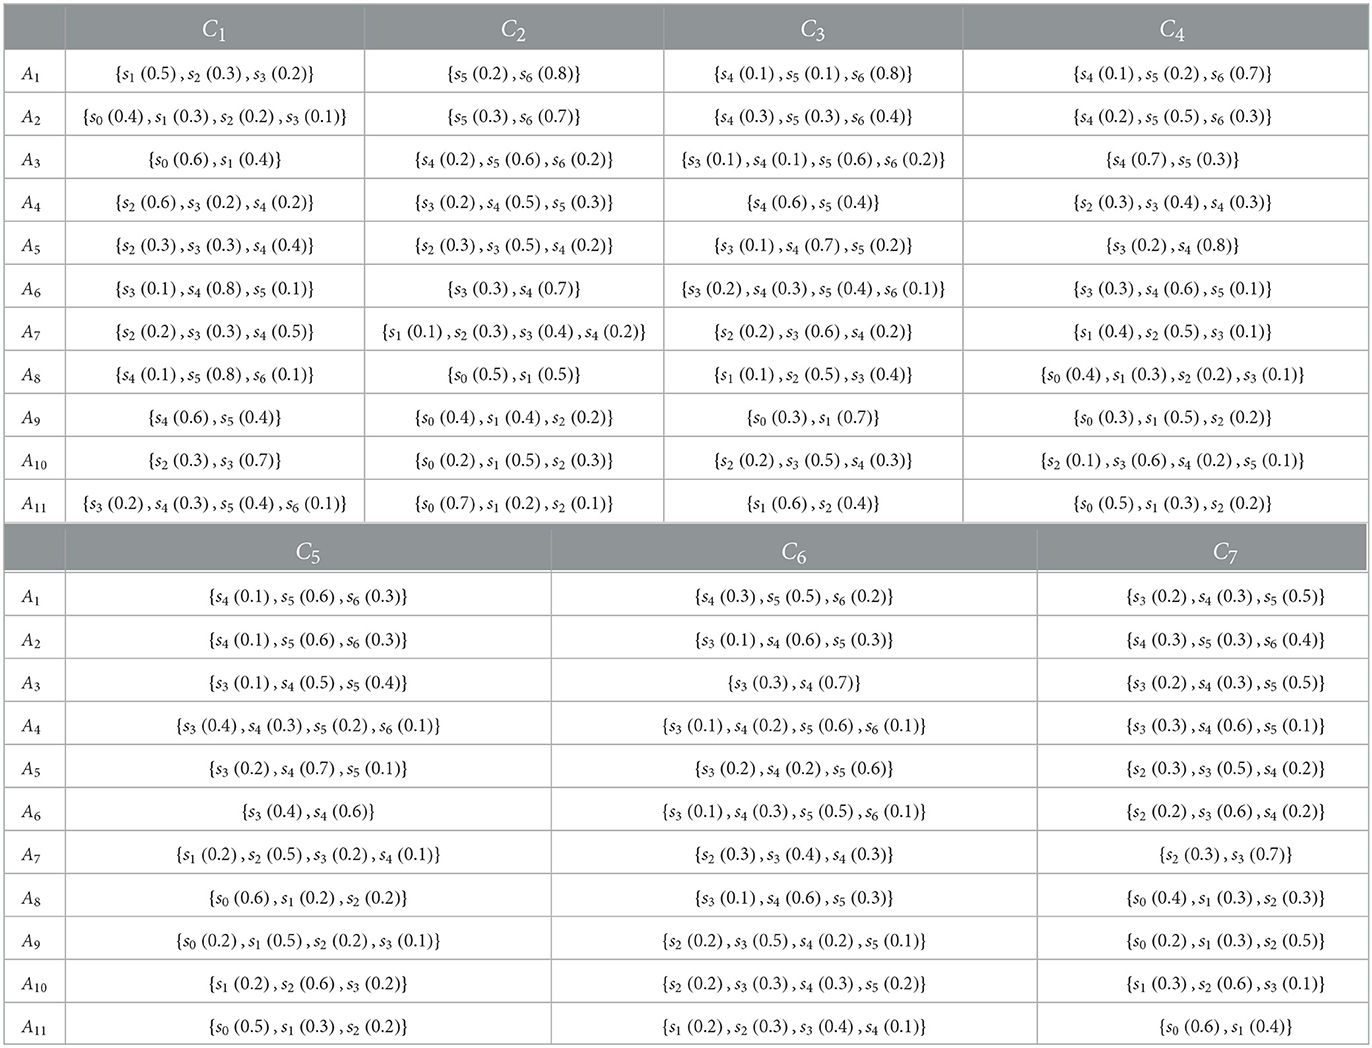
Table 1. Probabilistic linguistic evaluation matrix.
The specific analysis of the PTLTOWD-TOPSIS method proposed in this study and the corresponding evaluation results are shown as follows.
Step 1: Construct the probabilistic linguistic evaluation matrix R = [Pij]m×n based on the decision information. Details are presented in Table 1.
Step 2: Determine the PLTS-positive ideal scheme and PLTS-negative ideal scheme L#:
Step 3: Calculate the distances and d (Pij, P#j) between each scheme Ai and the positive and negative ideal solutions.
Step 4: Obtain the index weights according to Equation (12):
Step 5: Select the reference point. For neutral decision-makers, the reference points in the case of cost- and benefit-based distance measures are , respectively. The results are presented in Table 2.
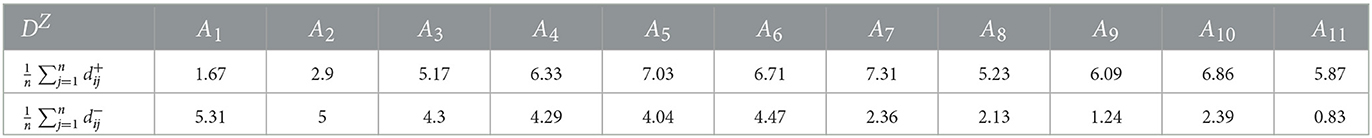
Table 2. Reference points of cities.
Step 6: Calculate the distance Δx = (dx+, dx−) between each scheme and its corresponding reference point . It is worth mentioning that the reference points of each city are obtained by the distance between its probabilistic language and the optimal solution and the worst solution, respectively. Hence, its reference points are also a pair. is the reference point obtained by the distance from the optimal solution, and is the reference point obtained by the deviation from the worst solution.
Step 7: According to the obtained Δx, Vij is calculated by using Equations (9) and (16). For the reference points that are paired, the resulting prospect value is also paired. The prospect value given by the reference point is called the prospect value of the optimal reference point, while the prospect value given by the reference point is called the prospect value of the worst reference point.
Step 8: According to the two groups of prospect values obtained above, the weight of prospect theory is calculated, respectively, as shown in Tables 3, 4. Among them, is the prospect theory weight obtained from the prospect value of the optimal reference point, which is called the prospect theory weight of the optimal reference point; ω# is the prospect theory weight obtained from the prospect value of the worst reference point, which is called the prospect theory weight of the worst reference point.
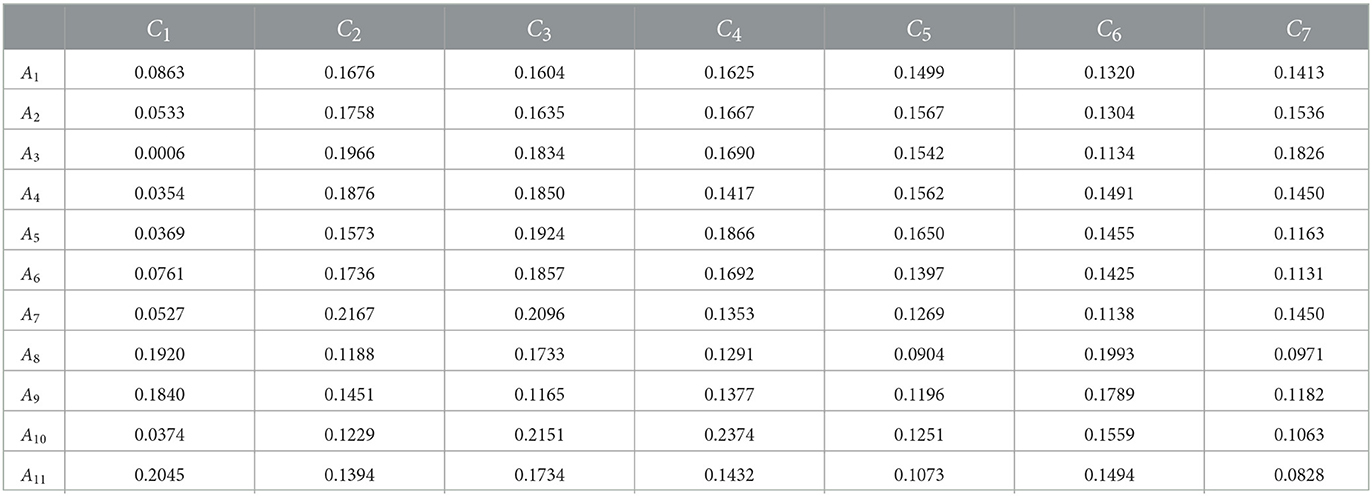
Table 3. Prospect theory weight of optimal reference point .
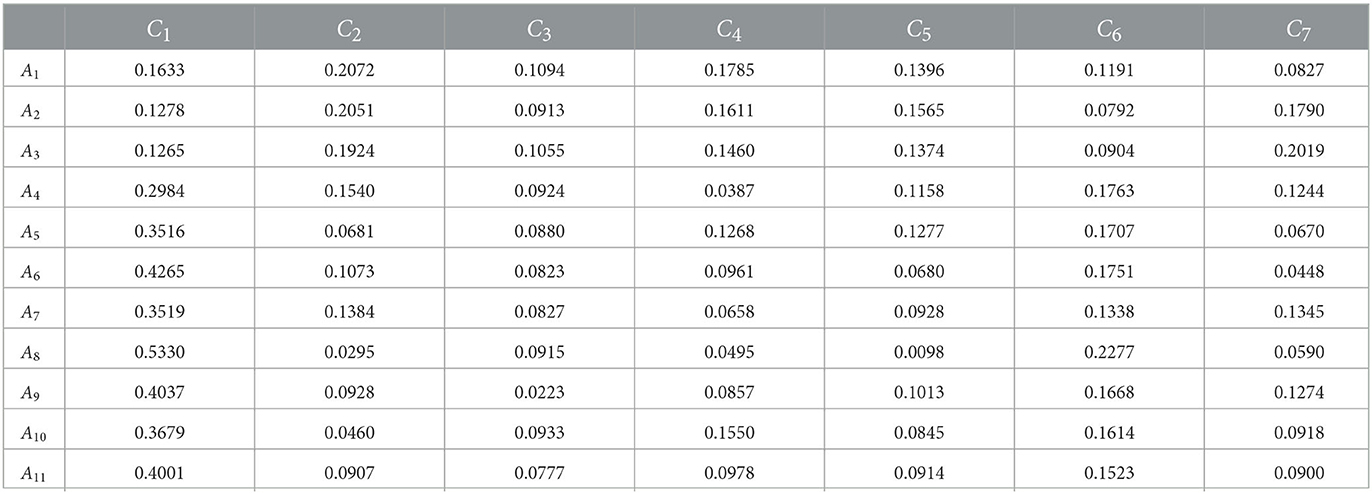
Table 4. Prospect theory weight of the worst reference point ω#.
Step 9: and d (Pij, P#j)) are aggregated and ranked in order of largest to smallest.
Step 10: According to Equations (17) and (18), calculate distances and between each scheme and the positive and negative ideal alternatives.
Step 11: Compute the relative closeness based on PTPLTOWD and Equation (19), which is shown in Table 5.
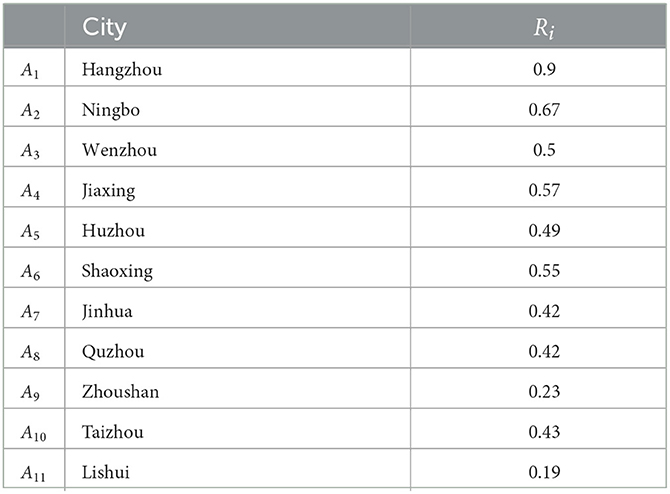
Table 5. The relative closeness of alternatives.
It can be observed that the development of common prosperity in the Zhejiang province—Hangzhou, Ningbo, Jiaxing, Shaoxing, Wenzhou, Huzhou, Taizhou, Quzhou, Jinhua, Zhoushan, and Lishui—ranges from high to relatively low.
To better illustrate the advantages of the method proposed in this study, we select the PLTOWD-TOPSIS and PLT-TOPSIS methods to compare and analyze the above examples. By comparing the closeness of 11 cities presented by the current two evaluation models, we illustrate the advantages and effectiveness of introducing the prospect theory in PTPLTOWD-TOPSIS proposed in this study.
To illustrate the advantages of the proposed approach, we first employ the general PLTOWD measure as a comparison. It is worth mentioning that the weight of the PLTOWD method here adopts the widely used normal distribution method (Xu and Chen, 2008), while the associated weights with the PTPLTOWD measure in this study are determined by the prospect theory. It can be found from Figure 3 that the two results of the first four cities, Hangzhou, Ningbo, Wenzhou, and Jiaxing, are relatively similar, while the two results of the next seven cities gradually show differences, among which, Quzhou has the largest difference. The main reason for this difference is that prospect theory reflects the preferences of decision-makers. At the same time, we can also find that cities that perform well under prospect theory perform well on some indicators. As for the pure PLT operator, it is observed that it simply integrates the evaluation values of the indicators and does not reflect the gap between the aggregation results of the scheme and the positive and negative ideal alternatives.
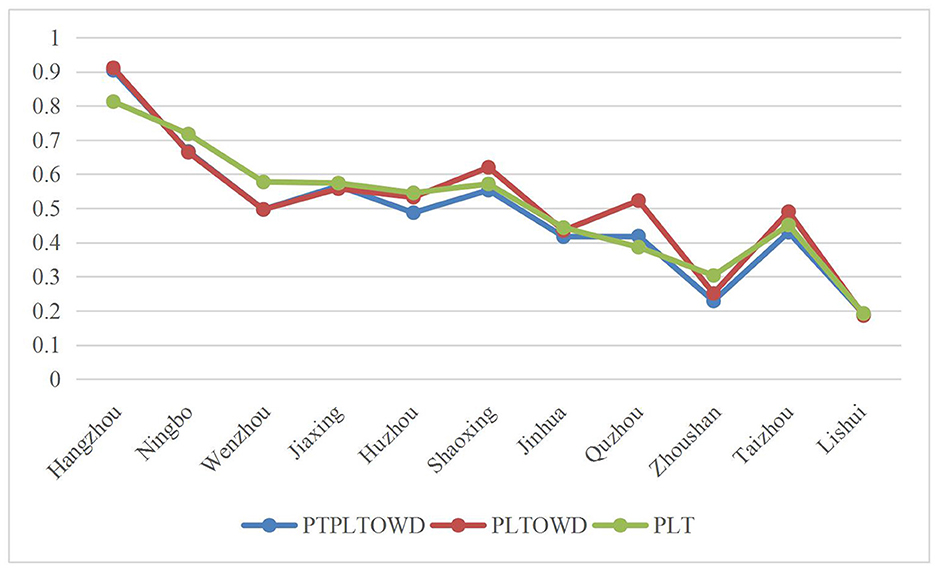
Figure 3. Degree of closeness under different methods.
Overall, by considering prospect theory based on PLTOWD, the proposed PTPLTOWD measure accounts for the psychology of decision-makers and is more responsive. It improves the subjective value or feelings of decision-makers when they face losses and gains in the actual decision-making process so that the conclusions are more scientific and reasonable.
In this part, we explore the influence of the PTPLTOWD measure on the result by changing λ, which is shown in Figure 4.
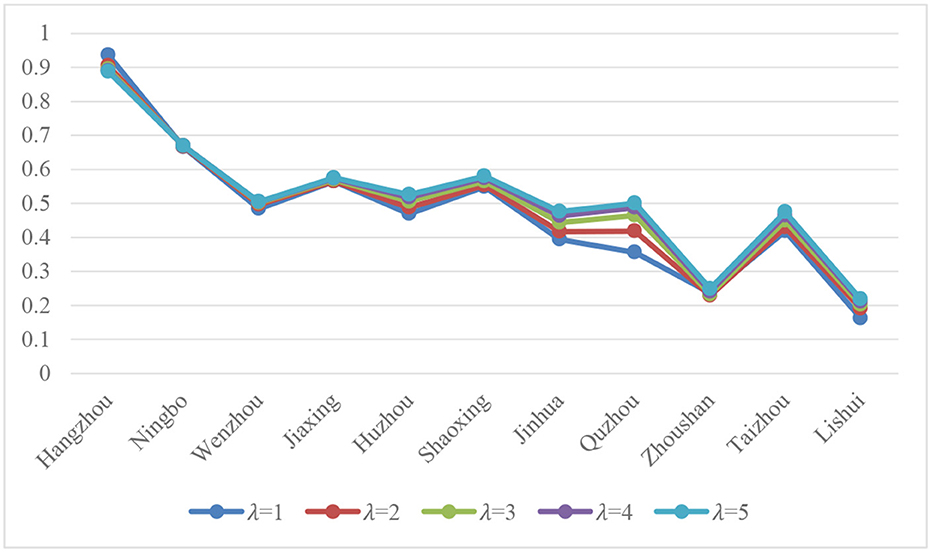
Figure 4. Influence of λ on the degree of closeness.
We can find that the results of several curves are relatively similar and have nothing to do with the value of λ, which shows that the methods proposed in this study have good stability. Of course, the results may be slightly different in specific cities such as Quzhou, but this does not affect the overall results, and λ is generally taken as 2 when making decisions. In the context of this study, the result with λ = 2 is satisfactory.
On the background of the commonwealth level of the people, aiming to provide an academic reference for related fields, this study introduces the prospect theory into the fuzzy evaluation field under complex PLTS situations. The main innovation advantages of this study are as follows: (1) We proposed a PTPLTOWD measure based on prospect theory that is an extension of the PLTOWD measure and able to better reflect the preferences of decision-makers; (2) we extended the traditional TOPSIS method based on prospect theory and ordered the weighted measure to construct a novel PTPLTOWD-TOPSIS evaluation framework, providing a simpler and more efficient probabilistic linguistic decision-making method; (3) we constructed a set of scientific evaluation index systems for the common prosperity level by reading literature; and (4) we applied the presented method to the evaluation of the common prosperity level of cities in Zhejiang province and obtained a scientific evaluation result. The results are compared with the previous method, and the effect is remarkable. This demonstrates the practicability and effectiveness of the PTPLTOWD-TOPSIS approach. The evaluation of this study has a certain reference significance in reality.
The findings show that the level of common prosperity of the 11 prefecture-level cities in Zhejiang province, ranked from high to relatively low, is Hangzhou, Ningbo, Jiaxing, Shaoxing, Wenzhou, Huzhou, Taizhou, Quzhou, Jinhua, Zhoushan, and Lishui. Cities should make targeted improvements based on the shortcomings currently reflected to achieve common prosperity. Furthermore, it is observed that the PTPLOWD has a broad application prospect. In the future, it will be considered for application in other fuzzy evaluation fields. In addition to prospect theory, regret theory can also be applied in the PTOWD and field of fuzzy evaluation.
There are two methodological topics that need to be highlighted. First, the proposed evaluation system contains seven indicators, which are relatively simple and easy to operate during calculation. We can further add or expand some other related indicators in the subsequent to make them more scientific and comprehensive, which may be a potential area for future research. Second, determining how the importance of an index is a classic issue in multi-attribute evaluation problems. Different weights should be assigned to different indicators according to actual situations. In this case, we have utilized a multi-objective programming method to determine the objective weights of indexes. Subjective methods by considering the people's subjective judgment, such as the social network trust model (Zeng et al., 2022) and BWM method (Zhang N. et al., 2022), can be considered regarding the allocation of weights in practical evaluation.
The raw data supporting the conclusions of this article will be made available by the authors, without undue reservation.
Writing—original draft preparation: FY and TJ. Writing—review and editing: EZ and SZ. Methodology: EZ and DW. Supervision: SZ and DW. All authors have read and agreed to the published version of the manuscript.
This study was supported by the Social Sciences Planning Projects of Zhejiang (21QNYC11ZD), the Statistical Scientific Key Research Project of China (2021LZ33), and the Postgraduate Research and Innovation Practice Project of Jiangsu Province (KYCX17_0222).
The authors declare that the research was conducted in the absence of any commercial or financial relationships that could be construed as a potential conflict of interest.
All claims expressed in this article are solely those of the authors and do not necessarily represent those of their affiliated organizations, or those of the publisher, the editors and the reviewers. Any product that may be evaluated in this article, or claim that may be made by its manufacturer, is not guaranteed or endorsed by the publisher.
Chen K. Z., Mao, R., and Zhou Y. Y. (2022). Rurbanomics for common prosperity: new approach to integrated urban-rural development. China Agricult. Econ. Rev. 15, 1–16. doi: 10.1108/CAER-12-2021-0256
Dai, S. (2020). Complex fuzzy ordered weighted distance measures. Iranian J. Fuzzy Syst. 17, 107–114. doi: 10.22111/IJFS.2020.5604
Guan, Y. P., Wang, H. J., Guan, R., and Ding, L. (2022). Measuring inclusive green total factor productivity from urban level in China. Front. Environ. Sci. 10. doi: 10.3389/fenvs.2022.966246
Hamming, R. W. (1950). Error-detecting and error-correcting codes. Bell Sys. Tech. J. 29, 147–160. doi: 10.1002/j.1538-7305.1950.tb00463.x
Ja, L. M. (2022). Background and policy implications of Xi Jinping's policy of “common prosperity”. New Asia 29, 67–93.
Kahneman, D., and Tversky, A. (1979). Prospect theory: an analysis of decision under risk. Econometrica 47, 263–292. doi: 10.2307/1914185
Kakwani, N., Wang, X. B., Xue, N., and Zhan, P. (2022). Growth and common prosperity in China. China World Econ. 30, 28–57. doi: 10.1111/cwe.12401
Li, Q. R., Ma, H., Xu, Z. Q., Feng, H., and Bellingrath-Kimura, S.D. (2022). Balancing socioeconomic development with ecological conservation towards rural sustainability: a case study in semiarid rural China. Int. J. Sust. Develop. World Ecol. 29, 246–262. doi: 10.1080/13504509.2021.1990157
Liu, X., Tao, Z. F., and Chen, H. Y. (2022). Probabilistic linguistic term ordered weighted distance operator and its applications in public eco-environment satisfaction evaluation. J. Cont. Decis. 9, 58–70. doi: 10.1080/23307706.2021.1912664
Meng, X. M., Zhang, J., and Sun, M. (2022). An inclusive entrepreneurial path model based on rural digital entrepreneurship data in Zhejiang Province using few-shot learning. Comput. Intell. Neurosci. 2022, 15681. doi: 10.1155/2022/8015681
Merigó, J., and Gil-Lafuente, A. (2008). Using the OWA operator in the Minkowski distance. Int. J. Econ. Manag. Engin. 2, 1032–1040.
Merigo, J. M., and Casanovas, M. (2011). Induced aggregation operators in the Euclidean distance and its application in financial decision making. Expert Syst. Appl. 38, 7603–7608. doi: 10.1016/j.eswa.2010.12.103
Pang, Q., Wang, H., and Xu, Z. S. (2016). Probabilistic linguistic linguistic term sets in multi-attribute group decision making. Inf. Sci. 369, 128–143. doi: 10.1016/j.ins.2016.06.021
Peng, B., Ye, C. M., and Zeng, S. Z. (2014). Some intuitionist fuzzy weighted geometric distance measures and their application to group decision making. Int. J. Uncert. Fuzz. Knowled. Based Sys. 22, 699–715. doi: 10.1142/S0218488514500354
Peng, J. J., Tian, C., Zhang, W. Y., Zhang, S., and Wang, J. Q. (2020). An integrated multi-criteria decision-making framework for sustainable supplier selection under picture fuzzy environment. Technol. Econ. Develop. Econ. 26, 573–598. doi: 10.3846/tede.2020.12110
Pu, X. H., Wang, Y. L., Zhang, W. K., and Zeng, M. (2022). Can basic medical insurance reduce elderly family income inequality in China? Front. Public Health 10. doi: 10.3389/fpubh.2022.838733
Qian, Z. S., Yuan, L. R., Wang, S., Zhang, Q. Z., and Gong, B. L. (2021). Epidemics, convergence, and common prosperity: evidence from China. China World Econ.29, 117–138. doi: 10.1111/cwe.12397
Rodriguez, R. M., Martinez, L., and Herrera, F. (2012). Hesitant fuzzy linguistic term sets for decision making. IEEE Transact. Fuzzy Sys. 20, 109–119. doi: 10.1109/TFUZZ.2011.2170076
Shen, K. W., Li, L., and Wang, J. Q. (2020). Circular economy model for recycling waste resources under government participation: a case study in industrial waste water circulation in China. Technol. Econ. Develop. Econ. 26, 21–47. doi: 10.3846/tede.2019.11249
Song, C., Wang, X. K., Cheng, P. F., Wang, J. Q., and Li, L. (2020). SACPC: a framework based on probabilistic linguistic terms for short text sentiment analysis. Knowled. Based Sys. 194. doi: 10.1016/j.knosys.2020.105572
Su, W., Chen, S., Zhang, C., and Li, KW. (2023). A Subgroup dominance-based benefit of the doubt method for addressing rank reversals: a case study of the human development index in Europe. Eur. J. Oper. Res. 307, 1299–1317. doi: 10.1016/j.ejor.2022.11.030
Tang, D. M., Li, X., Xu, X. C., Liu, X. P., Zhang, H., Shi, H., et al. (2022). Does the Belt and Road Initiative Really Increase CO2 Emissions? Ann. Am. Assoc. Geograph. 112, 948–967. doi: 10.1080/24694452.2021.1941747
Tian, C., Peng, J. J., Zhang, W. Y., Zhang, S., and Wang, J.Q. (2020). Tourism environmental impact assessment based on improved AHP and picture fuzzy PROMETHEE II methods. Technol. Econ. Develop. Econ. 26, 355–378. doi: 10.3846/tede.2019.11413
Tversky, A., and Kahneman, D. (1992). Advances in prospect theory: cumulative representation of uncertainty. J. Risk Uncertain. 5, 297–323. doi: 10.1007/BF00122574
Wang, Y. H., Huo, Z. H., Li, D. P., and Zhang, M. (2022). Evaluation of common prosperity level and regional difference analysis along the yangtze river economic belt. Int. J. Environ. Res. Public Health 19, 11851. doi: 10.3390/ijerph191911851
Xu, Z. S., and Chen, J. (2008). Ordered weighted distance measure. J. Sys. Sci. Sys. Engin. 17, 432–445. doi: 10.1007/s11518-008-5084-8
Xu, Z. S., and Xia, M. M. (2011). Distance and similarity measures for hesitant fuzzy sets. Inf. Sci. 181, 2128–2138. doi: 10.1016/j.ins.2011.01.028
Yager, R. R. (1988). On ordered weighted averaging aggregation operators in multi-criteria decision making. IEEE Transact. Sys. 18, 183–190. doi: 10.1109/21.87068
Yang, S., Pan, Y., and Zeng, S. Z. (2022). Decision making framework based Fermatean fuzzy integrated weighted distance and TOPSIS for green low-carbon port evaluation. Eng. Appl. Artif. Intell. 114, 105048. doi: 10.1016/j.engappai.2022.105048
Yu, D., and Pan, T. (2021). Tracing knowledge diffusion of TOPSIS: a historical perspective from citation network. Expert Syst. Appl. 168, 114238. doi: 10.1016/j.eswa.2020.114238
Zadeh, L. A. (1974). The concept of a linguistic variable and its application to approximate reasoning. Inf. Sci. 8, 199–249. doi: 10.1016/0020-0255(75)90036-5
Zeng, S. Z., Hu, Y. J., and Llopis-Albert, C. (2023). Stakeholder-inclusive multi-criteria development of smart cities. J. Bus. Res. 154, 113281. doi: 10.1016/j.jbusres.2022.08.045
Zeng, S. Z., Li, W., and Merigo, J. M. (2013b). Extended induced ordered weighted averaging distance operators and their application to group decision-making. Int. J. Inform. Technol. Dec. Mak. 12, 789–811. doi: 10.1142/S0219622013500296
Zeng, S. Z., Merigo, J.M., Palacios-Marques, D., Jin, H. H., and Gu, F. J. (2017). Intuitionistic fuzzy induced ordered weighted averaging distance operator and its application to decision making. J. Intell. Fuzzy Sys. 32, 11–22. doi: 10.3233/JIFS-141219
Zeng, S. Z., Merigo, J.M., and Su, W. H. (2013a). The uncertain probabilistic OWA distance operator and its application in group decision making. Appl. Math. Model. 37, 6266–6275. doi: 10.1016/j.apm.2013.01.022
Zeng, S. Z., Su, W. H., and Le, A. B. (2012). Fuzzy generalized ordered weighted averaging distance operator and its application to decision making. Int. J. Fuzzy Sys. 14, 402–412.
Zeng, S. Z., Zhou, J. M., Zhang, C. H., and Merig,ó, J. M. (2022). Intuitionistic fuzzy social network hybrid MCDM model for an assessment of digital reforms of manufacturing industry in China. Technol. Forecast. Soc. Change 176, 121435. doi: 10.1016/j.techfore.2021.121435
Zhang, J., Huang, B. B., Chen, X. M., Zhu, C. M., and Gan, M. Y. (2022). Multidimensional evaluation of the quality of rural life using big data from the perspective of common prosperity. Int. J. Environ. Res. Public Health 19, 4166. doi: 10.3390/ijerph192114166
Zhang, N., Su, W. H., Zhang, C. H., and Zeng, S. Z. (2022). Evaluation and selection model of community group purchase platform based on WEPLPA-CPT-EDAS method. Comp. Indust. Engin. 172, 108573. doi: 10.1016/j.cie.2022.108573
Keywords: common prosperity, probabilistic linguistic term, prospect theory, ordered weighted distance measure, TOPSIS
Citation: Zhang E, Yu F, Jiang T, Zeng S and Wang D (2023) Common prosperity level evaluation: A comprehensive method based on probabilistic linguistic ordered weighted distance measure, prospect theory, and TOPSIS. Front. Psychol. 14:1152333. doi: 10.3389/fpsyg.2023.1152333
Received: 27 January 2023; Accepted: 13 February 2023;
Published: 15 March 2023.
Edited by:
Yuan-Wei Du, Yunnan University, ChinaReviewed by:
Dejian Yu, Nanjing Audit University, ChinaCopyright © 2023 Zhang, Yu, Jiang, Zeng and Wang. This is an open-access article distributed under the terms of the Creative Commons Attribution License (CC BY). The use, distribution or reproduction in other forums is permitted, provided the original author(s) and the copyright owner(s) are credited and that the original publication in this journal is cited, in accordance with accepted academic practice. No use, distribution or reproduction is permitted which does not comply with these terms.
*Correspondence: Shouzhen Zeng, emVuZ3Nob3V6aGVuQG5idS5lZHUuY24=
Disclaimer: All claims expressed in this article are solely those of the authors and do not necessarily represent those of their affiliated organizations, or those of the publisher, the editors and the reviewers. Any product that may be evaluated in this article or claim that may be made by its manufacturer is not guaranteed or endorsed by the publisher.
Research integrity at Frontiers
Learn more about the work of our research integrity team to safeguard the quality of each article we publish.