
95% of researchers rate our articles as excellent or good
Learn more about the work of our research integrity team to safeguard the quality of each article we publish.
Find out more
ORIGINAL RESEARCH article
Front. Psychol. , 16 June 2023
Sec. Quantitative Psychology and Measurement
Volume 14 - 2023 | https://doi.org/10.3389/fpsyg.2023.1152002
 Balapuwaduge Isuru Layan Madusanka Mendis1
 Palihaderu Arachchige Dineth Supasan Palihaderu1
 Panduka Karunanayake2
 Dilan Amila Satharasinghe1
 Jayasekara Mudiyanselage Krishanthi Jayarukshi Kumari Premarathne3
 Wajjakkara Kankanamlage Ruwin Rangeeth Dias4
 Iyanthimala Harshini Rajapakse5
 Avanti Sulochana Hapugalle4Wanasinghe Ranhettige Sasanka Anjalee Karunaratne4Agulugaha Gamage Yohan Nipuna Binendra4Kelaniya Bandaralage Pubudu Pradeep Kumara4Galathura Samanabaddage Dasun Prabhashwara4Upul Senarath6
 Swee Keong Yeap7
 Wan Yong Ho8Arosha Sampath Dissanayake9*
Introduction: Despite the availability of validated psychometrics tools to assess depression, there has not been any validated and reliable tool established to test perceived stress among Sri Lankans. The objective of this study is to test the validity and reliability of the Sinhalese Version of the Sheldon Cohen Perceived Stress Scale.
Materials and methods: Standard and systematic procedures were adopted to translate the original English version of the Perceived Stress Scale-10 questionnaire into Sinhalese. Consecutive sampling was employed to recruit the Type 2 Diabetes mellitus (T2DM) sample (n = 321), and a convenient sampling was used to recruit the Age and Sex matched Healthy Controls (ASMHC) (n = 101) and the Healthy Community Controls (HCC) groups (n = 75). Cronbach alpha was used to assess internal consistency and reliability was determined using test–retest method utilizing Spearman’s correlation coefficient. Sensitivity was evaluated by comparing the mean scores of the Sinhalese Perceived Stress Scale (S-PSS-10) and Sinhalese Patient Health Questionnaire (S-PHQ-9) scores. Post-hoc comparisons were done using Bonferroni’s method. Mean scores were compared between the T2DM, ASMHC, and HCC groups using the independent t-test. Explanatory Factor Analysis (EFA) was conducted using the principal component and Varimax rotation while the Confirmatory Factor Analysis (CFA) was performed to assess the goodness-of-fit of the factor structure extracted from the EFA. Concurrent validity was assessed using the Pearson correlation between the S-PSS-10 and Patient Health Questionnaire measured by S-PHQ-9 (p < 0.05).
Results: Cronbach alpha values of the three groups T2DM, ASMHC and HCC were 0.85, 0.81, and 0.79, respectively. Results of the ANOVA test suggested that there was a significant difference in the mean scores between groups (p < 0.00). EFA analysis revealed the existence of two factors with eigenvalues greater than 1.0. The factor loadings for the items ranged from 0.71–0.83. The CFA analysis demonstrated a good model fit for the two-factor model S-PSS-10. The S-PSS-10 significantly correlated with S-PHQ-9, indicating an acceptable concurrent validity.
Conclusion: Findings revealed that the S-PSS-10 questionnaire can be used to screen perceived stress among the majority of the Sri Lankan Sinhalese-speaking population specially with chronic illnesses. Further studies with higher sample sizes across different populations would enhance the validity and reliability of S-PSS-10.
Psychological stress is increasingly being recognized as a risk factor for the onset and progression of non-communicable diseases (Pothisiri et al., 2022; Gebicki et al., 2023). The normal physiological response to any form of stress is adaptive, enabling the organism to withstand the stress and maintain body homeostasis. “Allostasis” is a mechanism which helps the body to adapt to various stressors and involves cerebral neurohumoral mechanisms (Schneiderman et al., 2005; Parker et al., 2022). However, when exposed to chronic stress which results in prolonged stimulation of the allostatic system, the adaptive mechanisms fail. This is termed “Allostatic load,” and involves dysregulation of multiple neuroendocrine, cardiovascular, metabolic and inflammatory pathways (Goymann and Wingfield, 2004; Carbone, 2021; Guidi et al., 2021).
Despite the inherent difficulties to assess stress with the composite psychological, social, and biological variables, different methods have been developed to quantify stress. For example, a clinical criteria and diagnostic interviews are established to quantify the allostatic load (Fava et al., 2019). Also, several types of biomarkers in serum can be used to assess the impact and magnitude of stress (i.e., cortisol, adrenocorticotropic hormone, cytokine profiles) (Kokka et al., 2022; Li et al., 2023). In addition, there are many self-assessment questionnaires, scales, and tests developed to assess psychometrics like perceived stress, anxiety and depression (i.e., Perceived Stress Scale, Patient Health Questionnaire- 9, Depression and Anxiety Scale, Ardell Wellness Stress Test) (Cohen et al., 1983; Peacock and Wong, 1990; Oei et al., 2013). For the issue at hand specifically, the perceived stress levels can be taken as the measure as it contributes in multiple ways to their level of awareness, coping and ability to self-manage the disease. Perceived stress refers to the “degree to which events in a person’s life are assessed as stressful, unpredictable and uncontrollable.” The importance of Perceived Stress is that it encompasses multiple dimensions, including awareness, coping and the ability to self-manage (González-Ramírez et al., 2013). Several rating scales, such as stress appraisal measure, perceived stress scale and impact of event scale have been developed to assess perceived stress (Peacock and Wong, 1990; Feizi et al., 2012).
Among them, the Sheldon Cohen Perceives Stress Scale is the most widely adopted and used scale among these psychometric instruments (Lee et al., 2015; Gamonal-Limcaoco et al., 2021; Mozumder, 2022). It is an instrument that measures the level of perception of stress concerning unpredictability, lack of control, and overload. The 10-item Perceived Stress Scale (PSS) questionnaire encompasses the two-factor structure, assessing both the “negative feelings and the inability to handle stress” as well as “positive emotions and the ability to take action in stressful situations” (Cohen et al., 1983; Lee, 2012). A 5-point Likert scale indicates how often a participant experienced a particular emotion or thought over the past 4 weeks. Higher scores correspond with higher levels of perceived stress. Notably, it has been reported that the PSS-10 correlated with other psychosocial psychometrics like depression, anxiety and low self-esteem (Roberti et al., 2006; Wang et al., 2022).
As a result of the exceptional psychometric properties, the PSS-10 has been translated and culturally adapted for use in different languages including Arabic, Hindi, Chinese, Mexican, Greek, Swedish and Malaysian and across various populations with diabetics, smokers, pregnant and postpartum women, emphasizing the importance of validating this tool across various populations (Chaaya et al., 2010; Lee, 2012). For adult populations, validated normative data is available in various countries like Germany, Greece, Bangladesh, Mexico and Sweden. According to the literature, the psychometric properties for the validity of PSS-10 are assessed mainly using internal consistency, test–retest reliability and construct validity, concurrent validity (see Table 1). Internal consistency refers to how much the similar items in the scale have correlated with each other and it is assessed using Cronbach’s alpha (Hayes and Coutts, 2020). Test–retest reliability indicates the extent to which the same subjects have responded similarly to the questionnaire during a fleeting time period and a statistical correlation of the PSS-10 scores between the two time points of the same subjects are compared to assess the outcome (Noble et al., 2019).
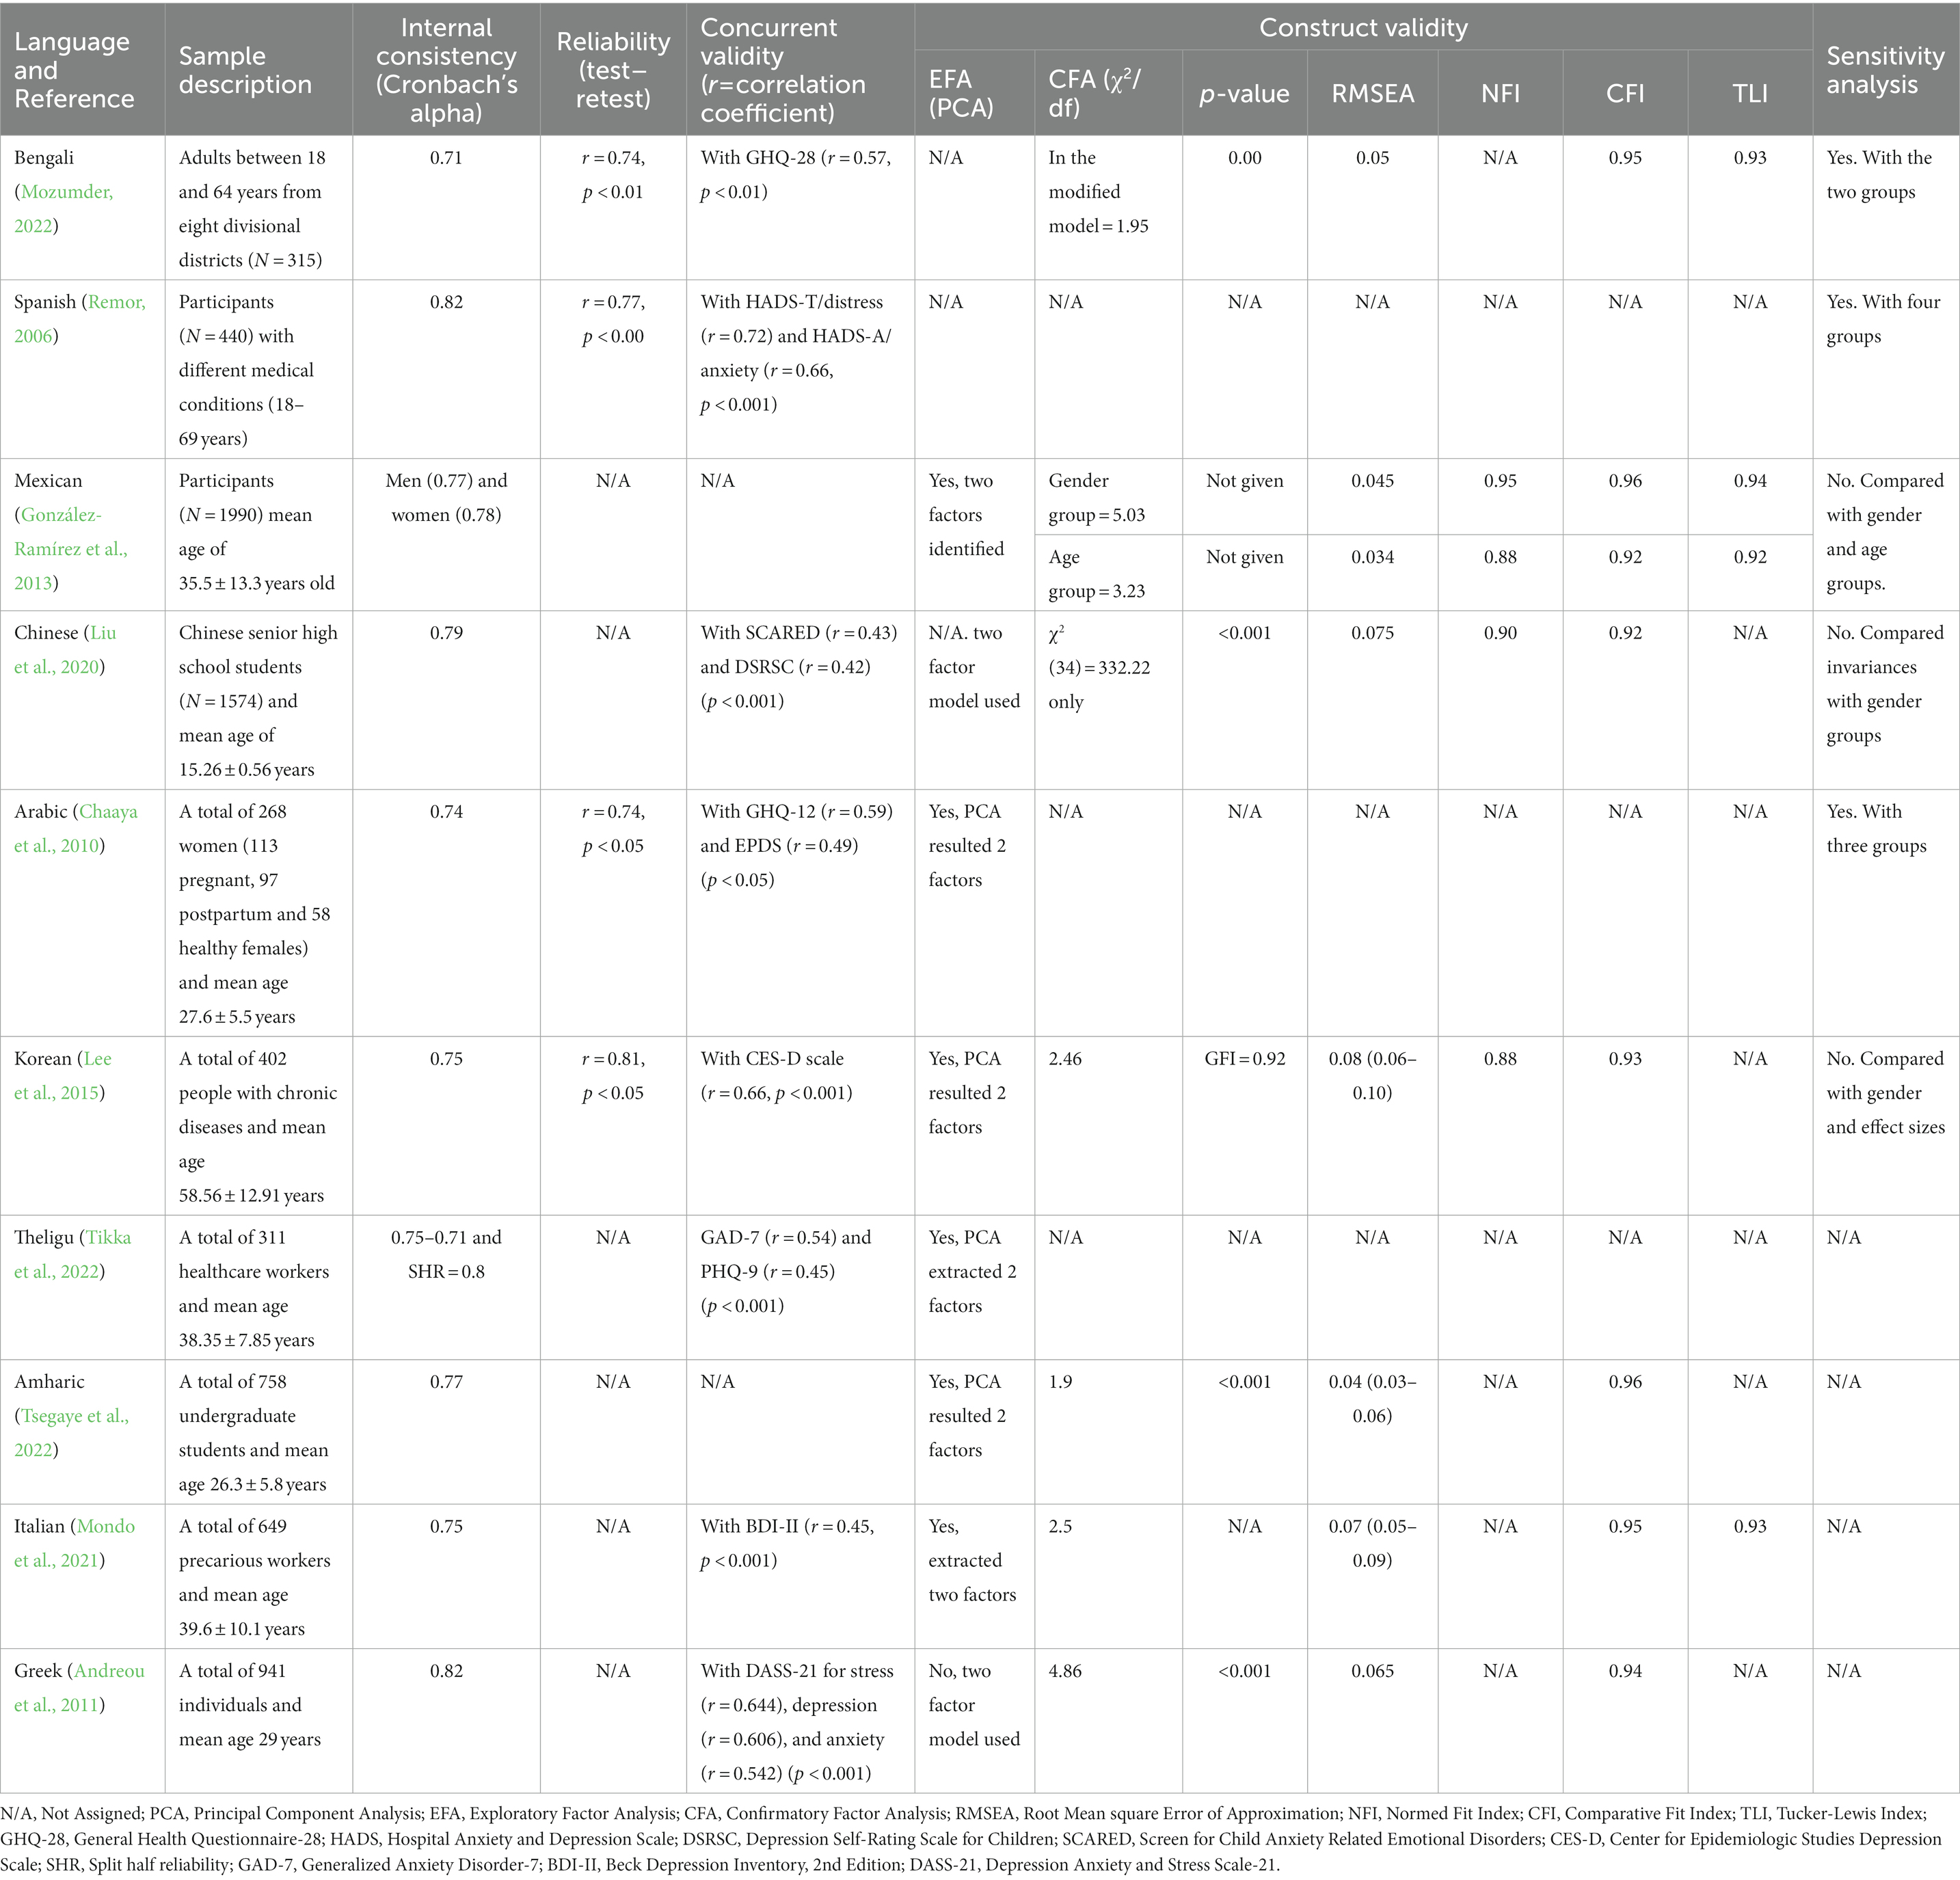
Table 1. Validity and reliability of PSS-10 with other languages.
Even though the PSS-10 is a unidimensional indicator of perceived stress, validation studies have revealed the existence of commonly reported two-factors namely ‘perceived helplessness’ and ‘perceived self-efficacy’ (Liu et al., 2020; Tikka et al., 2022). To assess the existence of the factor structure and validate the construct of questionnaires, factor analysis statistical techniques can be used (i.e., EFA and CFA). The EFA analysis is used to identify these two factors (theoretical constructs) and underlying factor structure. Although the EFA provides evidence for the two-factor structure of the PSS-10, it cannot measure the variables. The verification of the two constructs of the PSS-10 is carried out using the CFA statistical technique and it facilitates the researcher to test the hypothesis between observed PSS-10 variables and underlying two latent constructs. In general, the EFA is used to determine the factor structure of the PSS-10 while CFA provides the verification for the two-factor structure (Suhr, 2006). The concurrent validity is conducted using a correlation analysis with a similar validated tool which assesses stress or stress-related parameter. On the other hand, convergent validity explore how two theoretically related constructs are actually related and it can be executed with a correlation analysis with similar stress related construct (i.e., stressful life events).
However, the PSS-10 has not been translated into Sinhalese or validated for use in the Sri Lankan population including those with diabetes. The main language that the Sri Lankans speak is Sinhalese, who make up about 75% of the country’s population. Majority of the other ethnicities residing in Sri Lanka also can communicate in Sinhalese. Considering, the importance and necessity of the locally translated and validated perceived stress assessment questionnaire, we have made an attempt to translate and validate the PSS-10 into Sinhalese for wider use. The hypothesis of our study is that the S-PSS-10 would also exhibit a two-factor structure during the EFA and demonstrate satisfactory reliability and validity scores during the Confirmatory factor analysis as well. Also, we expect a positive statistically significant correlation with a complimentary stress assessment questionnaire to support the concurrent validity of the tool. Therefore, the primary outcome of this study is to assess the validity and reliability of a newly translated S-PSS-10 in a Sri Lankan population able to communicate the Sinhalese language, which is culturally appropriate and practical to use in a busy and resource-limited clinic setting, both for research purposes and also to be used in the clinical management of such patients.
There were three groups in the study population (n = 497). These included previously diagnosed Type 2 diabetes mellitus (T2DM) patients (n = 321), their age and sex matched healthy control (ASMHC) sample (n = 101) and healthy community controls sample (HCC) residing in urban and suburban areas of Sri Lanka who were participants in the pilot study (n = 75). The determination of minimum sample size was assessed at 0.9 power and 0.05 alpha (the probability of type I error) values based on the prevalence of perceived stress in prior conducted studies (Bernard, 2011). The incidence of perceived stress among type 2 diabetes was reported between 39.3–50% (Mortensen et al., 2022; Vidyulatha et al., 2022). Hence, we have taken 40% anticipated incidence of perceived stress among T2DM population and 50% in our study group.
p0 = proportion (incidence) of population
p1 = proportion (incidence) of study group
N = sample size for study group
α = probability of type I error (0.05)
β = probability of type II error (0.1)
z = critical Z value for a given α or β
Also, the prevalence of perceived stress and depression among people in Sri Lanka and low- middle income countries were reported as 6.2 and 6.1% (Cristóbal-Narváez et al., 2020). The prevalence of perceived stress among elderly was recorded as 27.8% in Sri Lanka (Malhotra et al., 2010). Hence, we anticipated a 6.1% prevalence in the HCC group and 27.8% in ASMHC group.
p1, p2 = proportion (incidence) of group 1 and 2
Δ = |p2–p1| = absolute difference between two proportions
n1 = sample size for group 1
n2 = sample size for group 2
α = probability of type I error (0.05)
β = probability of type II error (0.1)
z = critical Z value for a given α or β
K = ratio of sample size for group 2 to group 1
The T2DM patients were recruited from the general medicine clinic and its respective wards of the National Hospital of Sri Lanka (NHSL) over a four-month period. The majority of patients with T2DM in Sri Lanka receive treatment at general medical clinics conducted in the outpatient departments of hospitals. The NHSL, in particular, receives patients from all provinces of the country’s tertiary care hospital. Thus, the patient population in this study can be considered comparable to the diabetic patient population in Sri Lanka. Consecutive patients were approached and those who provided consent for the study were included in the T2DM group. Both the World Health Organization (WHO) and American Diabetes Association Guidelines (ADA) were used as the basis for diagnosing T2DM patients (World Health Organization and International Diabetes Federation, 2006; American Diabetes Association, 2020). Patients with fasting plasma glucose levels above ≥126 mg/dL (7.0 mmol/L) and HbA1c levels above ≥6.5% (48 mmol/mol) were included in the study. Also, patients with severe psychiatric disorders and severe visual and hearing impairments were excluded. Convenient sampling technique was used to recruit both the ASMHC and HCC control groups. Most of the subjects in the ASMHC group were relatives and neighbors of the T2DM study group and people residing close to the NHSL. The flow chart of the study is presented in the Figure 1. The HCC group comprised participants representing the age groups and economic classes residing in Kalutara, Kandy, Kurunegala, Galle, and Colombo districts (see Table 2).
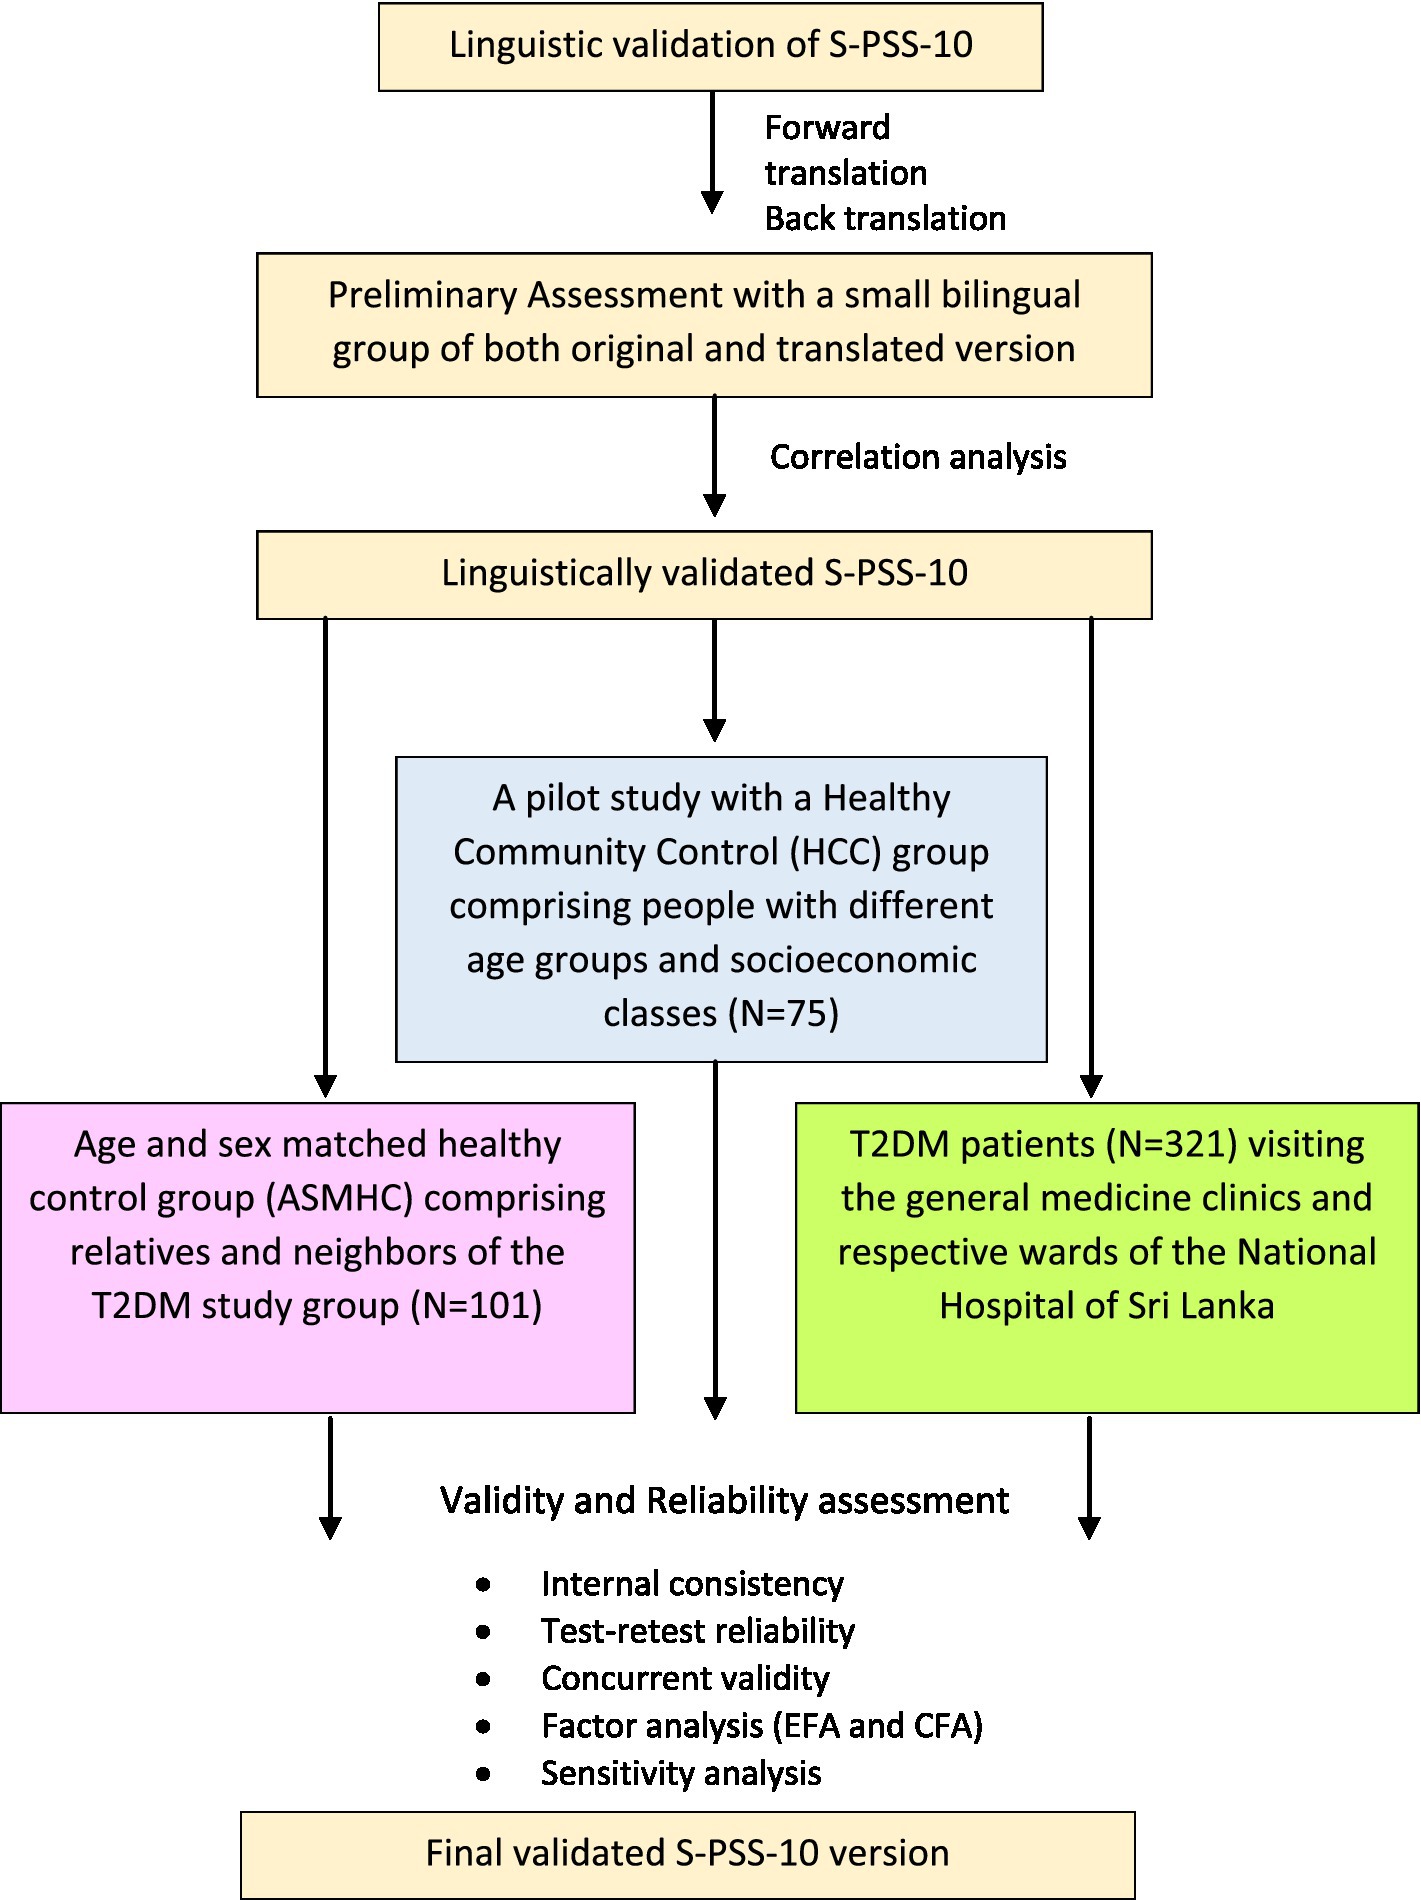
Figure 1. Flow chart of the study.
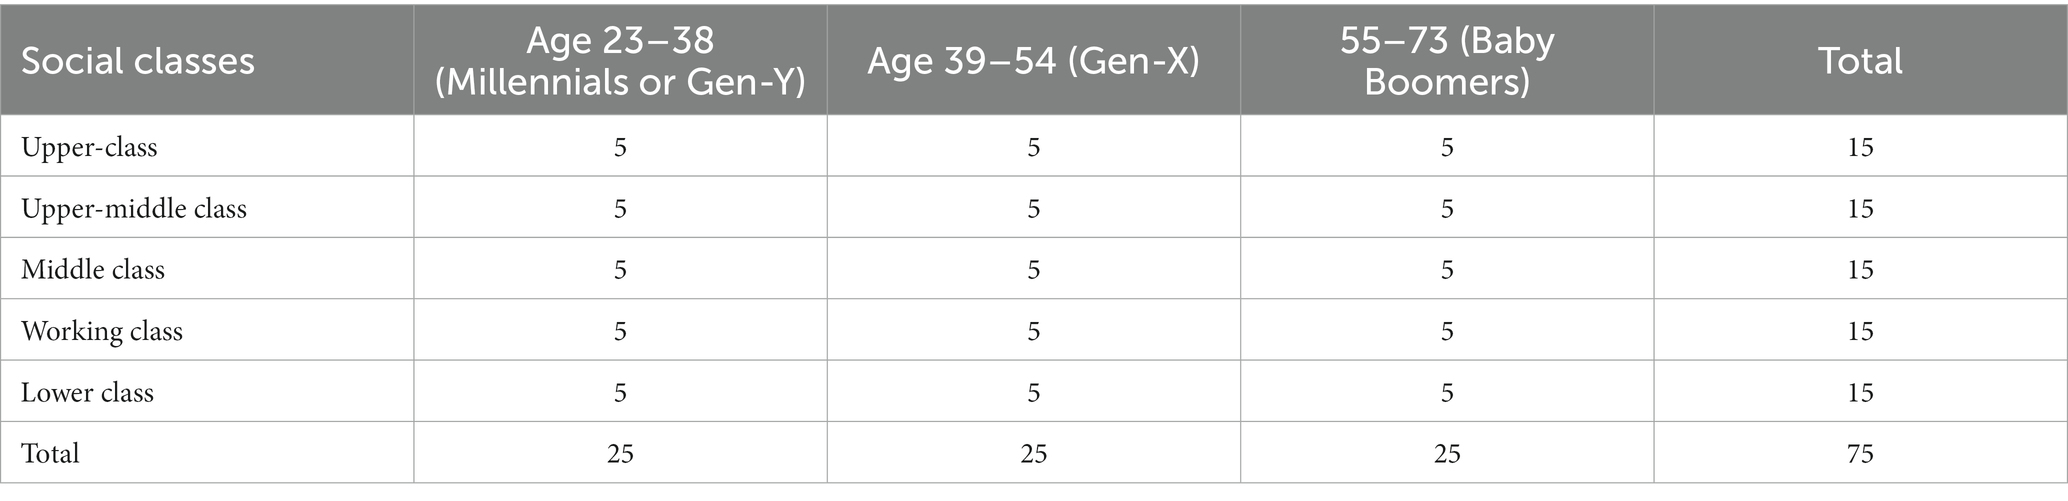
Table 2. Study design of the healthy community control group (HCC).
The Sheldon Cohen 10-item Perceived Stress Scale was used to assess the perception of stress. The questionnaire is structured on a five-point scale (0-never, 1-almost never, 2-sometimes, 3-fairly often, 4-very often) which the participants are required to quantitatively respond to their thoughts and feelings with regard to life events and situations during the preceding month. The general scoring procedure was adopted for questions 1, 2, 3, 6, 9, and 10 where the rated score from the scale of the respective questions was directly summated. The same reverse scoring procedure was followed for questions 4, 5, 7, and 8. Each 10 items’ scores were summated to obtain a final score and were used to calculate the perceived stress levels. Perceived stress scores between 0 and 13 were considered ‘Low,’ 14–26 ‘Moderate’ and 27–40 ‘High’ Perceived Stress Levels (Cohen et al., 1983).
The standard and systematic procedure with the cross-cultural translation guidelines was followed to translate the original English version of the PSS-10 questionnaire into Sinhalese (Bullinger et al., 1998; DeVotta, 2016). Two professional translators of the Sinhalese language conducted the forward translation. After the translation, a bilingual psychiatrist and consultant physician who were not familiar with the scale reviewed for the appropriateness of the Sinhalese version. The reconciled version of the forward translated questionnaire was also assessed for its’ similarity with the original PSS-10. The reviewed version was back-translated by another two independent professional translators who have not seen the original questionnaire. To ensure consistency with the original PSS, the disparities were addressed accordingly. The back-translated version was piloted among 15 university students to verify that the questionnaire was clear and comprehensible. The final review and the corrected version of the questionnaire were done by the project investigators through cognitive debriefing. Subsequently, a separate group of students (bilingual) were asked to complete the Sinhalese and English version of the PSS-10 (n = 20) in two rounds. The average time between the two administrations was 10 min. The Spearman correlation coefficient between the Sinhalese and English versions was reported as 0.7 (p < 0.05) and demonstrated an acceptable level of linguistic validity. These 20 students were not included in the final study sample.
Reliability of the Sinhalese PSS-10 (S-PSS-10) was assessed using a test–retest procedure conducted among the T2DM and ASMHC groups. The 40 respondents who participated in the T2DM group (after 3–4 weeks during their next clinic day) and 60 subjects from the ASMHC group were randomly selected and invited for a retest after 15 min. The response rate of the retest procedure was recorded as 88.3% (53 subjects).
A medical officer and two trained research assistants approached the subjects. Information about the study was provided for all using an information sheet. The queries and clarifications were answered verbally upon their request. Subsequently, informed written consent from the participants was obtained. The T2DM study group subjects answered both the self-administered S-PSS-10 and S-PHQ-9 including a structured questionnaire (demographics and medical history) and with the help of the medical officer and research assistants. Similarly, the questionnaire was self-administered by the healthy control group and community control groups. Research assistants were available for any clarification. For the test–retest, the S-PSS-10 was provided twice to the T2DM patients (n = 40) and ASMHC group subjects (n = 53) for the reliability assessment.
The ethical clearance was obtained from the Ethics Review Committee (ERC), Faculty of Medicine, University of Colombo Sri Lanka under reference numbers EC-20-010 and EC-19-106. The study was also registered under the Sri Lanka clinical trials registry under the registration number SLCTR/2021/012. The PHQ-9 and PSS-10 make a sensitive inquiry into the mental state of patients and indicate at times on the presence of anxiety/depression. Patients who had high scores for depression were referred to the ward and clinic medical officers for further evaluation.
Descriptive statistics of the three groups were reported as means and standard deviations. The distribution of respondents’ perceived stress levels and level of depression according to the categorization of the PSS-10 and PHQ-9, respectively have been represented using percentage values.
Statistical analyses were performed with SPSS version 26.0 (SPSS Inc., Chicago, IL, United States). Internal consistency was measured using Cronbach’s alpha coefficient for each sample. The test–retest reliability of the S-PSS-10 was assessed using Spearman’s correlation coefficient (rho).
The one-way ANOVA compared the mean S-PSS-10 and S-PHQ-9 scores between the three groups. Post-hoc comparisons were done using Bonferroni’s method. Mean scores were compared between the T2DM, ASMHC, and HCC groups using the independent t-test.
Explanatory Factor Analysis (EFA) was conducted using the principal component and Varimax rotation with Kaiser normalization. The sample adequacy was assessed by the Kaiser-Meyer-Olkin (KMO) measure of sampling adequacy. Confirmatory Factor Analysis (CFA) was performed to assess the goodness-of-fit of the factor structure extracted from the EFA. The CFA analyses were conducted using IBM SPSS Statistics AMOS version 23.0 (SPSS Inc., Chicago, IL, United States). The maximum-likelihood estimation (MLE) method was employed to test the covariance matrix to assess the model fit. Furthermore, the structural equation modeling (SEM) in AMOS was also conducted to assess the model fit using path diagrams and standardized regression weights. All the other analyses were performed with SPSS version 26.0 (SPSS Inc., Chicago, IL, United States). The p-values less than p < 0.05 were considered significant.
The concurrent validity of the PSS-10 questionnaire was assessed by administering a validated Sinhalese Patient Health Questionnaire (S-PHQ-9) for both groups concurrently (Hanwella et al., 2014). The PHQ-9 is an instrument to monitor the severity of depression and response to treatment. The questionnaire possesses nine questions, based on the gold standard DSM-IV criteria of depression. The sensitivity and specificity of the PHQ-9 tool were previously reported as 0.75 and 0.97, respectively. As per the literature, the PSS-10 and PHQ-9 have been observed to correlate positively As the T2DM patients have chronic illnesses and comorbidities, we expected higher stress levels among this population when compared with the healthy control group. Hence, we anticipated a positive association between the two tools. Evidence of concurrent validity was assessed by Pearson correlation between the S-PSS-10 and nine-item Patient Health Questionnaire measured by S-PHQ-9, respectively (p < 0.05).
The mean age of the three samples T2DM, ASMHC and HCC were 58.4 ± 10.2, 57.0 ± 11.2, and 46.2 ± 13.8, respectively. The majority among the T2DM and its age and sex match healthy control group were females with 62 and 60% percentages, while there were 56% males in the healthy community control group. The percentage distributions of the perceived stress levels calculated according to the respective scores across the three groups were T2DM (L-5%, M-53%, and H-42%), age and sex matched healthy control (L-15%, M-50%, and H-35%) and community controls (L-8%, M-56%, and H-36%). There were 10% with moderate depression in T2DM group, whereas only 2% found in the ASMHC group (see Table 3).
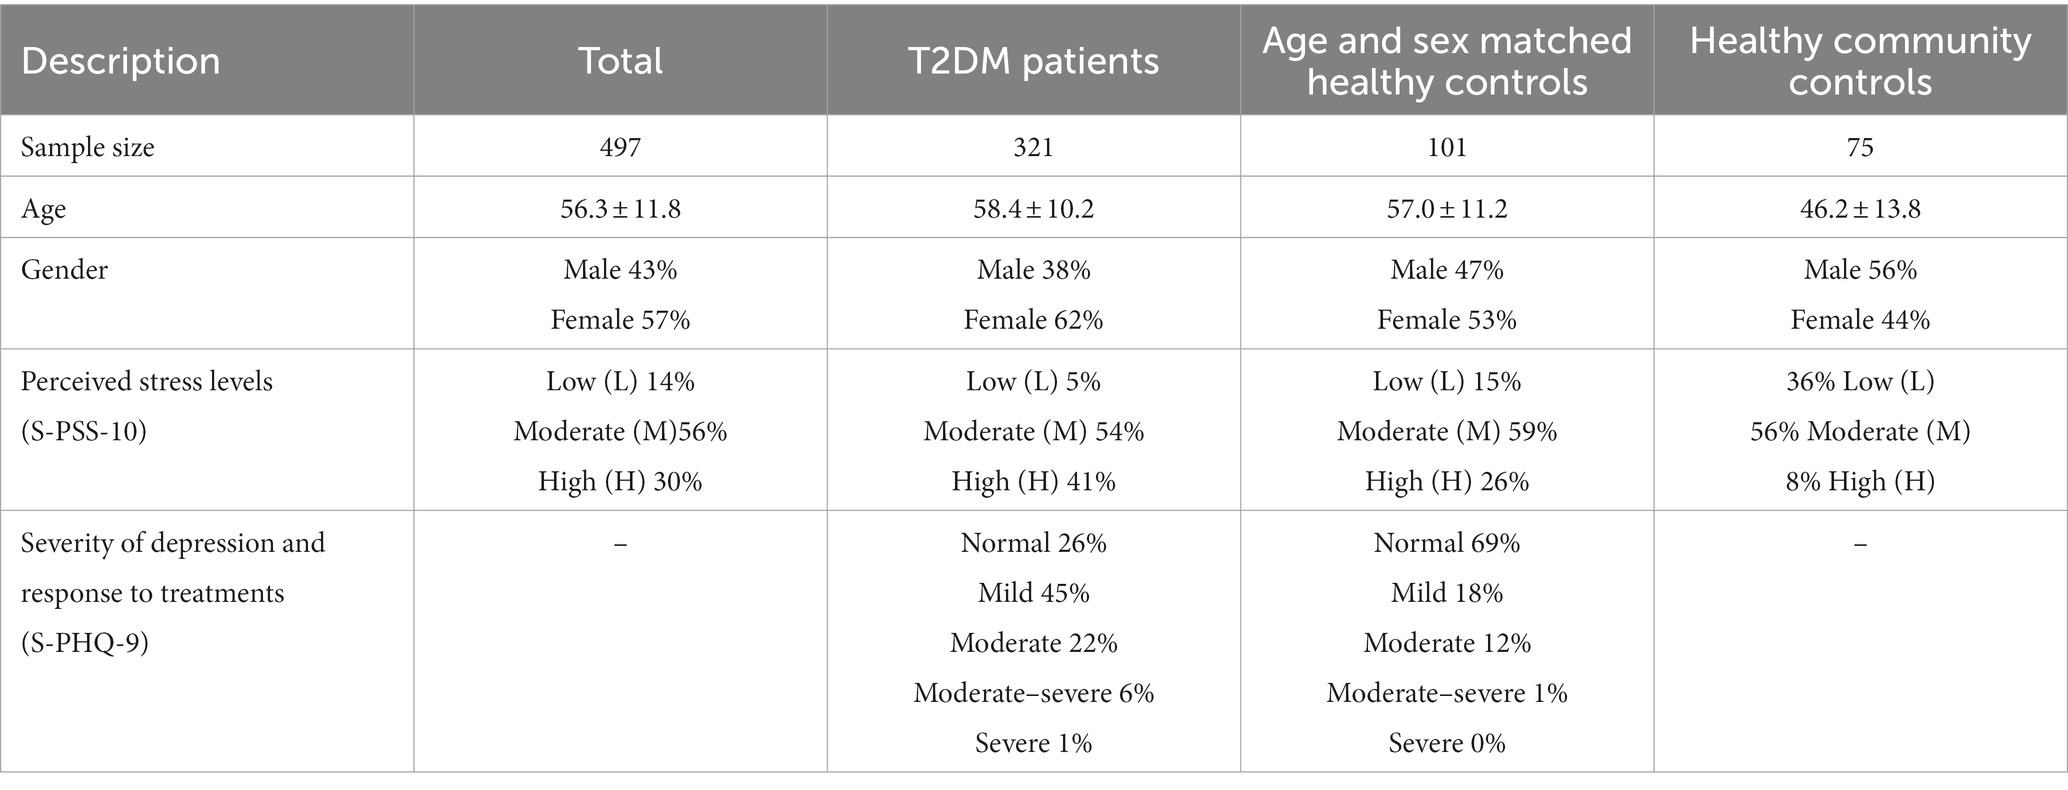
Table 3. Demographic and psychometric characteristics of the participants.
The mean perceived stress scores among the groups were reported as total: 21.4 ± 6.9, T2DM: 23.9 ± 6.0, ASMHC: 17.9 ± 6.0, and HCC:15.8 ± 6.4. All Cronbach’s alpha values of the three groups were reported above 0.7 indicating a good internal consistency reliability of the S-PSS-10. The Cronbach’s alpha values ranged from 0.79 to 0.87. The mean scores of the S-PSS-10 item scale comprising the two subscales and corresponding standard deviations are presented in Table 4. The Spearman correlation coefficient value for the test–retest was obtained as 0.74 and 0.92 in T2DM and ASMHC groups, respectively and the correlation was significant at the 0.01 level (two-tailed).
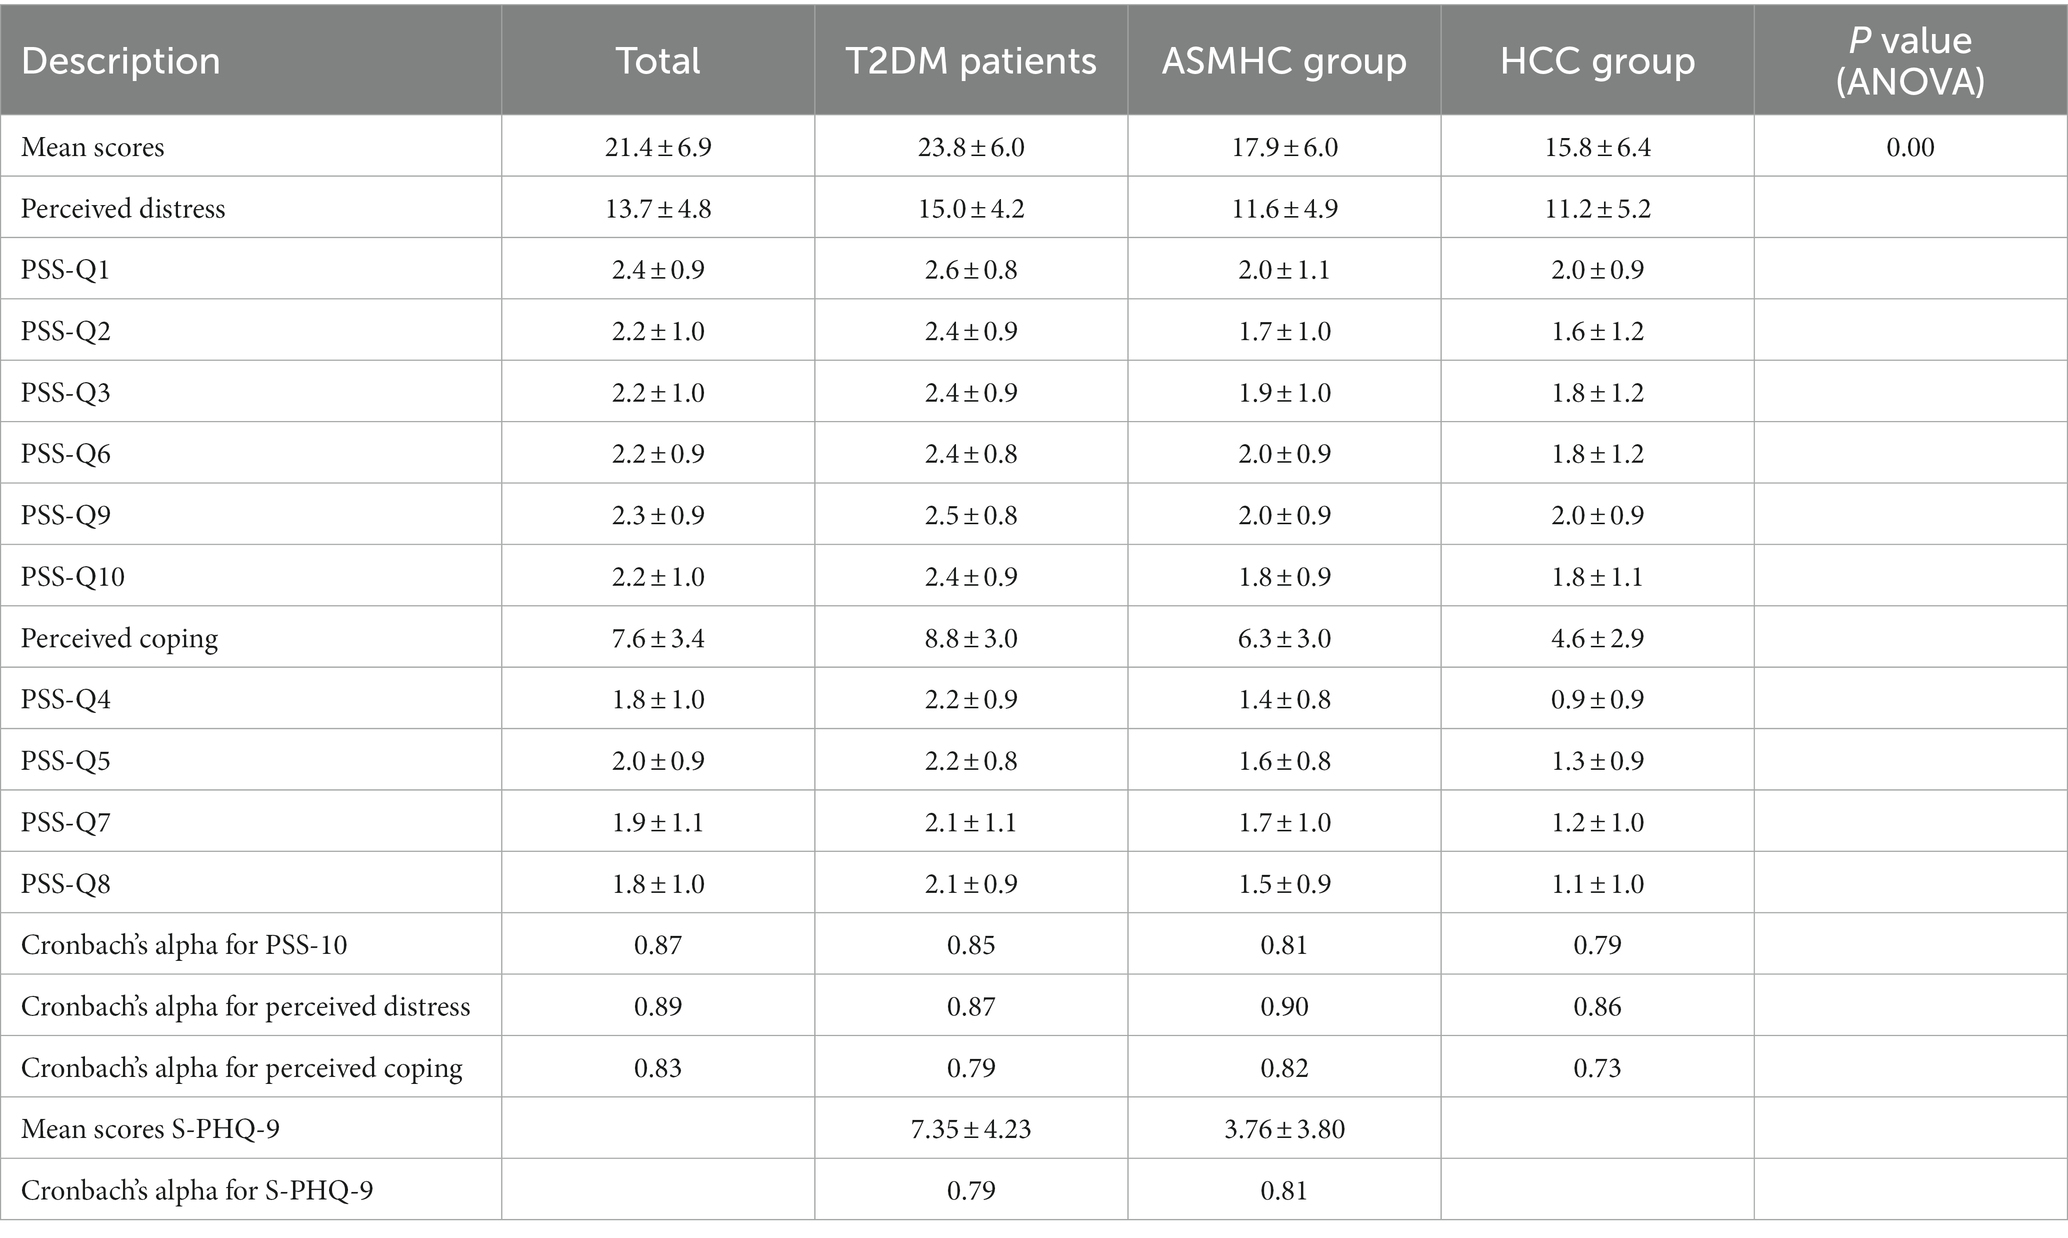
Table 4. Mean scores, standard deviations and internal consistency of the Sinhalese S-PSS-10.
The sensitivity of S-PSS-10 questionnaire was assessed by comparing the mean scores across the three groups. As expected, the mean score was higher in the T2DM group compared to the two other groups (Table 5). Results of the ANOVA test suggested a significant difference in the mean scores between groups (p < 0.00). However, the findings of the Post hoc test for multiple comparisons (Bonferroni test) indicated that there was no significant difference between the mean scores of the ASMHC and HCC groups (p < 0.07) while the mean scores of the T2DM showed significant differences with the two other groups. Anyhow, the independent t-test results were significant between each group at (p < 0.05).
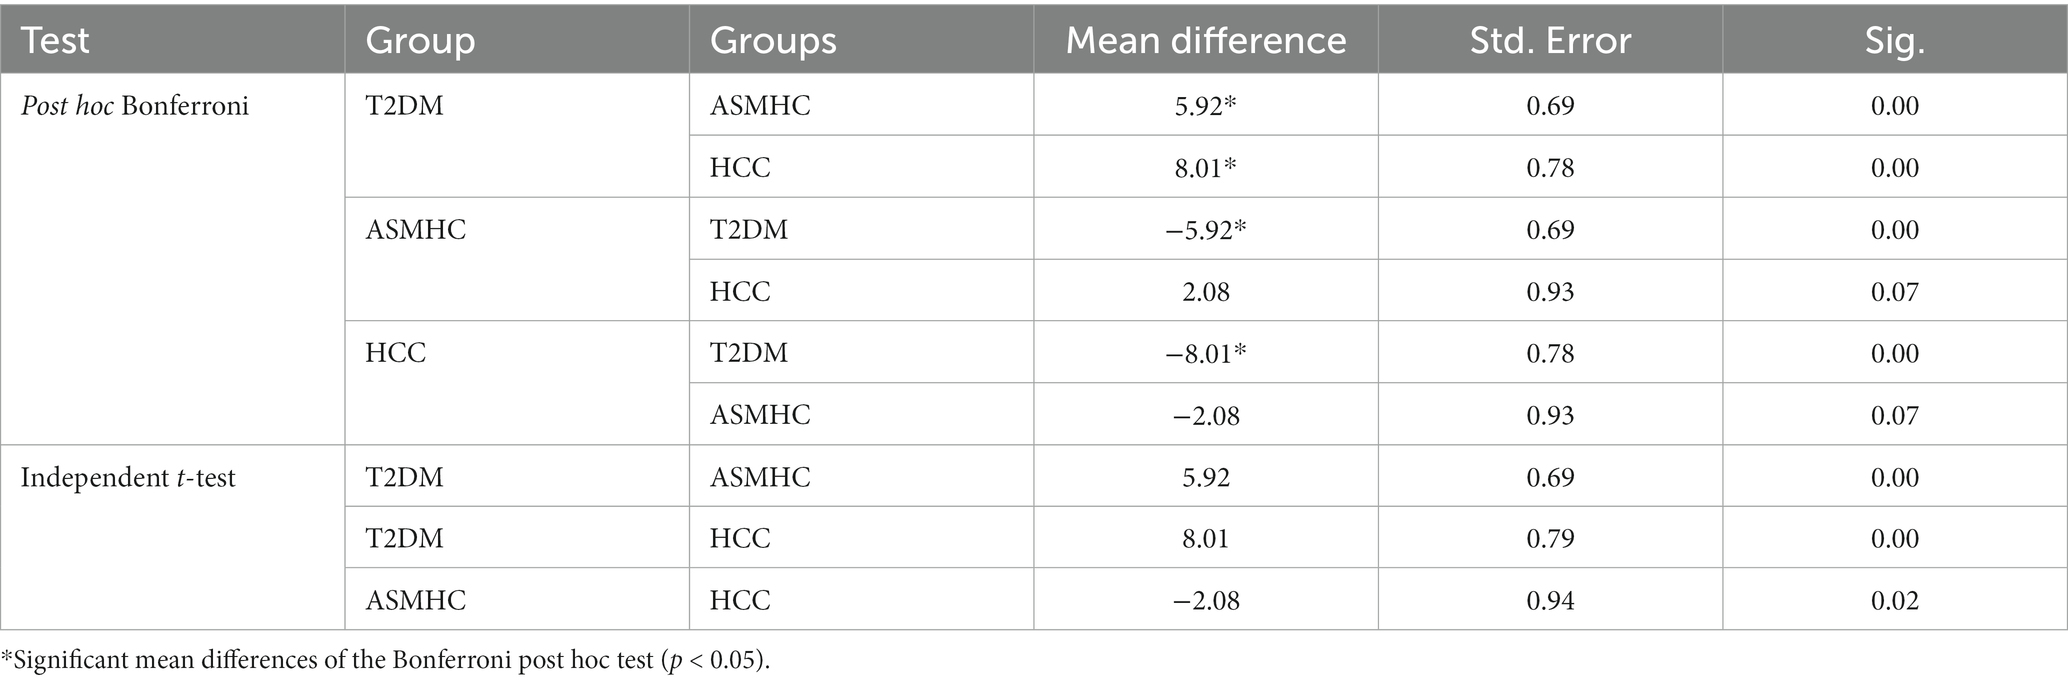
Table 5. Results of the multiple comparisons of the mean scores.
The EFA results showed compelling evidence of adequacy for conducting the Factor Analysis in the Total, T2DM and ASMHC groups. All values resulted in the Correlation matrix (data not shown) were less than 0.6 and confirmed that there are no similar items in the questionnaire. The Kaiser-Meyer-Olkin (KMO) Measure of Sampling Adequacy was reported as 0.88, representing good sampling adequacy in the T2DM group. Also, the approximate Chi-square value of the Bartlett’s test of sphericity was 1274.8 and statistically significant (p < 0.000). Two factors were identified for the S-PSS-10 scale with eigenvalues greater than 1.0, accounting for 61.95% of the total variance. Factor 1 comprised 6 items representing “Perceived distress/negative feelings” (Items 1, 2, 3, 6, 9, and 10) with a variance of 43.81%, whereas Factor 2 consisted of 4 items representing “perceived distress/positive feelings” (Items 4, 5, 7, and 8) resulting a variance of 18.13%. All groups showed good compliance to the two-factor model (See Table 6). For combined groups, the total scree plot is presented in Figure 2.
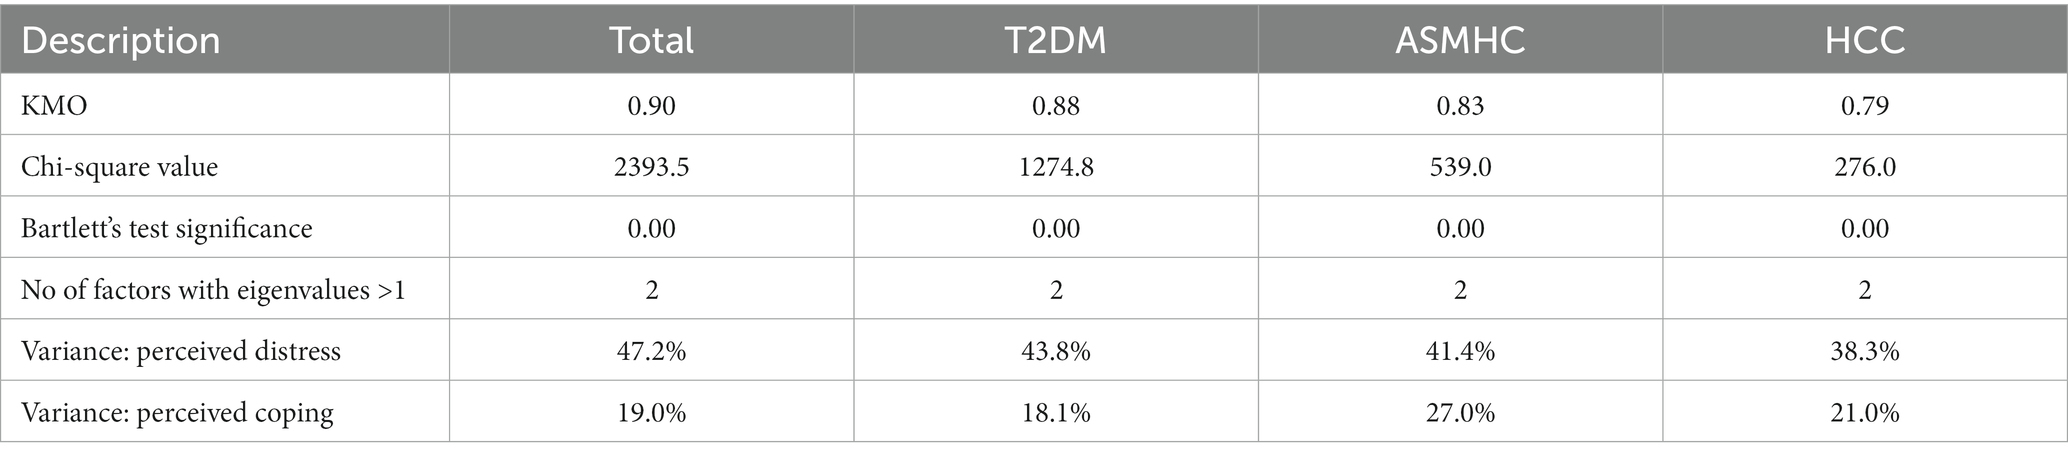
Table 6. Results of the exploratory factor analysis.
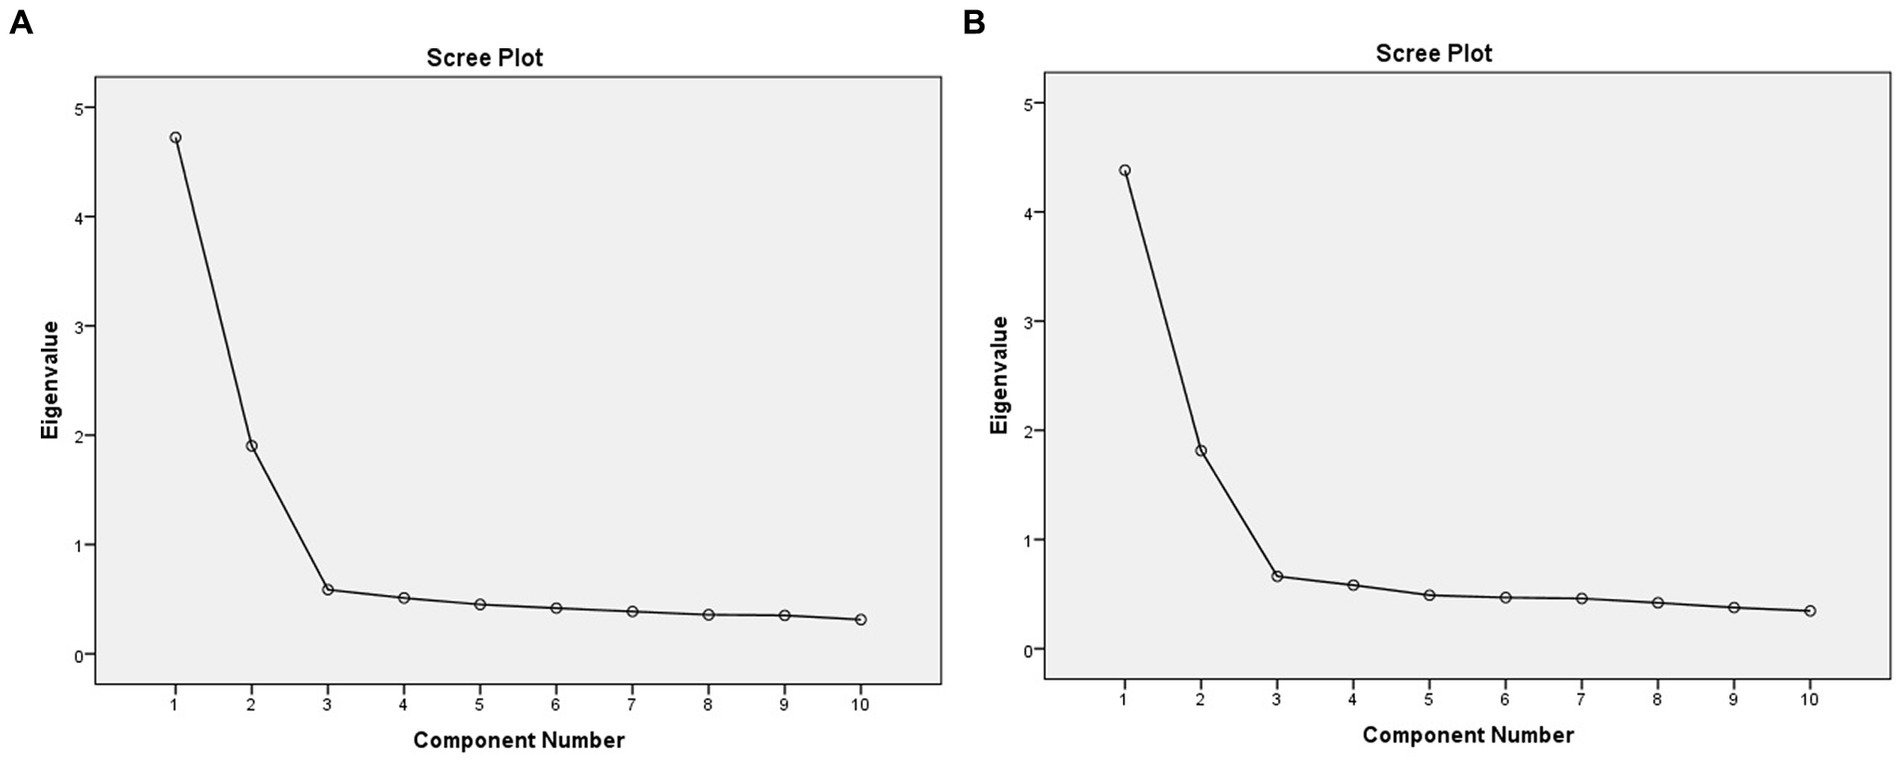
Figure 2. Scree plot analysis of the (A) total groups and (B) T2DM group.
Also, there were two factors identified in the Rotated Component Matrix in the total and in the T2DM group. The factor loadings for the items ranged from 0.71 to 0.83. The respective factor loadings for the S-PSS-10 items are presented in Table 7.
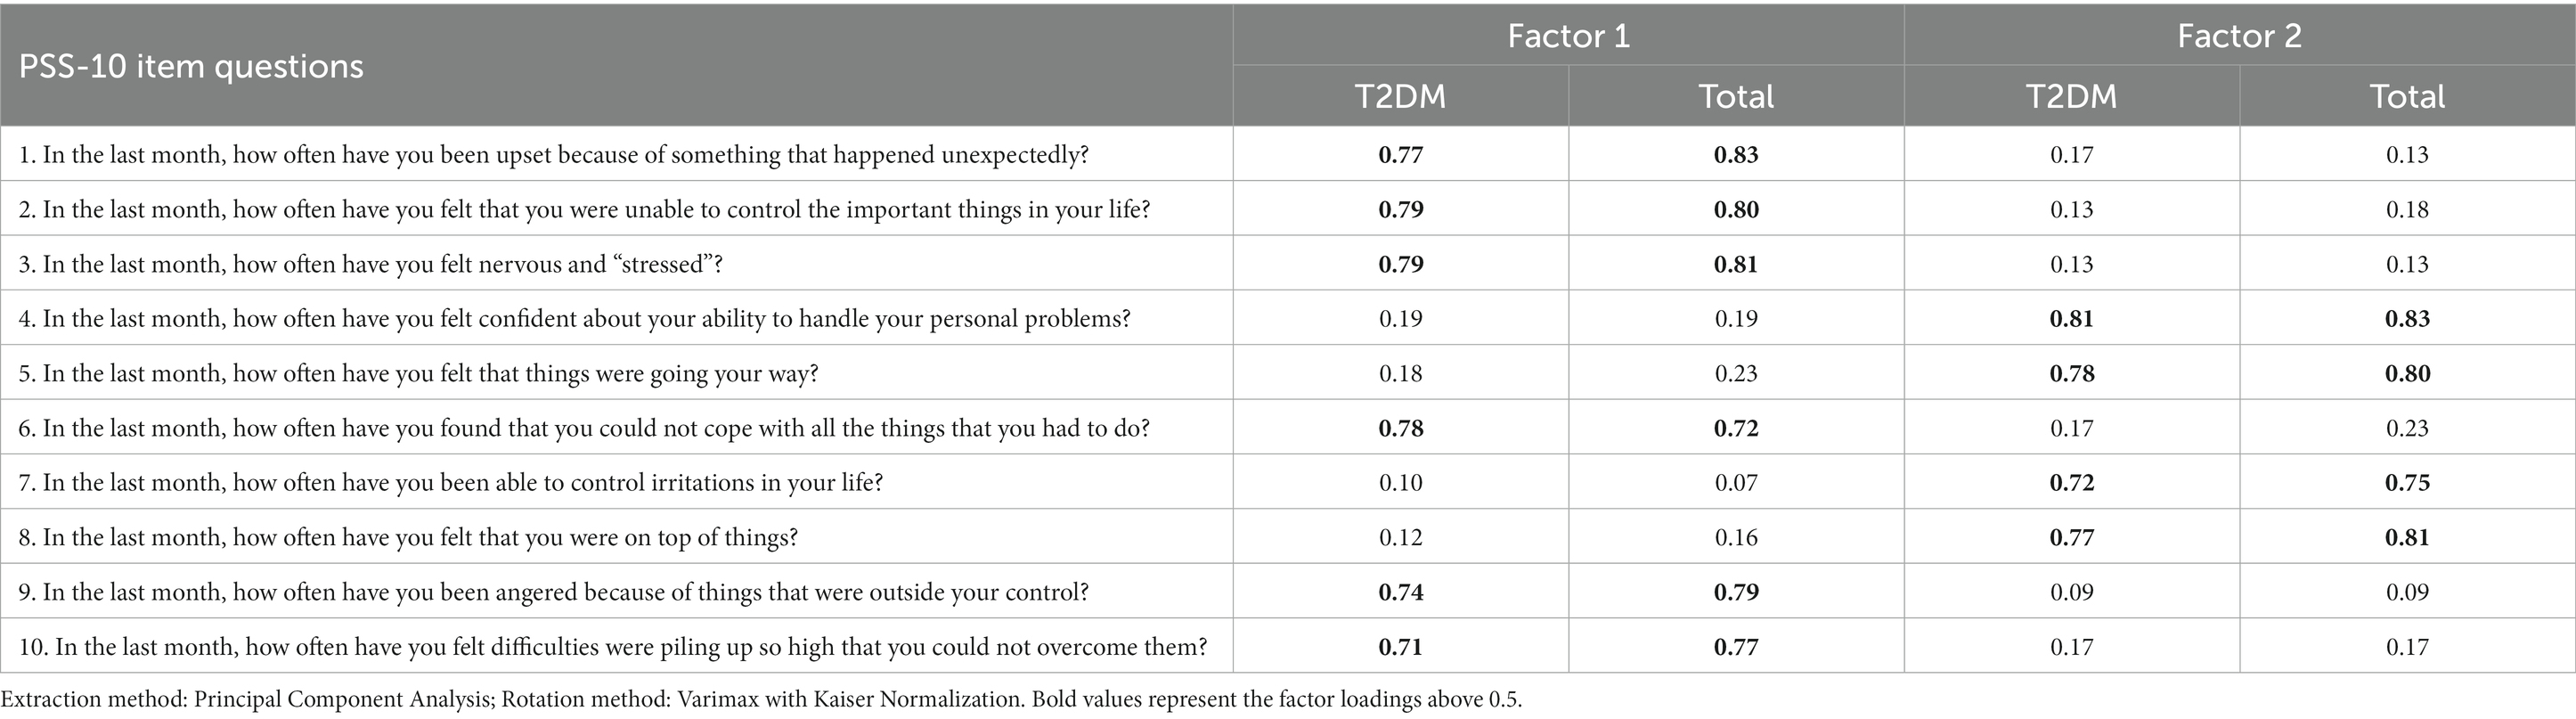
Table 7. Rotated component matrix of the T2DM sample.
The CFA was performed to determine the goodness-of-fit for the two-factor model resulted from the EFA. An acceptable normality level was reported in the T2DM group, resulting in multivariate kurtosis values of less than 5. The maximum-likelihood estimation (MLE) method was employed to test the covariance matrix to assess the model fit of the sample data. All critical ratios under regression weights were above 1.96 and the results of the estimates of the regression weights were significant (data not shown). Considering the data of the total sample, the minimum and maximum standardized regression weights were reported as 0.71 and 0.81 (perceived distress/negative feelings) and 0.63 and 0.81 (perceived ping/positive feelings) while their squared loadings were ranged from 0.50 to 0.66 and 0.63–0.81, respectively. The Covariance between the perceived distress and perceived coping was recorded as 0.46 in the standardized estimate for the total groups. The path diagram of the total groups with the standardized estimates is presented in Figure 3.
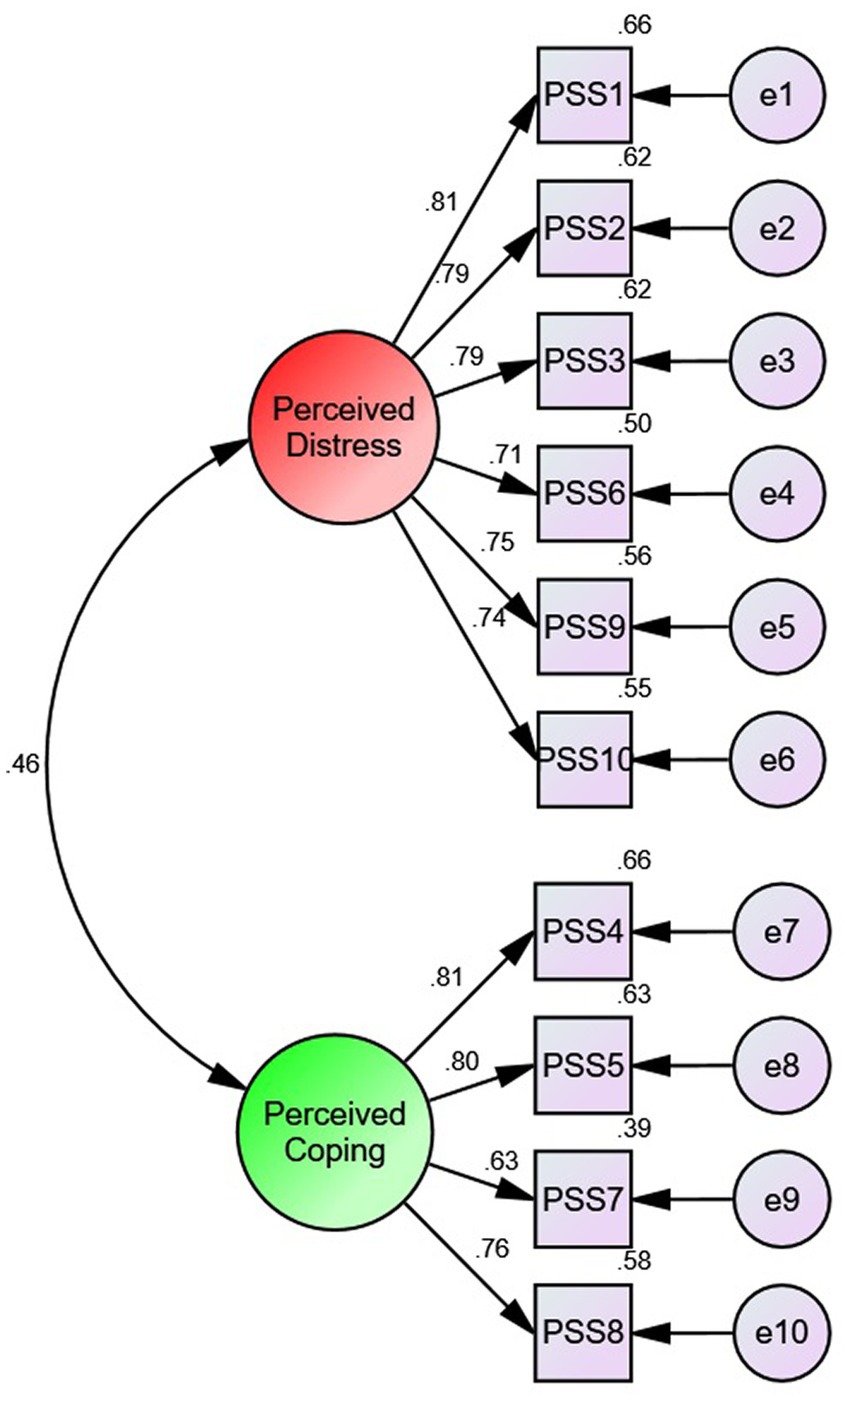
Figure 3. Path diagram with standardized estimates of the two factor Sinhalese PSS-10 items.
The findings of the goodness-of-fit measures demonstrated that two factor model was adequate for all three groups, including the combined total sample group (see Table 8). In the T2DM group, the model fit measures were reported as Chi-square – χ2 (CMIN) = 32.14, degrees of freedom = 34, and a non-significant Likelihood ratio p-value of 0.559. Similarly, other model fit measures demonstrated good evidence for the two-factor model: CMIN/DF = 0.94; Root Mean square Error of Approximation (RMSEA) = 0.00; Normed Fit Index (NFI) = 0.97; Comparative Fit Index (CFI) = 1.0 and Tucker-Lewis index (TLI) = 1.0. The lowest likelihood ratio p-value of 0.056 was obtained in the ASMHC group; all values were non-significant indicating an excellent model fit. The CMIN/DF values ranged from 0.94 to 1.41 with a reasonable model fit. All RMSEA values were less than 0.08 and showed reasonable model fit. The NFI and values were in between 0.87 and 1.0 eliciting a reasonable fit while all CFI values were above 0.9 elucidating an excellent model fit.

Table 8. Model fit measures of the three groups.
The Pearson correlation coefficient between the Sinhalese PSS-10 and validated Sinhalese PHQ-9 was reported as 0.64 in the T2DM group and 0.52 in the ASMHC group. As expected, S-PHQ-9 scale showed a significant positive correlation with the S-PSS-10 in both samples (p < 0.05).
The current study is the first attempt to evaluate the reliability and validity of the Sinhalese version of the PSS-10 scale in Sri Lanka. The analyses revealed that the Sinhalese-translated PSS-10 two factor questionnaires had substantial evidence for the elicitation of psychometric properties. Considering the internal consistency of total group, the Cronbach alpha values were similar to the previously published research in Germany (Bastianon et al., 2020). The reliability coefficients of the three groups ranged from 0.79 to 0.85 and were also the consistent with the studies conducted in Mexico and South Korea (Lee et al., 2015; Makhubela, 2022). The correlation coefficients of the test–retests were higher than 0.7 for T2DM and ASMHC and were significant. Though both values were significant, the ASMHC had a higher correlation coefficient than T2DM. A possible explanation is the shorter retesting time of the ASMHC group, which negated the effects of any events that might have affected the scores of the second interview resulting in increased reliability (Chaaya et al., 2010).
According to the literature, the sensitivity of the PSS-10 is comparatively higher among the people with chronic illnesses (Zhao et al., 2018; Soria-Reyes et al., 2023). Cohen et al. (1983) also reported that higher level of perceived stress is associated whenever there are failures among diabetics to control blood sugar levels (Wiernik et al., 2016; Hackett and Steptoe, 2017). As predicted, the mean perceived stress score of the T2DM sample was reported significantly higher compared with the other two groups eliciting a good sensitivity of the S-PSS-10. The mean perceived stress score of T2DM sample was obtained as 23.8 ± 6.0 and the value was comparable with previously published perceived stress scores of T2DM patients in Greece (Koloverou et al., 2014). Hence, the results obtained in our sample also supported the evidence for the validity among T2DM patients (Hanson and Pichert, 1986).
In principal component analysis, there were two factors identified which resulted eigenvalues greater 1. According to the previously published literature, these two factors have been identified and named as ‘perceived distress or perceived helplessness’ and ‘perceived coping or perceived self-efficacy.’ Furthermore, the findings of the Rotated component matrix for the total groups resulted in two identified factors which were similar to the previously published research in China where the values of the factor loadings ranged from 0.72 to 0.83 (Wang et al., 2011).
The likelihood of estimation showed strong evidence of validity during the CFA analysis. The likelihood ratio p-values of all three groups were not significant (p < 0.05). Assuming that the default models are correct, the probability of getting discrepancies as large as 47.08 and 32.149 are 0.55 and 0.06 in the total sample and T2DM group, respectively. Similar non-significant Chi-square values of likelihood estimation were also reported in the studies conducted in China and UAE (Chaaya et al., 2010; Wang et al., 2011). All RMSEA values were less than 0.08 and indicated a reasonable error of approximation with a comparable fit of the model in relation to the degrees of freedom. The relative fit indices of Bentler-Bonett normed fit index (NFI) and Tucker-Lewis index (TLI) values were between 0.9 and 1.0. According to their experience, models with overall fit indices around 0.9 can usually be improved substantially while TLI values close to 1 indicate a good model fit. The findings of the Bangladesh validity study have also resulted in similar findings with RMSEA = 0.05, CFI = 0.95 and TLI = 0.93 demonstrating a good validity in our sample groups (Mozumder, 2022). As predicted, the S-PSS-10 had positive associations with the S-PHQ-9 that was previously validated in Sri Lanka (Hanwella et al., 2014). This significant correlation in the T2DM group (r = 0.61) could be due to higher stress levels in T2DM patients owing to multiple comorbidities and complications as well as a higher tendency to have depression due to the chronicity of the illness (Carey et al., 1991; Gillani, 2011). Despite the two-factor structure of PSS-10, the PHQ-9 which has one-factor structure and PSS-10 were correlated significantly (r = 0.63) in previously published research supporting our evidence (López-Guerra et al., 2022). A brief summary of PSS-10 validity and reliability studies is presented in Table 1 to compare and contrast the findings of our study. All studies included for comparison were comprised of PSS-10 validated studies. Validity studies published with PSS-4 and PSS-14 were excluded as the current study employed the 10-item perceived stress scale.
Even though there are contradictory findings, the PSS-10 two factor structure has shown adequate psychometric evidence of validity. The diversity of construct validity results could be due to different statistical techniques, sample heterogeneity (i.e., age, sex, ethnicity, and culture), participant characteristics (i.e., diseased, community-based and specific groups) and sample size (Lee and Jeong, 2019). However, the factor analysis statistical techniques to assess the construct validity can be utilized effectively to provide the evidence of validity. Considering the findings of the previously validated studies, the current study has shown conclusive evidence for the validity of S-PSS-10.
Therefore, findings of this study have shown conclusive evidence for the validity of S-PSS-10. The two-factor structure of the S-PSS-10 possessed high internal consistency and reliability compared to the previously published research while showing strong evidence of concurrent validity. Essentially, the EFA and CFA analysis have provided acceptable model fit the evidence of the S-PSS-10 version. Hence, future research based in communities, clinical settings and busy outpatient clinics can use this validated questionnaire to assess perceived stress. Further, using the impact event scale or similar psychometric methods along with the S-PSS-10 could identify the specific life stressors contributing to perceived stress.
This study was conducted during the post-COVID period where the majority of the Sri Lankans are facing an economic melt-down which had led to unprecedented inflation. This may have contributed to elevated stress levels but would have affected all three groups similarly as it was a problem common to all Sri Lankans. Hence, the stress assessment across the three groups is higher and comparable. Importantly, this tool was administered in an out-patient clinic and wards of the NHSL showing evidence that S-PSS-10 tool can be practically administered to assess stress in similar busy clinical settings. Further, the study populations consisted of different subsets representing several groups which supports the generalizability of findings. Though the T2DM group had consecutive sampling, the convenient sampling techniques employed in the ASMHC, and HCC groups could undermine the significance of the study in the national context. Additionally, concurrently assessment of the convergent validity using an impact event scale would have enhanced the validation process.
This study has provided evidence of validity and reliability for the S-PSS-10 scale. In future, this tool can be used to assess perceived stress across different groups, provided, there is evidence for internal consistency and factor structure the respective populations. Furthermore, the S-PSS-10 being a concise and easy to use questionnaire which can be administered within a short time period is an appropriate tool to be used in busy Sri Lankan clinic settings. This property makes it a good tool to be used for patients with chronic illnesses and pain. Identifying the psychometric properties of the S-PSS-10 could also provide valuable evidence for the healthcare management to assess stress of people with non-communicable diseases and those facing difficult social circumstances. Therefore, it is proposed that the S-PSS-10 can be used as a robust tool to screen for stress and thereby suggest interventions to prevent adverse physical and mental health problems and mitigate the adverse impact of these on the country’s economy.
The original contributions presented in the study are included in the article/Supplementary material, further inquiries can be directed to the corresponding author.
The studies involving human participants were reviewed and approved by the Ethics Review Committee (ERC), Faculty of Medicine, University of Colombo Sri Lanka. The patients/participants provided their written informed consent to participate in this study. The ERC certificate reference numbers are EC-20-010 and EC-19-106. The study is also registered under the Sri Lanka clinical trials registry under the registration number SLCTR/2021/012.
AD, IR, and BM: conceptualization. BM, PP, IR, and AD: methodology. PP, BM, PK, IR, AH, WK, AB, KK, GP, and AD: investigation. AD, IR, DS, and JP: proofreading. WD and DS: resources. BM, KK, and PP: data curation. BM and AH: writing—original draft preparation. BM, AD, DS, JP, and IR: writing and editing. BM and AD: visualization. DS, JP, AD, IR, PK, SY, WH, WD, and US: supervision. WD and DS: project administration. DS, WD, JP, AD, IR, SY, and WH: funding acquisition. All authors have read and agreed to the published version of the manuscript.
This project and the article processing charge (APC) of this publication were funded by the World Bank under the “Development-Oriented Research” scheme of the “Accelerating Higher Education and Expansion (AHEAD)” project, Ministry of Education, Sri Lanka (AHEAD/DOR/STEM+HEMS No. 78).
The authors like to thank the medical staff and nursing staff of the General medicine clinic and professorial wards 41 and 48B wards) of the National Hospital of Sri Lanka.
The authors declare that the research was conducted in the absence of any commercial or financial relationships that could be construed as a potential conflict of interest.
All claims expressed in this article are solely those of the authors and do not necessarily represent those of their affiliated organizations, or those of the publisher, the editors and the reviewers. Any product that may be evaluated in this article, or claim that may be made by its manufacturer, is not guaranteed or endorsed by the publisher.
The Supplementary material for this article can be found online at: https://www.frontiersin.org/articles/10.3389/fpsyg.2023.1152002/full#supplementary-material
SUPPLEMENTARY TABLE S1 | Raw data file.
SUPPLEMENTARY DATA SHEET S1 | Sinhalese version of the ten-item Perceived Stress Scale.
American Diabetes Association (2020). Classification and diagnosis of diabetes: standards of medical care in Diabetes-2020. Diabetes Care 43, S14–S31. doi: 10.2337/dc20-S002
Andreou, E., Alexopoulos, E. C., Lionis, C., Varvogli, L., Gnardellis, C., Chrousos, G. P., et al. (2011). Perceived stress scale: reliability and validity study in Greece. Int. J. Environ. Res. Public Health 8, 3287–3298. doi: 10.3390/ijerph8083287
Bastianon, C. D., Klein, E. M., Tibubos, A. N., Brähler, E., Beutel, M. E., and Petrowski, K. (2020). Perceived Stress Scale (PSS-10) psychometric properties in migrants and native Germans. BMC psychiatry 20, 1–9. doi: 10.1186/s12888-020-02851-2
Bullinger, M., Alonso, J., Apolone, G., Leplège, A., Sullivan, M., Wood-Dauphinee, S., et al. (1998). Translating health status questionnaires and evaluating their quality: the IQOLA project approach. J. Clin. Epidemiol. 51, 913–923. doi: 10.1016/S0895-4356(98)00082-1
Carbone, J. T. (2021). Allostatic load and mental health: a latent class analysis of physiological dysregulation. Stress 24, 394–403. doi: 10.1080/10253890.2020.1813711
Carey, M. P., Jorgensen, R. S., Weinstock, R. S., Sprafkin, R. P., Lantinga, L. J., Carnrike, C. L. M., et al. (1991). Reliability and validity of the appraisal of diabetes scale. J. Behav. Med. 14, 43–50. doi: 10.1007/BF00844767
Chaaya, M., Osman, H., Naassan, G., and Mahfoud, Z. (2010). Validation of the Arabic version of the Cohen perceived stress scale (PSS-10) among pregnant and postpartum women. BMC Psychiatry 10:111. doi: 10.1186/1471-244X-10-111
Cohen, S., Kamarck, T., and Mermelstein, R. (1983). A global measure of perceived stress. J. Health Soc. Behav. 24, 385–396. doi: 10.2307/2136404
Cristóbal-Narváez, P., Haro, J. M., and Koyanagi, A. (2020). Perceived stress and depression in 45 low- and middle-income countries. J. Affect. Disord. 274, 799–805. doi: 10.1016/j.jad.2020.04.020
DeVotta, N. (2016). Engaging Sinhalese Buddhist Majoritarianism and countering religious animus in Sri Lanka: recommendations for the incoming U.S. administration. Review Faith Int. Affairs 14, 76–85. doi: 10.1080/15570274.2016.1184440
Fava, G. A., McEwen, B. S., Guidi, J., Gostoli, S., Offidani, E., and Sonino, N. (2019). Clinical characterization of allostatic overload. Psychoneuroendocrinology 108, 94–101. doi: 10.1016/j.psyneuen.2019.05.028
Feizi, A., Aliyari, R., and Roohafza, H. (2012). Association of perceived stress with stressful life events, lifestyle and sociodemographic factors: a large-scale community-based study using logistic quantile regression. Comput. Math. Methods Med. 2012, 1–12. doi: 10.1155/2012/151865
Gamonal-Limcaoco, S., Montero-Mateos, E., Lozano-López, M. T., Maciá-Casas, A., Matías-Fernández, J., and Roncero, C. (2021). Perceived stress in different countries at the beginning of the coronavirus pandemic. Int. J. Psychiatry Med. 57, 309–322. doi: 10.1177/00912174211033710
Gebicki, J., Katarzynska, J., and Marcinek, A. (2023). Effect of psychological stress on microcirculation oscillations: diagnostic aspects. Vasc. Health Risk Manag. 19, 79–82. doi: 10.2147/VHRM.S399082
Gillani, S. (2011). Perceived stress scale psychometric validation for Malaysian diabetic patients. Br. J. Pharm. Res. 1, 156–163. doi: 10.9734/bjpr/2011/511
González-Ramírez, M. T., Rodríguez-Ayán, M. N., and Hernández, R. L. (2013). The perceived stress scale (PSS): normative data and factor structure for a large-scale sample in Mexico. Span. J. Psychol. 16, E47–E49. doi: 10.1017/sjp.2013.35
Goymann, W., and Wingfield, J. C. (2004). Allostatic load, social status and stress hormones: the costs of social status matter. Anim. Behav. 67, 591–602. doi: 10.1016/j.anbehav.2003.08.007
Guidi, J., Lucente, M., Sonino, N., and Fava, G. A. (2021). Allostatic load and its impact on health: a systematic review. Psychother. Psychosom. 90, 11–27. doi: 10.1159/000510696
Hackett, R. A., and Steptoe, A. (2017). Type 2 diabetes mellitus and psychological stress-a modifiable risk factor. Nat. Rev. Endocrinol. 13, 547–560. doi: 10.1038/nrendo.2017.64
Hanson, S. L., and Pichert, J. W. (1986). Perceived stress and control in diabetes adolescents. Health Psychol. 5, 439–452. doi: 10.1037/0278-6133.5.5.439
Hanwella, R., Ekanayake, S., and De Silva, V. A. (2014). The validity and reliability of the Sinhala translation of the patient health questionnaire (PHQ-9) and PHQ-2 screener. Depress. Res. Treat. 2014, 1–5. doi: 10.1155/2014/768978
Hayes, A. F., and Coutts, J. J. (2020). Use omega rather than Cronbach’s alpha for estimating reliability. But…. Communication Methods and Measures 14, 1–24. doi: 10.1080/19312458.2020.1718629
Kokka, I., Chrousos, G. P., Darviri, C., and Bacopoulou, F. (2022). Measuring adolescent chronic stress: a review of established biomarkers and psychometric instruments. Horm. Res. Paediatr. 96, 74–82. doi: 10.1159/000522387
Koloverou, E., Tentolouris, N., Bakoula, C., Darviri, C., and Chrousos, G. (2014). Implementation of a stress management program in outpatients with type 2 diabetes mellitus: a randomized controlled trial. Hormones 13, 509–518. doi: 10.14310/horm.2002.1492
Lee, E. H. (2012). Review of the psychometric evidence of the perceived stress scale. Asian Nurs. Res. 6, 121–127. doi: 10.1016/j.anr.2012.08.004
Lee, E. H., Chung, B. Y., Suh, C. H., and Jung, J. Y. (2015). Korean versions of the perceived stress scale (PSS-14, 10 and 4): psychometric evaluation in patients with chronic disease. Scand. J. Caring Sci. 29, 183–192. doi: 10.1111/scs.12131
Lee, B., and Jeong, H. I. (2019). Construct validity of the perceived stress scale (PSS-10) in a sample of early childhood teacher candidates. Psychiatr. Clin. Psychopharmacol. 29, 76–82. doi: 10.1080/24750573.2019.1565693
Li, X., Gu, Y., Qi, M., Chen, R., Xiao, D., Yuan, P., et al. (2023). Neurobiochemical biomarkers and other risk factors for post-traumatic acute stress disorder. J. Psychiatr. Res. 157, 276–284. doi: 10.1016/j.jpsychires.2022.12.005
Liu, X., Zhao, Y., Li, J., Dai, J., Wang, X., and Wang, S. (2020). Factor structure of the 10-item perceived stress scale and measurement invariance across genders among Chinese adolescents. Front. Psychol. 11:537. doi: 10.3389/fpsyg.2020.00537
López-Guerra, V. M., López-Núñez, C., Vaca-Gallegos, S. L., and Torres-Carrión, P. V. (2022). Psychometric properties and factor structure of the patient health questionnaire-9 as a screening tool for depression among Ecuadorian college students. Front. Psychol. 13:813894. doi: 10.3389/fpsyg.2022.813894
Makhubela, M. (2022). Assessing psychological stress in South African university students: measurement validity of the perceived stress scale (PSS-10) in diverse populations. Curr. Psychol. 41, 2802–2809. doi: 10.1007/s12144-020-00784-3
Malhotra, R., Chan, A., and Østbye, T. (2010). Prevalence and correlates of clinically significant depressive symptoms among elderly people in Sri Lanka: findings from a national survey. Int. Psychogeriatr. 22, 227–236. doi: 10.1017/S1041610209990871
Mondo, M., Sechi, C., and Cabras, C. (2021). Psychometric evaluation of three versions of the Italian perceived stress scale. Curr. Psychol. 40, 1884–1892. doi: 10.1007/s12144-019-0132-8
Mortensen, S. R., Kristensen, P. L., Grøntved, A., Ried-Larsen, M., Lau, C., and Skou, S. T. (2022). Determinants of physical activity among 6856 individuals with diabetes: a nationwide cross-sectional study. BMJ Open Diabetes Res. Care 10, 1–12. doi: 10.1136/bmjdrc-2022-002935
Mozumder, M. K. (2022). Reliability and validity of the perceived stress scale in Bangladesh. PLoS One 17:e0276837. doi: 10.1371/journal.pone.0276837
Noble, S., Scheinost, D., and Constable, R. T. (2019). A decade of test-retest reliability of functional connectivity: a systematic review and meta-analysis. Neuroimage 203:116157. doi: 10.1016/j.neuroimage.2019.116157
Oei, T. P. S., Sawang, S., Goh, Y. W., and Mukhtar, F. (2013). Using the depression anxiety stress scale 21 (DASS-21) across cultures. Int. J. Psychol. 48, 1018–1029. doi: 10.1080/00207594.2012.755535
Parker, H. W., Abreu, A. M., Sullivan, M. C., and Vadiveloo, M. K. (2022). Allostatic load and mortality: a systematic review and meta-analysis. Am. J. Prevent. Med. 63, 131–140. doi: 10.1016/j.amepre.2022.02.003
Peacock, E. J., and Wong, P. T. P. (1990). The stress appraisal measure (SAM): a multidimensional approach to cognitive appraisal. Stress Med. 6, 227–236. doi: 10.1002/smi.2460060308
Pothisiri, W., Vicerra, P. M. M., and Buathong, T. (2022). Poverty, noncommunicable diseases, and perceived health risks among older adults during the COVID-19 pandemic in urban Thailand. Asian Soc Work Policy Rev. 16, 126–135. doi: 10.1111/aswp.12253
Remor, E. (2006). Psychometric properties of a European Spanish version of the perceived stress scale (PSS). Spanish J. Psychol. 9, 86–93. doi: 10.1017/s1138741600006004
Roberti, J. W., Harrington, L. N., and Storch, E. A. (2006). Further psychometric support for the 10-item version of the perceived stress scale. J. Coll. Couns. 9, 135–147. doi: 10.1002/j.2161-1882.2006.tb00100.x
Schneiderman, N., Ironson, G., and Siegel, S. D. (2005). Stress and health: psychological, behavioral, and biological determinants. Annu. Rev. Clin. Psychol. 1, 607–628. doi: 10.1146/annurev.clinpsy.1.102803.144141
Soria-Reyes, L. M., Cerezo, M. V., Alarcón, R., and Blanca, M. J. (2023). Psychometric properties of the perceived stress scale (pss-10) with breast cancer patients. Stress Health 39, 115–124. doi: 10.1002/smi.3170
Suhr, D. D. (2006). “Exploratory or confirmatory factor analysis?” in Proceedings of the 31st Annual SAS Users Group International Conference, 1–17. Available at: https://support.sas.com/resources/papers/proceedings/proceedings/sugi31/200-31.pdf.
Tikka, S. K., Malathesh, B. C., Bhatia, V., Sahoo, D. P., Sreepada, N., and Meena, S. K. (2022). Factor structure of the Telugu version of the COVID-19 pandemic-related perceived stress scale (PSS-10-C) administered on grassroots frontline health Care Workers of Rural Telangana. Indian J. Psychol. Med. 44, 272–278. doi: 10.1177/02537176221086848
Tsegaye, B. S., Andegiorgish, A. K., Amhare, A. F., and Hailu, H. B. (2022). Construct validity and reliability Amharic version of perceived stress scale (PSS-10) among defense university students. BMC Psychiatry 22, 1–7. doi: 10.1186/s12888-022-04345-9
Vidyulatha, J., Pramodkumar, T. A., Pradeepa, R., Deepa, M., Poongothai, S., Venkatesan, U., et al. (2022). Prevalence and impact of stress among individuals with type 2 diabetes attending a tertiary diabetes center in South India. J. Diabetol. 13:122. doi: 10.4103/jod.jod_12_22
Wang, Z., Chen, J., Boyd, J. E., Zhang, H., Jia, X., Qiu, J., et al. (2011). Psychometric properties of the Chinese version of the perceived stress scale in policewomen. PLoS One 6, 1–4. doi: 10.1371/journal.pone.0028610
Wang, S., Quan, L., Chavarro, J. E., Slopen, N., Kubzansky, L. D., Koenen, K. C., et al. (2022). Associations of depression, anxiety, worry, perceived stress, and loneliness prior to infection with risk of post-COVID-19 conditions. JAMA Psychiat. 79, 1081–1091. doi: 10.1001/jamapsychiatry.2022.2640
Wiernik, E., Nabi, H., Thomas, F., Pannier, B., Hanon, O., Simon, T., et al. (2016). Association between current perceived stress and incident diabetes is dependent on occupational status: evidence from the IPC cohort study. Diabetes Metabolism 42, 328–335. doi: 10.1016/j.diabet.2016.01.004
World Health Organization and International Diabetes Federation. (2006). Definition and diagnosis of diabetes mellitus and intermediate hyperglycaemia: report of a WHO/IDF consultation. World Health Organization. Available at: https://apps.who.int/iris/handle/10665/43588.
Keywords: perceived stress, Sri Lanka, validation, psychometric, Sinhala, Type 2 Diabetes Mellitus
Citation: Mendis BILM, Palihaderu PADS, Karunanayake P, Satharasinghe DA, Premarathne JMKJK, Dias WKRR, Rajapakse IH, Hapugalle AS, Karunaratne WRSA, Binendra AGYN, Kumara KBPP, Prabhashwara GSD, Senarath U, Yeap SK, Ho WY and Dissanayake AS (2023) Validity and reliability of the Sinhalese version of the perceived stress scale questionnaire among Sri Lankans. Front. Psychol. 14:1152002. doi: 10.3389/fpsyg.2023.1152002
Edited by:
Muhammad Shahid Iqbal, Prince Sattam bin Abdulaziz University, Saudi ArabiaReviewed by:
Muhammad Zahid Iqbal, AIMST University, MalaysiaCopyright © 2023 Mendis, Palihaderu, Karunanayake, Satharasinghe, Premarathne, Dias, Rajapakse, Hapugalle, Karunaratne, Binendra, Kumara, Prabhashwara, Senarath, Yeap, Ho and Dissanayake. This is an open-access article distributed under the terms of the Creative Commons Attribution License (CC BY). The use, distribution or reproduction in other forums is permitted, provided the original author(s) and the copyright owner(s) are credited and that the original publication in this journal is cited, in accordance with accepted academic practice. No use, distribution or reproduction is permitted which does not comply with these terms.
*Correspondence: Arosha Sampath Dissanayake, YXJvc2hhQG1lZC5ydWguYWMubGs=
Disclaimer: All claims expressed in this article are solely those of the authors and do not necessarily represent those of their affiliated organizations, or those of the publisher, the editors and the reviewers. Any product that may be evaluated in this article or claim that may be made by its manufacturer is not guaranteed or endorsed by the publisher.
Research integrity at Frontiers
Learn more about the work of our research integrity team to safeguard the quality of each article we publish.