 Björn Boman
- Department of Education, Stockholm University, Stockholm, Sweden
Introduction: Earlier research has suggested that that the international large-scale assessment, PISA (Programme for International Student Assessment), may be looked upon as a form of school test that is mostly explained by participating students’ socioeconomic status, non-cognitive factors, and various school factors, whereas another strand of research focuses on the similarities between PISA and cognitive ability assessments such as IQ tests. The latter position does also highlight the strong relationships between PISA scores and IQ test scores, typically aggregated to the country level. The current article adds to this scholarly debate by examining the latest PISA survey from 2018.
Methods: Correlation, regression, moderator, and mediation analyses were run for aggregated country-level data (N = 77) from PISA 2018.
Results: The results indicate that PISA scores indeed are strongly associated with both cognitive ability test scores and socioeconomic status indicators such as average annual national income.
Discussion: A more nuanced position suggests that PISA should be labelled a test that measures cognitive school skills rather than a proxy of national IQ, as the link between country-level abilities and school age abilities is neither causal, nor theoretically and empirically palpable, yet partly robust.
Introduction
A long-lasting debate within educational research concerns which factors are the strongest predictors of educational achievement [e.g., grades, test scores, and international large-scale assessments (ILSAs)]. Recent research (Guez et al., 2018; Vazsonyi et al., 2022; Boman, 2022c) suggests that cognitive ability is more important than conscientiousness or self-control, followed by socioeconomic status (SES). Others have stressed the near-equal magnitude of cognitive ability and conscientiousness for school achievement (Poropat, 2009; O’Conell and Marks, 2022). Yet others have focused more on interrelated non-cognitive abilities such as conscientiousness, grit (passion and perseverance), growth mindset (the belief that intelligence is malleable), and self-efficacy (individual’s belief in their own capacities; e.g., Duckworth et al., 2007; Cheung, 2017; Thorsen et al., 2021; Affuso et al., 2022), or the relations between non-cognitive abilities and cognitive abilities with regard to IQ tests and scholastic achievement tests (Borghans et al., 2008, 2016). This has led some researchers (e.g., O’Conell and Marks, 2022) to suggest a different theoretical framework that emphasizes the genetic transmission of cognitive abilities from parents to children rather than family SES such as economic and cultural resources exerting a strong direct influence on academic achievement, a view that is common with regard to the Program for International Student Assessment (PISA). Thus, it seems that the Organization for Economic Cooperation and Development (OECD) exaggerates the SES effects within and between classrooms, schools, and countries, and it is likely that cognitive ability and conscientiousness are more important factors (Deary et al., 2007; O’Conell and Marks, 2022; Boman, 2022a). However, there is a dearth of studies that have focused on the mediating or moderating effects of cognitive ability on PISA performance relative to SES and cognitive ability. Moreover, several studies only included a limited number of samples from earlier PISA waves when participants were fewer. The current study analyzed these relationships at the cross-national level. Specifically, 77 PISA participants from the PISA 2018 wave were analyzed with respect to the relations between PISA scores across mathematics, reading, and science and cognitive ability and SES. The following research questions were addressed:
1. Does SES mediate or moderate the relationships between cognitive ability and PISA achievement?
2. Does cognitive ability mediate the relationships between aggregated SES and PISA achievement?
Theoretical background
PISA as an international large-scale assessment for 15-year-old
Program for International Student Assessment, which was first administered in 2000, is a triennial, on average 2-h long, low-stake standardized assessment designated to test students within countries, as well as to make international comparisons between school systems (i.e., groups of students) and examine changes within education systems. Individuals complete test questions in three domains: reading, math, and science. In each cycle, one of these three subjects is the main subject, which is given somewhat greater analytical attention compared to the others. In addition, later PISA studies (2012 onward) have included problem solving and financial literacy add-ons for some countries. In PISA 2018, global competence was a novel domain. The test questions cover a rather broad spectrum of domain-specific cognitive skills (e.g., related to mathematics) and several levels of difficulty (i.e., the questions are situated at various levels of difficulty). The PISA surveys are conducted on two-stage stratified samples of students enrolled in lower secondary or, to a lesser extent, upper secondary schools. The included students are aged between 15 years and 3 months and 16 years and 2 months. The two-stage sampling strategy implies that schools are sampled first, and then students are sampled within schools (OECD, 2019a,b,c).
Furthermore, the aim of the PISA test is to pinpoint a broad coverage at the group level of the distribution of ability in different subject domains. Student responses to individual test items are used to impute the likelihood that such a student, and similar students, will able to solve items at the same, higher, or lower level of difficulty and with similar content. Plausible values make it possible to account for the probabilistic constitution of assessments of various levels of “unobservable” latent student abilities based on the observed response patterns (OECD, 2009, 2019c). The plausible values, as well as the different sub-tests (e.g., mathematics and reading) within PISA, are highly correlated (e.g., Saalik et al., 2015; Boman, 2022a). PISA scales are divided, in each domain assessed, into six or more proficiency levels. Each proficiency level is characterized in relation to the knowledge and skills that students demonstrate in the test.
In PISA 2018, 79 countries or urban regions, consisting of approximately 612, 000 students, participated. The OECD average scores are typically set at 500 with 100 as a standard deviation (e.g., Jerrim et al., 2018), but in PISA 2018, the average for all three tests was 488.5 (OECD, 2019b). As mentioned earlier, the PISA sample sizes do typically consist of approximately 5,000 individuals but countries such as Australia (14,273), B-J-S-Z (12,058), Brazil (10,691), the United Kingdom (13,808), and United Arab Emirates (19,277) had considerably larger sizes. Iceland had only 3,294 and Macao 3,775 students, which reflects their small populations (OECD, 2019c, pp. 362–363). In this survey, Japan, South Korea, and Estonia had the highest results among the OECD countries (OECD, 2019a).
Cognitive ability, SES, and PISA
According to Gottfredson (1997), cognitive ability constitutes a general ability rather than narrow academic skills that includes problem solving and appropriate application of knowledge. Cognitive ability is typically measured by brief or extensive IQ tests. In comparison, PISA measures a set of cognitive skills in three domains, mathematics, reading, and science, and their relations to real life situations and contexts in the 21st century (OECD, 2019a). Even though the PISA tests are not particularly related to curricular knowledge, they are still more narrow and school-oriented than cognitive ability tests (Rindermann and Baumeister, 2015; OECD, 2019a).
As Avvisati (2020) and Lee and Borgonovi (2022) have emphasized, socioeconomic status is a multifaceted concept that rests on several, sometimes theoretically contradictory, assumptions. Some notions of SES focus more on the possession of cultural artifacts among middle-and upper-class families. These in turn, are expected to lead to social reproduction, as intellectually oriented culture, which is shown by students in school contexts, is awarded by teachers in terms of higher school results (e.g., Bourdieu and Passeron, 1977; Bourdieu, 1984). Later studies (e.g., refer to Milne and Aurini, 2015, for an overview) have focused more on the interplay between high-SES students and the abilities that the students obtain in schools. Moreover, a similar strand of research has focused on the characteristics of the family as regards cognitive skills and parental education (e.g., Willms, 2002; Myrberg and Rosén, 2009).
Other perspectives accentuate the cognitive growth of students when involved, often more highly educated parents read to their children and/or spend more resources on their children compared to families with lower SES (Turkheimer et al., 2003; Engelhardt et al., 2018; Falk et al., 2021). High-income families may send their children to better schools and spend resources on out-of-school learning such as private tutoring. Even though the SES effects on academic achievement differ between countries and cultures, it is a generic pattern that higher SES is associated with higher academic achievement, whether directly or indirectly (e.g., Sirin, 2005; Bray, 2006; Sackett et al., 2009; Kim and Lee, 2010; Kim, 2019; Lee and Borgonovi, 2022).
Marks and O’Connell (2021) underline the potential confounding effect of the SES–academic achievement theory. Specifically, when controlling for parents’ and children’s cognitive abilities, as well as prior achievement, much of the SES effect becomes negligible. However, as the authors underline, the cognitive ability cannot completely explain SES, and nor can SES explain the entirety of cognitive ability. Hence, these two constructs may be estimated separately but should be included in the same multivariate models (e.g., Boman, 2022c).
International large-scale assessments (ILSAs) have been studied since the 1960s (Boman, 2022b). Many researchers have assumed that these measure a latent ability among students (e.g., Hanushek, 1979) but tests such as PISA have not been labeled with a single term. The concept of “literacy” is used regarding the assessment and interpretation of students’ performance in the three domains. “Literacy” specifically denotes “students’ capacity to apply knowledge and skills in key subjects, and to analyze, reason and communicate effectively as they identify, interpret and solve problems in a variety of situations” (OECD, 2017a, p. 13). The PISA achievement term used by the OECD is literacy (Rindermann and Baumeister, 2015) whereas, for example, Hanushek and Woessman (2008) used the term cognitive skills, and Lynn and Mikk (2007), Lynn and Vanhanen (2012), and Lynn and Becker (2019) defined the sum of achievement as national IQs (NIQs). The strong correlations between cognitive ability tests (e.g., IQ tests) and ILSAs indicate that these tests, to different extents, measure the same general cognitive abilities such as verbal and mathematical reasoning (Rindermann, 2007, 2018; Rindermann and Ceci, 2009; Rindermann and Baumeister, 2015). Rindermann and Baumeister (2015) stress that PISA tests in all domains require good reading skills. Later research such as Flores-Mendoza et al. (2021) and Pokropek et al. (2022) confirmed the strong relationships between PISA and general cognitive ability. Hence, when aiming to understand what drives PISA scores, it is pertinent to examine cognitive abilities aggregated to the country level (Boman, 2022a).
What remains unclear, however, is how these relationships should be interpreted in a meaningful way. For example, it is not only the case that cognitive abilities are affected by national development (Hunt and Wittman, 2008) but that PISA scores specifically are more influenced by reading abilities than many IQ tests (Rindermann and Baumeister, 2015). Moreover, at the school level, there are effects at play that seem to transcend individual level differences (e.g., Liu et al., 2022). Hence, it is perhaps more appropriate to label these cognitive skills as cognitive school skills rather than national IQ tests. This means that international cognitive tests, such as PISA are situated in a school context among school students within a particular age range, whereas IQ tests, such as Wechsler Adult Intelligence Scale (WAIS) and Wechsler Intelligence Scale for Children (WISC) are distributed across different age groups among children (6–15-year-old) and adults (16–65-year-old; c.f., OECD, 2009; Weiss et al., 2010; Kaufman et al., 2016). The PISA age is greatly affected by school knowledge (Rindermann, 2018) and contextual school factors (Yang Hansen et al., 2022). Therefore, it is different from IQ tests (especially among adults) that cover individual abilities which are greatly influenced by genetics (Engelhardt et al., 2018). Thus, PISA is conceptually an international cognitive skills test but not an international IQ test.
The rather strong cross-sectional relation between SES and PISA scores, however, inflated by the cross-sectional study design and omitted variable bias (e.g., Marks and O’Connell, 2021; Boman, 2022a), requires a researcher to include SES as an important predictor at the country level. Because SES is a crucial variable at the individual level, it is likely that it also has an effect at the country level with regard to PISA scores (Burhan et al., 2017; Flores-Mendoza et al., 2021). This relationship may be captured by logged national average income or a proxy, such as GDP per capita.
As slightly touched upon above, some researchers propose that high cognitive abilities among populations lead to high GDP per capita (at the national level) or average salaries (at the individual level; e.g., Lynn and Mikk, 2007), whereas others suggest that high abilities reflect a high degree of development at the country level, as indicated by GDP per capita (e.g., Hunt and Wittman, 2008; Wicherts et al., 2010; Burhan et al., 2017; Komatsu and Rappleye, 2017, 2019; Rindermann, 2018; Daniele, 2021).
While both theoretical assumptions might be true, to some extent, it might be suggested that cognitive abilities constitute a predominant comparative advantage (Boman, 2020), as they reflect an underlying construct that is more similar to school achievement, PISA in particular (Marks and O’Connell, 2021). This implies that there is likely a stronger relationship between PISA scores and cognitive ability scores than between PISA scores and average income. Hence, by examining cognitive ability levels among countries, it is possible to discern a strong link to the scores in international scholastic assessments. The same goes for SES but this relationship seems to be somewhat weaker (e.g., Rindermann, 2018; Flores-Mendoza et al., 2021).
Similar to how cognitive ability may decrease (i.e., negative selection for high-SES children) and increase simultaneously (i.e., the Flynn effect, the trend of increasing IQ test scores, refer to, e.g., Flynn, 2012), it is possible that cognitive development and economic development are interrelated patterns (Levin, 2009; Boman, 2021a,b). More specifically, countries require some degree of average general cognitive ability to develop. However, economic development, in the next step, improves the lives of families, schools, and the country in its entirety, which then improves, to some extent, the cognitive abilities and school achievement (Rindermann, 2018; Komatsu and Rappleye, 2019). Based on earlier research and theory, the following hypotheses are suggested:
H1: It is assumed that the correlations between NIQ and PISA scores will be large, that is, above r = 0.70, and medium to high for average income and PISA, above r = 0.40 (Dancey and Reidy, 2007).
H2: Furthermore, it is likely that cognitive ability partially mediates or moderates the relationship between SES and PISA scores (Marks & O'Connell, 2021).
H3: Because of the comparatively smaller correlation between SES and cognitive ability (Marks & O'Connell, 2021; Boman, 2022c), it is hypothesized that SES does not mediate the relationship between cognitive ability and PISA scores.
Methods
Data, variables, and procedures
Data for 77 of 79 PISA participants in the 2018 survey were retrieved from OECD (2019a). A few countries did not have complete data on all sub-tests and were, therefore, excluded. This was considered quite unproblematic from a statistical viewpoint, and no missing data imputations were conducted regarding the analyses.
An aggregated sum score across mathematics, reading, and science, at the country level, was created. This is appropriate as this provides a more comprehensive score of the country’s overall PISA performance (Rindermann, 2018). The independent variable average income for 2018 was log-transformed and such data were retrieved from World Bank (2022). However, for Beijing, Jiangsu, Shanghai, and Zhejiang in China and Moscow in Russia, city level data were retrieved from Statista (2022). That is because major urban regions in China (e.g., Boman, 2022b) and Russia (e.g., Griogoriev et al., 2016) have higher test scores than rural regions and smaller cities, and it is, therefore, inappropriate to use country level data in those two contexts.
Data on students’ cognitive abilities, aggregated to the country level [i.e., national (IQ NIQ)], were retrieved from Lynn and Becker (2019). This self-published book consists of a collection of mostly peer-reviewed cognitive ability scores that cover a substantial share of the world’s countries. Lynn and Becker (2019) used very specific procedures to calculate their national IQ scores, including all available IQ samples and corrections for sample size and the Flynn effect (i.e., the tendency that test scores have risen throughout the 20th century). This resulted in scores that were typically lower than the raw scores from earlier cognitive ability studies because they had to remove IQ points due to sample size and sampling year. One may notice that with older standardizations, countries such as Romania (Iliescu et al., 2016) and South Korea (Kwak, 2003) have higher scores than which is the case in Lynn and Becker (2019). Hence, the scores should be looked upon as contextualized and “corrected” scores rather than raw scores.
However, the “SAT weightings” that were included in the composed IQ values in Lynn and Becker (2019) were, in the current study, removed to avoid a confounding effect, meaning that older scores from, for example, PISA and TIMSS correlate with recent PISA scores. Here, the focus was on the strict NIQ–PISA relationships. Whenever a few jurisdictions had no cognitive ability data (N = 4, Kosovo, Macau, Moldova, North Macedonia), the author estimated the scores by averaging the scores from two neighboring countries (Lynn and Vanhanen, 2012). Data for PISA scores, average income (USD), and NIQ scores are shown in Table 1.
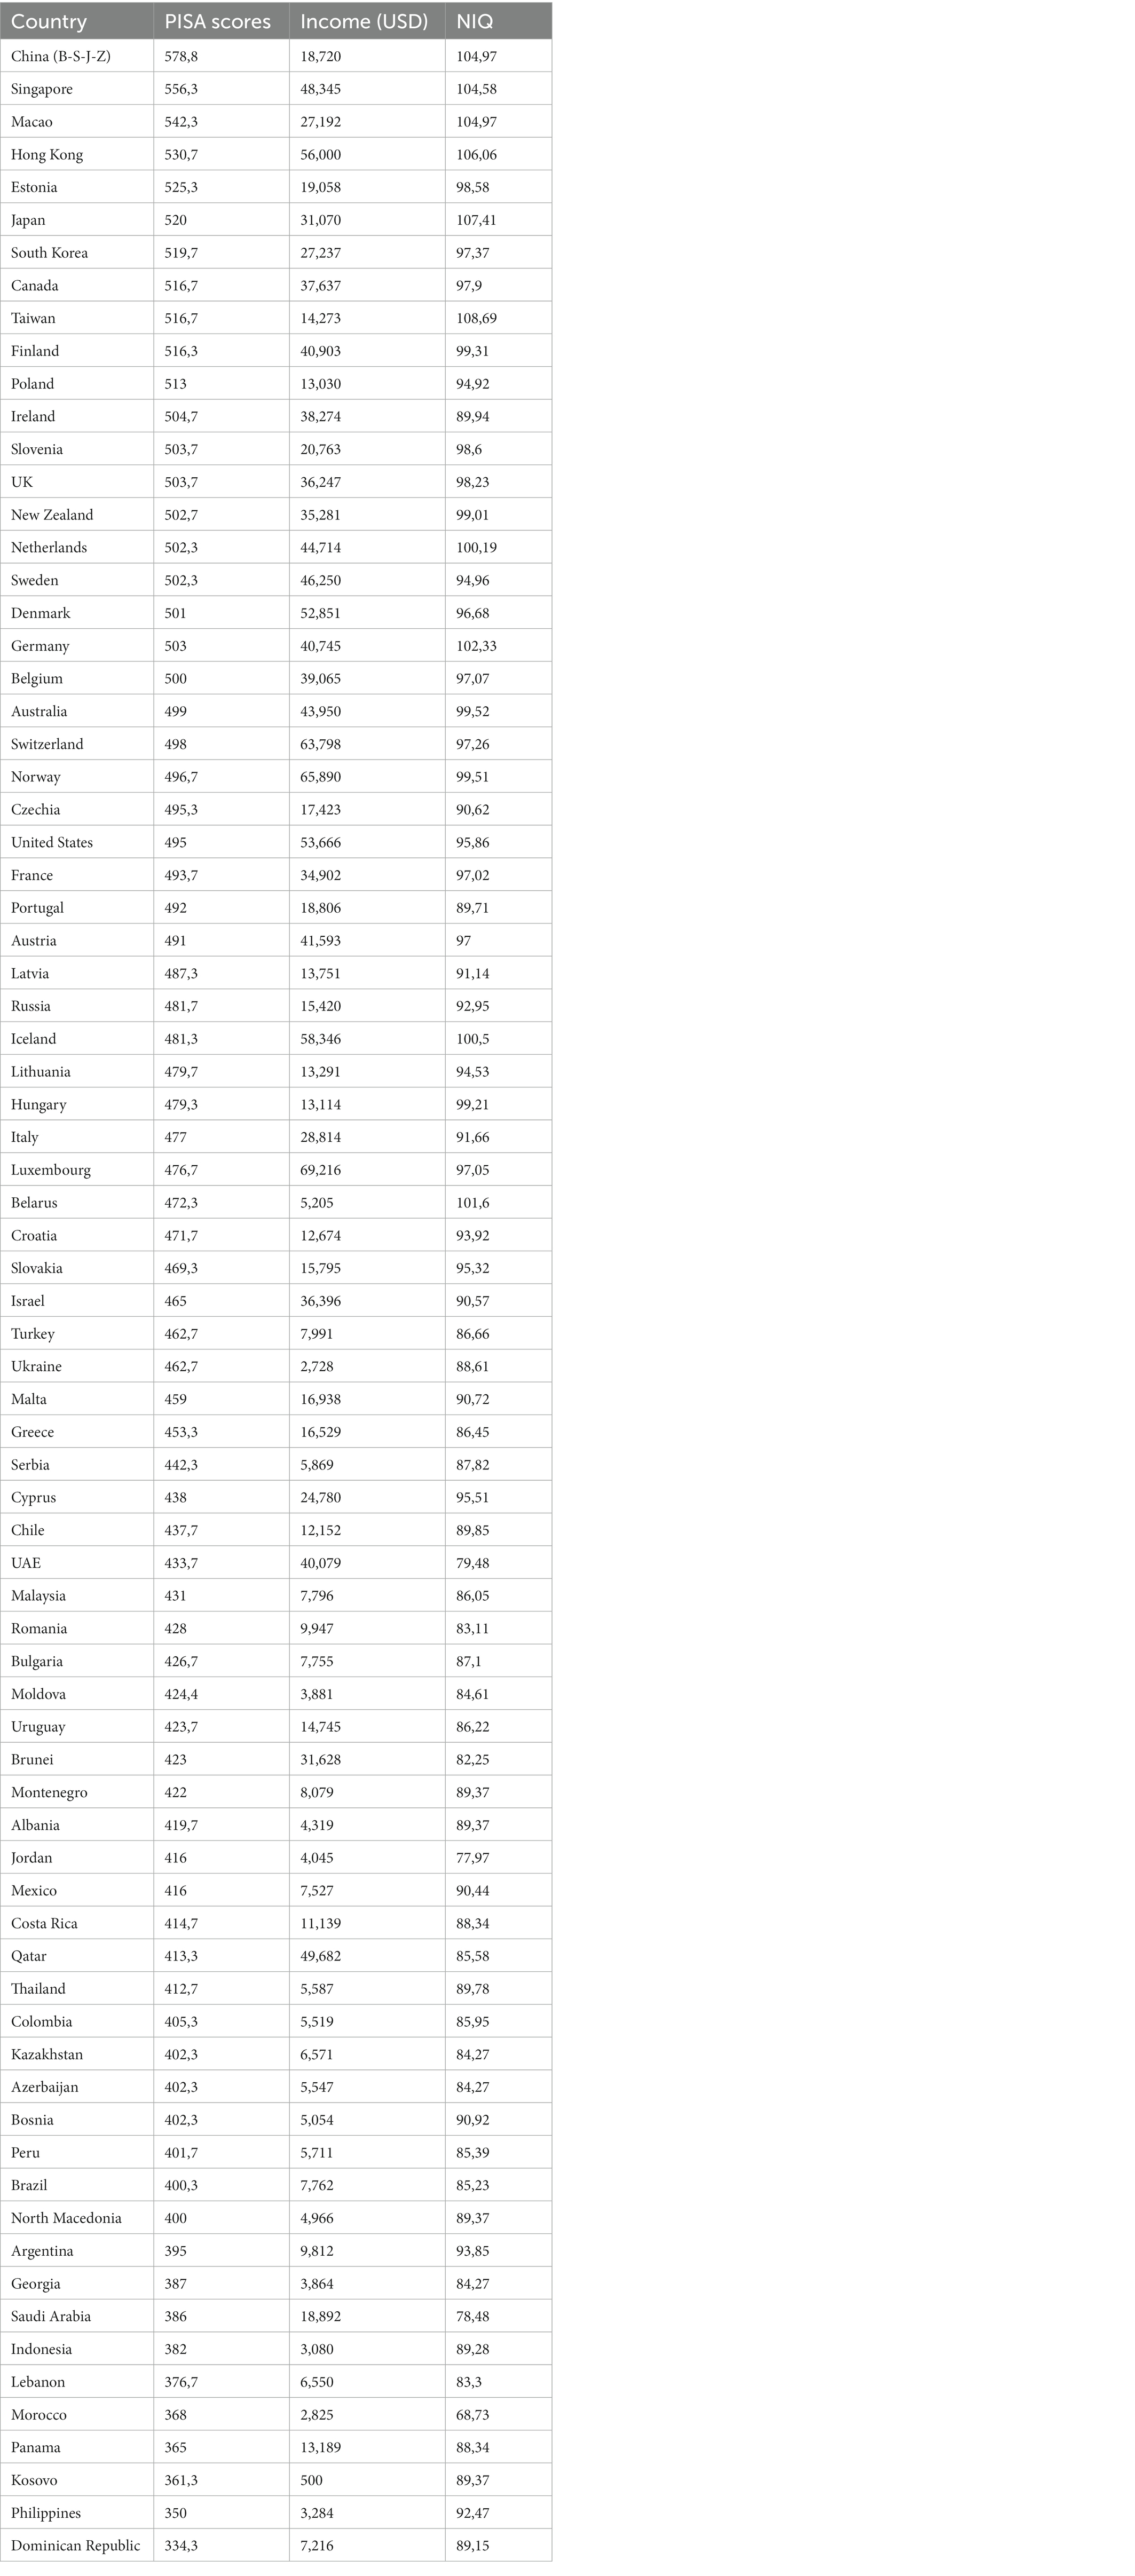
Table 1. Descriptive statistics PISA 2018.
The author decided not to include more covariates in the main analyses, as many factors at the national level are highly intercorrelated, such as GDP per capita, teacher salaries, and democracy index, or simply are not good predictors of school achievement such as PISA scores at the country level (Boman, 2022a). Moreover, many aggregated school level variables are missing outside the OECD (OECD, 2021). Hence, it would be inappropriate to include data for only approximately 31 out of 77 countries and jurisdictions.
Analytical strategy
The first step was to examine the bivariate relationships between the three variables, followed by an ordinary least squares (OLS) regression analysis. Observing bivariate correlations is an appropriate first step prior to conducting regression analysis (Field, 2018). Pearson’s correlation of r = 70 is the threshold for a high correlation within the psychology field, according to Dancey and Reidy (2007).
At a later step, moderation and mediation analyses were conducted using SPSS 26 for the moderator analysis and the SPSS extension PROCESS (Hayes, 2020) for the mediation analysis and an additional moderator analysis. Specifically, a moderation model, which included a cognitive ability*SES variable, was included. Due to potential problems with multicollinearity, the two variables of the interaction term were mean-centered and aggregated (Field, 2018). The step is required to answer both the research questions as these are concerned with the moderation and mediation between cognitive ability, SES, and PISA scores.
According to Zhao et al. (2010), the basic assumption with regard to mediation models is that the direct effects from the x variable (i.e., the independent variable) must be statistically significant and that is also the case with the mediator (m). Then the direct and indirect effects of the predictors estimate the model fit (Cheung, 2009; Zhao et al., 2010).
Due to the fact that this is a limited sample at the country level, no additional significance tests were run (e.g., Wasserstein et al., 2019). However, due to the potential magnitude of the effect sizes (e.g., the standardized beta coefficients), it was expected that both SES and cognitive ability would be statistically significant at the 5% level in the regression models (Cohen, 1988; Field, 2018; Komatsu and Rappleye, 2019). The author used p = 0.05 as the significance level threshold (e.g., Cohen, 1988; Field, 2018).
In addition, a robustness model was conducted. Specifically, an additional control variable, democracy index scores (The Economist Intelligence Unit, 2018), was added to the regression analysis.
Results
The bivariate correlations (refer to Supplementary information) resulted in large correlations, r = 0.766 (value of p < 0.001) for NIQ and PISA and r = 0.699 (value of p < 0.001) for average national income and PISA. In statistical terms, that means that approximately 59% of the PISA scores can be explained by the average aggregated national IQ scores and that approximately 49% of PISA may be explained by average national income. On the other hand, these are merely preliminary results.
However, the regression analysis (refer to Table 2) showed a more realistic R2 value, with a model that explained approximately 70% of the variance. The standardized beta coefficient of cognitive ability (β = 0.548) was, as expected, larger than the beta coefficient for income (β = 0.401).
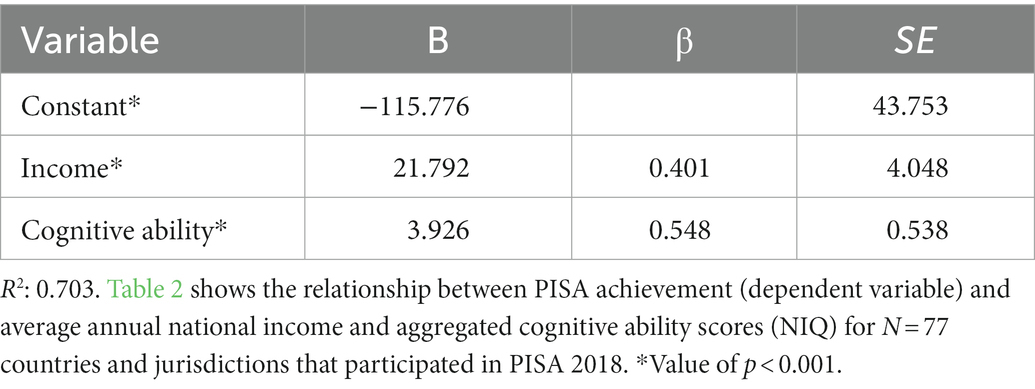
Table 2. Results of a regression analysis.
The moderator analysis which was conducted in SPSS shows that the interaction term was not statistically significant. The moderator analysis in PROCESS, with 5,000 bootstrapped cases, confirms these results (refer to Supplementary information).
The mediation analysis (refer to Table 3) indicates that neither SES nor cognitive ability mediates the PISA results, even though the total direct effects were significant. In conjunction with the results from the moderator analyses, the findings indicate that PISA scores are influenced by the linear effects of both the cognitive ability level and economic development level of a given country. Because these two variables are moderately intercorrelated, r = 0.537, it is also likely that they influence each other. The magnitude of such interrelationships is not possible to assess here but has been discussed in much previous research. The relationships are most likely quite complex and bi-directional (e.g., Hunt and Wittman, 2008; Burhan et al., 2017; Lim et al., 2018; Rindermann, 2018; Komatsu and Rappleye, 2019; Daniele, 2021).
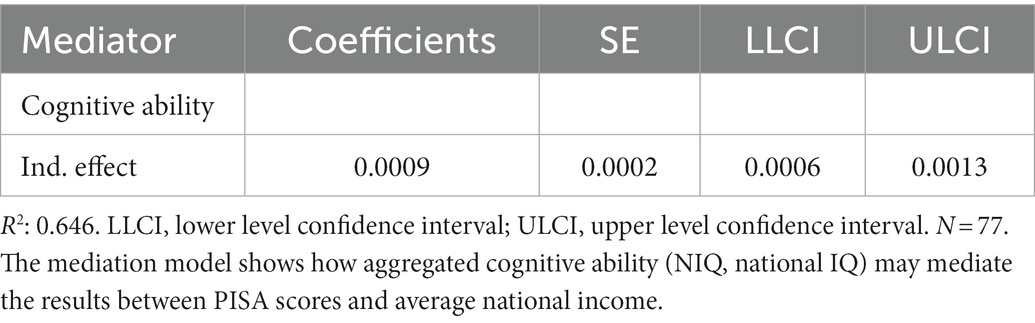
Table 3. Results of mediation analysis.
As a robustness check, democracy index data from the Economist Intelligence Unit’s annual report, specifically 2017 (The Economist Intelligence Unit, 2018), was included as a continuous predictor alongside national income and NIQ. Even though democracy is moderately correlated with PISA, NIQ, and income, this contextual factor at the cross-national level did not add to the model, nor did it affect the overall relationships (refer to Supplementary information). Hence, the results of the regression analyses seem robust.
Discussion
As the bivariate correlations, regression models, and earlier research show (e.g., Rindermann, 2007; Flores-Mendoza et al., 2021; Boman, 2022a), there are strong links between PISA and cognitive ability, and between PISA and SES, thus overall confirming the first hypothesis. Specifically, the SES–PISA relationships, in this case, are situated at the threshold for a strong rather than moderate effect size (r = 0.699, where 0.70 is the threshold for a high correlation, refer to Dancey and Reidy, 2007). However, these correlations may not be strong enough to equate cognitive ability, as in IQ, with PISA scores. Hence, PISA is not a national IQ test. Furthermore, due to age differences among country IQ samples summarized in Lynn and Becker (2019), it appears inappropriate to draw too far-reaching links between IQ test results and current PISA achievement. Hence, as said, one may prefer a different term, such as cognitive school skills. These cognitive school skills do likely reflect the overall ability level within a country, at least on average, but there are other relevant factors that influence PISA achievement, such as economic development, representativeness of the PISA samples (Boman, 2022b), and non-cognitive factors that are typically difficult to measure at the country level. Test motivation in low stakes tests may have some effect, but it is often negligible (e.g., Rindermann and Ceci, 2009; Balart et al., 2018). At the school level, there are also other factors at play such as instructional quality and its interaction with SES (e.g., Liu et al., 2022).
With regard to the other hypotheses, no moderating or mediating effects were found for cognitive ability’s potential influence on SES and vice versa in relation to PISA achievement. Hence, the second hypothesis was not confirmed by the analyses. The third hypothesis, which suggested that SES does not mediate the relationship between cognitive ability and PISA scores, is partly confirmed, but the correlation between SES and cognitive ability is moderate and thus larger compared to what much individual level data show (e.g., Marks and O’Connell, 2021; Boman, 2022c).
This study has several limitations. As mentioned earlier, due to the cross-sectional design, it is not possible to control for participating students’ previous academic achievement, effect sizes will be skewed upward, and causal relationships not possible to discern. Moreover, due to the aggregated data, it is not possible to make inferences at the individual or school level (Boman, 2022d). Some may still consider the Lynn and Becker (2019) data set to be unreliable and misguiding (Sear, 2022). The author has accounted for some of these problems and interpreted the correlations on the basis of the partial mismatch between age and sampling year. Regarding more complex validity and reliability issues such as measurement invariance among individual level country samples in either PISA assessments or cognitive ability tests (e.g., Wicherts and Dolan, 2010; Odell et al., 2021; Ding et al., 2022), one should be careful to naively accept the aggregation of IQ scores. However, PISA scores, on the other hand, are representative, and the descriptive statistics show that some countries consistently outperform others (e.g., OECD, 2019a). Thus, the PISA results confirm the IQ aggregates in that regard.
Furthermore, the data are limited to only a single wave of PISA scores, whereas other studies have included more waves (e.g., Rindermann and Ceci, 2009; Becker et al., 2022). The results cannot be generalized to all countries, and while improved in terms of participation, the PISA 2018 survey only covers approximately 40% of the world’s countries and jurisdictions. The fact that only average national income is used to indicate SES might also be problematic as parental education might be a more appropriate indicator in that respect (e.g., Sackett et al., 2009; Avvisati, 2020; Marks and O’Connell, 2021). Also, migration background and taking the test in another language than one’s mother tongue matter (Meunier, 2011). However, the average income is crucial as a country level indicator simply because it captures both overall SES and overall economic development.
Future research may include more waves of PISA and perhaps consist of school level covariates in multi-level model analyses, which are often used for secondary analysis of PISA (e.g., Huang et al., 2019). It might also be important to include TIMSS (Trends in Mathematics and Science Study), which is more related to curricular features in each participating country (Rindermann and Baumeister, 2015), in order to distinguish if these country-level patterns are confounded by overall national levels of ability and economic development. With regard to future PISA tests, it would be very useful if the participants, or at least fractions of the participants in all or most countries, conduct brief cognitive ability tests (i.e., IQ tests). Only then could the relative impact of IQ be comprehensively compared to SES and non-cognitive effects as regards both individual level and country level differences (Boman, 2022a). Furthermore, if the OECD manages to include data from all PISA participants, more country level covariates may be included.
Data availability statement
The original contributions presented in the study are included in the article/Supplementary material, further inquiries can be directed to the corresponding author.
Author contributions
The author confirms being the sole contributor of this work and has approved it for publication.
Conflict of interest
The author declares that the research was conducted in the absence of any commercial or financial relationships that could be construed as a potential conflict of interest.
Publisher’s note
All claims expressed in this article are solely those of the authors and do not necessarily represent those of their affiliated organizations, or those of the publisher, the editors and the reviewers. Any product that may be evaluated in this article, or claim that may be made by its manufacturer, is not guaranteed or endorsed by the publisher.
Supplementary material
The Supplementary material for this article can be found online at: https://www.frontiersin.org/articles/10.3389/fpsyg.2023.1045568/full#supplementary-material
References
Affuso, G., Zannone, A., Esposito, C., Pannone, M., Concetta, M.De, Angelis, G., et al. (2022). The effects of teacher support, parental monitoring, motivation and self-efficacy on academic performance over time. Eur. J. Psychol. Educ.
Avvisati, F. (2020). The measure of socio-economic status in PISA: a review and some suggested improvements. Large Scale Assess. Educ. 8. doi: 10.1186/s40536-020-00086-x
Balart, P., Oosterveen, M., and Webbink, D. (2018). Test scores, cognitive skills and economic development. Econ. Educ. Rev. 63, 134–153. doi: 10.1016/j.econedurev.2017.12.004
Becker, D., Coyle, T. R., Minnigh, T. L., and Rindermann, H. (2022). International differences in in math and science tilts: the stability, geography, and predictive power of tilt for economic criteria. Intelligence 92:101646. doi: 10.1016/j.intell.2022.101646
Boman, B. (2020). What makes Estonia and Singapore so good? Glob. Soc. Educ. 18, 181–193. doi: 10.1080/14767724.2019.1701420
Boman, B. (2021a). Regional differences in educational achievement among Swedish grade 9 students. Scand. J. Educ. Res. 66, 610–625.
Boman, B. (2021b). Parallelization: the fourth leg of cultural globalization theory. Integr. Psychol. Behav. Sci. 55, 354–370. doi: 10.1007/s12124-021-09600-4
Boman, B. (2022a). PISA achievement in Sweden from the perspective of both individual data and aggregated cross-country data. Front. Educ. 6:753347. doi: 10.3389/feduc.2021.753347
Boman, B. (2022b). Educational achievement among east Asian schoolchildren: a thematic review of the literature. Int. J. Educ. Res. Open 3:100168. doi: 10.1016/j.ijedro.2022.100168
Boman, B. (2022c). The influence of SES, cognitive abilities, and non-cognitive abilities on grades: longitudinal evidence from two Swedish cohorts. (2022). Eur. J. Psychol. Educ. doi: 10.1007/s10212-022-00626-9
Boman, B. (2022d). Regional differences in educational achievement: a replication study of municipality data. Front. Educ. 7:854342. doi: 10.3389/feduc.2022.854342
Borghans, L., Golsteyn, B., Heckman, J., and Humphries, J. (2016). What achievement tests measure. Proc. Natl. Acad. Sci. U. S. A. 51, 13355–13359. doi: 10.1073/pnas.1601135113
Borghans, L., Meijers, G. T., and Weel, B. (2008). The role of noncognitive skills in explaining cognitive test scores. Econ. Inq. 46, 2–12. doi: 10.1111/j.1465-7295.2007.00073.x
Bourdieu, P. (1984). Distinction: A Social Critique of the Judgment of Taste. Cambridge: Harvard University Press
Bourdieu, P., and Passeron, J-C. (1977). Reproduction in Education, Society and Culture. Beverly Hills: Sage
Bray, M. (2006). Private supplementary tutoring: comparative perspectives on patterns and implications. Compare 36, 515–530. doi: 10.1080/03057920601024974
Burhan, N. A. S., Yunus, M. M., Tovar, M. E. L., and Burhan, N. M. G. (2017). Why are cognitive abilities of children so different across countries? The link between major socioeconomic factors and PISA test scores. Personal. Individ. Differ. 105, 95–106. doi: 10.1016/j.paid.2016.09.043
Cheung, M. W. L. (2009). Comparison of methods for constructing confidence intervals of standardized indirect effects. Behav. Res. Methods 41, 425–438. doi: 10.3758/BRM.41.2.425
Cheung, K.-C. (2017). The effects of resilience in learning variables on mathematical literacy performance: a study of learning characteristics of the academic resilient and advantaged low achievers in Shanghai, Singapore, Hong Kong, Taiwan and Korea. Educ. Psychol. 37, 965–982. doi: 10.1080/01443410.2016.1194372
Dancey, C. P., and Reidy, J. (2007). Statistics Without Maths for Psychology. London: Pearson Education.
Daniele, V. (2021). Socioeconomic inequality and regional disparities in educational achievement: the role of relative poverty. Intelligence 84:101515. doi: 10.1016/j.intell.2020.101515
Deary, I., Strand, S., Smith, P., and Fernandes, C. (2007). Intelligence and educational achievement. Intelligence 35, 13–21. doi: 10.1016/j.intell.2006.02.001
Ding, Y. Y., Hansen, K., and Klapp, A. (2022). Testing measurement invariance of mathematics self-concept in PISA using MGCFA and the alignment method. Eur. J. Psychol. Educ. doi: 10.1007/s10212-022-00623-y
Duckworth, A. L., Peterson, C., Matthews, M. D., and Kelly, D. R. (2007). Grit: perseverance and passion for long-term goals. J. Pers. Soc. Psychol. 92, 1087–1101. doi: 10.1037/0022-3514.92.6.1087
Engelhardt, L., Church, J., Harden, P., and Tucker-Drob, E. (2018). Accounting for the shared environment in cognitive abilities and academic achievement with measured socioecological contexts. Dev. Sci. 22. doi: 10.1111/desc.12699
Falk, A., Kosse, F., Pinger, P., Schildberg-Hörisch, H., and Deckers, T. (2021). Socioeconomic status and Inequalites in Children’s IQ and economic preferences. J. Polit. Econ. 129, 2504–2545. doi: 10.1086/714992
Flores-Mendoza, C., Ardila, R., Gallegos, M., and Reategui-Colareta, N. (2021). General intelligence and socioeconomic status as strong predictors of student performance in Latin American schools: evidence from PISA items. Front. Educ. 6:632289. doi: 10.3389/feduc.2021.632289
Flynn, J. (2012). Are We Getting Smarter? Rising IQ in the Twenty-First Century. Cambridge: Cambridge University Press
Gottfredson, L. (1997). Why g matters: the complexity of everyday life. Intelligence 24, 79–132. doi: 10.1016/S0160-2896(97)90014-3
Griogoriev, A., Ushakov, D., Valueva, E., Zirenko, V., and Lynn, R. (2016). Differences in educational achievement, socioeconomic variables and geographical location across 79 provinces of the Russian Federation. Intelligence 58, 14–17. doi: 10.1016/j.intell.2016.05.008
Guez, A., Panaïotis, T., Peyere, H., and Ramus, F. (2018). Predictors of the IQ–achievement gap in France: Alongitudinal analysis. Intelligence 69, 104–116. doi: 10.1016/j.intell.2018.05.008
Hanushek, E. (1979). Conceptual and empirical issues in the estimation of educational production functions. J. Hum. Resour. 14, 351–388. doi: 10.2307/145575
Hanushek, E., and Woessman, L. (2008). The role of cognitive skills in economic development. J. Econ. Lit. 46, 607–668. doi: 10.1257/jel.46.3.607
Hayes, A. (2020). PROCESS version 3.5.3. Available at: www.afhayes.com
Huang, J., Tang, Y., He, W., and Li, Q. (2019). Singapore’s school excellence model and student learning: evidence from PISA 2012 and TALIS 2013. Asia Pac. J. Educ. 39, 96–112. doi: 10.1080/02188791.2019.1575185
Hunt, E., and Wittman, W. (2008). National intelligence and national prosperity. Intelligence 36, 1–9. doi: 10.1016/j.intell.2006.11.002
Iliescu, D., Ilie, A., Ispas, D., Bobrean, A., and Clinciu, A. L. (2016). Sex differences in intelligence: a multi-measure approach using nationally representative samples from Romania. Intelligence 58, 54–61. doi: 10.1016/j.intell.2016.06.007
Jerrim, J., Micklewright, J. H., Heine, J. H., Salzer, C., and McKeown, C. (2018). PISA 2015: how big is the ‘mode effect’ and what has been done about it? Oxf. Rev. Educ. 44, 476–493. doi: 10.1080/03054985.2018.1430025
Kaufman, A. S., Reiford, S. E., and Coalson, D. L. (2016). Intelligent Testing With the WISC-V. New Jersey: Wiley.
Kim, S. W. (2019). Is socioeconomic status less predictive of achievement in east Asian countries? A systematic and meta-analytic review. Int. J. Educ. Res. 97, 29–42. doi: 10.1016/j.ijer.2019.05.009
Kim, S., and Lee, J.-H. (2010). Private tutoring and demand for education in South Korea. Econ. Dev. Cult. Chang. 58, 259–296. doi: 10.1086/648186
Komatsu, H., and Rappleye, J. (2017). A new global policy founded on invalid statistics? Hanushek, Woessman, PISA, and economic growth. Comp. Educ. 53, 166–191. doi: 10.1080/03050068.2017.1300008
Komatsu, H., and Rappleye, J. (2019). Refuting the OECD-World Bank development narrative: ‘economic miracle’ primarily driven by educational quality and cognitive skills? Glob. Soc. Educ. 17, 166–191.
Kwak, K. (2003). South Korea, in Georgas (2003). in Culture and Children’s Intelligence. Cross-Cultural Analysis of the WISC-III. (eds.) J. Weiss, L. Vijervan de, and D.F. Saklofske (Amsterdam, Netherlands: Elsevier)
Lee, J., and Borgonovi, F. (2022). Relationships between family socioeconomic status and mathematics achievement in OECD and non-OECD countries. Comp. Educ. Rev. 66, 199–227. doi: 10.1086/718930
Levin, H. M. (2009). The economic payoff to investing in educational justice. Educ. Res. 38, 5–20. doi: 10.3102/0013189X08331192
Lim, S. S., Updike, R., Kaldjian, A., Barber, R. M., Cowling, K., York, H., et al. (2018). Measuring human capital: a systematic analysis of 195 countries and territories, 1990–2016. Lancet 392, 1217–1234. doi: 10.1016/S0140-6736(18)31941-X
Liu, X., Valcke, M. Yang, Hansen, K.De, and Neve, J. (2022). Does school level instructional quality matter for school mathematics performance? Comparing teacher data across seven countries. Sustainability 14, 227–240. doi: 10.3390/su14095267
Lynn, R., and Becker, D. (2019). The Intelligence of Nations. London, UK: Ulster Institute for Social Research
Lynn, R., and Mikk, J. (2007). National differences in intelligence and educational attainment. Intelligence 35, 115–121. doi: 10.1016/j.intell.2006.06.001
Lynn, R., and Vanhanen, T. (2012). Intelligence: A Unifying Construct for the Social Sciences. London, UK: Ulster Institute for Social Research
Marks, G. N., and O’Connell, M. (2021). Inadequacies in the SES–achievement model: evidence from PISA and other studies. Rev. Educ. 9. doi: 10.1002/rev3.3293
Meunier, M. (2011). Immigration and student achievement: evidence from Switzerland. Econ. Educ. Rev. 30, 16–38. doi: 10.1016/j.econedurev.2010.06.017
Milne, E., and Aurini, J. (2015). Schools, cultural mobility and social reproduction: the case of progressive discipline. Can. J. Sociol. 40, 51–74.
Myrberg, E., and Rosén, M. (2009). Direct and indirect effects of parents´ education on reading achievement among third graders in Sweden. Br. J. Educ. Psychol. 79, 695–711. doi: 10.1348/000709909X453031
O’Conell, M., and Marks, G. N. (2022). Cognitive ability and conscientiousness are more important than SES for edu-cational attainment: An analysis of the UK millennium cohort study. Personal. Individ. Differ. 188:111471. doi: 10.1016/j.paid.2021.111471
Odell, B., Gierl, M., and Cutumisu, M. (2021). Testing measurement invariance of PISA 2015 mathematics, science, and ICT scales using the alignment method. Stud. Educ. Eval. 68:100965. doi: 10.1016/j.stueduc.2020.100965
OECD (2009). PISA data analysis manual. Available at: https://www.oecd-ilibrary.org/docserver/9789264056275-en.pdf?expires=1640625956&id=id&accname=ocid195437a&checksum=F578CC594B2011913AFF4F0C3CF3EA97 (Accessed January 7, 2022).
OECD (2017a). PISA 2015 Assessment and Analytical Framework: Science, Reading, Mathematic, Financial Literacy and Collaborative Problem Solving (revised edition). PISA: OECD Publishing
OECD (2019a). PISA 2018 Results. Available at: https://www.oecd.org/pisa/Combined_Executive_Summaries_PISA_2018.pdf (Accessed January 7, 2022).
OECD. (2019b). PISA 2018. Technical report, chapter 4. Sample design. Available at: https://www.oecd.org/pisa/data/pisa2018technicalreport/PISA2018%20TecReport-Ch-04-SampleDesign.pdf (Accessed January 7, 2022).
OECD (2021). Education at a glance. Available at: https://www.oecd-ilibrary.org/docserver/b35a14e5-en.pdf?expires=1662395712&id=id&accname=ocid195437a&checksum=FC8F7FD7215FAC417A002CCA4138B910
Pokropek, A., Marks, G. N., and Borgonovi, F. (2022). How much do students’ scores in PISA reflect general intelligence and how much do they reflect specific abilities? J. Educ. Psychol. 114, 1121–1135. doi: 10.1037/edu0000687
Poropat, A. E. (2009). A meta-analysis of the five-factor model of personality and academic performance. Psychol. Bull. 135, 322–338. doi: 10.1037/a0014996
Rindermann, H. (2007). The g factor of international cognitive ability comparisons: the homogeneity of results in PISA, TIMSS, PIRLS, and IQ tests among nations. Eur. J. Personal. 21, 667–706. doi: 10.1002/per.634
Rindermann, H. (2018). Cognitive Capitalism. Human Capital and the Wellbeing of Nations. Cambridge: Cambridge University Press
Rindermann, H., and Baumeister, A. (2015). Validating the interpretations of PISA and TIMSS tasks: a rating study. Int. J. Test. 15, 1–22. doi: 10.1080/15305058.2014.966911
Rindermann, H., and Ceci, S. (2009). Educational policy and country outcomes in international competence studies. Perspect. Psychol. Sci. 4, 551–568. doi: 10.1111/j.1745-6924.2009.01165.x
Saalik, Ü., Nissinen, K., and Malin, A. (2015). Learning strategies explaining differences in reading proficiency. Findings of Nordic and Baltic countries in PISA 2015. Learn. Individ. Differ. 42, 36–43. doi: 10.1016/j.lindif.2015.08.025
Sackett, P. R., Kuncel, N. R., Arneson, J. J., Cooper, S. R., and Waters, S. D. (2009). Does socioeconomic status explain the relationship between admissions tests and post-secondary academic performance? Psychol. Bull. 135, 1–22. doi: 10.1037/a0013978
Sear, R. (2022). ‘National IQ’ datasets do not provide accurate, unbiased or comparable measures of cognitive ability worldwide. Available at: https://psyarxiv.com/26vfb/
Sirin, S. (2005). Socioeconomic status and academic achievement: a meta-review of research. Rev. Educ. Res. 75, 417–453. doi: 10.3102/00346543075003417
Statista (2022). Average monthly income per capita in Russia in 2018, by federal district. Available at: https://www.statista.com/
The Economist Intelligence Unit (2018). Democracy index 2017. Available at: https://spcommreports.ohchr.org/TMResultsBase/DownLoadFile?gId=34079
Thorsen, C. Y., Hansen, K., and Johansson, S. (2021). The mechanisms of interest and perseverance in predicting achievement among academically resilient and non-resilient students: evidence from Swedish longitudinal data. Br. J. Educ. Psychol. 91, 1481–1497. doi: 10.1111/bjep.12431
Turkheimer, E., Haley, A., Waldron, M., D’Onofrio, B., and Gottesman, I. (2003). Socioeconomic status modifies heritability of IQ in young children. Psychol. Sci. 14, 623–628. doi: 10.1046/j.0956-7976.2003.psci_1475.x
Vazsonyi, A. T., Javakhishvili, M., and Blatny, M. (2022). Does self-control outdo IQ in predicting academic performance?. Journal of Youth and Adolescence 51, 499–508.
Wasserstein, R. L., Schirm, A. L., and Lazar, N. A. (2019). Moving to a world beyond “p < 0.05”. Am. Stat. 73, 1–19. doi: 10.1080/00031305.2019.1583913
Weiss, L.G., Saklofske, D., Coalson, D.L., and Reiford, S.E. (2010). WAIS-IV Clinical Use and Interpretation. London: Associate Press
Wicherts, J., Borsboom, D., and Dolan, C. V. (2010). Why national IQs do not support evolutionary theories of intelligence. Personal. Individ. Differ. 48, 91–96. doi: 10.1016/j.paid.2009.05.028
Wicherts, J., and Dolan, C. V. (2010). Measurement invariance in confirmatory factor analysis: an illustration using IQ test performance of minorities. Educ. Meas. Issues Pract. 29, 39–47. doi: 10.1111/j.1745-3992.2010.00182.x
World Bank (2022). Adjusted net national income per capita in the world. Available at: https://data.worldbank.org/indicator/NY.ADJ.NNTY.PC.CDa
Yang Hansen, K., Radicid, J., Ding, Y., and Liu, X. (2022). Contextual effects on students’ achievement and academic self-concept in the Nordic and Chinese educational systems. Large Scale Assess. Educ. 10, 1–26. doi: 10.1186/s40536-022-00133-9
Keywords: PISA, SES, cognitive ability, IQ, cognitive school skills
Citation: Boman B (2023) Is the SES and academic achievement relationship mediated by cognitive ability? Evidence from PISA 2018 using data from 77 countries. Front. Psychol. 14:1045568. doi: 10.3389/fpsyg.2023.1045568
Edited by:
Cheng Yong Tan, The University of Hong Kong, Hong Kong SAR, ChinaCopyright © 2023 Boman. This is an open-access article distributed under the terms of the Creative Commons Attribution License (CC BY). The use, distribution or reproduction in other forums is permitted, provided the original author(s) and the copyright owner(s) are credited and that the original publication in this journal is cited, in accordance with accepted academic practice. No use, distribution or reproduction is permitted which does not comply with these terms.
*Correspondence: Björn Boman, ✉ Ympvcm4uYm9tYW5AZWR1LnN1LnNl