 Lingfeng Ruan
 Huanmin Ge1
 Yixiong Cui
94% of researchers rate our articles as excellent or good
Learn more about the work of our research integrity team to safeguard the quality of each article we publish.
Find out more
ORIGINAL RESEARCH article
Front. Psychol., 02 June 2022
Sec. Movement Science
Volume 13 - 2022 | https://doi.org/10.3389/fpsyg.2022.899199
This article is part of the Research TopicPerformance Optimization in Football: Advances in Theories and PracticesView all 11 articles
Establishing and illustrating a predictive and prescriptive model of playing styles that football teams adopt during matches is a key step toward describing and measuring the effectiveness of styles of play. The current study aimed to identify and measure the effectiveness of different defensive playing styles for professional football teams considering the opponent’s expected goal. Event data of all 1,120 matches played in the Chinese Football Super League (CSL) from the 2016 to 2020 seasons were collected, with fifteen defense-related performance variables being extracted. The PCA model (KMO = 0.76) output eight factors that represented 7 different styles of play (factor 6 and 8 represent one style of play) and explained 85.17% of the total variance. An expected goal (xG) model was built using data related to 27,852 shots. Finally, the xG of the opponent was calculated in the multivariate regression model, outputting five factors that (p < 0.05) explained 41.6% of the total variance in the xG of the opponent and receiving a dangerous situation (factor 7) was the most apparent style (31.3%). Finally, the predicted model with defensive styles correlated with actual xG of the opponent at r = 0.62 using the 2020 season as testing data which showed that the predicted xG was correlated moderately with the actual. The result indicated that if the team strengthened the defense closed to the own goal, high intensity confrontation, and defense of goalkeeper, meanwhile making less errors and receiving less dangerous situations, the xG of the opponent would be greatly reduced.
Football match performance incorporates the interactive effects of technical, physical, and tactical activities among players (Moura et al., 2013). Such interaction is conditioned by the strategical plans and match dynamics (Grehaigne et al., 1997) and can be explained by measuring the offensive and defensive behavior of teams and opponents (Carling et al., 2005). Consequently, various types of match approaches were adopted to integrate these dynamical interactions adopted by teams under distinct competition scenario (Fernandez-Navarro et al., 2016; Hewitt et al., 2016; Lago-Peñas et al., 2018). Hence, the tactical approach of a team in a particular match can be defined and depict how the football match unfolds (Lago-Peñas et al., 2018). Specifically, the term “style of play” refers to the dominant and recurring pattern demonstrated by a team in a specific competitive situation where the measurement of some performance indicators may reflect the team’s playing styles (Fernandez-Navarro et al., 2016; Hewitt et al., 2016; Zhou et al., 2021). Compared with “model of game” defining a complete technical and tactical process for the game (Sánchez et al., 2021) and “game philosophy” including the culture and ethos of a team (Fernandez-Navarro et al., 2016), the term “style of play” refers more to the behavioral pattern demonstrated by a team in a specific competitive context. Determining and measuring playing styles in elite soccer have a direct application into practice and competition (Kubayi and Toriola, 2020), such as modeling performance improvement in team’s strategies, player’s evolution, and scouting (Zhou et al., 2021).
Currently, the available research focusing on playing style in football has evolved in its approach measuring those key playing patterns which defined the styles of play. Hewitt et al. (2016) pointed out that a playing style pattern was represented by a team at five moments in a match: set offense, transition from offense to defense, set defense, transition from defense to offense, and set pieces. Fernandez-Navarro et al. (2018) classified playing styles of English Premier League into eight factors based on traditional techniques and tactics: direct play, counterattack, maintenance, build up, sustained threat, fast tempo, crossing, and high pressure. Yi et al. (2019b) defined three types of playing styles to characterize the matches of 2018 FIFA World Cup by a machine learning algorithm: direct play, possession play, and mixed play. Moreover, in the most recent studies, the statistical model is factor analysis (PCA: Principal Component Analysis) focusing on the identification of football playing styles (Gómez et al., 2018; Lago-Peñas et al., 2018; Zhou et al., 2021). The first study defined eight plying styles via selecting over sixty match performance variables in Greek professional football which jointly influencing how teams alternated their styles (Gómez et al., 2018). Meanwhile, both the second study (Lago-Peñas et al., 2018) and the recent study (Zhou et al., 2021) encountered different playing styles from the consideration of enough match performance indicators in Chinese football league. However, compared to the wide range of studies focusing on the attacking styles, few attempts have been done for the defense. Fernandez-Navarro et al. (2019b) tried to classify the defensive styles of play according to the zones of the pitch where the ball was regained, but not conducting deep research on the defensive styles.
In light of such phenomenon, quantifying the effectiveness of more styles of play has also been analyzed to explain a broader concept of tactical behaviors, to which these tactical variables and performance indicators contribute. Recent studies proposed a theoretical framework for measuring styles of play (Fernandez-Navarro et al., 2018), quantify the use of attacking and defensive strategies in football matches (Villa and Lozano, 2019), and predict a pattern of tactical–strategic behaviors with major probabilities of success in transitions (Casal et al., 2016). Behavior indicators (Kempe et al., 2014), multivariate statistical methods (Moura et al., 2014), and spatio-temporal analysis (Memmert et al., 2016) have also been used for potential tactical evaluation. In addition, new effectiveness metrics that take into account multiple variables have been developed recently. Expected goals (xG) is a metric used to assess the chance of a shot resulting in a goal which is useful for coaches and practitioners (Rathke, 2017). Fernandez-Navarro et al. (2019a) used xG as a metric to evaluate the effectiveness of playing styles in different contextual variables. Nevertheless, the effectiveness of playing styles in football is still inconclusive due to previous studies which were concentrated on an isolated attacking performance dimension (Liu et al., 2019). What’s more, previous studies have acknowledged that the defensive styles of play and performance indicators related to defense in different studies were not clear or comprehensive which might produce partially biased outcomes (Vogelbein et al., 2014; Bradley et al., 2016; Souza et al., 2019).
The lack of relevant studies evaluating the effectiveness of defensive styles could be attributed to the fact that most of the defensive events are recorded along with ball-related offensive behaviors, so that the tactical intention and the off-ball performance behind certain defensive technical actions may not be fully represented to produce reliable outcomes. Additionally, definitions and measurement of football defensive playing styles were varied among different studies. More styles of play should be considered when evaluating the defensive effectiveness. Therefore, the aim of the current study was: (i) to describe defensive playing styles in professional football via considering more comprehensive set of defensive actions and spatial information of teams, and (ii) to rate the effectiveness of different styles, accounting for opponent’s scoring opportunities (xG). It has been hypothesized that teams could be classified and evaluated according to their playing styles and the xG of the opponent could evaluate the effectiveness of defensive styles adopted by coaches.
The sample was composed of teams that played all 1,120 matches in the CSL from the 2016 to 2020 seasons (There are 160 matches of CSL in the 2020 season due to prevention and control of COVID-19). The Chinese Super League (CSL) is the top-professional soccer league in China, which starts in March (spring) and ends in November (winter) every season. Sixteen teams (n = 240 matches per season) play each other in a balanced schedule (each team plays against different opponents (home and away) twice). Match statistics were retrieved from the website of “Whoscored”,1 whose data were provided by OPTA Sports. The data provider has been previously verified to have high intra-class correlation coefficients (ranged from 0.88 to 1.00), low standardized typical errors (varied from 0.00 to 0.37) a, and very good strength of Cohen’s Kappa (>0.9) for inter-operator reliability of data collection (Liu et al., 2017).
Based on the scientific literature that included defensive aspects in football match analysis (Yi et al., 2018, 2019a; Fernandez-Navarro et al., 2019b), a total of 15 defensive performance indicators related to technical and tactical performance were extracted from the raw data as dependent variables in the analysis due to their importance for measuring performance related to recovery the possession of the ball and match outcomes (Zhou et al., 2021). The description and definitions of defensive performance indicators are presented in Table 1. In addition, the pitch was divided into six spaces parallel to the goal lines for the extraction of the following performance indicators: pass in zone 3 and zone 4, and ball gain in the zone 1 (see Figure 1).
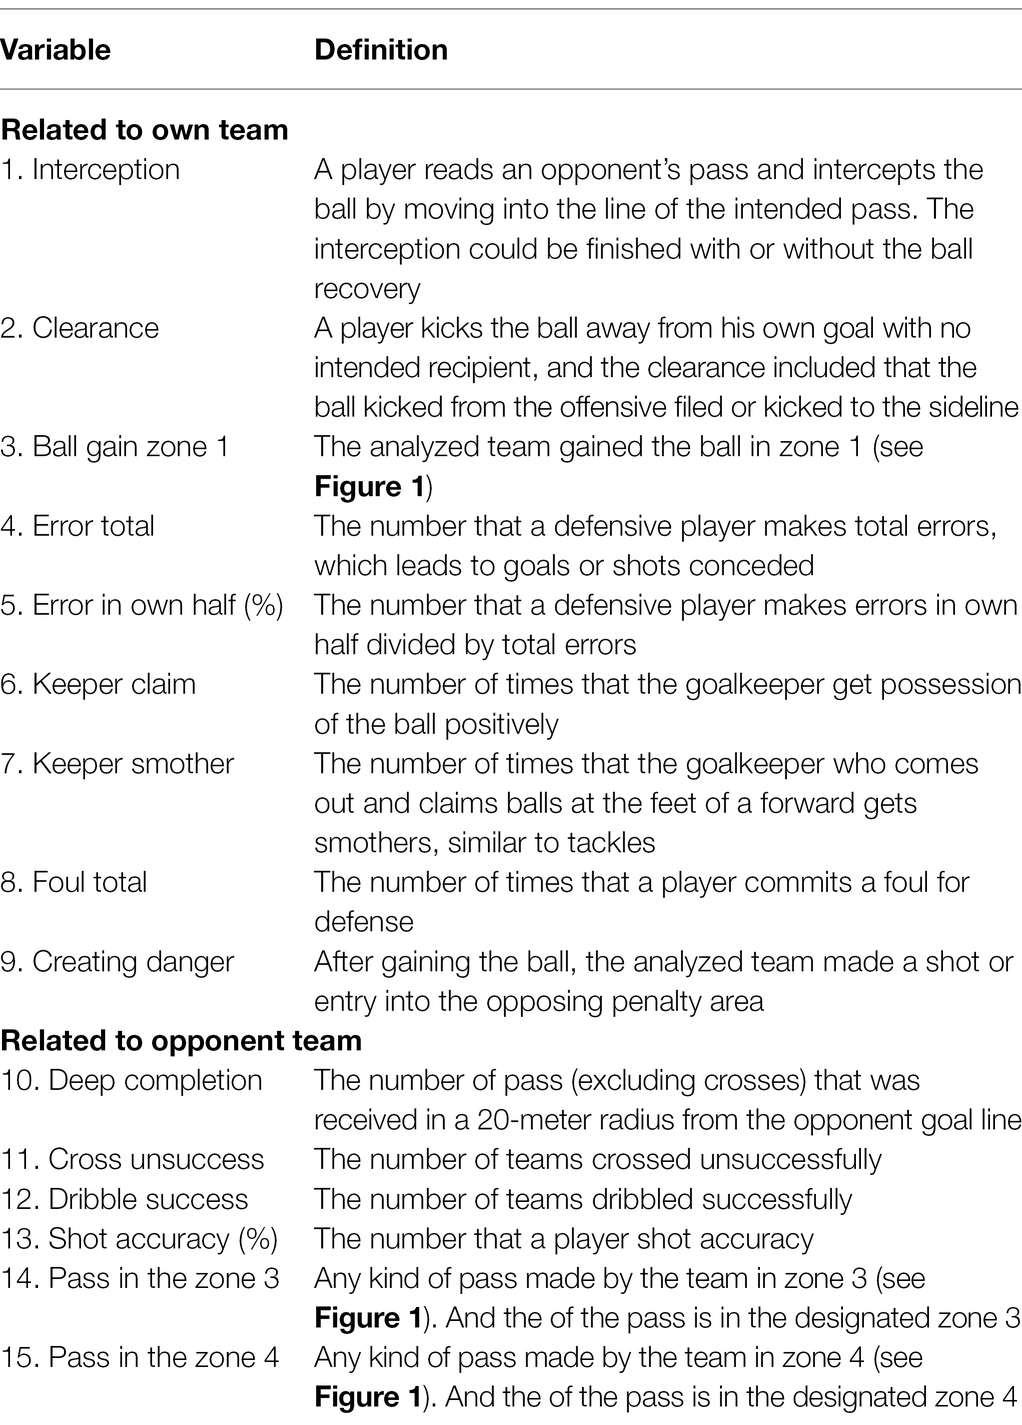
Table 1. Description and definition of the defensive performance indicators.
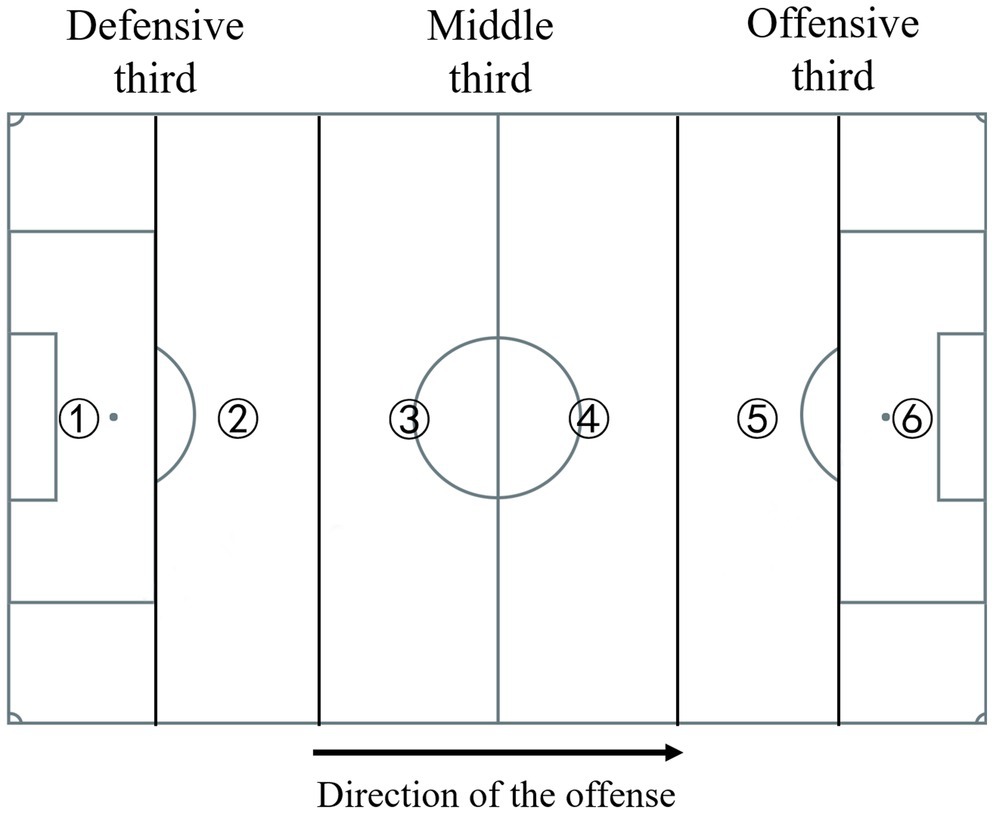
Figure 1. Pitch divisions in six zones parallel to the goal lines. ① represents zone 1; ② represents zone 2; ③ represents zone 3; ④ represents zone 4; ⑤ represents zone 5; ⑥ represents zone 6.
Expected goals (xG) measures the conversion probability of a shot based on pitch location and types of start (e.g., cross and counterattack) and finish (e.g., shot and headed shot). The xG assigns a quality value ranging from 0 to 1 for each shot toward the goal (scored or not scored) with a higher value indicating a greater likelihood of a scoring opportunity. For instance, a headed shot from the central position on the edge of the six-yard box has an xG value of 0.669. In other words, head shots taken from this position would have 66.9% probability of scoring a goal. The study regarded the xG of opponent teams as the reference to evaluate the effectiveness of each defensive playing style. The expected goal (xG) of the opponent team with a lower value in a match meant that the defensive team had a better performance in recovering the ball or preventing the opponent from scoring a goal. On the contrary, the defensive team with a higher xG of opponent teams had less effect on preventing offense through technical and tactical actions of defense. Therefore, the study extracted a total of 16 features related to offensive and defensive performance from the raw data based on the previous studies (Bransen et al., 2019; Yi et al., 2020; Haaren, 2021) to construct the xG model: X position of shot, Y position of shot, body part, counterattack, shooting distance to goal line, shooting distance to center, whether using the weak foot, shooting by head distance to goal line, last action prior to the shooting (cross, corner, key pass, dribble, and duel), angel of shooting, free kicks, and penalties. Finally, the distribution of xG values were plotted in the following figure (Figure 2).
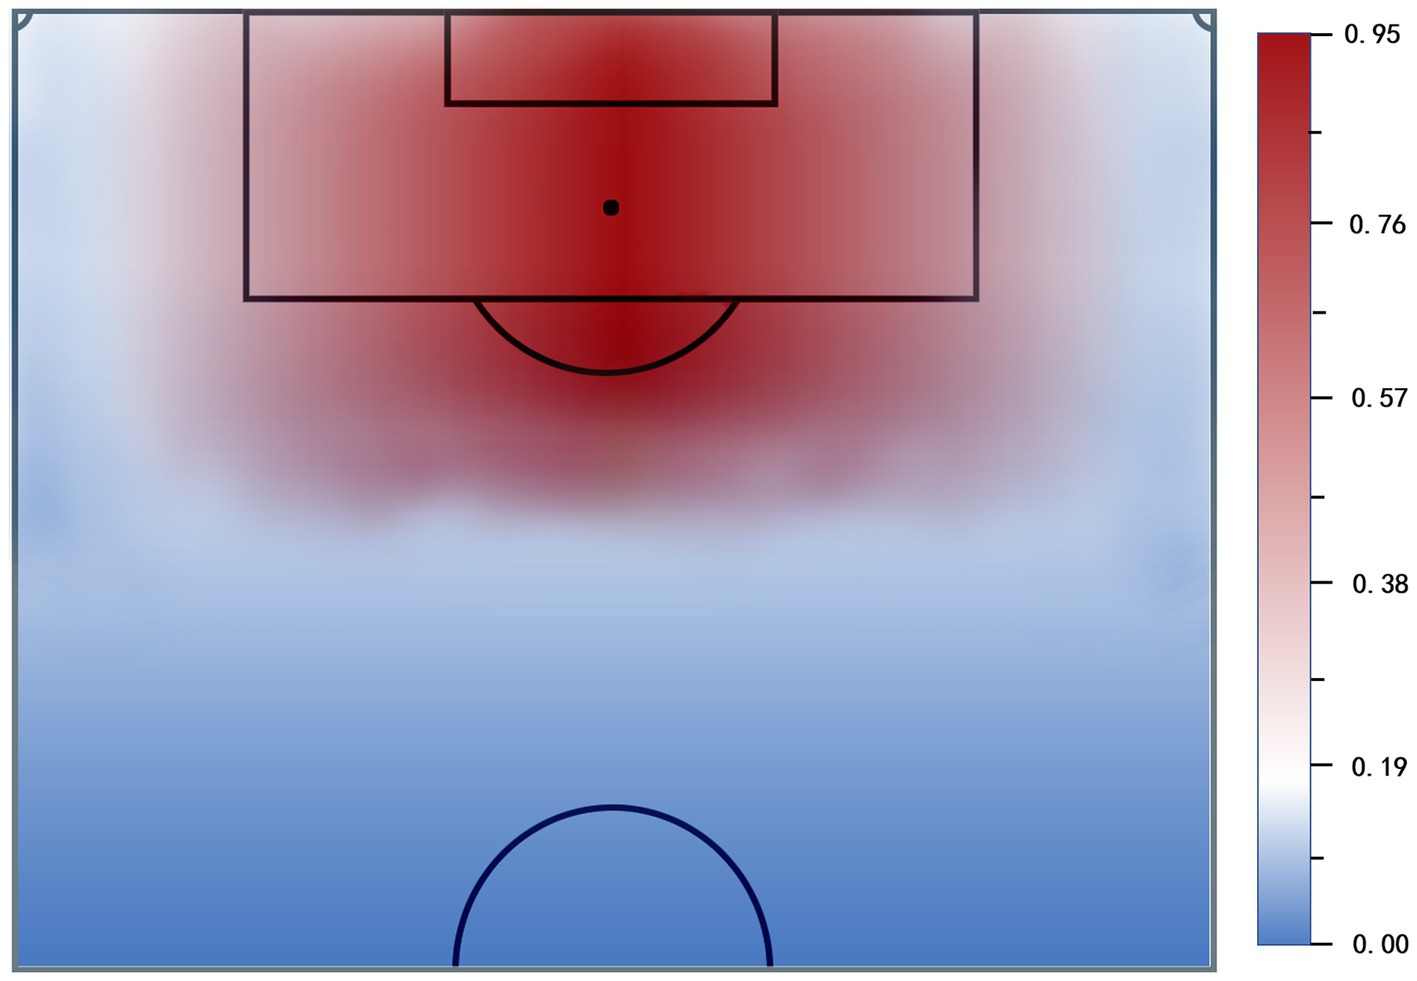
Figure 2. Expected conversion probabilities of shots on the pitch. The darker the red, the higher the expected goal.
Firstly, exploratory factor analysis using principal component analysis (PCA) was conducted on the defensive performance indicators with orthogonal rotation (varimax) running with all 15 performance indicators in order to pool the variables into factors (dimensions of defensive playing styles). This technique allowed the data set to be reduced to factors by grouping the measured variables (Field, 2013). To facilitate the comparison of teams’ defensive performance in each factor, the scores were later normalized to unify different scales of all factors. The normalized factor score for each team was obtained via dividing the original factor score by the median. For each factor, the performance indicators with the highest factor loading (i.e., the correlation between the performance indicator and the factor) are identified. This technique pools performance indicators into fewer factors that represent different styles of play.
The Kaiser–Meyer–Olkin measure (Kaiser, 1974) and communalities values after extraction (Maccallum et al., 1999) were employed to verify the sampling adequacy for the analysis. The adequacy of inter-item correlations is based on Bartlett’s sphericity test. Performance indicators with factor loadings greater than |0.6| showed a strong positive or negative correlation and indicated a substantial value for factor interpretation (Daniel, 1993).
Secondly, a xG model (a machine learning model—logistic regression analysis) was calculated using 27,852 shots from five seasons of CSL data (2016–2020). In order to improve the interpretability of the result and the accuracy of the model, there were more performance indicators related to shots were chosen as independent variables in the model. The metric of xG model was called AUC. The AUC of a model is the probability that the model ranks a random positive example (i.e., a successful shot) more highly than a random negative example (i.e., unsuccessful shot). For instance, 73.32% (AUC) meant that when randomly selecting a successful shot and an unsuccessful shot, there was a 73.32% chance that the model gave the successful shot a higher probability than the unsuccessful shot. Thus, this provided the basis for the expected goals model to calculate the likelihood of a shot resulting in a goal. A detailed explanation of the xG model and multiple performance indicators that covered this metric could be found in the study by Bransen et al. (2019) and Haaren (2021).
Lastly, the study performed a multiple regression analysis in a stepwise interactive mode in order to assess the influence that each defensive playing style had on the effectiveness of defense. The team’s score of each factor in a match was used as an independent variable. And xG of the opponent team in the same match was a dependent variable. The training model was calculated from the 2016 to 2019 seasons. And the 2020 season was used for a testing model to measure accuracy and validity of the multiple regression model. When testing the multiple regression model, Pearson’s correlation analysis of the predicted xG and the real xG was conducted. And the correlation coefficient (r) was calculated with absolute values of the thresholds being 0- to 0.3-weak correlation, 0.3–0.5 low correlation, 0.5–0.8 moderate correlation, and 0.8–1.0 high correlation (Field, 2013). To check the normality of the data, the Kolmogorov–Smirnov test was used. The homogeneity of variance was tested by Levene’s test. This analysis was inspired by similar investigations in professional football leagues (Aquino et al., 2017; Souza et al., 2019). In the regression analysis, all match statistics were introduced based on their correlation with the residual and their intercorrelation with variables that already included in the equation. Redundant variables were excluded to avoid multicollinearity by using the variance inflation factor (VIF). The values were adjusted for the number of cases and parameters in the analysis. Using the standardized regression coefficients, the relative contribution of each different variable in relation to the explained variances was calculated as follows:
where = partial contribution adjusted of a style, = standardized regression coefficient for parameter, = sum of all standardized regression coefficients in equation.
All the analyses were performed using Python 3.6 and statistical significance level was set at p < 0.05.
The Kaiser–Meyer–Olkin (KMO) measure verified the sampling adequacy for the analysis with a score of 0.76, and the communalities after extraction were greater than 0.6 in all performance indicators, deeming sample size to be adequate for factor analysis. Bartlett’s test of sphericity ( =3,258, df = 105, p < 0.05) indicated that correlations between items were sufficiently large for PCA. Eight components had eigenvalues (rotation sums of squared loadings) over one and explained 85.17% of the total variance. The percentage of variance explained by each factor decreased from factor 1 to 8. The rotated component matrix for the factor loadings determined the performance indicators associated with each factor (Table 2).
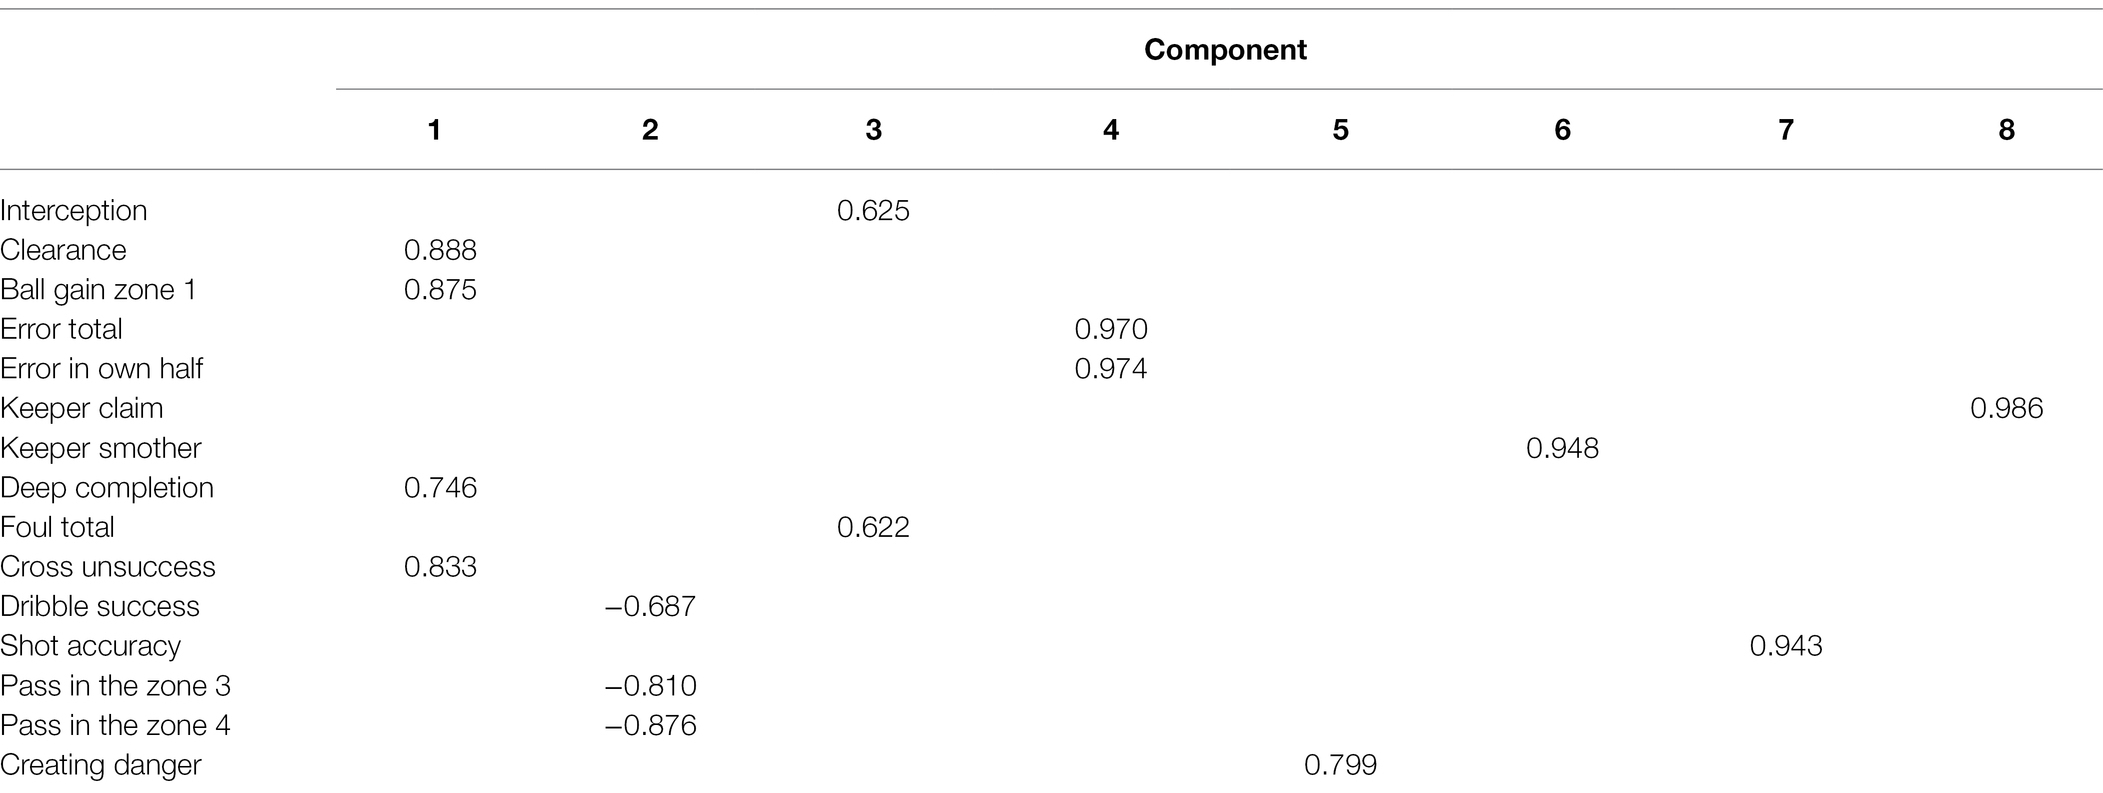
Table 2. Rotated component matrix for the performance indicators showing a strong positive or negative correlation.
Descriptions of factors were interpreted based on the group of associated performance indicators. A new factor score obtained after the team’s factor score was normalized according to the median determining how much a team relies on one specific defensive style or a combination of these styles of play. Factor 1 (Defense closed to the own goal) included clearance, ball gain zone 1, deep completion, and cross unsuccess. A team with a high score on this factor tended to defend in the defensive third. Factor 2 (mid-positioning defense with pressure) included dribble success, pass in the zone 3 and pass in the zone 4. The team that scored positively had a lower percentage of possession in the central third. Factor 3 (High intensity confrontation) included interception and foul total. A team with a high score regained more balls by fouling and dueling. Factor 4 (Error) defined teams that tended to makes an error leading to a goal or shot conceded if they scored highly. Factor 5 (Defense in advanced zones) defined teams creating a dangerous situation after giving more pressure in the offense third. Factor 6 and factor 8 (Defense of goalkeeper) identified the importance of keeper smother and keeper claim. Finally, factor 7 (Receiving a dangerous situation) defined teams with a high score which was not so good at defending that the opponent teams made dangerous situations frequently.
The process of improving the ROC curve of the models in xG was showed in Figure 3, with the value of AUC increasing from model 1 (AUC = 72.90%) containing X position of shot, Y position of shot, body part, and counterattack to model 4 (AUC = 79.83%) including free kicks, and penalties constantly, showing that when randomly selecting a successful shot and an unsuccessful shot, there was a 79.83% chance that the model gave the successful shot a higher probability than the unsuccessful shot.
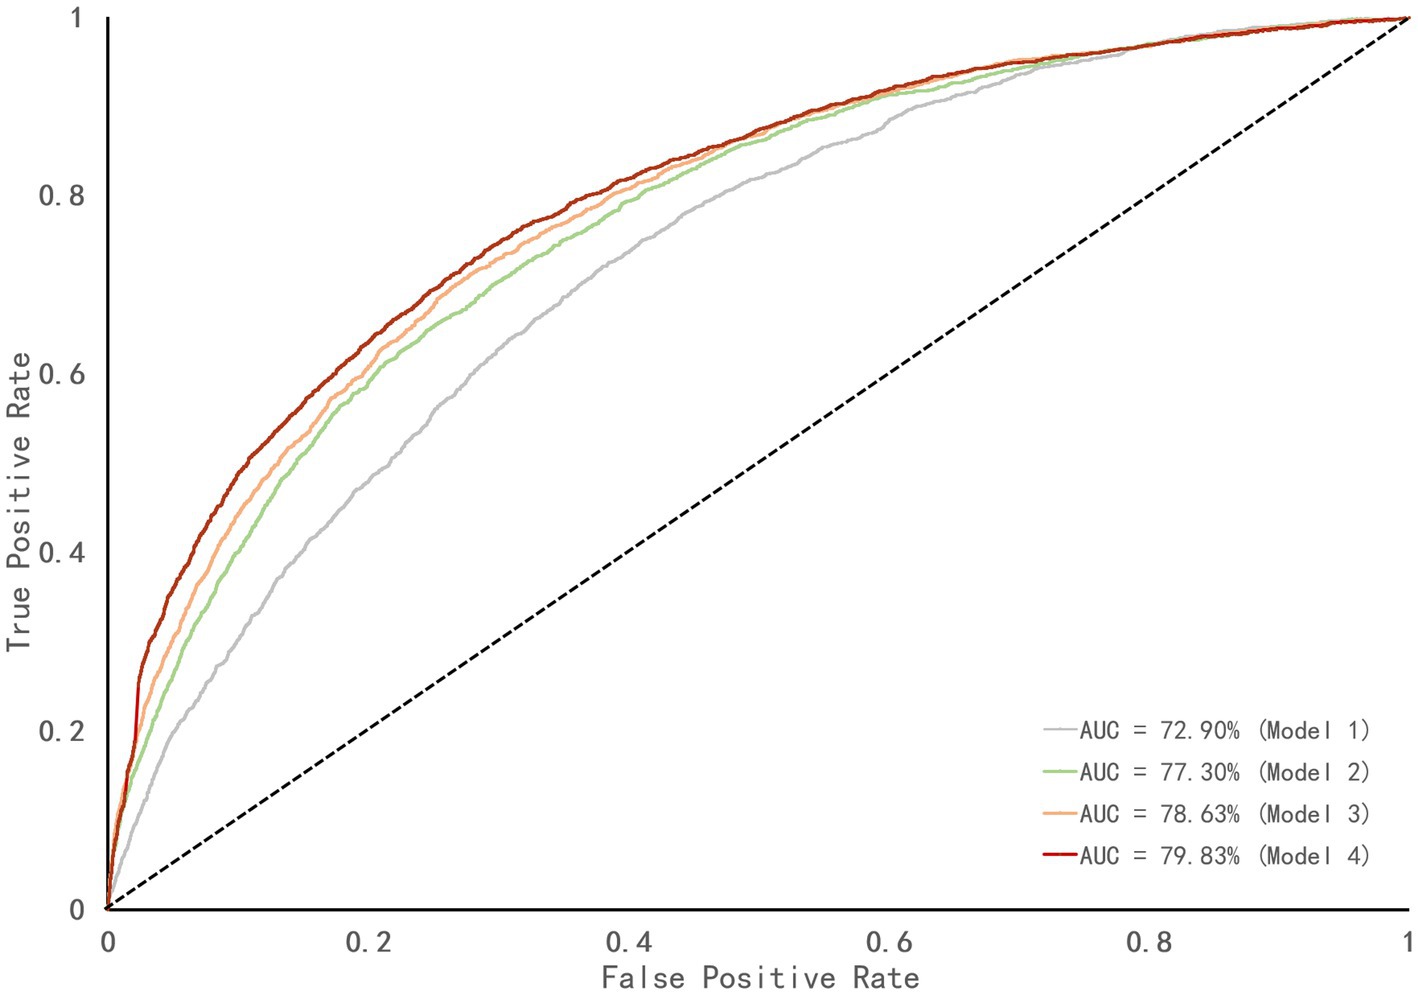
Figure 3. The ROC curve of different logistic regression models in xG. The diagonal dotted line represents a line of zero discrimination, also known as pure chance line.
Table 3 summarized the results of the multiple linear regression. Regarding degree of importance, the factor 7 (receive a dangerous situation) explained 31.3% of the variance in xG of the opponent in the model. Adding the factor 1 (defense closed to the own goal), this percentage reached 38.9%. Factor 4 (error) and factor 8 (keeper claim) explained 1.4 and 1% of the variance in the model. Finally, the styles of play adding the factor 3 (high intensity confrontation) explained 41.6% of the total variance in the model. On the contrary, factor 2 (mid-positioning defense with pressure), factor 5 (defense in advanced zones), and factor 6 (keeper smother) were excluded from the multiple regression model of prediction (all p > 0.05). Overall, the multiple regression analysis explained 41.6% of the total variance in the xG of the opponent. In this case, factor 7 (receive a dangerous situation) was the defensive style of play with the highest association to the xG of the opponent. Figure 4 included a comparison between the predicted and actual xG of the opponent with the multiple regression model of prediction by using the data of 2020 season. The predicted xG of the multiple regression model correlated with actual xG of the opponent at r = 0.62 (p < 0.05) showing a moderate correlation.
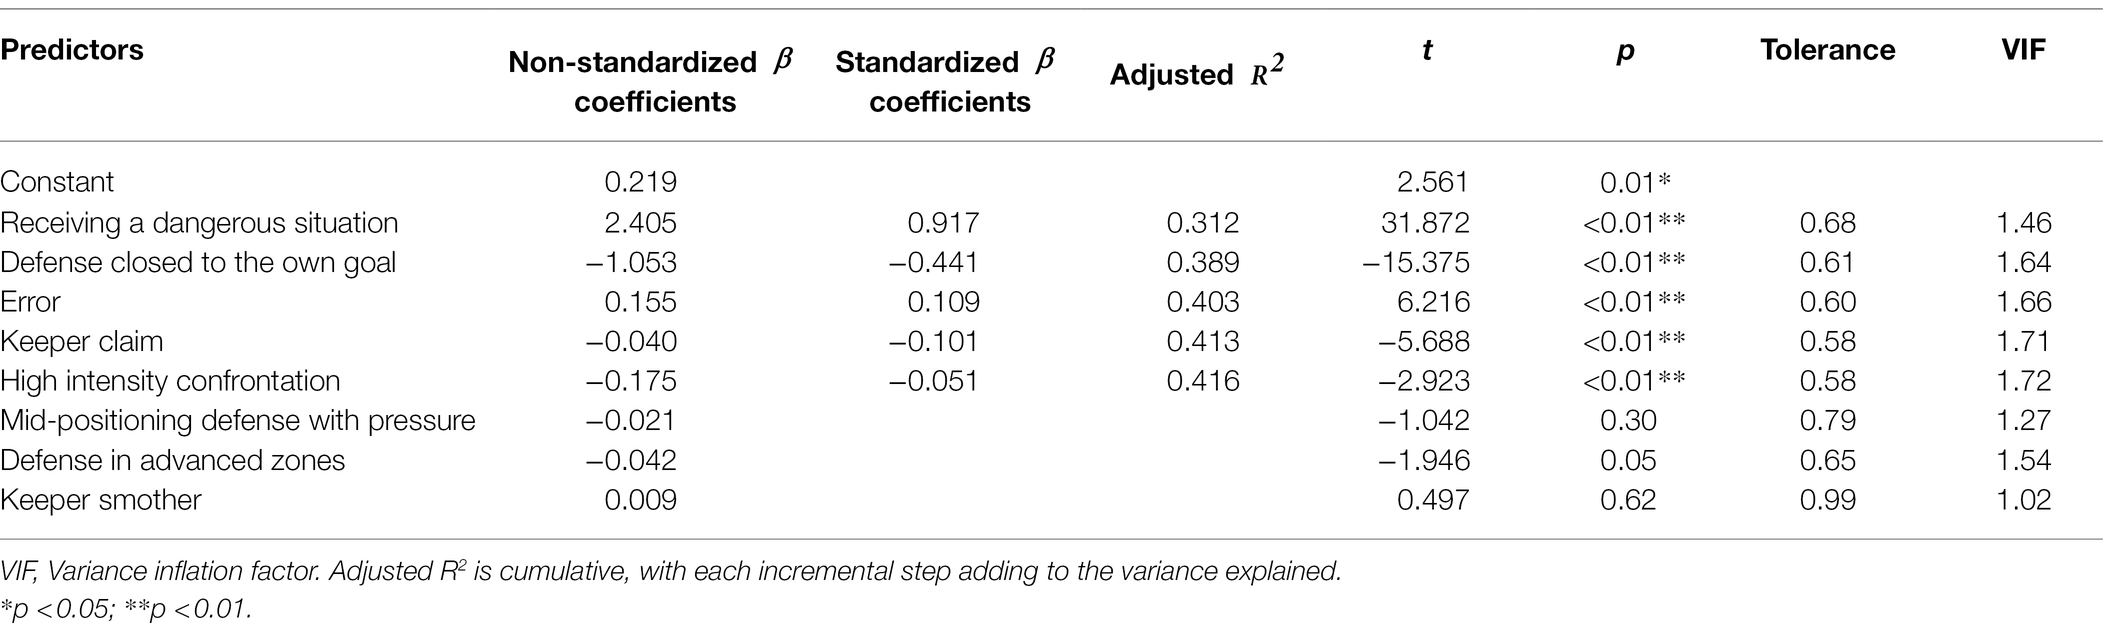
Table 3. Relative contribution of defensive styles of play to the variance of excepted goals (xG) of the opponent frequency.
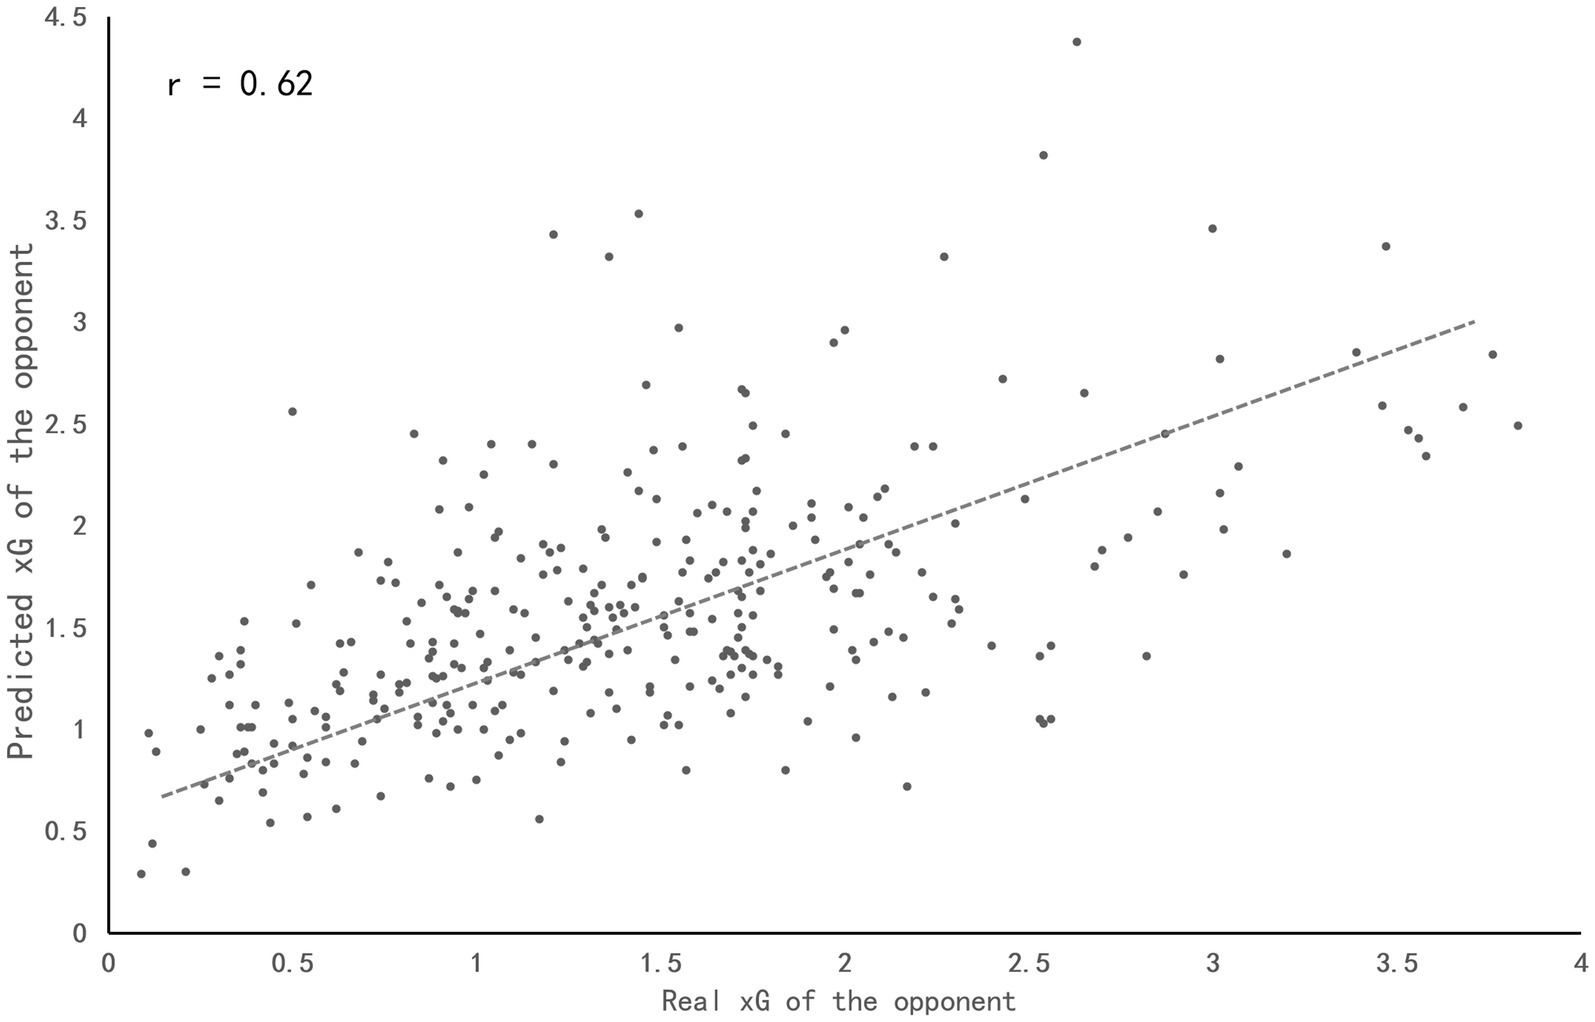
Figure 4. Correlation between the actual and predicted xG of the opponent of 2020 season in CSL. Each dot represents one team in a match, for a total of 320 real-predicted comparisons. The dotted line represents the trend of correlation between the actual and predicted xG of the opponent.
Expected goals of the opponent = 0.219 + (receive a dangerous situation × 2.405) + (defense closed to the own goal × − 1.053) + (error × 0.155) + (keeper claim × − 0.040) + (high intensity confrontation× − 0.175) (2).
The main aim of the current study was to identify and measure defensive playing styles used by the CSL teams during a five seasons period (from the 2016 to 2020 seasons) via considering a more comprehensive set of defensive techniques and spatial information; and to investigate the effectiveness of defensive styles of play during the seasons under analysis. As it was hypothesized, this study identified specific defensive playing styles based on fifteen technical–tactical indicators that varied along the matches as an adaptation of teams in various situational variables to perform at the highest level in the competition. To the best of our knowledge, although some investigations have described partially different styles of play in elite soccer (Fernandez-Navarro et al., 2016; Gómez et al., 2018; Lago-Peñas et al., 2018), no previous study has examined the effectiveness of the defensive playing styles used by teams and their association with the success of defense.
The current study identified 8 factors from the PCA: factor 1 (defense closed to the own goal), factor 2 (mid-positioning defense with pressure), factor 3 (high intensity confrontation), factor 4 (error), factor 5 (defense in advanced zones), factor 6 (keeper smother), factor 7 (receive a dangerous situation) and factor 8 (keeper claim). Meanwhile, the PCA results showed scores of 8 factors for teams indicating their reliance on specific defensive styles of play. Compared to the study of Castellano and Pic (2019) that classified playing styles of the Spanish first division (LaLiga) into two offensive phases (direct attack versus elaborate attack) and two defensive phases (deep defending versus high-pressure defense), the current study is able to achieve a complex classification of defensive styles via including the spatio-temporal and zonal information of more defense performance indicators. Such approach could therefore facilitate the assessment of defensive effectiveness. Moreover, these findings might not only allow analysts to identify their own team’s defensive playing styles in order to recognize their own strengths and weaknesses, but also inform coaches when designing specific trainings where teams are required to play against simulated opponents of different defensive styles or to strive to defend with the most efficient style (Díaz-Díaz et al., 2019).
The accuracy of the logistic regression model for xG was improved (AUC = 79.83%) after the training process, and the variables have considerably high interpretability for explaining offensive behaviors. Meanwhile, the predicted xG by the multiple regression model were consistent with actual xG (r = 0.62). Defense closed to the own goal (factor 1), high intensity confrontation (factor 2), error (factor 4), receive a dangerous situation (factor 7) and factor 8 (keeper claim) were found to be the most important variables of the model, implying that teams with the above styles achieved greater efficiency in preventing opponents from scoring. Interestingly, factor 7 was the variable that explained more proportion of the variance, and it is defined as whether the goal was threatened after teams losing possession of the ball. Higher scores in this variable could mean that teams were slow in transition so that it created a disadvantageous situation for themselves. Such claim is supported by the previous finding that shot accuracy (one of the variables in factor 7) could differentiate the best-ranked and least-ranked teams in LaLiga (Lago-Ballesteros and Lago-Peñas, 2010). Therefore, it is crucial for the defending team to be fast in transition once losing the possession and try to undermine the opponent’s offensive via forcing them to make non-threatening passes (Ali, 2011; Kempe et al., 2014). In addition, error (factor 4) including error and error in own half was also positive with xG of the opponent, which suggested that teams had higher scores in this factor tended to commit mistakes so frequently that the possession was easily lost. Previous research showed that ball recoveries closer to the attacking goal produced seven times more goals and 19 times more entries into the penalty area (Yi et al., 2019a), compared to ball recoveries in the defensive zones. Therefore, it was actually rather essential for defensive teams to make less errors especially in their own half.
Besides, factor 1 (defense closed to the own goal), factor 3 (high intensity confrontation) and factor 8 (keeper claim) were negative with xG of the opponent in the multiple regression model. Defense closed to the own goal (factor 1) explained the highest percentage of variance among them, while high intensity confrontation (factor 3) higher than factor 8. These defensive styles of play occupying a large proportion may be due to two reasons. On the one hand, it is widely believed that the growing presence of non-Chinese players in the CSL could account for these alterations in technical, tactical, and confrontational performance. In fact, it was plausible for non-Chinese players to encourage Chinese players to improve their physical and technical performance. Bush et al. (2015) found that the English Premier League has underwent substantial changes over the last decade with the distances of high intensity and sprinting increasing by 30–50% and the number of passes rising by 40%. On the other hand, it may be due to their traditional playing tactics for most CSL teams: dropping the line to avoid losing the ball and waiting for the chance to counterattack which might reduce xG of the opponent. It suggested that the tactical principle of counterattacking caused imbalances in the opposition’s defense and offense, therefore increasing the success of the attacking sequence and the chance to score a goal (Tenga et al., 2010). As for keeper claim (factor 8), it suggested that goalkeepers scoring highly tended to get possession of the ball positively which led to reduce xG of the opponent. In the modern football matches, goalkeepers were required not only to defend the goal, but also to actively cooperate with their teammates both during defending and attacking as an organizing role (Hughes and Bartlett, 2002; Dellal et al., 2011). Szwarc et al. (2019) who showed that the goalkeepers in the bottom 5 teams have a higher distance of sprint compared to the top five teams in the English Premier League.
In contrast, factor 2 (mid-positioning defense with pressure), factor 5 (defense in advanced zones), and factor 6 (keeper smother) were excluded from the regression analysis (p > 0.05). Mid-positioning defense with intense pressure (factor 2) suggested that the team which scoring lower paid more defensive attention to and put more pressure on the middle third so that the team gained much possession in the middle third and forward players had time and space to come into the box and seize the opportunity to shot. And defense in advanced zones (factor 5) identified teams that used high- or low-pressure defensive styles of play in the advance zones. Defense in advanced zones could influence scoring opportunities as the ball could be recovered closer to the opponent’s goal and increased the likelihood of facing an imbalanced defense (Wright et al., 2011). To sum up, concentrating more on the middle third suggested a possession style, while putting more pressure on the attacking third suggesting a high-pressure style. Nevertheless, there were two reasons for the two styles of defense being excluded. On the one hand, in the CSL, there were few teams having their playing philosophy for high-pressure and the highly skilled middle players in the team for passing abilities to have an impact on xG of the opponent where progress and breakthroughs should be made in the future for CSL teams. These findings were in accordance with available research suggesting top teams prefer to “control” the game by dictating it instead of giving the initiative to the opponent to protect own goal (Collet, 2013). On the other hand, these outcomes suggested that a more vertical style of play, where shot finalization on the goal became the main offensive objective, may be a more successful strategy to succeed in football instead of the prevalent idea of maintaining ball possession and passing over the opponent (Souza et al., 2019). As for keeper smother (factor 6), this was mainly because the defense was closer to the midfield and the forward which resulted in smothering for goalkeepers when the opponent got a chance of a single-pole ball. And realizing successful smother was too difficult for goalkeeper to influence xG of the opponent.
With regard to the limitations of the present study, some aspects should be highlighted to improve the applicability of its results. Firstly, the multiple regression analysis explained relatively low percentage (41.6%) of the total variance in the xG of the opponent. Such result could be due to two reasons. On the one hand, using xG of the opponent alone might not be able to comprehensively measure the defense of teams, as the former was highly relevant to the opposing offense. On the other hand, the physical, technical–tactical, and positional related variables concerning off-ball actions were not included in the current research, and should be considered in the future (Liu et al., 2015; Zhou et al., 2021). Secondly, the analysis of interactive effect of contextual-related variables (e.g., in-home vs. visitor; match status—winning, losing, or drawing; and the moment of match—begin of championship, middle, and end) need to be addressed to determine their impact on the selection of defensive indicators and the effectiveness of defensive playing styles. In fact, previous studies have emphasized the importance of situational variables in assessing offensive performance (Fernandez-Navarro et al., 2018; Zhou et al., 2018), but not during the defensive phase. Lastly, different countries and competitions should be analyzed in order to verify the generalizability of the findings base on the CSL.
In summary, this study allowed to identify and measure eight factors that represent seven different styles of play from fifteen defensive performance indicators based on a more comprehensive set of defensive techniques and spatial data by the PCA model. The team’s ranking showed different performance trends according to each team. After selecting these defensive styles of play and xG of the opponent to run the multiple regression model, five defensive styles were identified to have an influence on the effectiveness of defense in the CSL. If the team strengthened the defense closed to the own goal, high intensity confrontation, and defense of goalkeeper, meanwhile making less errors and receiving less dangerous situations, the discipline for opposing team to shoot and score would be greatly reduced. According to their team’s effectiveness and efficiency of defensive styles, coaches can deploy specific tactics and teams can choose appropriate players in the player markets. Further research should attempt to establish the influence of situational variables and off-ball actions on defensive style when measuring performance and outcomes.
Publicly available datasets were analyzed in this study. This data can be found at: www.whoscored.com.
LR, SZ, and YC: conceptualization and data curation. LR and YC: formal analysis. LR, HG, SZ, and YC: investigation. LR, HG, YS, ZP, SZ, and YC: methodology, software, writing— original draft preparation, designing the experiments and performing the statistical analysis, writing—review and editing, and writing and revising the manuscript. LR, ZP, and YC: visualization. YS, ZP, and YC: funding acquisition. HG, YS, ZP, SZ, and YC: supervising the design and reviewing the manuscript. All authors have made a substantial and direct contribution to manuscript and approved the final version of the manuscript.
This work was supported in part by the National Key Research and Development Program of China under grant 2020AAA0103404 and by National Natural Science Foundation of China under grants 72071018 and 72101032. YC was supported by the Fundamental Research Funds for the Central Universities of China (2021TD008).
The authors declare that the research was conducted in the absence of any commercial or financial relationships that could be construed as a potential conflict of interest.
All claims expressed in this article are solely those of the authors and do not necessarily represent those of their affiliated organizations, or those of the publisher, the editors and the reviewers. Any product that may be evaluated in this article, or claim that may be made by its manufacturer, is not guaranteed or endorsed by the publisher.
Ali, A. (2011). Measuring soccer skill performance: a review. Scandinavian. J. Medic. Sci. Spor. 21, 170–183. doi: 10.1111/j.1600-0838.2010.0125
Aquino, R., Martins, G. H. M., Vieira, L. H. P., and Menezes, R. P. (2017). Influence of match location, quality of opponents, and match status on movement patterns in Brazilian professional football players. J. Strength Cond. Res. 31, 2155–2161. doi: 10.1519/JSC.0000000000001674
Bradley, P. S., Archer, D. T., Hogg, B., Schuth, G., Bush, M., Carling, C., et al. (2016). Tier-specific evolution of match performance characteristics in the English premier league: it's getting tougher at the top. J. Sports Sci. 34, 980–987. doi: 10.1080/02640414.2015.1082614
Bransen, L., Van Haaren, J., and Michel, V. D. V. (2019). Measuring soccer players' contributions to chance creation by valuing their passes. J. Q. Anal. Sports 15, 97–116. doi: 10.1515/jqas-2018-0020
Bush, M. D., Archer, D. T., Hogg, R., and Bradley, P. S. (2015). Factors influencing physical and technical variability in the English premier league. Int. J. Sports Physiol. Perform. 10, 865–872. doi: 10.1123/ijspp.2014-0484
Carling, C., Williams, A., and Reilly, T. (2005). Handbook of soccer match analysis. A systemic approach to improve performance. J. Sports Sci. Med. 5, 10–24. doi: 10.4324/9780203448625
Casal, C. A., Andujar, M. Á., Losada, J. L., Ardá, T., and Maneiro, R. (2016). Identification of defensive performance factors in the 2010 FIFA world cup South Africa. Sports 4, 54–65. doi: 10.3390/sports4040054
Castellano, J., and Pic, M. (2019). Identification and preference of game styles in LaLiga associated with match outcomes. Int. J. Environ. Res. Public Health 16, 5090–5103. doi: 10.3390/ijerph16245090
Collet, C. (2013). The possession game? A comparative analysis of ball retention and team success in European and international football, 2007–2010. J. Sports Sci. 31, 123–136. doi: 10.1080/02640414.2012.727455
Dellal, A., Chamari, K., Wong, D. P., Ahmaidi, S., Keller, D., Barros, R., et al. (2011). Comparison of physical and technical performance in European soccer match-play: FA premier league and La Liga. Eur. J. Sport Sci. 11, 51–59. doi: 10.1080/17461391.2010.481334
Díaz-Díaz, R., Ramos-Verde, E., Arriaza, E., García-Manso, J. M., and Valverde-Esteve, T. (2019). Defensive performance indicators in a high-level Spanish football team. German J. Exer. Sport Res. 50, 264–272. doi: 10.1007/s12662-019-00638-6
Fernandez-Navarro, J., Fradua, L., Zubillaga, A., Ford, P. R., and McRobert, A. P. (2016). Attacking and defensive styles of play in soccer: analysis of Spanish and English elite teams. J. Sports Sci. 34, 2195–2204. doi: 10.1080/02640414.2016.1169309
Fernandez-Navarro, J., Fradua, L., Zubillaga, A., and McRobert, A. P. (2018). Influence of contextual variables on styles of play in soccer. Int. J. Perform. Anal. Sport 18, 423–436. doi: 10.1080/24748668.2018.1479925
Fernandez-Navarro, J., Fradua, L., Zubillaga, A., and McRobert, A. P. (2019a). Evaluating the effectiveness of styles of play in elite soccer. Int. J. Sports Sci. Coach. 14, 514–527. doi: 10.1177/1747954119855361
Fernandez-Navarro, J., Ruiz-Ruiz, C., Zubillaga, A., and Fradua, L. (2019b). Tactical variables related to gaining the ball in advanced zones of the soccer pitch: analysis of differences Among elite teams and the effect of contextual variables. Front. Psychol. 10:3040. doi: 10.3389/fpsyg.2019.03040
Field, A. (2013). Discovering Statistics Using IBM SPSS Statistics. United States: Sage Publications Ltd.
Gómez, M. A., Mitrotasios, M., Armatas, V., and Lago-Peñas, C. (2018). Analysis of playing styles according to team quality and match location in Greek professional soccer. Int. J. Perform. Anal. Sport 18, 986–997. doi: 10.1080/24748668.2018.1539382
Grehaigne, J. F., Bouthier, D., and David, B. (1997). Dynamic-system analysis of opponent relationships in collective actions in soccer. J. Sports Sci. 15, 137–149. doi: 10.1080/026404197367416
Haaren, J. V. (2021). “Why Would I Trust Your Numbers?” On the Explainability of Expected Values in Soccer. Belgium: KU Leuven.
Hewitt, A., Greenham, G., and Norton, K. (2016). Game style in soccer: what is it and can we quantify it? Int. J. Perform. Anal. Sport 16, 355–372. doi: 10.1080/24748668.2016.11868892
Hughes, M. D., and Bartlett, R. M. (2002). The use of performance indicators in performance analysis. J. Sports Sci. 20, 739–754. doi: 10.1080/026404102320675602
Kaiser, H. F. (1974). An index of factorial simplicity. Psychometrika 39, 31–36. doi: 10.1007/BF02291575
Kempe, M., Vogelbein, M., Memmert, D., and Nopp, S. (2014). Possession vs. direct play: evaluating tactical behavior in elite soccer. J. Sports Sci. 4, 35–41. doi: 10.5923/s.sports.201401.05
Kubayi, A., and Toriola, A. (2020). Match performance indicators that discriminated Between winning, drawing and losing teams in the 2017 AFCON soccer championship. J. Hum. Kinet. 72, 215–221. doi: 10.2478/hukin-2019-0108
Lago-Ballesteros, J., and Lago-Peñas, C. (2010). Performance in team sports: identifying the keys to success in soccer. J. Human Kineti. 25, 85–91. doi: 10.2478/v10078-010-0035-0
Lago-Peñas, C., Gómez-Ruano, M., and Yang, G. (2018). Styles of play in professional soccer: an approach of the Chinese soccer super league. Int. J. Perform. Anal. Sport 17, 1073–1084. doi: 10.1080/24748668.2018.1431857
Liu, T., Garcia-De-Alcaraz, A., Zhang, L., and Zhang, Y. (2019). Exploring home advantage and quality of opposition interactions in the Chinese football super league. Int. J. Perform. Anal. Sport 19, 289–301. doi: 10.1080/24748668.2019.1600907
Liu, H., Hopkins, W., Gómez, A. M., and Molinuevo, S. J. (2017). Inter-operator reliability of live football match statistics from OPTA Sports data. Int. J. Perform. Anal. Sport 13, 803–821. doi: 10.1080/24748668.2013.11868690
Liu, G. M. A., Lago-Peñas, C., and Sampaio, J. (2015). Match statistics related to winning in the group stage of 2014 Brazil FIFA world cup. J. Sports Sci. 33, 1205–1213. doi: 10.1080/02640414.2015.1022578
Maccallum, R. C., Widaman, K. F., Zhang, S., and Hong, S. (1999). Sample size in factor analysis. Psychol. Methods 4, 84–99. doi: 10.1037/1082-989X.4.1.84
Memmert, D., Lemmink, K., and Sampaio, J. (2016). Current approaches to tactical performance analyses in soccer using position data. Sports Med. 47, 1–10. doi: 10.1007/s40279-016-0562-5
Moura, F., Martins, L. B., Anido, R., Ruffino, P. C., Barros, R. L., and Cunha, S. (2013). A spectral analysis of team dynamics and tactics in Brazilian football. J. Sports Sci. 31, 1568–1577. doi: 10.1080/02640414.2013.789920
Moura, F. A., Martins, L., and Cunha, S. A. (2014). Analysis of football game-related statistics using multivariate techniques. J. Sports Sci. 32, 1881–1887. doi: 10.1080/02640414.2013.853130
Rathke, A. (2017). An examination of expected goals and shot efficiency in soccer. J. Hum. Sport Exer. 12, 514–529. doi: 10.14198/jhse.2017.12.Proc2.05
Sánchez, V., Geovanny, W., Arias, A., and Alberto, E. (2021). Effects of the didactic model of game action competences on tactical performance, motivation, and perception of skill in young football players. J. Phy. Educ. Sport 21, 3556–3568. doi: 10.7752/jpes.2021.06481
Souza, D. B., Lopez-Del Campob, R., Blanco-Pita, H., Resta, R., and Del Coso, J. (2019). A new paradigm to understand success in professional football: analysis of match statistics in LaLiga for 8 complete seasons. Int. J. Perform. Anal. Sport 19, 543–555. doi: 10.1080/24748668.2019.1632580
Szwarc, A., Jaszczur-Nowicki, J., Aschenbrenner, P., Zasada, M., Padulo, J., and Lipinska, P. (2019). Motion analysis of elite polish soccer goalkeepers throughout a season. Biol. Sport 36, 357–363. doi: 10.5114/biolsport.2019.88758
Tenga, A., Holme, I., Ronglan, L. T., and Bahr, R. (2010). Effect of playing tactics on goal scoring in Norwegian professional soccer. J. Sports Sci. 28, 237–244. doi: 10.1080/02640410903502774
Villa, G., and Lozano, S. (2019). Assessing offensive/defensive strategies in a football match using DEA. Int. J. Sport Financ. 14, 131–146. doi: 10.32731/ijsf/143.082019.01
Vogelbein, M., Nopp, S., and Hokelmann, A. (2014). Defensive transition in soccer - are prompt possession regains a measure of success? A quantitative analysis of German Fussball-Bundesliga 2010/2011. J. Sports Sci. 32, 1076–1083. doi: 10.1080/02640414.2013.879671
Wright, C., Atkins, S., Polman, R., Jones, B., and Sargeson, L. (2011). Factors associated with goals and goal scoring opportunities in professional soccer. Int. J. Perform. Anal. Sport 11, 438–449. doi: 10.1080/24748668.2011.11868563
Yi, G. R., Dai, C., Liu, H., and Gómez Ruan, M. A. (2019b). Differences in technical performance of players From 'The big Five' European football leagues in the UEFA champions league. Front. Psychol. 10, 2738–2745. doi: 10.3389/fpsyg.2019.02738
Yi, Q., Jia, H., Liu, H., and Gómez, A. M. (2018). Technical demands of different playing positions in the UEFA champions league. Int. J. Perform. Anal. Sport 18, 926–937. doi: 10.1080/24748668.2018.1528524
Yi, Q., Liu, H., Nassis, G. P., and Gómez, M.-A. (2020). Evolutionary trends of Players' technical characteristics in the UEFA champions league. Front. Psychol. 11:1032. doi: 10.3389/fpsyg.2020.01032
Yi, G. M. A., Wang, L., Huang, G., Zhang, H., and Liu, H. (2019a). Technical and physical match performance of teams in the 2018 FIFA world cup: effects of two different playing styles. J. Sports Sci. 37, 2569–2577. doi: 10.1080/02640414.2019.1648120
Zhou, C., Lago-Peñas, C., Lorenzo, A., and Gómez, M. A. (2021). Long-term trend analysis of playing styles in the Chinese soccer super league. J. Hum. Kinet. 79, 237–247. doi: 10.2478/hukin-2021-0077
Keywords: defense, multivariate regression, match analysis, xG, PCA
Citation: Ruan L, Ge H, Shen Y, Pu Z, Zong S and Cui Y (2022) Quantifying the Effectiveness of Defensive Playing Styles in the Chinese Football Super League. Front. Psychol. 13:899199. doi: 10.3389/fpsyg.2022.899199
Edited by:
Qing Yi, Shanghai University of Sport, ChinaReviewed by:
Miguel Pic, South Ural State University, RussiaCopyright © 2022 Ruan, Ge, Shen, Pu, Zong and Cui. This is an open-access article distributed under the terms of the Creative Commons Attribution License (CC BY). The use, distribution or reproduction in other forums is permitted, provided the original author(s) and the copyright owner(s) are credited and that the original publication in this journal is cited, in accordance with accepted academic practice. No use, distribution or reproduction is permitted which does not comply with these terms.
*Correspondence: Shouxin Zong, enN4QGJzdS5lZHUuY24=; Yixiong Cui, Y3VpeWl4aW9uZ0Bic3UuZWR1LmNu
Disclaimer: All claims expressed in this article are solely those of the authors and do not necessarily represent those of their affiliated organizations, or those of the publisher, the editors and the reviewers. Any product that may be evaluated in this article or claim that may be made by its manufacturer is not guaranteed or endorsed by the publisher.
Research integrity at Frontiers
Learn more about the work of our research integrity team to safeguard the quality of each article we publish.