 Pantelis T. Nikolaidis
 Beat Knechtle
95% of researchers rate our articles as excellent or good
Learn more about the work of our research integrity team to safeguard the quality of each article we publish.
Find out more
ORIGINAL RESEARCH article
Front. Psychol. , 29 November 2021
Sec. Movement Science
Volume 12 - 2021 | https://doi.org/10.3389/fpsyg.2021.729247
This article is part of the Research Topic Training Methodology: A Multidimensional Approach For Team Sports View all 13 articles
Peak power of the Wingate anaerobic test (WAnT), either in W (Ppeak) or in W.kg–1 (rPpeak), has been widely used to evaluate the performance of soccer players; however, its relationship with force–velocity (F-v) test (e.g., whether these tests can be used interchangeably) has received little scientific attention so far. The aim of this work was to develop and validate a prediction equation of Ppeak and rPpeak from F-v characteristics in male soccer players. Participants were 158 adult male soccer players (sport experience 11.4 ± 4.5 years, mean ± standard deviation, approximately five weekly training units, age 22.6 ± 3.9 years, body mass 74.8 ± 7.8 kg, and height 178.3 ± 7.8 cm) who performed both WAnT and F-v test. An experimental (EXP, n = 79) and a control group (CON, n = 79) were used for development and validation, respectively, of the prediction equation of Ppeak and rPpeak from F-v test. In EXP, Ppeak correlated very largely with body mass (r = 0.787), fat-free mass (r = 0.765), largely with maximal power of F-v test (Pmax; r = 0.639), body mass index (r = 0.603), height (r = 0.558), moderately with theoretical maximal force (F0; r = 0.481), percentage of body fat (r = 0.471), fat mass (r = 0.443, p < 0.001); rPpeak correlated with rPmax (largely; r = 0.596, p < 0.001), theoretical maximal velocity (v0; moderately; r = 0.341, p = 0.002), F0 (small magnitude; r = 0.280, p = 0.012), BF (r = −0.230, p = 0.042), and fat mass (r = −0.242, p = 0.032). Ppeak in EXP could be predicted using the formula “44.251 + 7.431 × body mass (kg) + 0.576 × Pmax (W) – 19.512 × F0” (R = 0.912, R2 = 0.833, standard error of estimate (SEE) = 42.616), and rPpeak from “3.148 + 0.218 × rPmax (W.kg–1) + v0 (rpm)” (R = 0.765, R2 = 0.585, SEE = 0.514). Applying these formulas in CON, no bias was observed between the actual and the predicted Ppeak (mean difference 2.5 ± 49.8 W; 95% CI, −8.7, 13.6; p = 0.661) and rPpeak (mean difference 0.05 ± 0.71 W.kg–1; 95% CI, −0.11, 0.21, p = 0.525). These findings provided indirect estimates of Ppeak of the WAnT, especially useful in periods when this test should not be applied considering the fatigue it causes; in this context, the F-v test can be considered as an alternative of exercise testing for estimating the average Ppeak of a group of soccer players rather than for predicting individual scores when the interindividual variation of performance is small.
Performance in soccer has been shown to rely on movements such as sprinting, passing, shooting, jumping, and change of direction (Lepschy et al., 2021; Longo et al., 2021). Considering the short duration and maximal effort characterizing these movements, it was not surprising that the Wingate anaerobic test (WAnT), an all-out 30-s test on a cycle ergometer, was widely used to evaluate performance in this team sport (Chtourou et al., 2019; Bahenský et al., 2020). The most popular index of the WAnT has been the peak power expressed either in absolute (Ppeak) or relative to body mass values (rPpeak). Ppeak was related largely with linear and non-linear sprint performance and moderately with 20-m sprint performance, and could differentiate soccer players among playing positions (Joo and Seo, 2016; Nikolaidis et al., 2016; Almansba et al., 2019). Nevertheless, performing the WAnT might be contraindicated during congested fixture periods or periods of intense training (Freitas et al., 2021). In such periods, additional exercise testing fatigue would be undesirable considering that WAnT might lead to blood lactate concentration higher than 11 mmol.L–1 in soccer players (Keir et al., 2013; Thom et al., 2020) and athletes of other sport (Jemni et al., 2006), and the use of surrogate measures of short-term muscle power might be an alternative.
The force–velocity (F-v) test, eliciting maximal power either in W (Pmax) or W.kg–1 (rPmax), was also performed on a cycle ergometer; however, compared to the WAnT that used 30-s continuous exercise, it lasted a similar total duration, but included a series of sprints separated by 5 min of recovery (Vandewalle et al., 1985; Aloui et al., 2020). The intermittent protocol of the F-v test might explain the relatively low post-test blood lactate values reported in the literature, e.g., 3.5 mmol.L–1 (Sanchez et al., 2012), ∼6.5 mmol.L–1 (Bouhlel et al., 2010), and ∼7.5 mmol.L–1 (Blonc et al., 1998). In addition to Pmax and rPmax, the F-v test provided two other indices, namely theoretical maximal force (F0) and velocity (v0) (Jaafar, 2017). Moreover, the F-v test has been used less often than WAnT in the evaluation of soccer players (Ben Ayed et al., 2011; Hammami et al., 2019). In this context, considering the importance of short-term muscle power for soccer performance, it would be interesting to examine the relationship of Ppeak and rPpeak of the WAnT with indices of the F-v test.
Although the abovementioned studies enhanced our understanding of the metabolic demands of the WAnT and F-v test, little information has been available about their relationship, and particularly, about the possibility to predict Ppeak and rPpeak from F-v characteristics (i.e., Pmax, rPmax, F0, and v0). Such information would be of great practical use for coaches and trainers working with soccer players to monitor performance, especially during periods of intense training and competition; if the prediction of Ppeak and rPpeak from F-v characteristics was possible, the F-v test as a less “lactic” exercise test, and consequently, inducing less fatigue, could be an alternative to the WAnT for the evaluation of Ppeak and rPpeak (Bouhlel et al., 2010; Keir et al., 2013). Therefore, the aim of this work was to (a) develop a prediction equation of Ppeak and rPpeak in soccer players, (b) examine the validity of this equation and its variation by performance level of rPpeak. The research hypothesis was that the development and validation of prediction equations would be possible considering the affinity of the WAnT and F-v test in terms of metabolic demands and mode of motion (Driss and Vandewalle, 2013).
Participants were 158 adult men soccer players of soccer clubs of regional level (i.e., from the third, fourth, and fifth national league; sport experience 11.4 ± 4.5 years, mean ± standard deviation, approximately five weekly training units, age 22.6 ± 3.9 years, body mass 74.8 ± 7.8 kg, and height 178.3 ± 7.8 cm) who performed both WAnT and F-v test. An experimental (EXP, n = 79) and a control group (CON, n = 79) were used for the development and validation of prediction equation, respectively, of Ppeak and rPpeak from F-v test. All participants provided informed consent after having been presented the benefits and risks of their participation in the present study.
A weight scale (HD-351 Tanita, Illinois, United States) measured body mass (in the nearest 0.1 kg), a portable stadiometer (SECA, Leicester, United Kingdom) height (0.1 cm), and a caliper (Harpenden, West Sussex, United Kingdom) skinfolds (0.5 mm), respectively. Body mass index (BMI) was calculated as the quotient of body mass (kg) to height squared (m2). Body fat percentage (BF) was estimated from the sum of 10-skinfolds (cheek, wattle, chest I: pectoral, triceps, subscapular, abdominal, chest II: between the anterior axillary fold and the nipple, suprailiac, thigh and calf; BF = −41.32 + 12.59 × logex, where x is the sum of 10 skinfolds) (Eston and Reilly, 2009). Fat mass and fat-free mass were calculated using the formulas “body mass × BF/100′”and “body mass – fat mass,” respectively. The F-v test was employed to assess Pmax, rPmax, F0, and v0. This test employed various braking forces eliciting different pedaling velocities to evaluate the F-v relationship (Vandewalle et al., 1985; Aloui et al., 2020). The participants performed four sprints, each one lasting 7 s against incremental braking force (2, 3, 4, and 5 kg) on a cycle ergometer (Ergomedics 874, Monark, Sweden), interspersed by 5-min recovery periods. The WAnT was administered in the same ergometer as the F-v did (Dotan and Bar-Or, 1980; Miller, 2020). Briefly, participants were asked to pedal as fast as possible for 30 s against a braking force that was determined by the product of body mass in kilograms by 0.075. Both WAnT and F-v test have shown excellent intraclass correlation coefficient (>0.98) (Ingle and Tolfrey, 2013).
A one-way analysis of variance examined differences in training, anthropometric, and physiological characteristics in the total sample of participants among quintiles of rPpeak, i.e., low (n = 32; minimum, 8.96 W.kg–1 maximum, 10.60 W.kg–1), below average (n = 31; 10.61–11.18 W.kg–1), average (n = 32; 11.21–11.62 W.kg–1), above average (n = 31; 11.63–12.00 W.kg–1) and high rPpeak (n = 32; 12.02–13.78 W.kg–1). The magnitude of these differences was evaluated by eta squared (η2). An independent t-test compared training, anthropometric, and physiological characteristics between EXP (n = 79) and CON (n = 79), and 95% confidence intervals were calculated for potential differences. The magnitude of differences between EXP and CON was assessed by Cohen’s d. In EXP, Pearson’s moment correlation coefficient (r) examined the relationship of Ppeak and rPpeak with anthropometric and F-v characteristics (cut-off of r: < 0.10, trivial; 0.10–0.30, small; 0.30–0.50, moderate; 0.50–0.70, large; 0.70–0.90 very large; >0.90, perfect relationship). Also, in EXP, a stepwise regression analysis was carried out to identify predictors and develop prediction equations of Ppeak and rPpeak. In CON, Bland–Altman plots examined the agreement between predicted and actual Ppeak and rPpeak. All analyses were performed using GraphPad Prism v. 7.0 (GraphPad Software, San Diego, CA, United States) and IBM SPSS v.26.0 (SPSS, Chicago, IL, United States). Statistical significance for these analyses was set at alpha = 0.05.
Performance groups (quintiles of rPpeak) did not differ for training (p ≥ 0.282, η2 ≤ 0.043) and anthropometric characteristics (p ≥ 0.133, η2 ≤ 0.045) (Table 1). In addition to rPpeak, they also differed in Ppeak, Pmean, rPmean and FI of the WAnT, and Pmax, rPmax and v0 of the F-v test (p ≤ 0.026, η2 ≥ 0.071), but not for F0 (p = 0.800, η2 = 0.011). Participants of high rPpeak showed higher scores in the abovementioned variables than those with lower rPpeak.
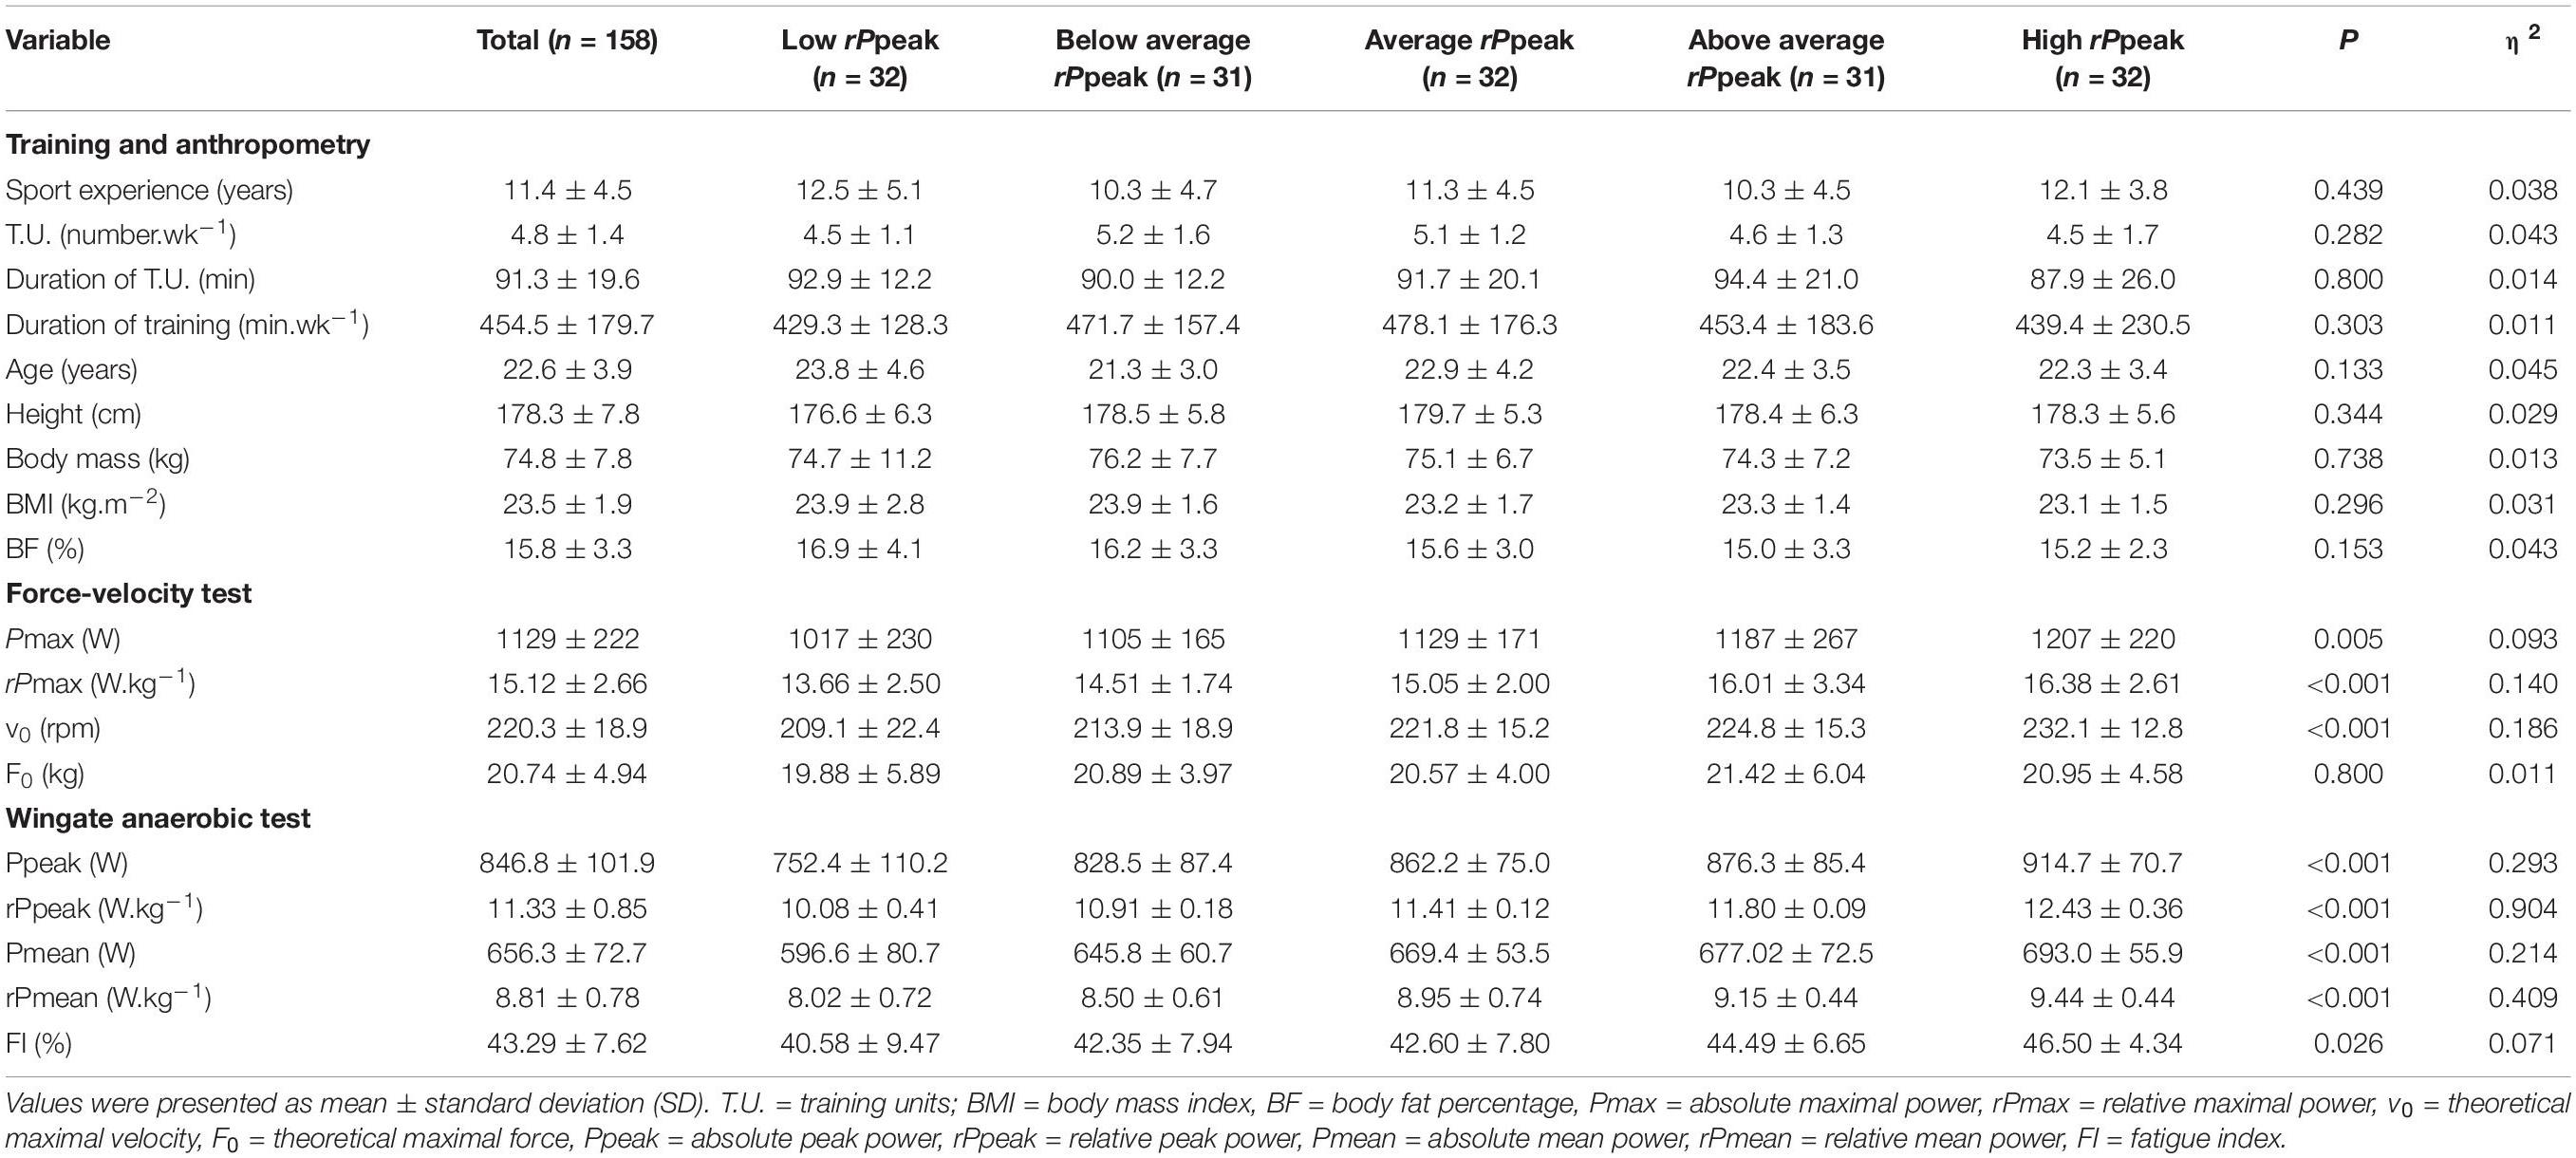
Table 1. Training, anthropometric and physiological characteristics in the total sample of participants (n = 158) and by quintiles of relative peak power of the Wingate anaerobic test.
In EXP, Ppeak correlated very largely with body mass (r = 0.787), fat-free mass (r = 0.782), largely with Pmax (r = 0.639), BMI (r = 0.603), fat mass (r = 0.611) height (r = 0.558), moderately with F0 (r = 0.481), BF (r = 0.471; p < 0.001), but not with rPmax (r = 0.190, p = 0.093) age (r = 0.189, p = 0.096), and v0 (r = 0.128, p = 0.262); rPpeak correlated with rPmax (largely; r = 0.596, p < 0.001), v0 (moderately; r = 0.341, p = 0.002), F0 (small magnitude; r = 0.280, p = 0.012), BF (r = −0.230, p = 0.042), fat mass (r = −0.242, p = 0.032). The correlations between Ppeak and Pmax, rPpeak and rPmax in EXP are presented in Figure 1.
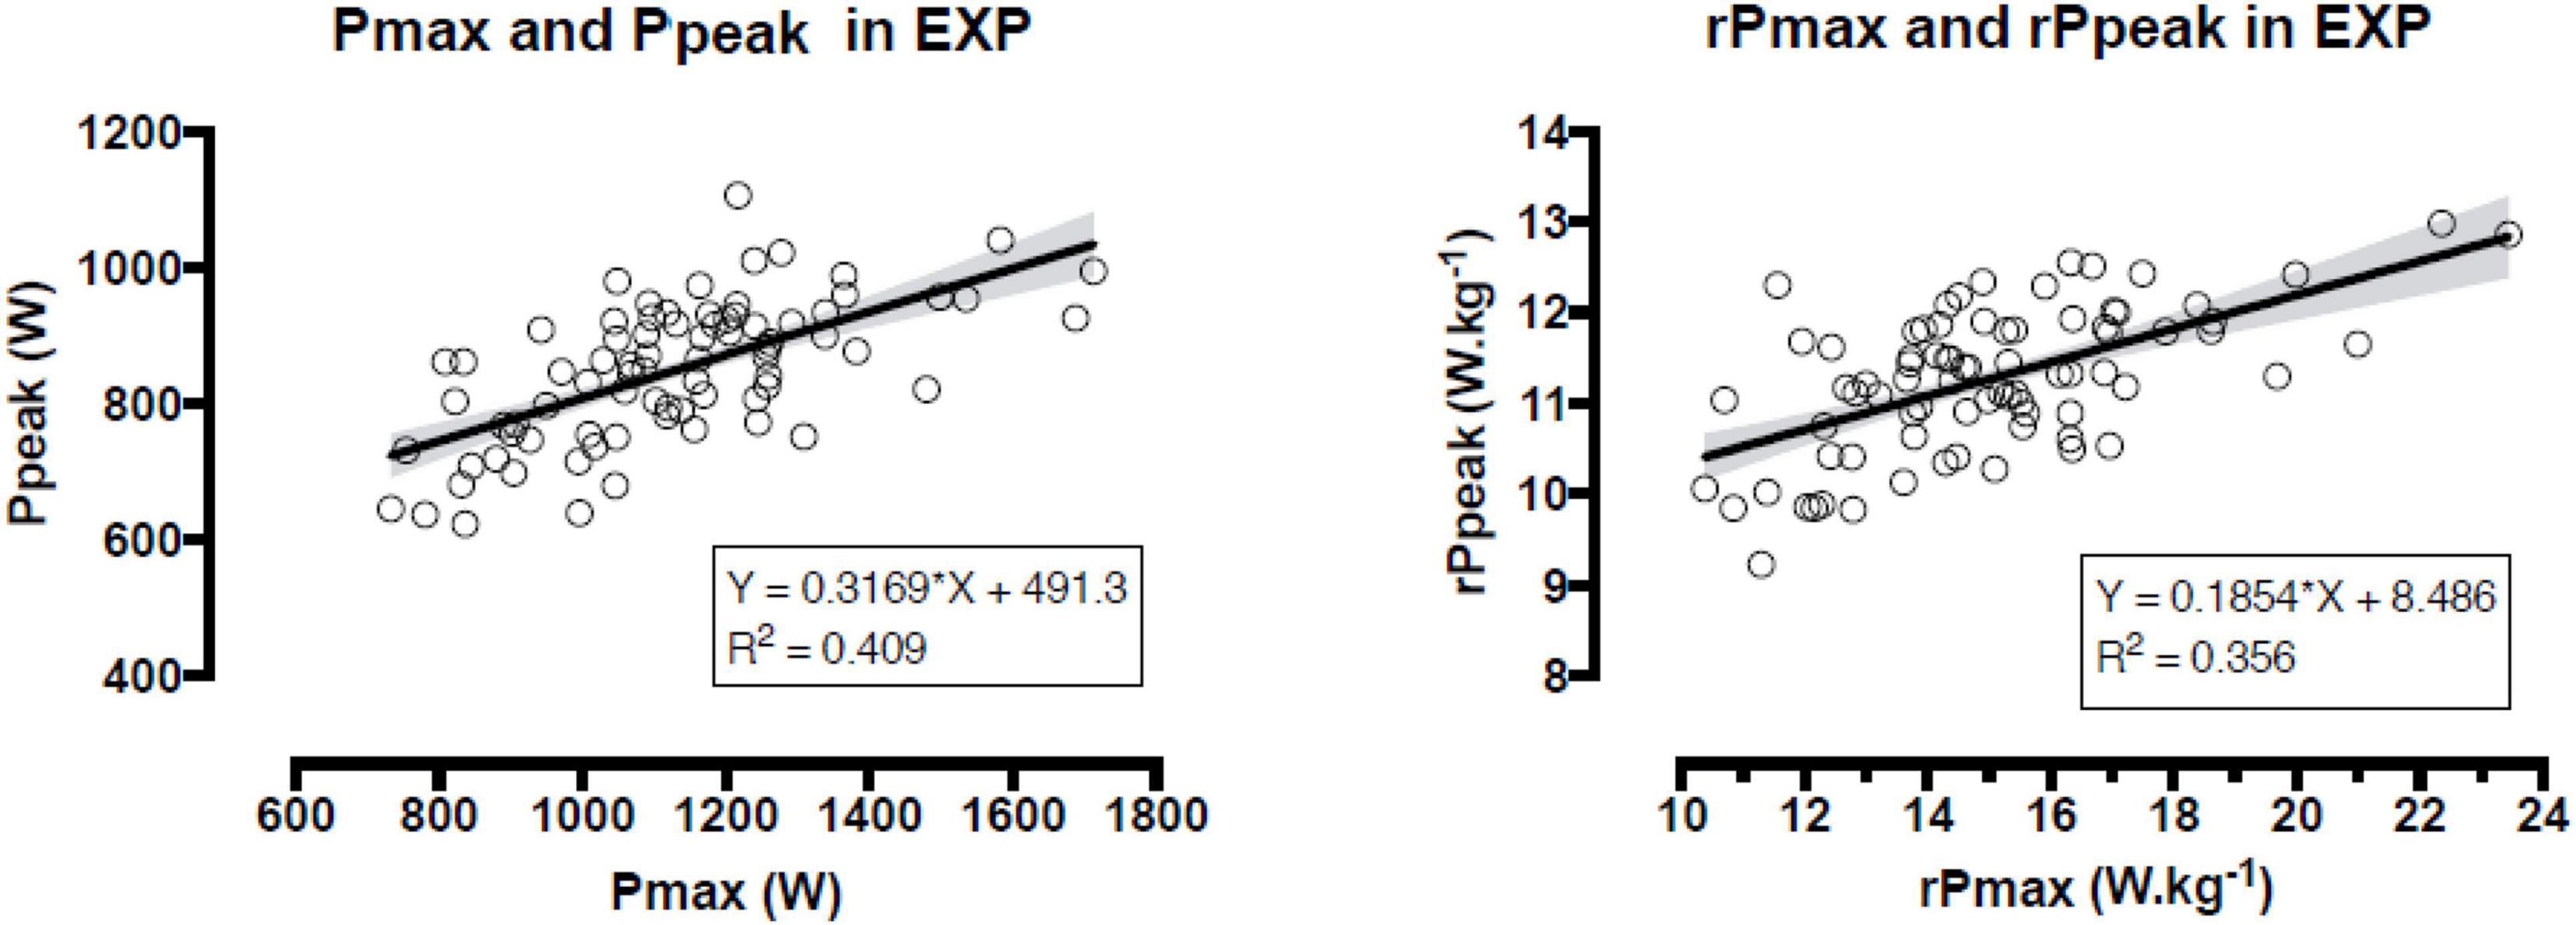
Figure 1. Relationship between maximal power of the force-velocity test and peak power of the Wingate anaerobic test (both in absolute and relative to body mass values) in the experimental group. Pmax = absolute maximal power, rPmax = relative maximal power, Ppeak = absolute peak power, rPpeak = relative peak power.
Compared with CON, EXP had similar sport experience (mean difference −0.6 years; 95% CI, −2.4, 1.2), weekly training units (−0.4; 95% CI, −0.9, 0.1), duration of training unit (2.9 min; 95% CI, −4.2, 10.1), weekly duration of training (−22.8 min; 95% CI, −88.6, 42.9), age (−0.6 years; 95% CI, −1.8, 0.6), height (−1.2 cm; 95% CI, −3.0, 0.6) and body mass (1.0 kg; 95% CI, −1.5, 3.5), but higher BMI (0.6 kg.m–2; 95% CI, 0, 1.2) and BF (1.2%; 95% CI, 0.2, 2.2) (Table 2). With regards to anaerobic characteristics, no difference was observed in Pmax (−3W; 95% CI, −73, 66), rPmax (−0.17 W.kg–1; 95% CI, −1.01, 0.67), v0 (−1.7 rpm; 95% CI, −7.6, 4.3), F0 (0.01 kg; 95% CI, −1.55, 1.56), Ppeak (3.4 W; 95% CI, −28.8, 35.5), rPpeak (−0.09 W.kg–1; 95% CI, −0.36, 0.17), Pmean (−14.7 W; 95% CI, −37.8, 8.3) and FI (2.36%; 95% CI, −0.4, 4.75), whereas EXP had lower rPmean than CON (−0.34 W.kg–1; 95% CI, −0.61, −0.07).
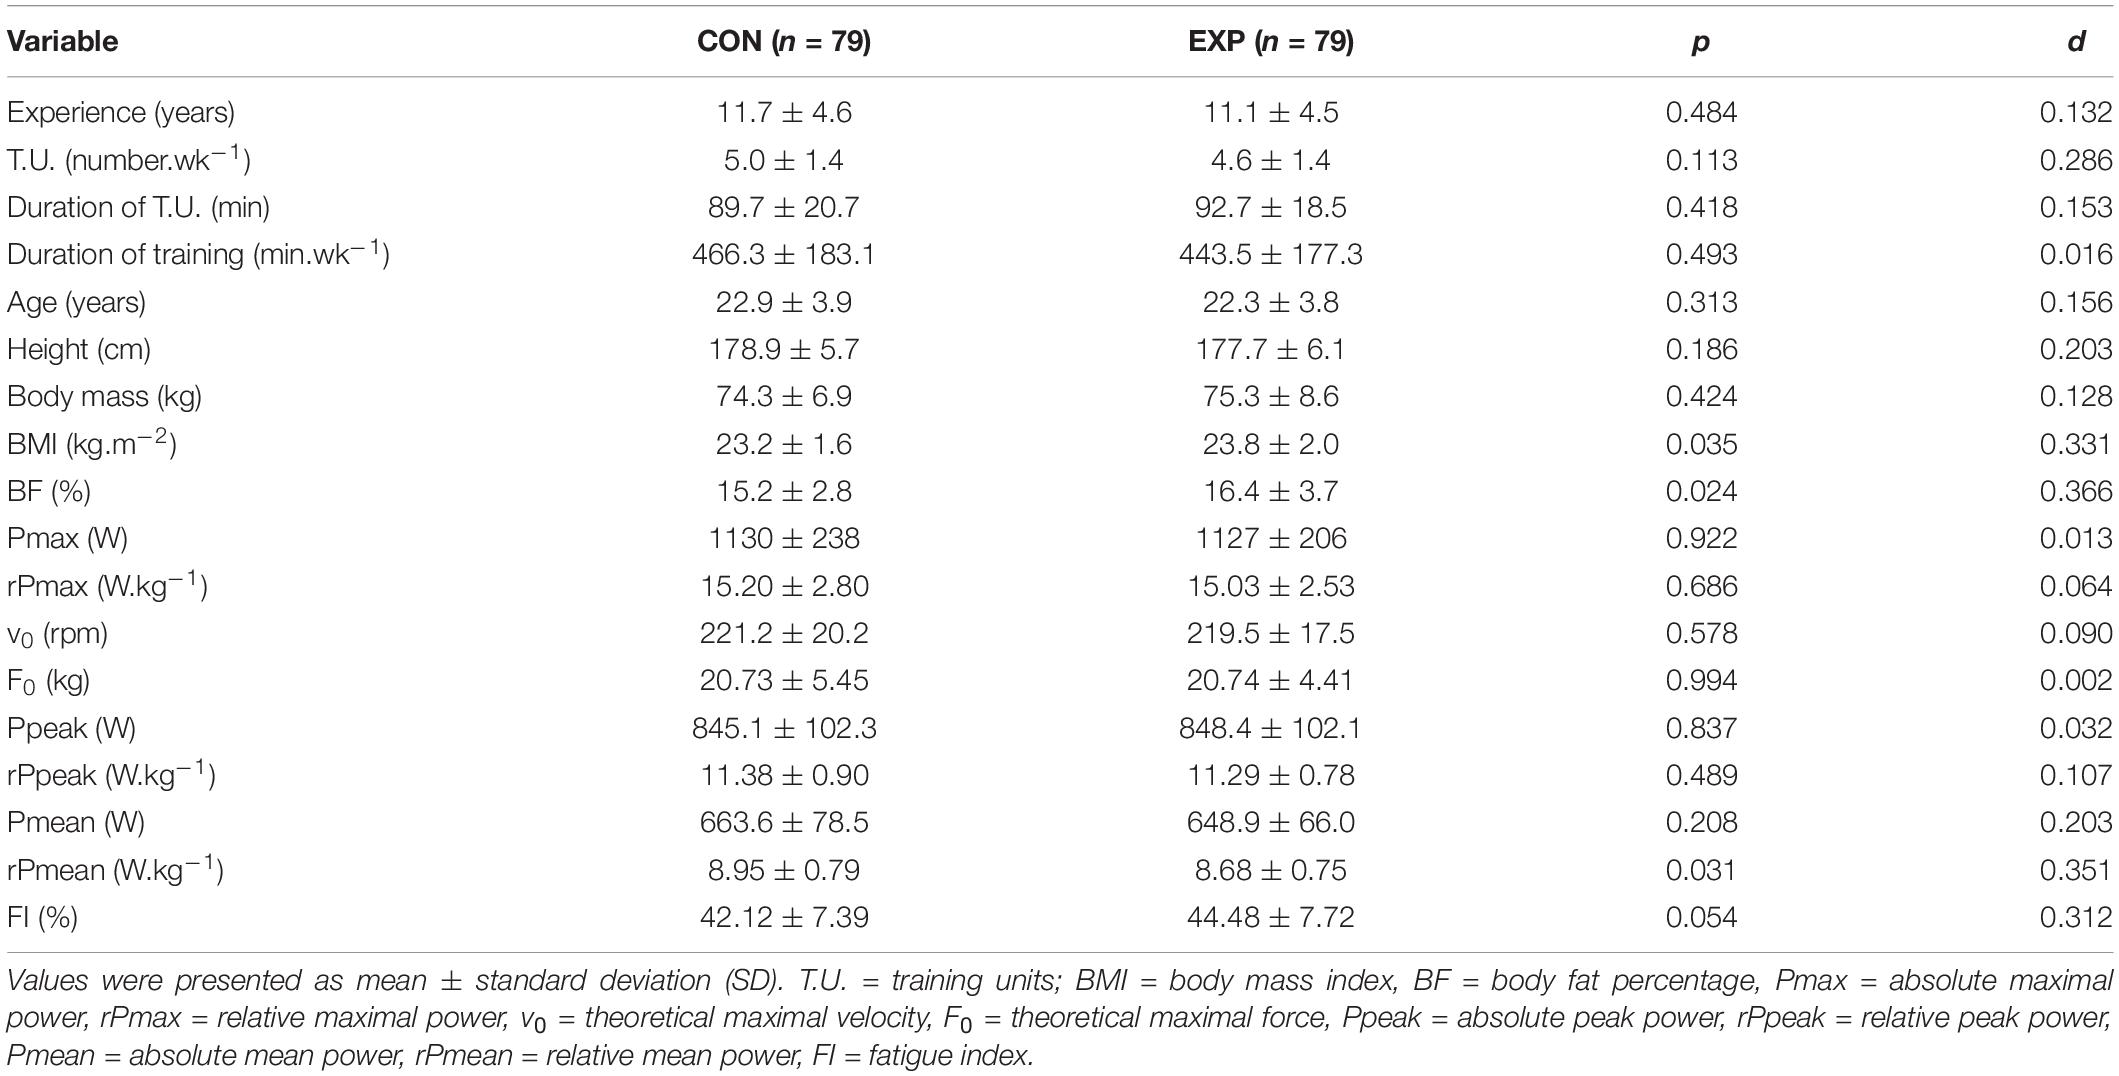
Table 2. Training, anthropometric, and anaerobic characteristics in the experimental and control group.
Ppeak in EXP could be predicted from Pmax, body mass and F0, and rPpeak from rPmax and v0 using the formulas presented in Table 3. Applying these formulas in CON, no bias was observed between actual and predicted Ppeak in W (mean difference 2.5 ± 49.8 W; 95% CI, −8.7, 13.6; p = 0.661) and W.kg–1 (mean difference 0.05 ± 0.71 W.kg–1; 95% CI, −0.11, 0.21, p = 0.525) (Figure 2).
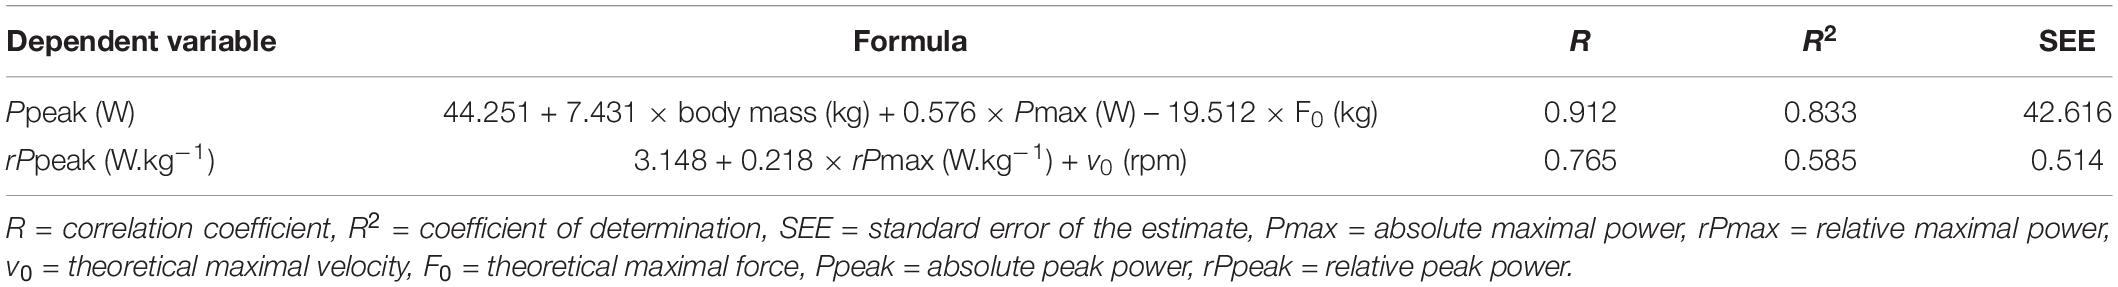
Table 3. Summary of regression analysis in the experimental group (n = 79).
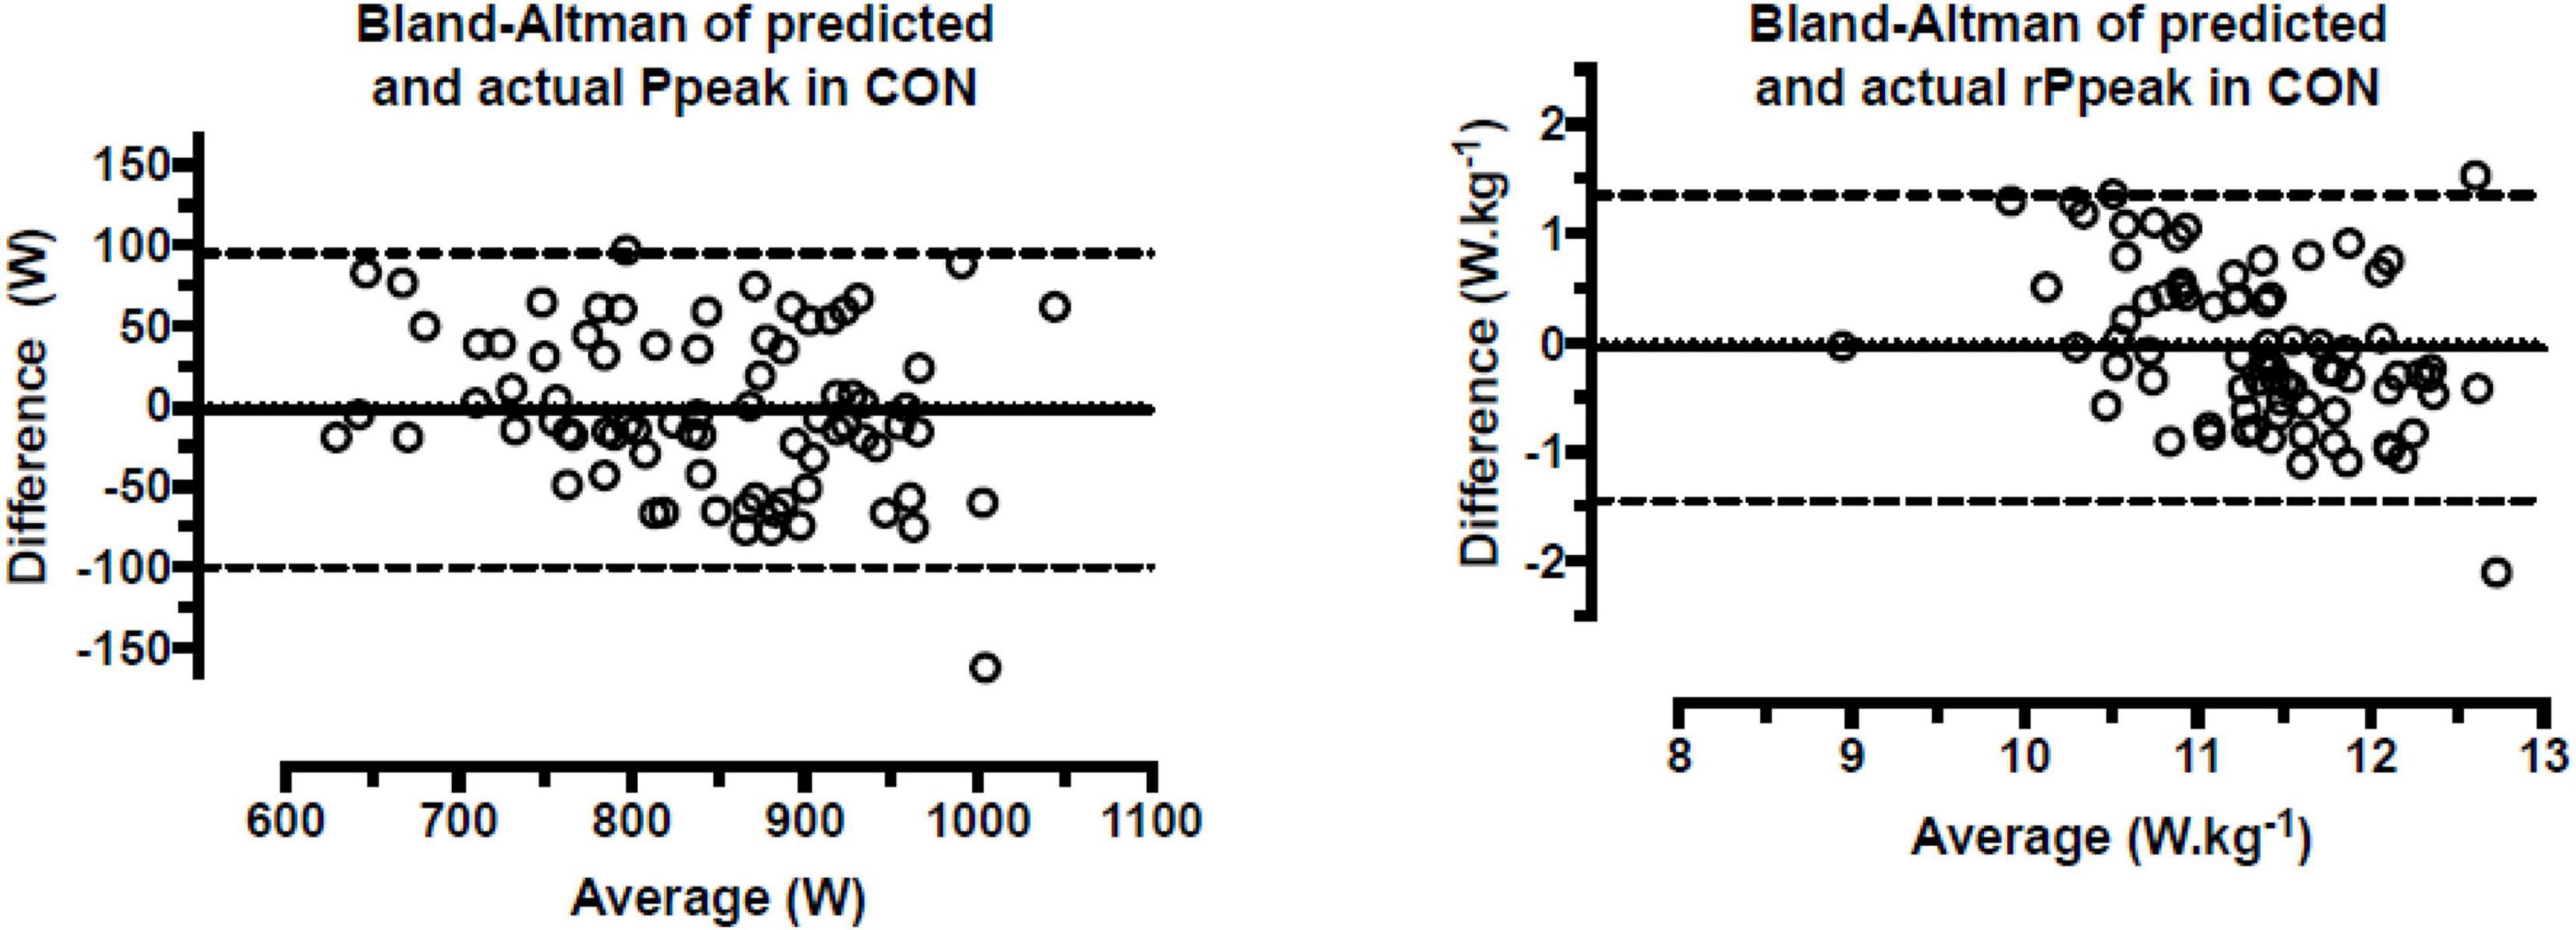
Figure 2. Bland–Altman plots of predicted and actual peak power of the control group in the Wingate anaerobic test. Ppeak = absolute peak power; rPpeak = relative peak power; CON = control group; Difference = predicted – actual; Average = (predicted + actual)/2; dashed lines represent 95% confidence intervals of bias.
The main findings of the present study were that (a) Ppeak and rPpeak correlated with Pmax and rPmax, respectively, (b) the best correlates of Ppeak and rPpeak were body mass and v0, respectively, (c) Ppeak could be predicted from Pmax, body mass and F0, (d) rPpeak could be predicted from rPmax and v0, and (e) no bias was observed between actual and predicted Ppeak and rPpeak.
The large correlation between Ppeak and Pmax, and rPpeak and rPmax highlighted the possibility to use WAnT and F-v test interchangeably considering the short-term duration and need for maximal effort of both tests (Driss and Vandewalle, 2013). In addition, the larger values of Pmax and rPmax than Ppeak and rPpeak were in agreement with previous studies using both the tests (Jemni et al., 2006; Souissi et al., 2008; Ingle and Tolfrey, 2013). An explanation of this difference might be that the highest power output in the F-v test was estimated, whereas it was measured in the WAnT at a given braking force (which was set considering each participant’s body mass).
Comparing the predictors of Ppeak and rPpeak, it was observed that different anthropometric and F-v characteristics played a predicting role in each case. The best predictor of Ppeak was body mass highlighting the relationship of muscle power with human size (Bahenský et al., 2020; Taketomi et al., 2021). Previously, it was shown that rPpeak was related with 5 m, 30 m sprint times, maximal voluntary isometric contraction of the knee extensors, half squat repetition maximal and countermovement jump height in soccer players (Boraczyński et al., 2020), performance of short and maximal effort that might be evaluated by the F-v test. Comparing the prediction models of Ppeak and rPeak, it was observed that the coefficient of determination was higher for the absolute than for the relatively score of peak power. Peak power related very largely with body mass, and consequently, since body mass was partitioned out in rPpeak, a weaker model was shown for the relative score of peak power.
A limitation of this study was that the findings referred to specific performances in the selected anaerobic tests. Since the bias was larger in low and high anaerobic performances, caution would be needed to generalize the developed prediction equations to other populations. However, there was large interindividual variability in the agreement between the actual and the predicted scores; thus, the use of the developed equations to predict Ppeak and rPpeak should be avoided when precision at an individual level would be needed in soccer players with small interindividual variation. On the other hand, the developed equations provided a practical tool to coaches and trainers to predict the average Ppeak and rPpeak of a group of athletes from their F-v test. Accordingly, the F-v test might be considered as a diagnostic tool of team instead of individual WAnT performance. Future studies should examine the interchangeability of these tests in soccer players differing for sex, age, and performance level.
The findings of this work provided indirect estimates of the average Ppeak and rPpeak of the WAnT for a group of players that would be useful especially in periods when this test should not be applied considering the fatigue it causes. In this context, the F-v test can be considered as an alternative of exercise testing for the average Ppeak and rPpeak of a group of soccer players rather than for predicting individual scores when the interindividual variation of performance is small.
The raw data supporting the conclusions of this article will be made available by the authors, without undue reservation.
The studies involving human participants were reviewed and approved by the Institutional Review Board of EPL. The study was conducted according to the guidelines of the Declaration of Helsinki. The patients/participants provided their written informed consent to participate in this study.
PN collected all data, performed the analyses, and drafted the manuscript. BK helped in drafting the manuscript. Both authors contributed to the article and approved the submitted version.
The authors declare that the research was conducted in the absence of any commercial or financial relationships that could be construed as a potential conflict of interest.
All claims expressed in this article are solely those of the authors and do not necessarily represent those of their affiliated organizations, or those of the publisher, the editors and the reviewers. Any product that may be evaluated in this article, or claim that may be made by its manufacturer, is not guaranteed or endorsed by the publisher.
Almansba, R., Boucher, V. G., Parent, A. A., and Comtois, A. S. (2019). Repeated linear and quadrangular sprint as a function of anaerobic power. J. Strength Cond. Res. 33, 2177–2184. doi: 10.1519/jsc.0000000000002358
Aloui, G., Hermassi, S., Hammami, M., Cherni, Y., Gaamouri, N., Shephard, R. J., et al. (2020). Effects of elastic band based plyometric exercise on explosive muscular performance and change of direction abilities of male team handball players. Front. Physiol. 11:604983. doi: 10.3389/fphys.2020.604983
Bahenský, P., Marko, D., Bunc, V., and Tlustý, P. (2020). Power, muscle, and take-off asymmetry in young soccer players. Int. J. Environ. Res. Public Health 17:6040. doi: 10.3390/ijerph17176040
Ben Ayed, K., Latiri, I., Dore, E., and Tabka, Z. (2011). Leg muscle power in 12-year-old black and white Tunisian football players. Res. Sports Med. 19, 103–117. doi: 10.1080/15438627.2011.556527
Blonc, S., Casas, H., Duché, P., Beaune, B., and Bedu, M. (1998). Effect of recovery duration on the force-velocity relationship. Int. J. Sports Med. 19, 272–276. doi: 10.1055/s-2007-971917
Boraczyński, M., Boraczyński, T., Podstawski, R., Wójcik, Z., and Gronek, P. (2020). Relationships between measures of functional and isometric lower body strength, aerobic capacity, anaerobic power, sprint and countermovement jump performance in professional soccer players. J. Hum. Kinet. 75, 161–175. doi: 10.2478/hukin-2020-0045
Bouhlel, E., Chelly, M. S., Gmada, N., Tabka, Z., and Shephard, R. (2010). Effect of a prior force-velocity test performed with legs on subsequent peak power output measured with arms or vice versa. J. Strength Cond. Res. 24, 992–998. doi: 10.1519/JSC.0b013e3181cb2499
Chtourou, H., Trabelsi, K., Boukhris, O., Ammar, A., Shephard, R. J., and Bragazzi, N. L. (2019). Effects of Ramadan fasting on physical performances in soccer players: a systematic review. Tunis. Med 97, 1114–1131.
Dotan, R., and Bar-Or, O. (1980). Climatic heat stress and performance in the Wingate Anaerobic Test. Eur. J. Appl. Physiol. Occup. Physiol. 44, 237–243. doi: 10.1007/bf00421623
Driss, T., and Vandewalle, H. (2013). The measurement of maximal (anaerobic) power output on a cycle ergometer: a critical review. Biomed. Res. Int. 2013:589361. doi: 10.1155/2013/589361
Eston, R., and Reilly, T. (2009). Kinanthropometry and Exercise Physiology Laboratory Manual. Tests, Procedures and Data: Volume 1: Anthropometry, 3 Edn. London: Routledge.
Freitas, T. T., Pereira, L. A., Reis, V. P., Fernandes, V., Alcaraz, P. E., Azevedo, P., et al. (2021). Effects of a congested fixture period on speed and power performance of elite young soccer players. Int. J. Sports Physiol. Perform. Online ahead of print, doi: 10.1123/ijspp.2020-0280
Hammami, M., Gaamouri, N., Shephard, R. J., and Chelly, M. S. (2019). Effects of contrast strength vs. plyometric training on lower-limb explosive performance, ability to change direction and neuromuscular adaptation in soccer players. J. Strength Cond. Res. 33, 2094–2103. doi: 10.1519/jsc.0000000000002425
Ingle, L., and Tolfrey, K. (2013). The variability of high intensity exercise tests in -pre-pubertal boys. Int. J. Sports Med. 34, 1063–1069. doi: 10.1055/s-0032-1327714
Jaafar, H. (2017). Allometric scaling of power-force-velocity ergometry profiles in men. Ann. Hum. Biol. 44, 648–651. doi: 10.1080/03014460.2017.1355012
Jemni, M., Sands, W. A., Friemel, F., Stone, M. H., and Cooke, C. B. (2006). Any effect of gymnastics training on upper-body and lower-body aerobic and power components in national and international male gymnasts? J. Strength Cond. Res. 20, 899–907. doi: 10.1519/r-18525.1
Joo, C. H., and Seo, D. I. (2016). Analysis of physical fitness and technical skills of youth soccer players according to playing position. J. Exerc. Rehabil. 12, 548–552. doi: 10.12965/jer.1632730.365
Keir, D. A., Thériault, F., and Serresse, O. (2013). Evaluation of the running-based anaerobic sprint test as a measure of repeated sprint ability in collegiate-level soccer players. J. Strength Cond. Res. 27, 1671–1678. doi: 10.1519/JSC.0b013e31827367ba
Lepschy, H., Woll, A., and Wäsche, H. (2021). Success factors in the FIFA 2018 World Cup in Russia and FIFA 2014 World Cup in Brazil. Front. Psychol. 12:638690. doi: 10.3389/fpsyg.2021.638690
Longo, U. G., Sofi, F., Candela, V., Risi Ambrogioni, L., Pagliai, G., Massaroni, C., et al. (2021). The influence of athletic performance on the highest positions of the final ranking during 2017/2018 Serie A season. BMC Sports Sci. Med. Rehabil. 13:32. doi: 10.1186/s13102-021-00259-3
Miller, J. M. (2020). Acute effects of static stretching on Wingate testing in men. J. Sports Med. Phys. Fitness 60, 974–978. doi: 10.23736/s0022-4707.20.10349-9
Nikolaidis, P. T., Ruano, M. A., de Oliveira, N. C., Portes, L. A., Freiwald, J., Leprêtre, P. M., et al. (2016). Who runs the fastest? Anthropometric and physiological correlates of 20 m sprint performance in male soccer players. Res. Sports Med. 24, 341–351. doi: 10.1080/15438627.2016.1222281
Sanchez, A. M., Collomp, K., Carra, J., Borrani, F., Coste, O., Préfaut, C., et al. (2012). Effect of acute and short-term oral salbutamol treatments on maximal power output in non-asthmatic athletes. Eur. J. Appl. Physiol. 112, 3251–3258. doi: 10.1007/s00421-011-2307-3
Souissi, N., Souissi, M., Souissi, H., Chamari, K., Tabka, Z., Dogui, M., et al. (2008). Effect of time of day and partial sleep deprivation on short-term, high-power output. Chronobiol. Int. 25, 1062–1076. doi: 10.1080/07420520802551568
Taketomi, S., Kawaguchi, K., Mizutani, Y., Yamagami, R., Sameshima, S., Takei, S., et al. (2021). Anthropometric and musculoskeletal gender differences in young soccer players. J. Sports Med. Phys. Fitness 61, 1212–1218. doi: 10.23736/s0022-4707.21.11617-2
Thom, G., Kavaliauskas, M., and Babraj, J. (2020). Changes in lactate kinetics underpin soccer performance adaptations to cycling-based sprint interval training. Eur. J. Sport Sci. 20, 486–494. doi: 10.1080/17461391.2019.1635650
Keywords: all-out test, anaerobic power, cycle ergometer, football, muscle strength, performance, speed
Citation: Nikolaidis PT and Knechtle B (2021) Development and Validation of Prediction Formula of Wingate Test Peak Power From Force–Velocity Test in Male Soccer Players. Front. Psychol. 12:729247. doi: 10.3389/fpsyg.2021.729247
Received: 22 June 2021; Accepted: 01 November 2021;
Published: 29 November 2021.
Edited by:
Miguel-Angel Gomez-Ruano, Polytechnic University of Madrid, SpainReviewed by:
Souhail Hermassi, Qatar University, QatarCopyright © 2021 Nikolaidis and Knechtle. This is an open-access article distributed under the terms of the Creative Commons Attribution License (CC BY). The use, distribution or reproduction in other forums is permitted, provided the original author(s) and the copyright owner(s) are credited and that the original publication in this journal is cited, in accordance with accepted academic practice. No use, distribution or reproduction is permitted which does not comply with these terms.
*Correspondence: Beat Knechtle, YmVhdC5rbmVjaHRsZUBoaXNwZWVkLmNo
Disclaimer: All claims expressed in this article are solely those of the authors and do not necessarily represent those of their affiliated organizations, or those of the publisher, the editors and the reviewers. Any product that may be evaluated in this article or claim that may be made by its manufacturer is not guaranteed or endorsed by the publisher.
Research integrity at Frontiers
Learn more about the work of our research integrity team to safeguard the quality of each article we publish.