
95% of researchers rate our articles as excellent or good
Learn more about the work of our research integrity team to safeguard the quality of each article we publish.
Find out more
ORIGINAL RESEARCH article
Front. Psychiatry , 07 January 2025
Sec. Digital Mental Health
Volume 15 - 2024 | https://doi.org/10.3389/fpsyt.2024.1504190
 Jin-Hyun Park1†
 Yu-Bin Shin2†
 Dooyoung Jung3
 Ji-Won Hur4
 Seung Pil Pack5
 Heon-Jeong Lee2
 Hwamin Lee1*
 Chul-Hyun Cho1,2*
Introduction: Machine learning (ML) is an effective tool for predicting mental states and is a key technology in digital psychiatry. This study aimed to develop ML algorithms to predict the upper tertile group of various anxiety symptoms based on multimodal data from virtual reality (VR) therapy sessions for social anxiety disorder (SAD) patients and to evaluate their predictive performance across each data type.
Methods: This study included 32 SAD-diagnosed individuals, and finalized a dataset of 132 samples from 25 participants. It utilized multimodal (physiological and acoustic) data from VR sessions to simulate social anxiety scenarios. This study employed extended Geneva minimalistic acoustic parameter set for acoustic feature extraction and extracted statistical attributes from time series-based physiological responses. We developed ML models that predict the upper tertile group for various anxiety symptoms in SAD using Random Forest, extreme gradient boosting (XGBoost), light gradient boosting machine (LightGBM), and categorical boosting (CatBoost) models. The best parameters were explored through grid search or random search, and the models were validated using stratified cross-validation and leave-one-out cross-validation.
Results: The CatBoost, using multimodal features, exhibited high performance, particularly for the Social Phobia Scale with an area under the receiver operating characteristics curve (AUROC) of 0.852. It also showed strong performance in predicting cognitive symptoms, with the highest AUROC of 0.866 for the Post-Event Rumination Scale. For generalized anxiety, the LightGBM’s prediction for the State-Trait Anxiety Inventory-trait led to an AUROC of 0.819. In the same analysis, models using only physiological features had AUROCs of 0.626, 0.744, and 0.671, whereas models using only acoustic features had AUROCs of 0.788, 0.823, and 0.754.
Conclusions: This study showed that a ML algorithm using integrated multimodal data can predict upper tertile anxiety symptoms in patients with SAD with higher performance than acoustic or physiological data obtained during a VR session. The results of this study can be used as evidence for personalized VR sessions and to demonstrate the strength of the clinical use of multimodal data.
Social anxiety disorder (SAD) is characterized by an excessive fear of negative evaluation or distorted cognitive perception triggered by social or performance situations (1). SAD is one of the most common mental disorders in the general population, with an estimated lifetime prevalence of up to 12% in the US (2). Therefore, considerable effort has been devoted to the development of therapeutic approaches for SAD. Currently, the combination of cognitive behavioral therapy (CBT) and antidepressant medication with carefully planned procedures is considered the gold standard treatment for SAD (3, 4). However, with advances in science and technology, virtual reality (VR) has accelerated a paradigm shift in psychiatric treatment (5). In particular, given the nature of VR technology, which makes it possible to mimic real-life social interactions within a therapeutic context, CBT with virtual exposure to feared stimuli has been assumed to be a promising alternative to current practice in managing patients with SAD (6, 7).
From the current perspective, early, accurate, and objective assessment of mental states, as well as prompt therapeutic management, is regarded as the most effective way to improve disease prognosis (8). Concurrently, machine learning (ML) technology is used to develop prediction, classification, and therapeutic solutions for mental states, making precision medicine a reality (9, 10). Therefore, ML technology has been incorporated into VR exposure therapy (VRET) to treat SAD (11, 12). In support of this, considerable effort has been devoted to developing an ML-based prediction of individuals’ mental states in real time for exposure therapy in virtuo using central and peripheral biosignals (13–15). Specifically, biofeedback framework, defined as the process of teaching patients to intentionally regulate their physiological response for improving mental states (e.g., decreased stress or anxiety) through VR-embedded visual feedback (e.g., growing tree branches or gently moving particles), has been combined with VRET and ML technology (16). However, given the capability of ML to process multimodal datasets, there is still room for improvement to provide more robust interventions for patients with SAD (17–20). From a neuroscientific perspective, a multi-modality approach, which involve fusing and analyzing different types of data, including medical images (e.g., magnetic resonance images (MRI) and structural MRI (sMRI)), physiological signals (e.g., electrocardiogram, electromyogram, and electroencephalogram), acoustic features, and speech transcript, provides a fuller understanding of mental conditions (21). For example, multimodal feature sets via a combination of different biomarkers, such as sMRI, fluorodeoxyglucose positron emission tomography (FDG-PET), cerebrospinal fluid performed up to 6.7% better than unimodal features in classifying patients with Alzheimer’s disease from healthy controls (22). Similarly, recent study demonstrated the potential of ML-enabled detection of neurotypical and attention-deficit/hyperactivity disorder populations by incorporating multimodal physiological data, including electrodermal activity, heart rate variability, and skin temperature (23). Therefore, in this study, the predictive performance of ML models utilizing multimodal data from VRET sessions was evaluated based on their medical applicability in personalized therapy.
When implementing CBT for SAD, it is important to recognize that SAD is characterized by various symptoms, including heightened social anxiety/fear, distorted self-referential attention/rumination, and maladaptive beliefs (fear of negative evaluation, humiliation, and embarrassment) (24–26). Empirical research has indicated heterogeneity in treatment responses among patients with anxiety disorders over therapy sessions (27–29). For example, patients may show early or delayed recovery and a steady or moderate decline in symptoms (30, 31). Moreover, patients may exhibit attenuated or steep slopes in their symptom trajectory (32). Furthermore, symptom variability has been observed in patients with SAD (33). Therefore, examining a broad array of symptoms throughout CBT is crucial for identifying whether the treatment works and how much progress has been made. Thus, in this study, a comprehensive assessment battery was administered to participants, and their SAD symptom responses during VRET were predicted using an ML approach to provide information on the trajectory of session-to-session changes in the symptom facets. Such an approach could help deliver tailored interventions for heterogeneous patients, identify those who may be at risk of not responding, and contribute to therapists’ evidence-based clinical decision making.
This study aimed to build predictive models of upper tertile symptoms related to SAD using machine learning algorithms by utilizing acoustic and physiological features, as well as combined multimodal data from VRET sessions, and to evaluate the effectiveness of these predictive models.
A total of 32 young adults were recruited through internet advertisements. Participants with SAD were eligible if they met the Diagnostic and Statistical Manual of Mental Disorders, Fifth Edition criteria for SAD, which was assessed using the Mini-International Neuropsychiatric Interview (34), and if they had a score ≥ 82 on the Korean version of the Social Avoidance and Distress Scale (35). The exclusion criteria for all participants were (1) having a lifetime or current mental illness or neurological disorder that might elicit severe side effects from a VR experience [e.g., schizophrenia spectrum disorder, bipolar disorder, posttraumatic stress disorder, panic disorder, substance use disorders, autism spectrum disorder [ASD], epilepsy, traumatic brain injury, and suicide attempts) (2); having an intellectual disability (IQ < 70; estimated using the short version of the Korean Wechsler Adult Intelligence Test Fourth Edition (36)]; and (3) receiving psychotropic medication or psychotherapy at the time of research enrollment.
Of the initial 32 participants, data from 7 individuals were omitted from the analysis because of sensor malfunctions. Thus, physiological and acoustic data were derived from 4 sessions of 25 individuals, resulting in 100 samples. In addition, participants were allowed to repeat VR exposure scenarios at their request for extra training, resulting in 89 additional samples. After removing 57 samples, which were considered outliers due to errors in audio recordings, samples where no speech was made, and instances where time-series data contained values like -1 exceeding 30%, we finally obtained 132 samples. Consequently, the final dataset for the ML analysis consisted of 132 samples, expanded by incorporating additional data obtained from extra sessions, which comprised both multimodal data and clinical and psychological scale values collected from 25 participants. All procedures in this study were performed in accordance with the guidelines of Declaration of Helsinki regarding the ethical principles for medical research involving human participants. This study was approved by the Institutional Review Board of the Korea University Anam Hospital (IRB no. 2018AN0377). All participants provided written informed consent.
The VR intervention was designed to immerse participants in scenarios that simulated social anxiety within contexts pertinent to SAD therapy, aiming to facilitate the confrontation and mitigation of their fear. The intervention consisted of six VR sessions, each structured into three phases: introductory, main, and concluding. These sessions were categorized into three difficulty tiers (easy, medium, and hard), based on the challenges presented during the main phase. The initial phase acquainted participants with the virtual setting and employed meditation-based relaxation exercises. The main phase was initiated by introducing seven to eight virtual characters, simulating an interaction scenario akin to the first day of college class. Participants began their self-introduction by activating the recording function using an icon on the head-mounted display (HMD). During this phase, they could adjust the session’s difficulty by choosing between easy, medium, or hard levels, which influenced the responses of the virtual characters. The concluding phase mirrored the introductory phase, offering a meditation-based VR experience to soothe participants’ minds. Initially, all participants engaged at an easy level. Starting from the second session, they were given the autonomy to select their preferred difficulty level, allowing for adjustment of the challenge to suit their individual preferences, thereby ensuring a personalized therapeutic experience. Additional details concerning the intervention can be found in a study by Kim et al. (37). The sample of the VR sessions used in this intervention can be found at Youtube1.
During the main phase of each VR session, participants were subjected to in situ measurements of video recordings and autonomic physiological data. Note that analyses include data gathered only from the main phase in which social interaction between the user and virtual avatars took place. Figure 1 provides a comprehensive description of the data-collection methodology. Heart rate (HR) and galvanic skin response (GSR) were measured to assess physiological responses during speech because of their close relationship with anxiety (38–40). Using a Shimmer3 GSR+ with three channels, we measured the skin conductance on the index and middle fingers of the non-dominant hand at 52 Hz and cardiac volume using an earlobe infrared sensor, converting this to HR data. During the VR sessions, the participants’ voices were captured with an HTC Vive HMD microphone for vocal analysis, enhancing the depth of the study.
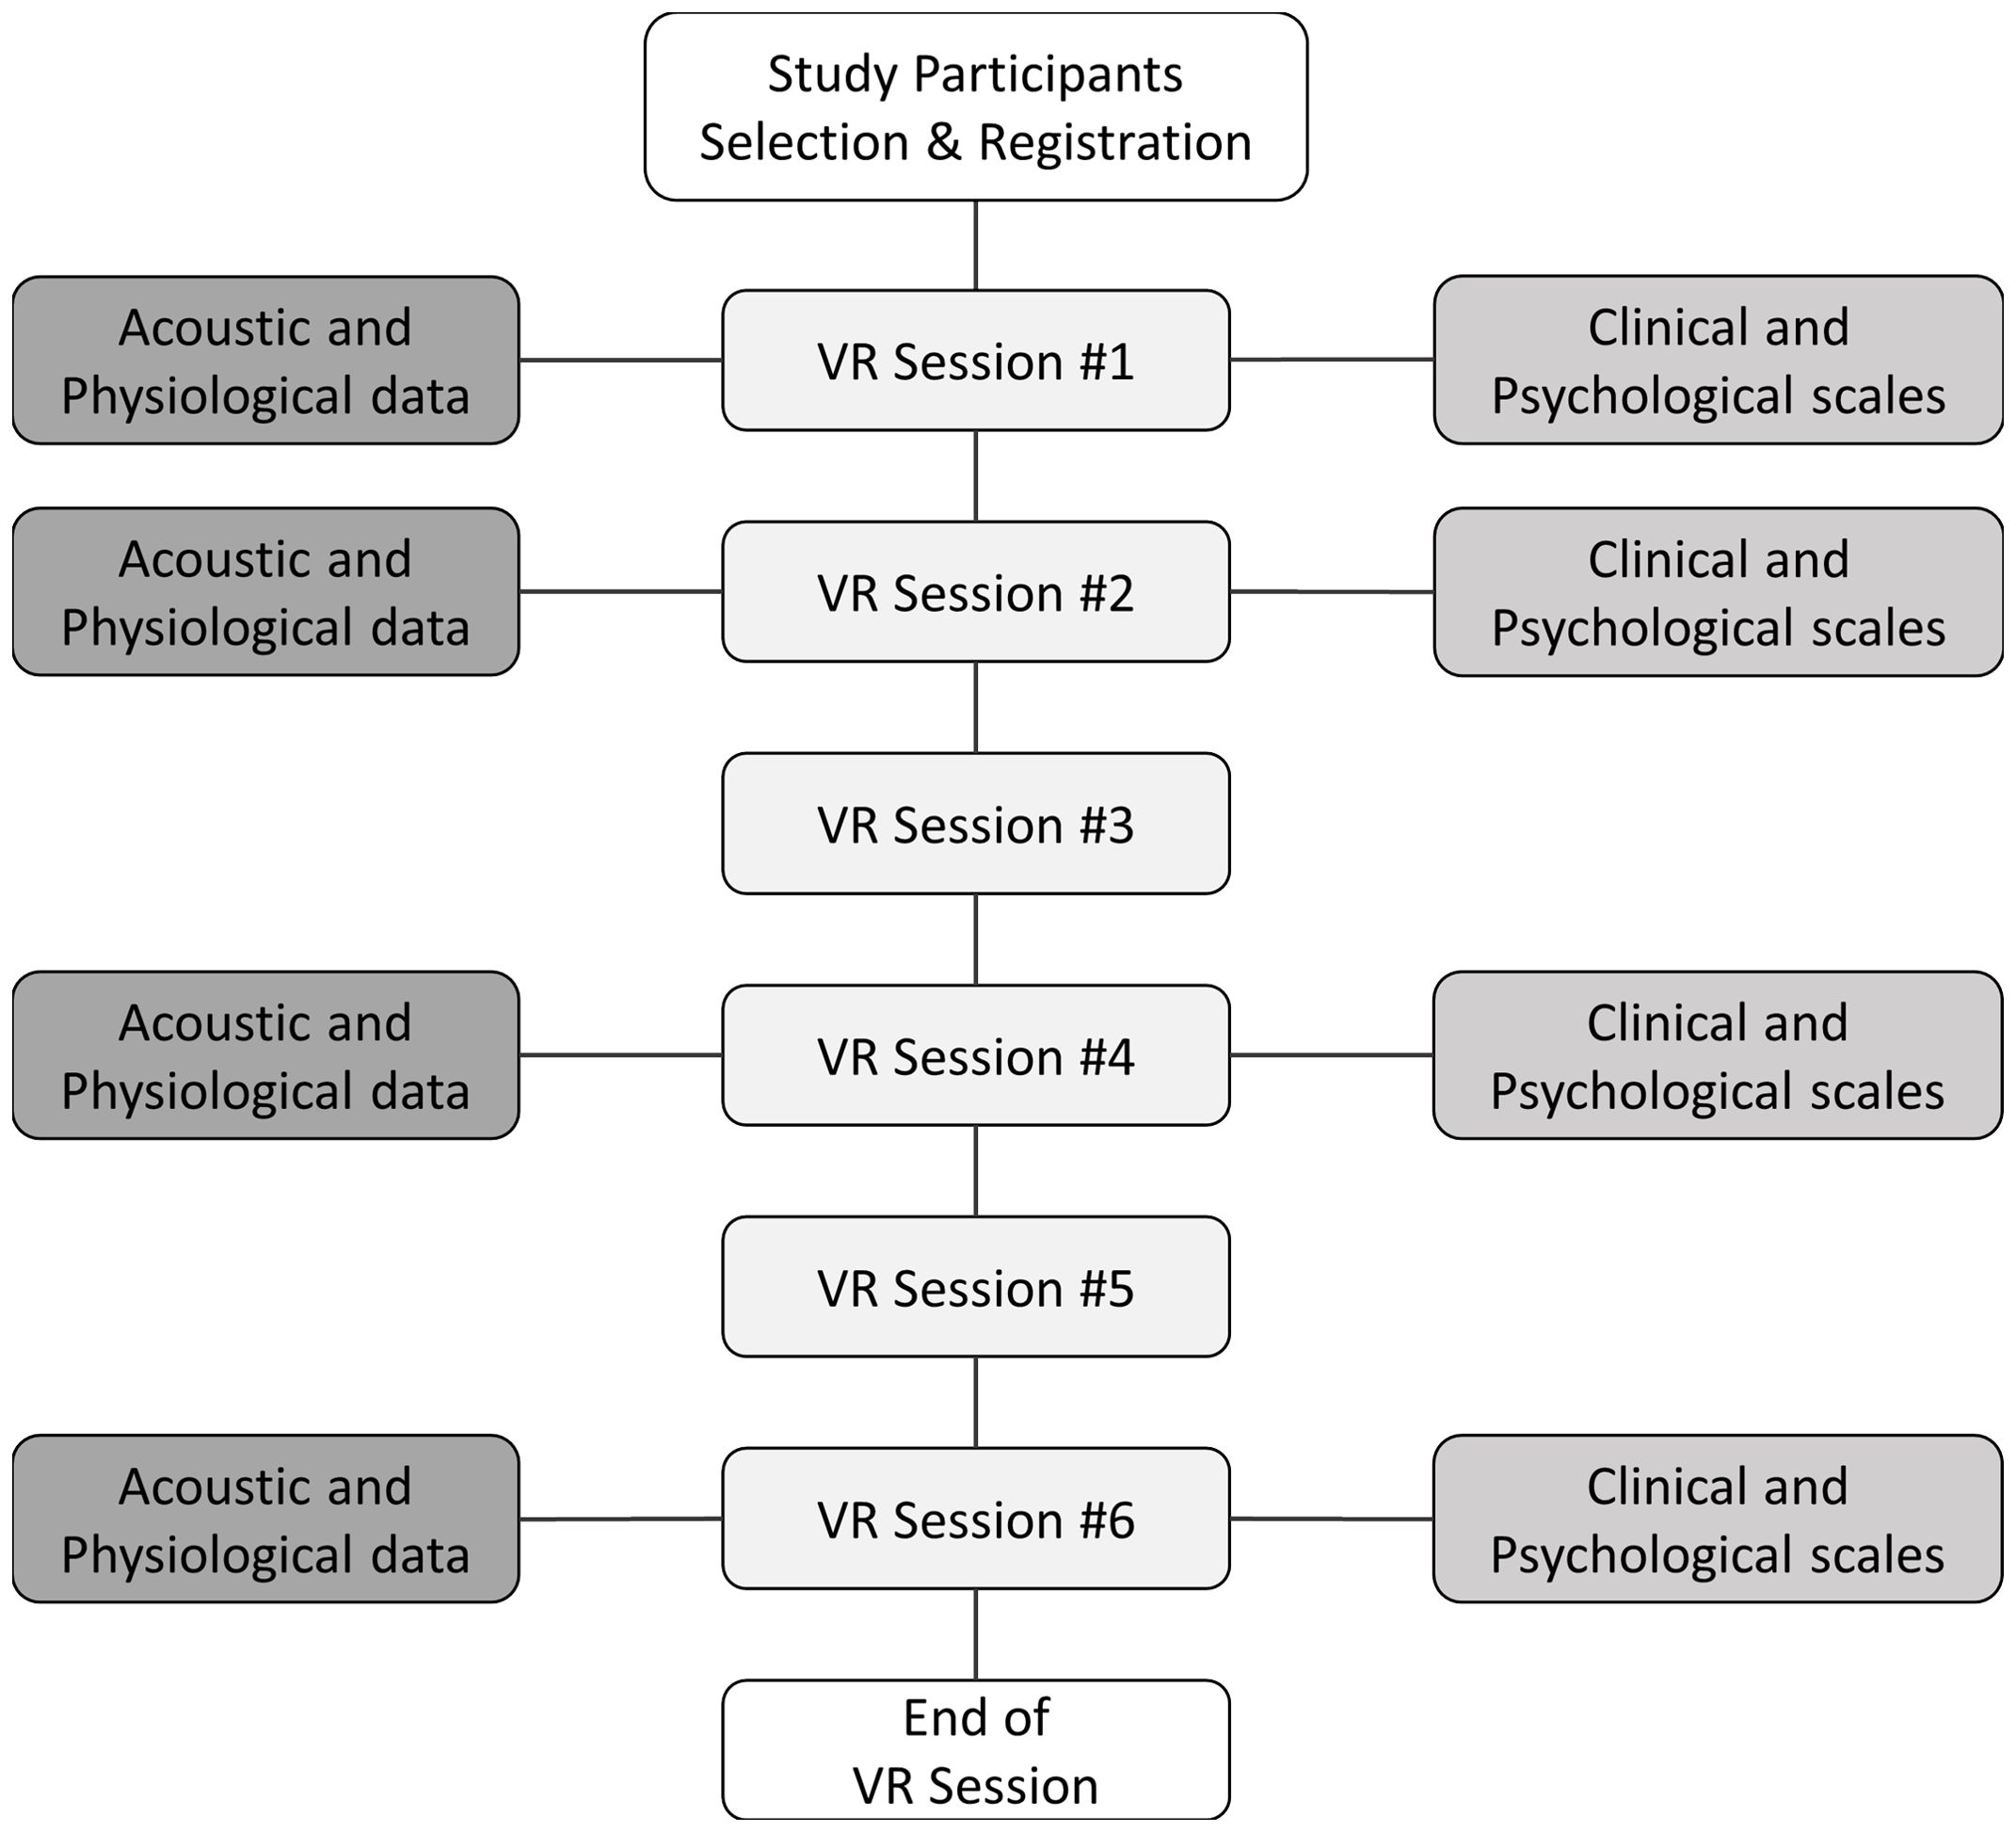
Figure 1. Overview of data collection during VR sessions. VR, virtual reality. This figure shows the overall process of data extraction.
A comprehensive assessment battery was used to measure the symptom characteristics at the first, second, fourth, and sixth VR sessions. For core symptoms of SAD, we used the Korean versions of the Social Phobia Scale (K-SPS) (41, 42), Liebowitz Social Anxiety Scale (K-LSAS) (43, 44), Social Avoidance and Distress Scale (K-SADS) (35, 45), and Social Interaction Anxiety Scale (K-SIAS) (42, 46). Cognitive symptoms of SAD were assessed using the Post-Event Rumination Scale (PERS) (47, 48), Brief Fear of Negative Evaluation (BFNE) (35, 45) scale, and Internalized Shame Scale (ISS) (49, 50). Regarding generalized anxiety symptoms, the State-Trait Anxiety Inventory (STAI) (51, 52) and Beck Anxiety Inventory (BAI) (53, 54) were evaluated. A detailed description of each assessment is provided in Table 1, and we utilized the total scores from each clinical and psychological scale.
Scores from the 132 samples were divided into tertiles for each clinical and psychological scale (K-SPS, K-LSAS, K-SADS, K-SIAS, PERS, BFNE, ISS, STAI-State, STAI-Trait, and BAI), resulting in three classification groups per scale. Then, the top tertile for each scale was grouped into a “severe group,” and the remaining samples formed a “non-severe group,” using the severe group labels as the ground truth for machine learning prediction.
Video recordings of VR sessions were converted to waveform audio file format (WAV) format for analysis. Following the removal of samples with errors in audio recordings, samples where no speech was made, and samples containing outliers in physiological data, we obtained a total of 132 WAV files for machine learning training. From each of these files, we extracted a total of 88 acoustic features included in the extended Geneva Minimalistic Acoustic Parameter Set (eGeMAPS) (55). Supplementary Table S1 details the acoustic features analyzed using eGeMAPS. The features were broadly categorized into frequency-related metrics, energy dynamics, spectral properties, and temporal patterns, and all 88 features were extracted using the openSMILE toolkit (56).
The collected HR and GSR time series data were aligned with the length of the voice recordings. Samples with excessive negative readings were removed, considered outliers such as instances where the proportion of -1 values exceeded 30%. Among the 132 usable samples, missing values in HR and GSR were imputed using forward and backward imputation techniques (57). Further data cleansing was achieved by applying the interquartile range (IQR) technique (58), which was chosen to manage the variability in HR and GSR data. The IQR method is effective for reducing noise caused by external factors such as sensor misplacement, environmental changes, and user movements, which can lead to abrupt fluctuations. By removing these noise-induced outliers, the IQR technique helps to clarify the essential patterns in the data while maintaining the central tendency, thereby enhancing the reliability of subsequent model training. Following the establishment of a cleaned dataset, a comprehensive suite of 12 statistical features was extracted from both the HR and GSR signals. These features, including the mean, standard deviation, minimum, maximum, mean difference, and maximum difference were calculated to capture the dynamic nature of physiological responses. A detailed description of these features is presented in Supplementary Table S2.
In this study, we employed machine learning models including Random Forest (59), eXtreme Gradient Boosting (XGBoost) (60), Light Gradient Boosting Machine (LightGBM) (61), and CatBoost (62) to compare the performance in predicting the severe group for each clinical and psychological scale. These models were implemented in Python version 3.11.5, utilizing the Scikit-learn library version 1.4.0 for classification tasks.
We evaluated the classification models using the stratified k-fold cross-validation with five splits to enhance the model robustness and reduce bias by preserving the proportion of classes across each fold. We employed both grid search and random search methodologies to optimize hyperparameters for the Random Forest, XGBoost, LightGBM, and CatBoost classifiers. This approach ensured alignment with the unique characteristics of our dataset and enhanced predictive accuracy. The range of hyperparameters tuning explored was presented in Supplementary Table S3; we extracted the best parameters based on the criterion of maximizing the area under the receiver operating characteristic curve (AUROC). To address the limitation posed by the small data size, we further validated the performance using the leave-one-out cross-validation (LOOCV) with the best parameter models derived from both search methods.
To obtain different perspectives on how well the ML models classified the severe group of each clinical and psychological scale, we evaluated the performance of the ML models using different metrics: accuracy, AUROC, F1 score, sensitivity, positive predictive value (PPV), and negative predictive value (NPV). We also compared the AUROC and PPV performance of all models across all clinical and psychological scales based on individual features. Furthermore, we analyzed the factors influencing ML model predictions using SHapley Additive exPlanations (SHAP) (63), which provided interpretability by quantifying the contribution of each feature to the model’s predictions.
Statistical analyses were performed using SciPy version 1.11.1. To discern the variations in acoustic and physiological attributes across the three groups, we assessed the normality of the data distribution using the Shapiro-Wilk test and subsequently applied either one-way analysis of variance (ANOVA) or the Kruskal-Wallis test, depending on the normality of the data. Statistical significance was determined using a false discovery rate of 5%.
The available sample at the time of analysis consisted of 25 young adults aged 19–31 years (mean age = 23.6 and standard deviation = 3.06) and the majority were female (16/25, 64.0%). Their mean education level was 2.64 of college (13–17 years of education). Descriptive statistics on the scores of clinical and psychological scales by clustered groups (higher, middle, and lower thirds) are presented in Table 2. The results of a one-way ANOVA or Kruskal-Wallis test between clustered groups in acoustic and physiological variables for every scale are reported in Supplementary Table S4. As shown in this table, statistically significant differences were found only in the K-SPS, K-SIAS, and STAI-Trait scale.
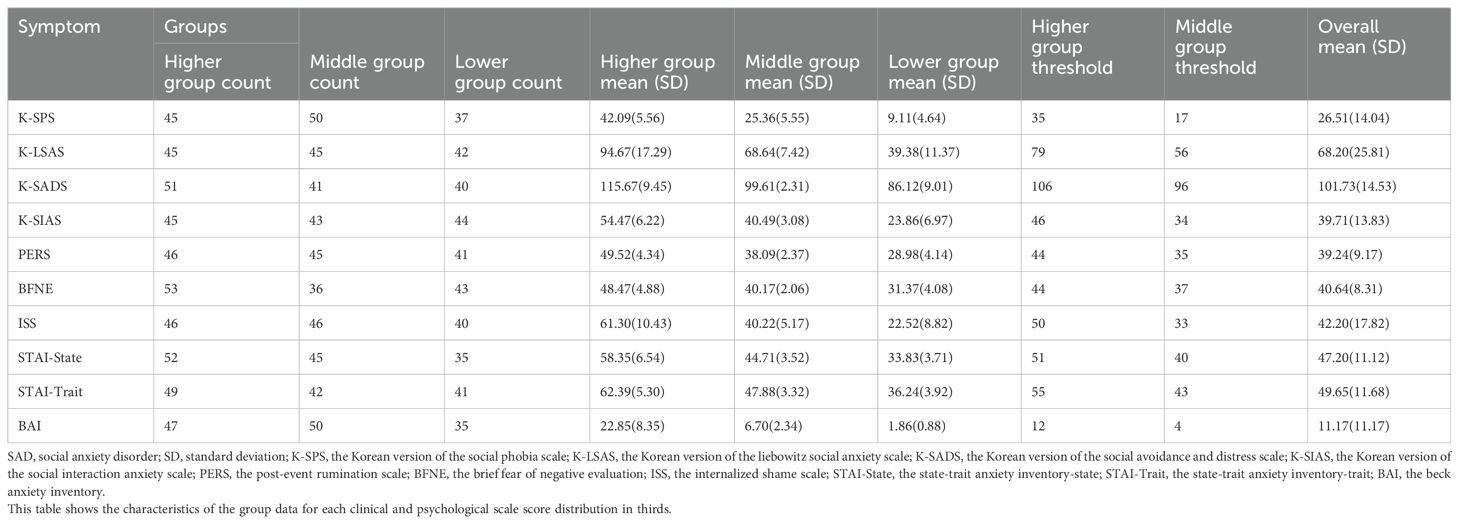
Table 2. Descriptive statistics on the various anxiety symptoms for SAD by clustered groups (higher, middle, and lower groups).
The complete results of the grid search and random search were provided in Supplementary Tables S5-S7, and Supplementary Tables S8-S10, respectively. Tables 3–5 presented the best model performances for each clinical and psychological scale across different modalities, achieved through combinations of grid search or random search with stratified cross-validation.
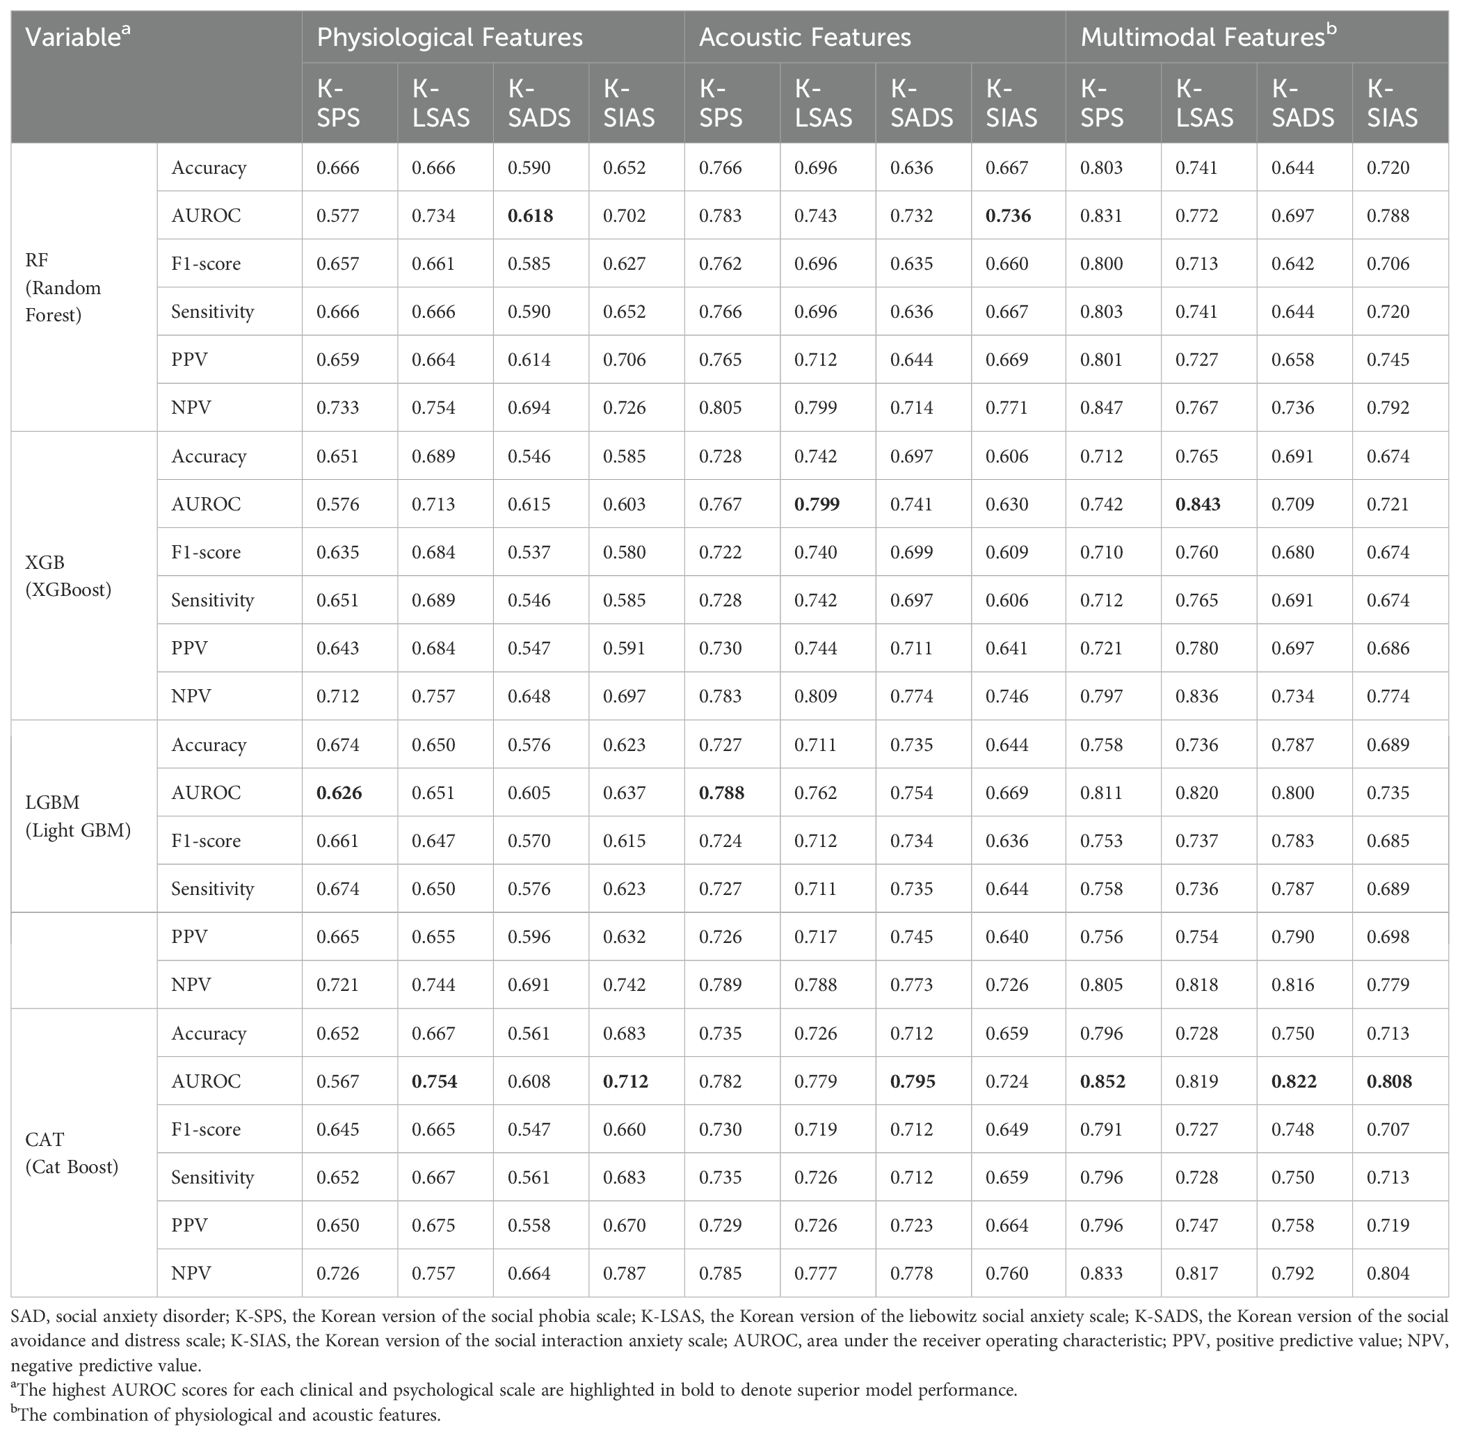
Table 3. The predictive performance of the four machine learning models on the severe group for core symptoms of SAD (K-SPS, K-LSAS, K-SADS, and K-SIAS) using the best parameters from grid search or random search combined with stratified cross-validation.

Table 4. The predictive performance of the four machine learning models on the severe group for cognitive symptoms of SAD (PERS, BFNE, and ISS) using the best parameters from grid search or random search combined with stratified cross-validation.
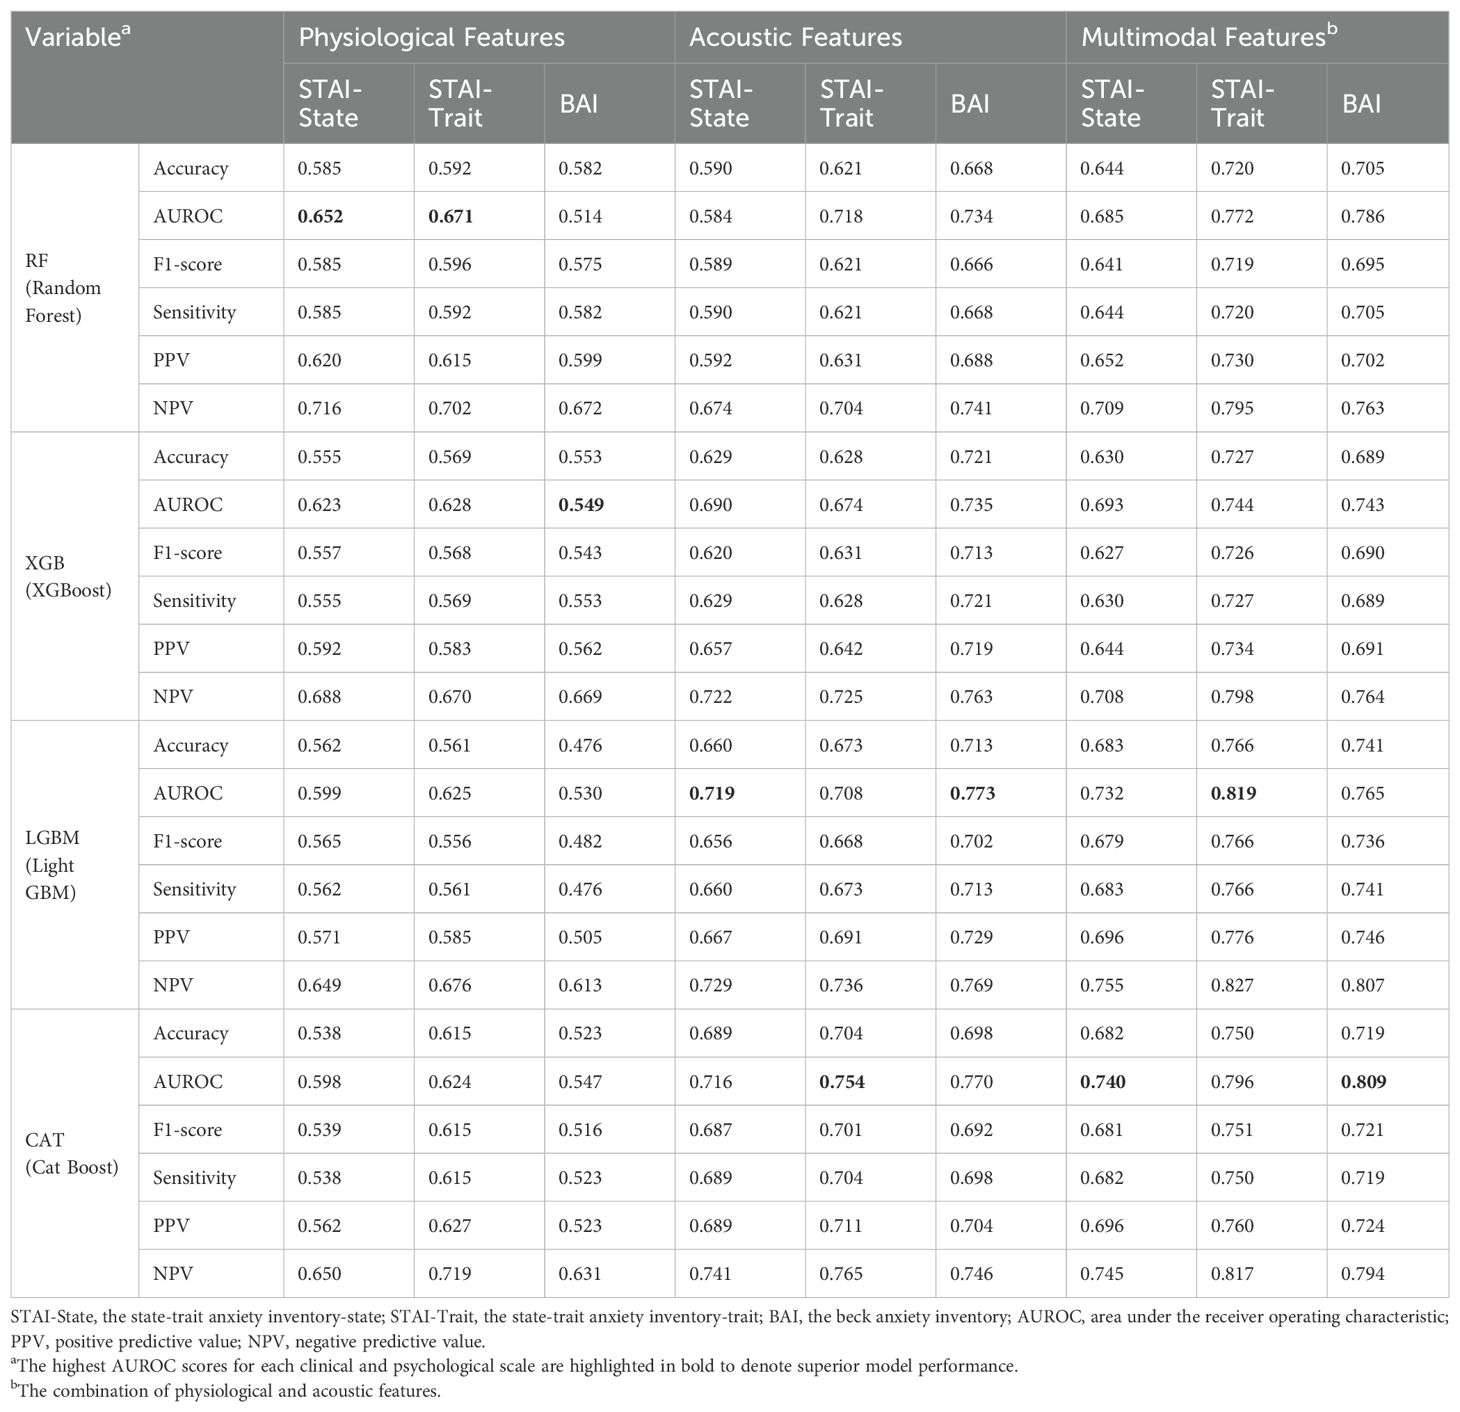
Table 5. The predictive performance of the four machine learning models on the severe group for generalized anxiety (STAI-State, STAI-Trait, and BAI) using the best parameters from grid search or random search combined with stratified cross-validation.
In categorizing the core symptoms of SAD, the prediction of CatBoost model for the severe K-SPS group was notable, achieving an AUROC of 0.852. This was closely followed by the prediction of XGBoost model for the severe K-LSAS group with an AUROC of 0.843, and the prediction of CatBoost for the severe groups of K-SADS and K-SIAS with AUROCs of 0.822 and 0.808, respectively. Regarding the cognitive symptoms of SAD, CatBoost predictions for the severe group of PERS, BFNE, and ISS were marked by AUROCs of 0.866, 0.778, and 0.765, respectively. In the context of generalized anxiety, the prediction of LightGBM model for the severe group of STAI-Trait was the most accurate, with an AUROC of 0.819, whereas the predictions of CatBoost for those of BAI and STAI-State were characterized by AUROCs of 0.809 and 0.740, respectively.
The performance of the top-scoring models, as visualized by receiver operating characteristic curves, was shown in Figures 2–4. A thorough analysis of the performance metrics across various scales, focusing on the AUROC, revealed a clear pattern: ML models utilizing acoustic features outperformed those based solely on physiological features. This performance gap was further amplified in the models that integrated multimodal features. These results were also evident in the visualizations of AUROC and PPV in Figures 5, 6.
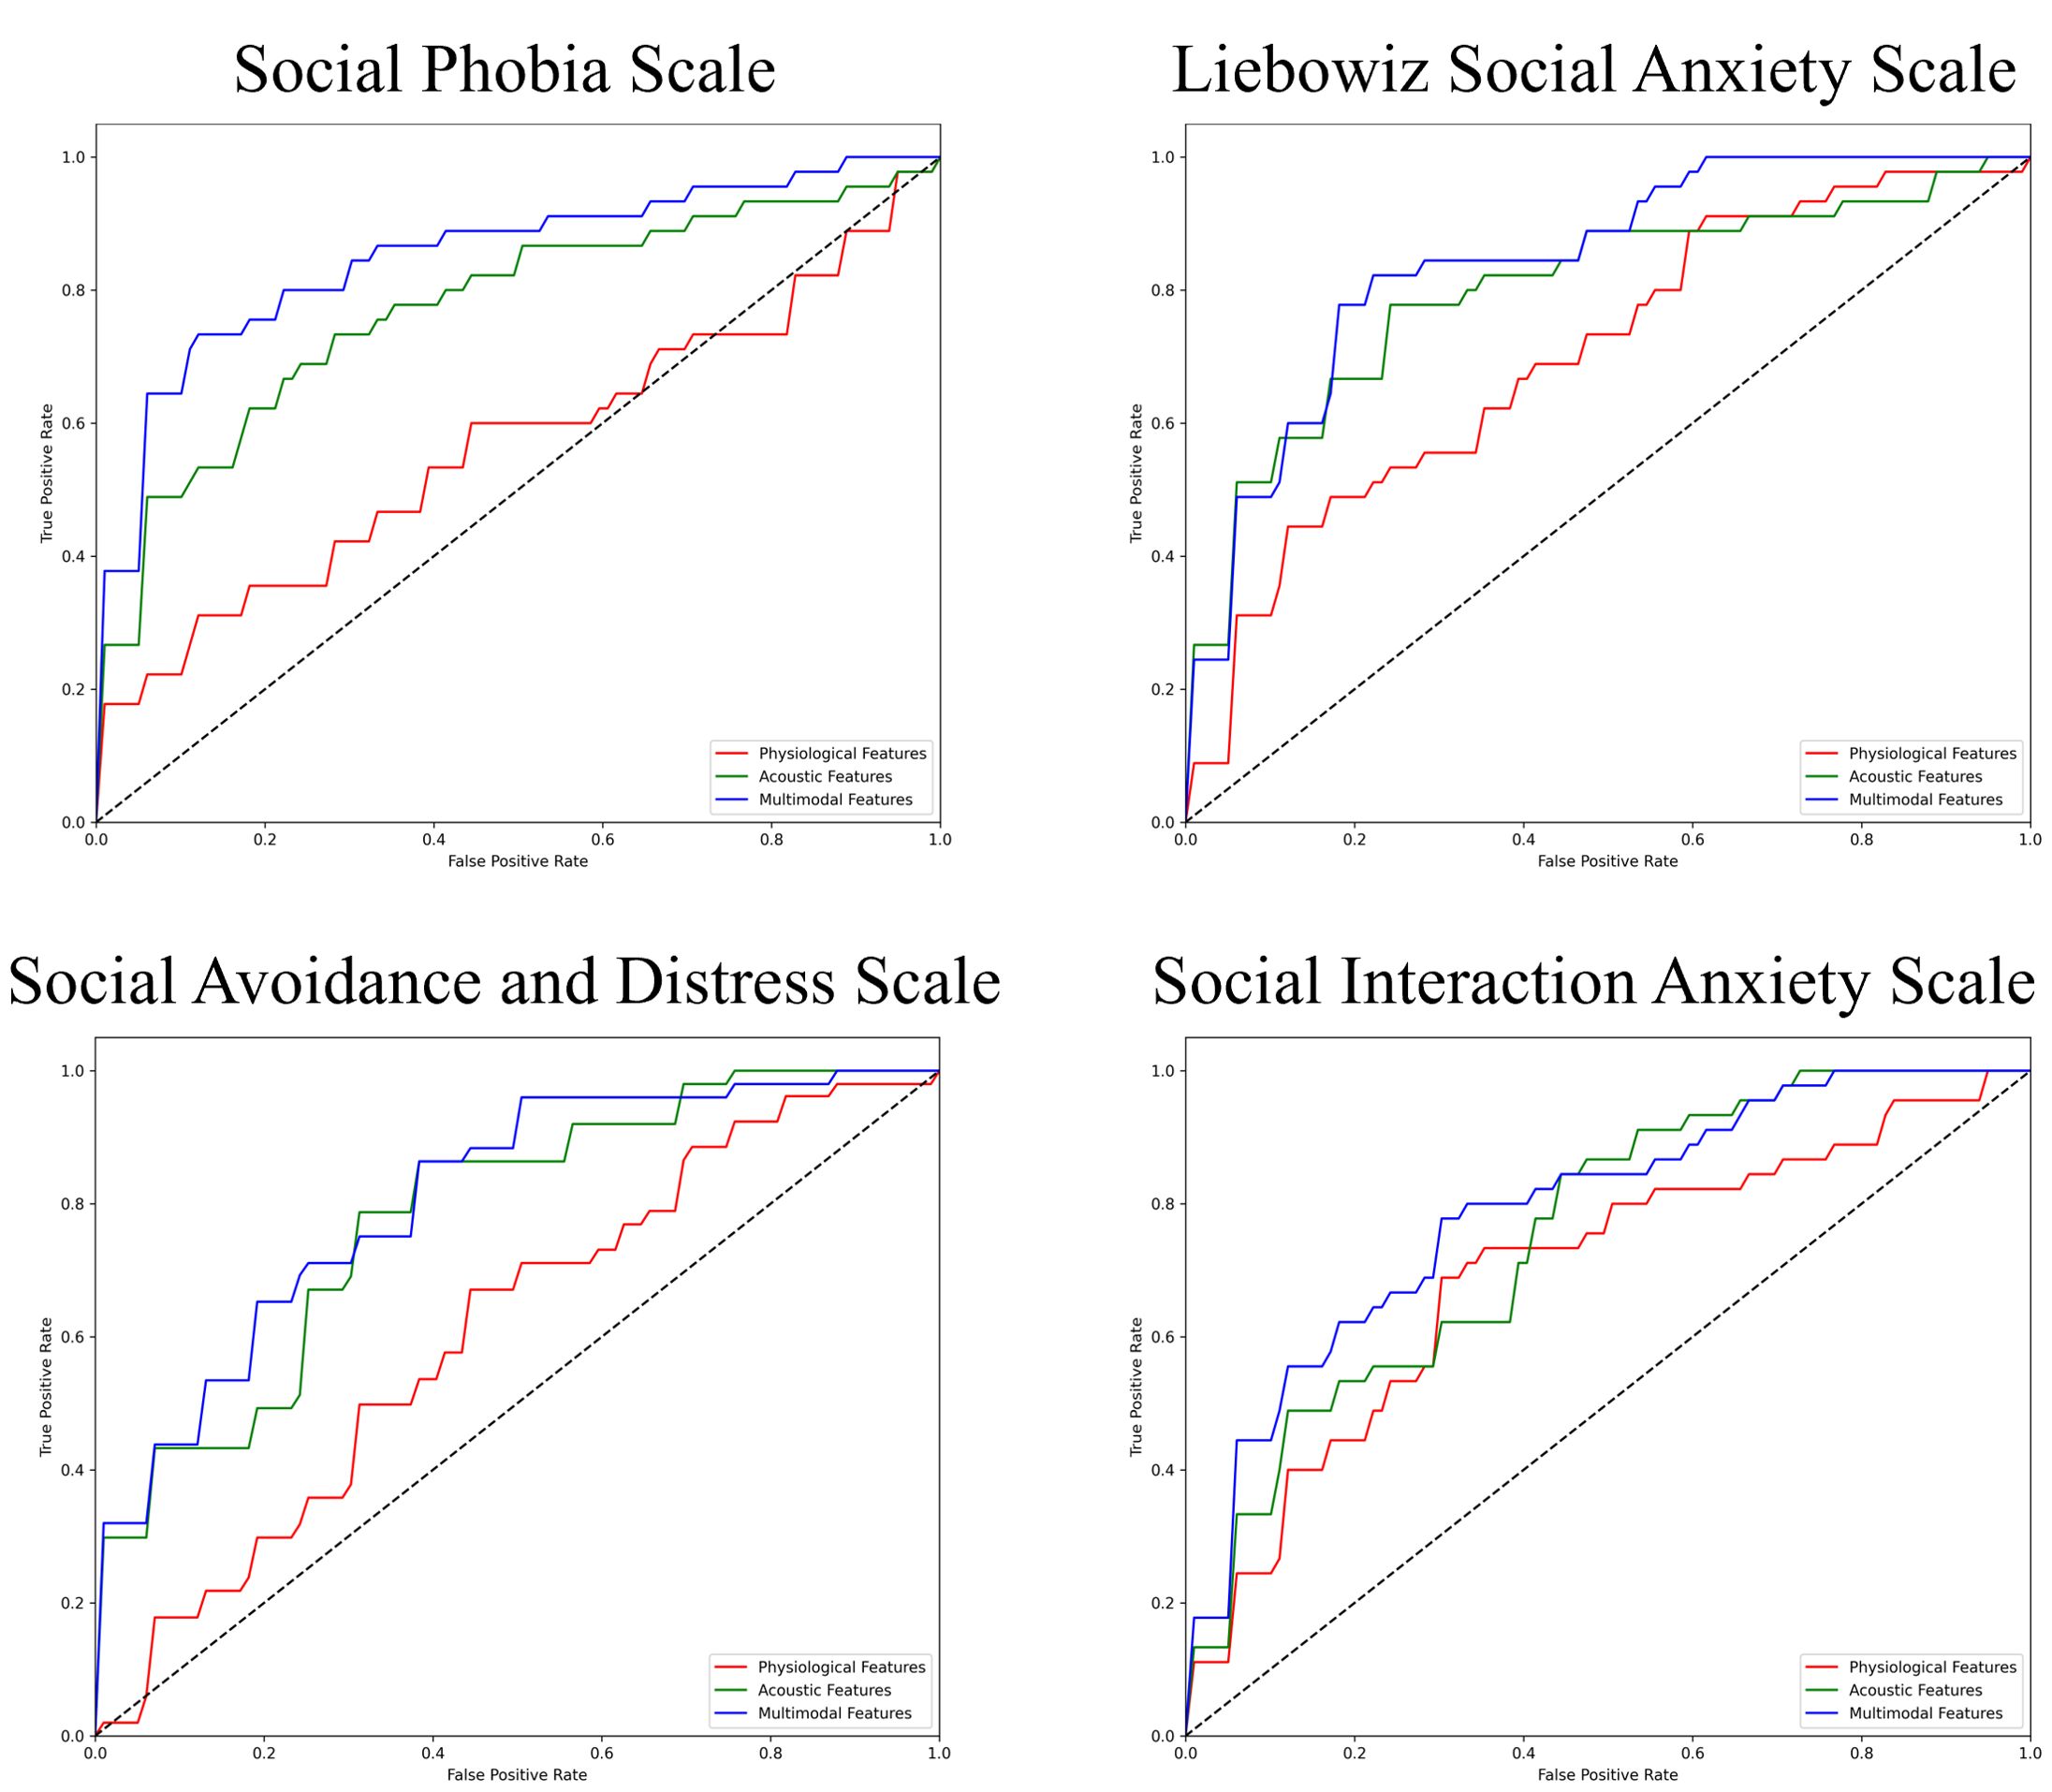
Figure 2. ROC curves of the best prediction on the severe group for core symptoms of SAD. ROC, receiver operating characteristic; SAD, social anxiety disorder. For the Social Phobia Scale, Liebowitz Social Anxiety Scale, Social Avoidance and Distress Scale, and Social Interaction Anxiety Scale, we used the Korean versions.
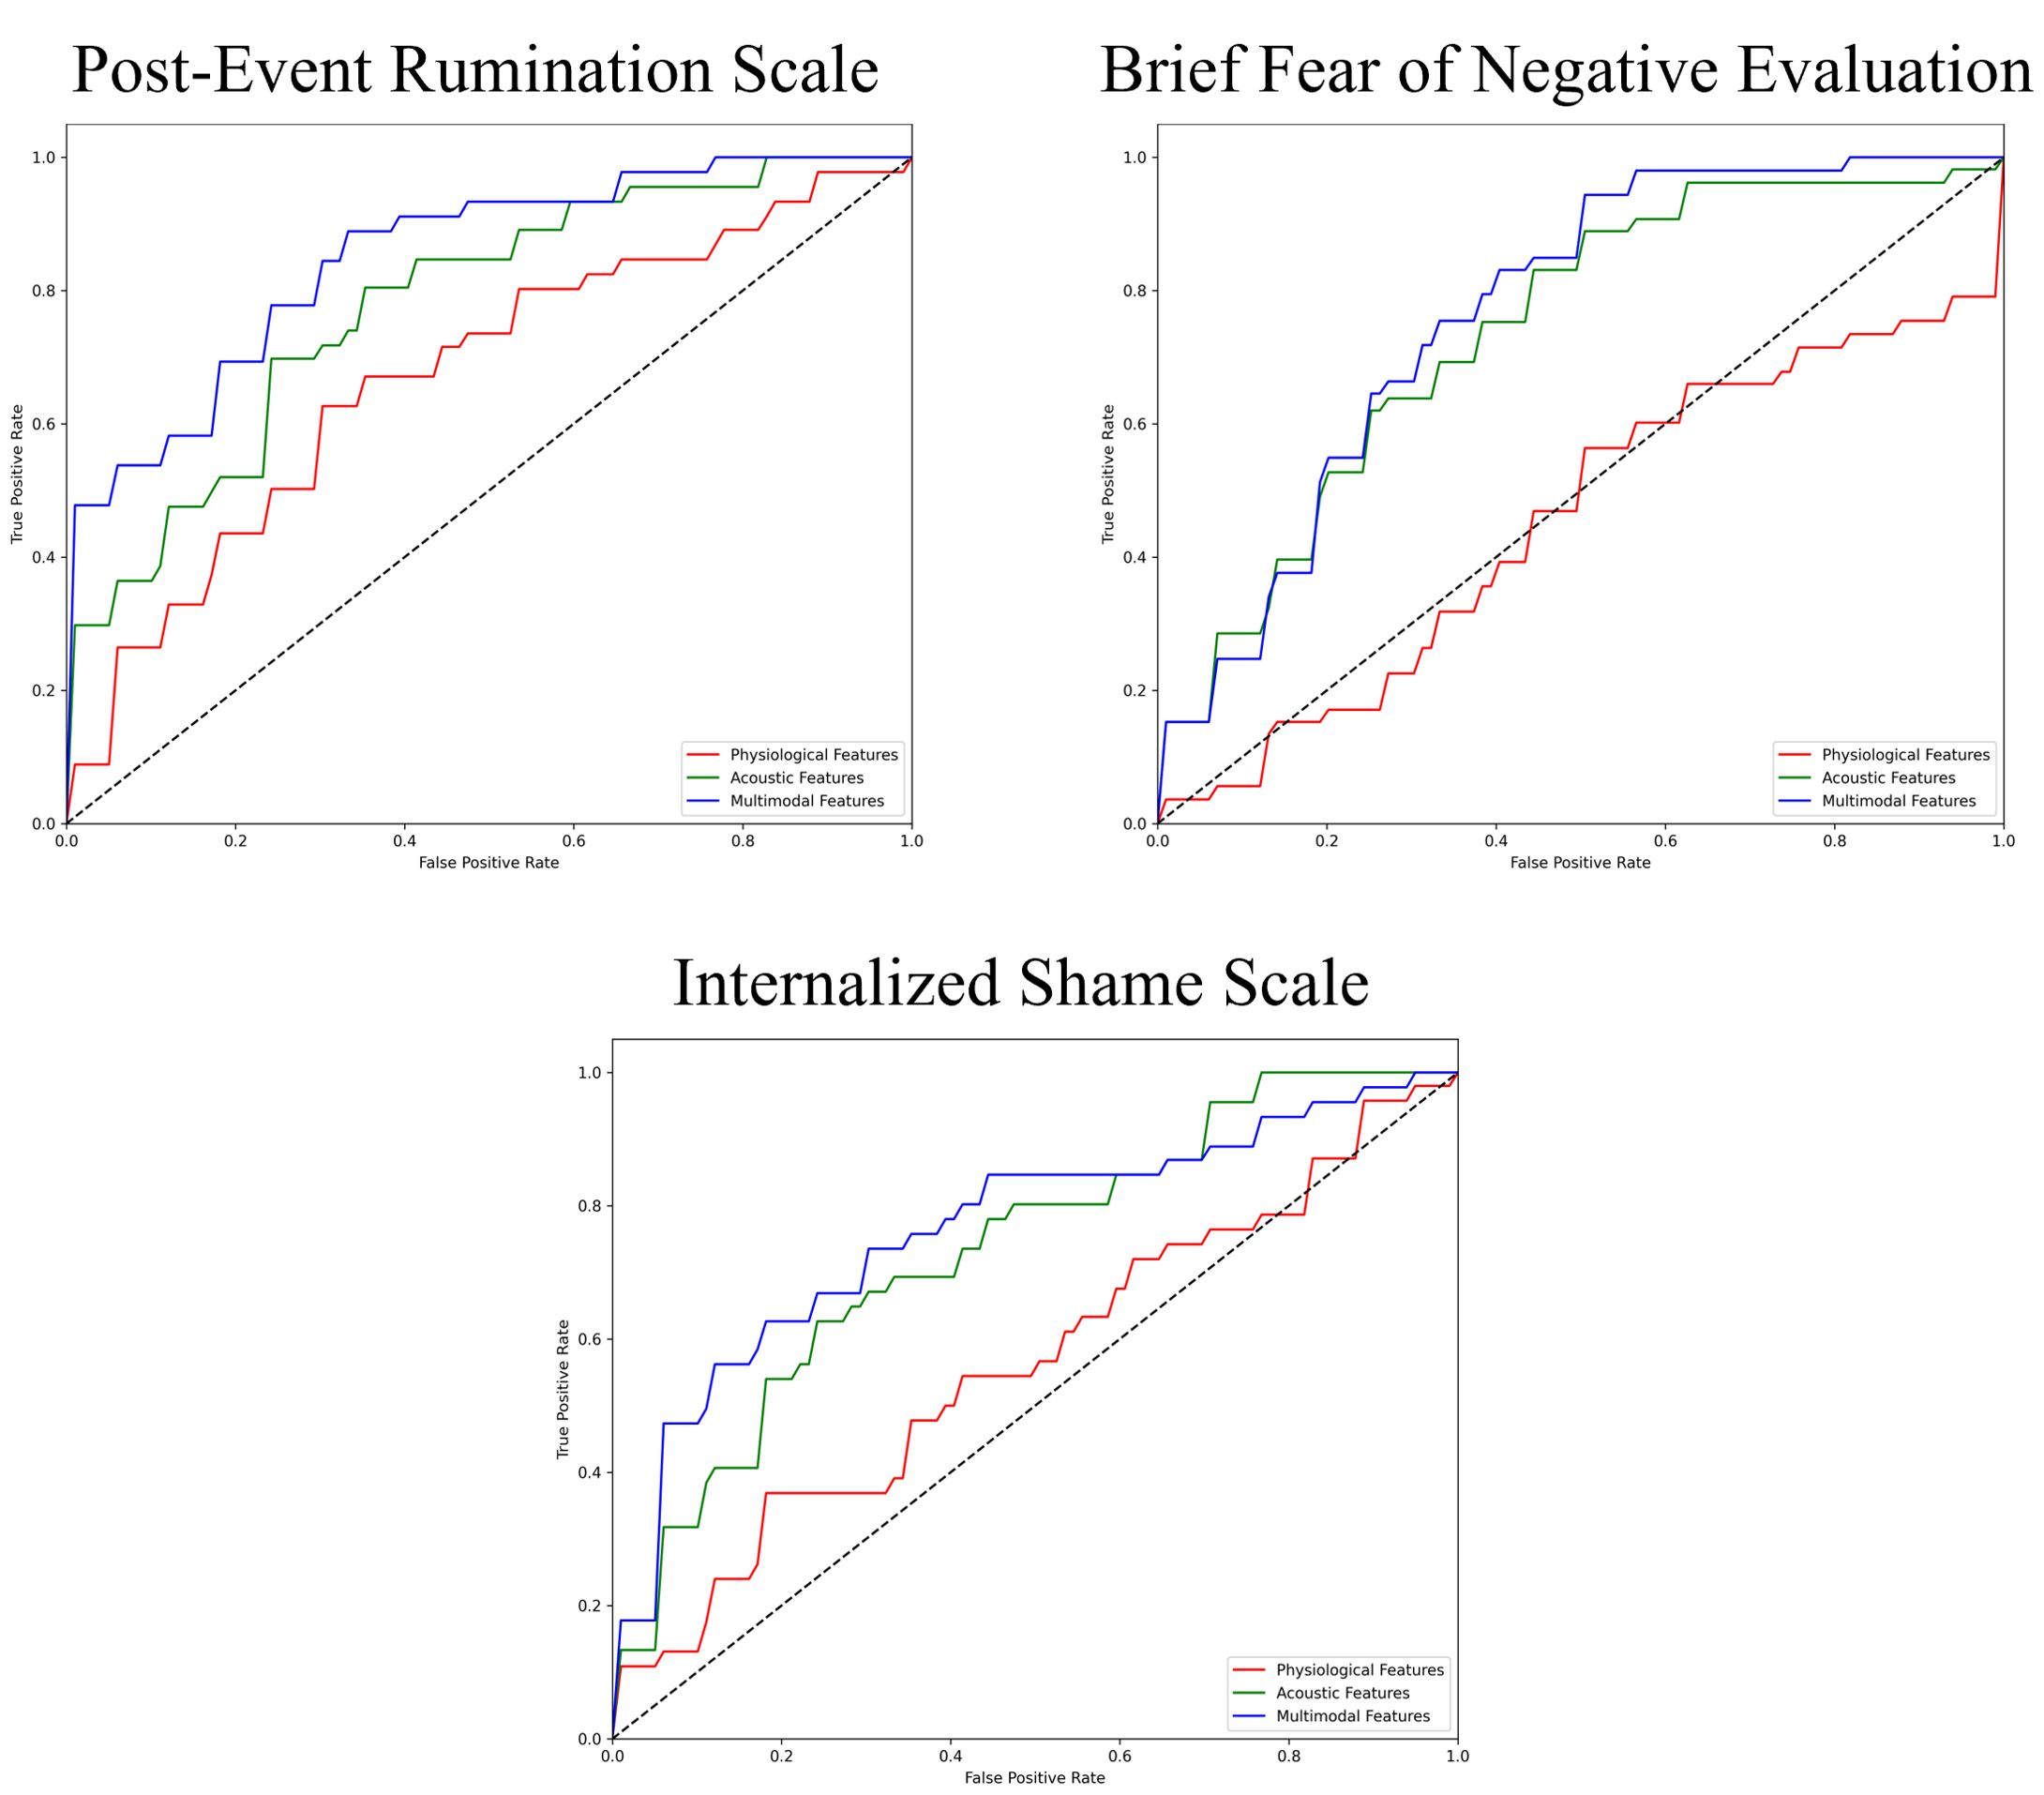
Figure 3. ROC curves of the best prediction on the severe group for cognitive symptoms of SAD. ROC, receiver operating characteristic; SAD, social anxiety disorder.
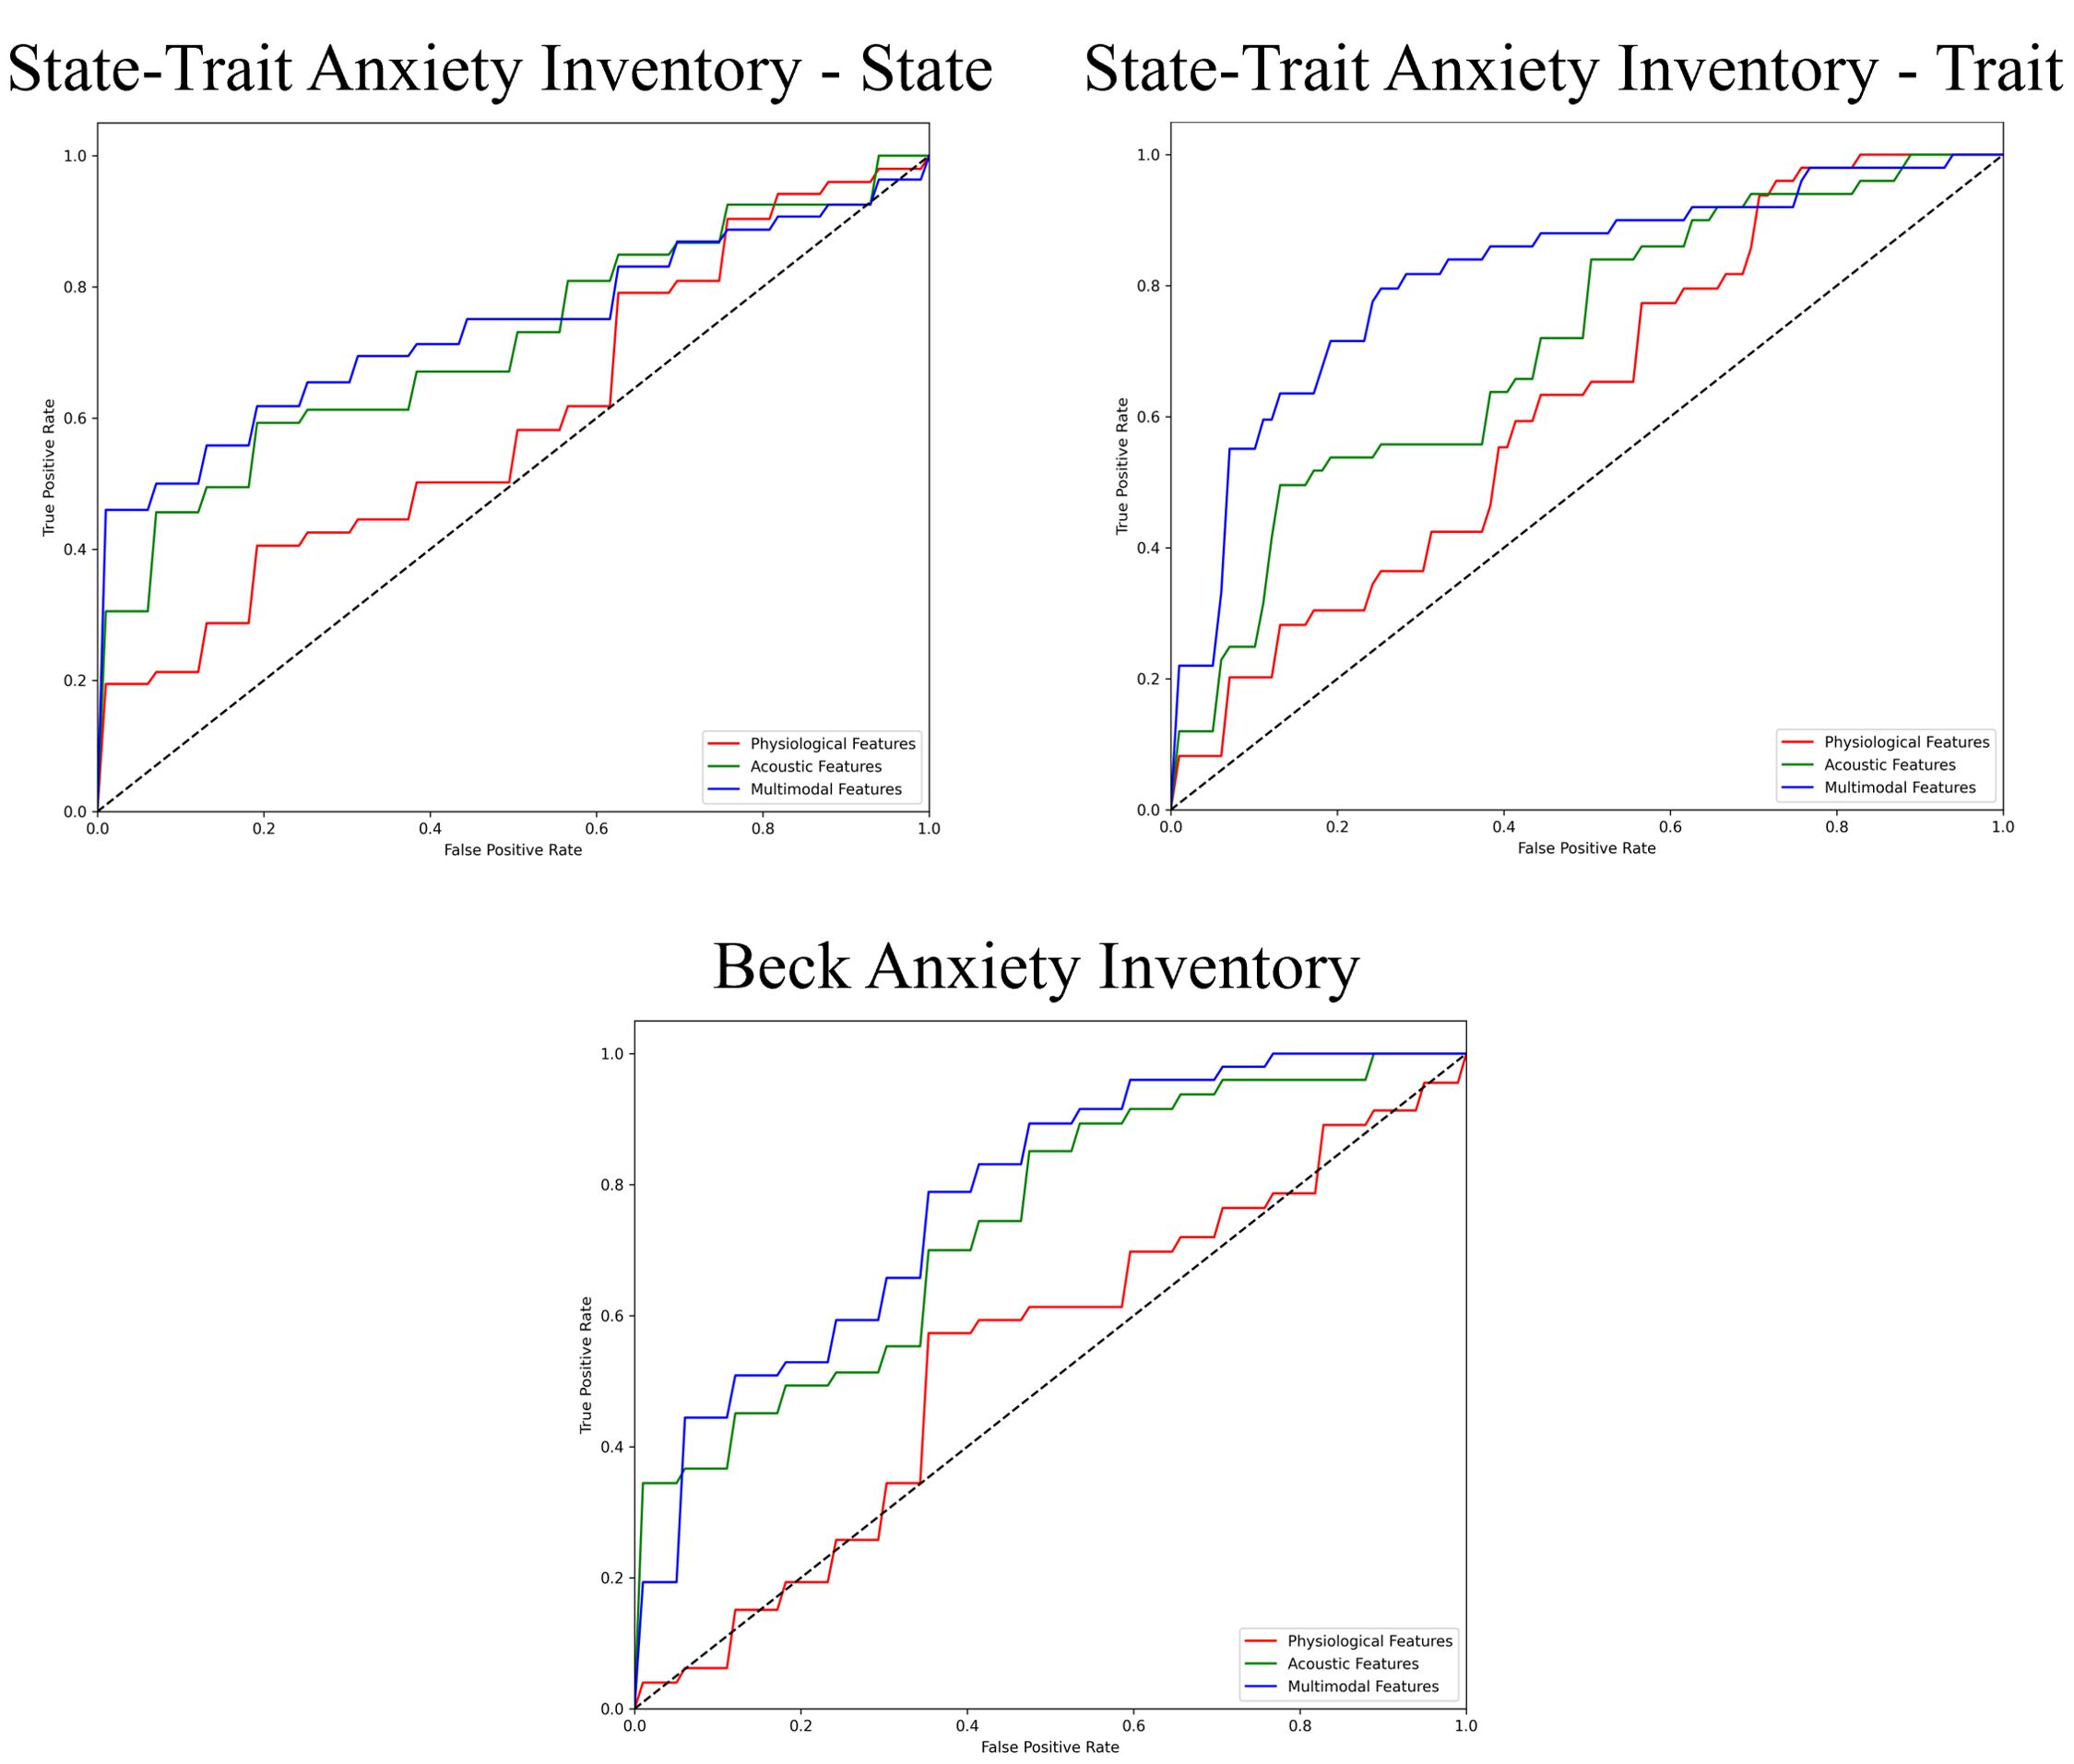
Figure 4. ROC curves of the best prediction on the severe group for generalized anxiety. ROC, receiver operating characteristic.
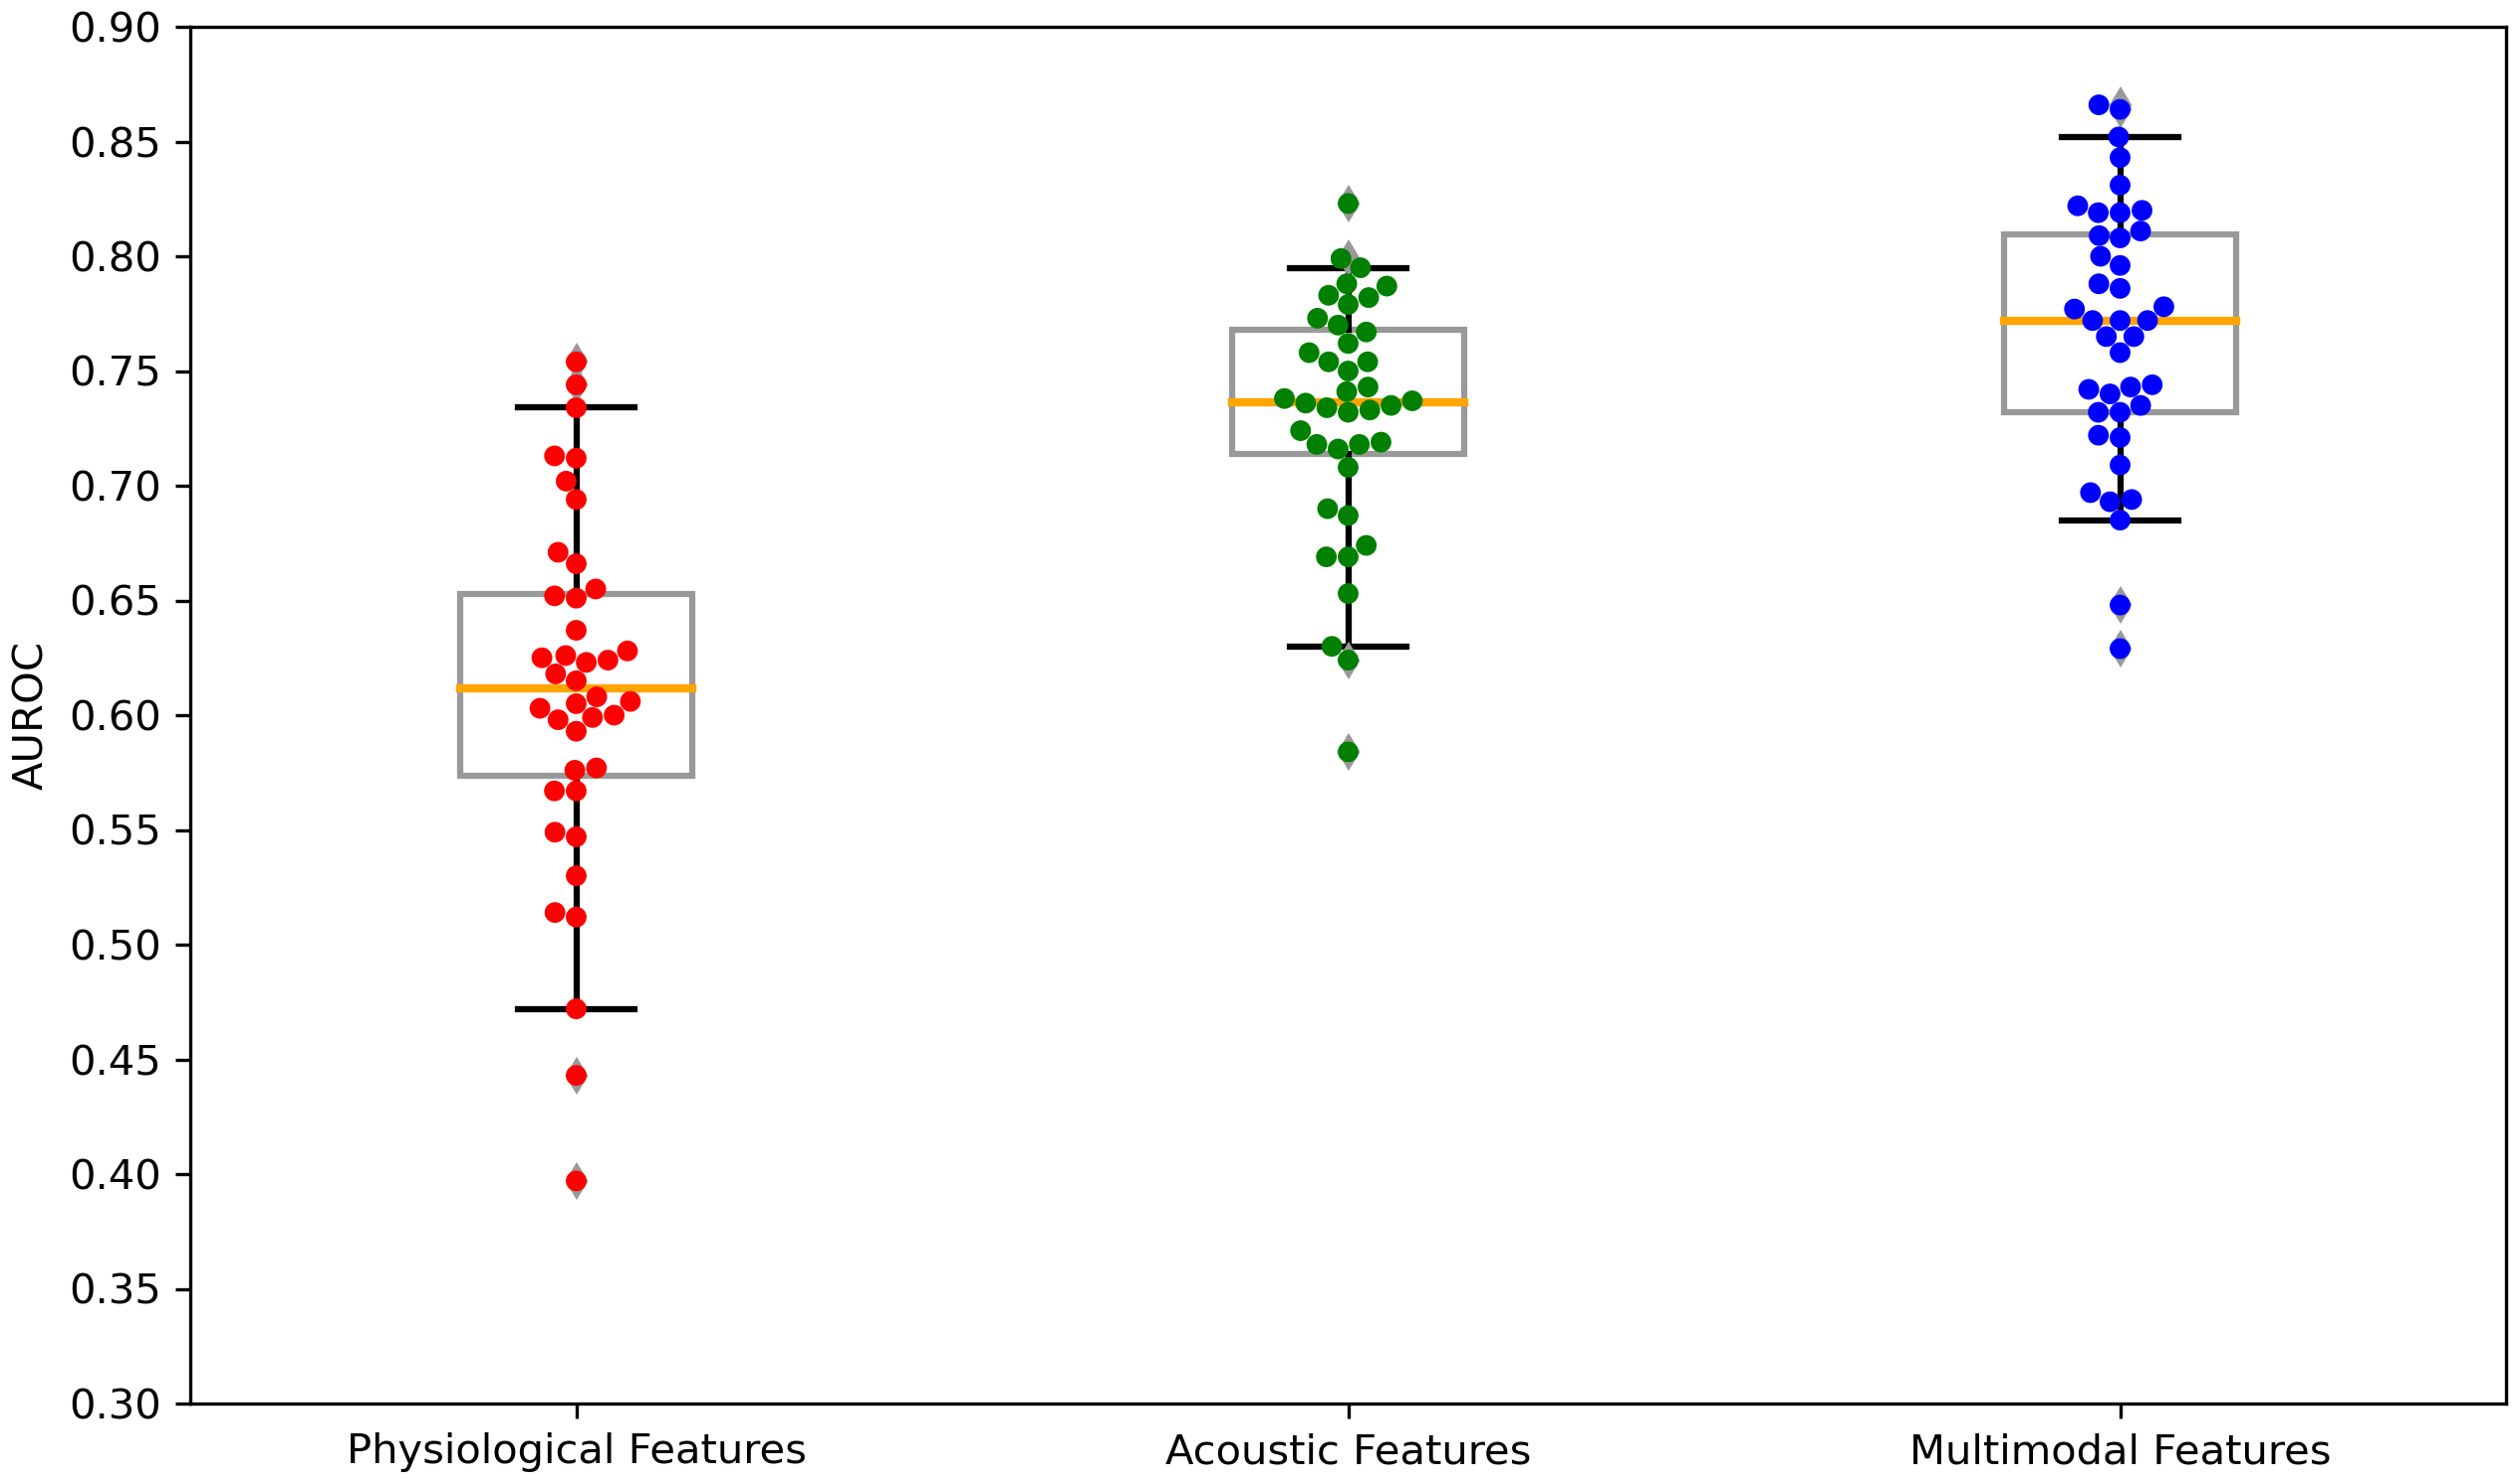
Figure 5. Boxplots of the AUROC scores across feature sets: physiological features, acoustic features, and multimodal features. AUROC, area under the receiver operating characteristics. Each dot is a data point in the performance metric, and the yellow line is the median value.
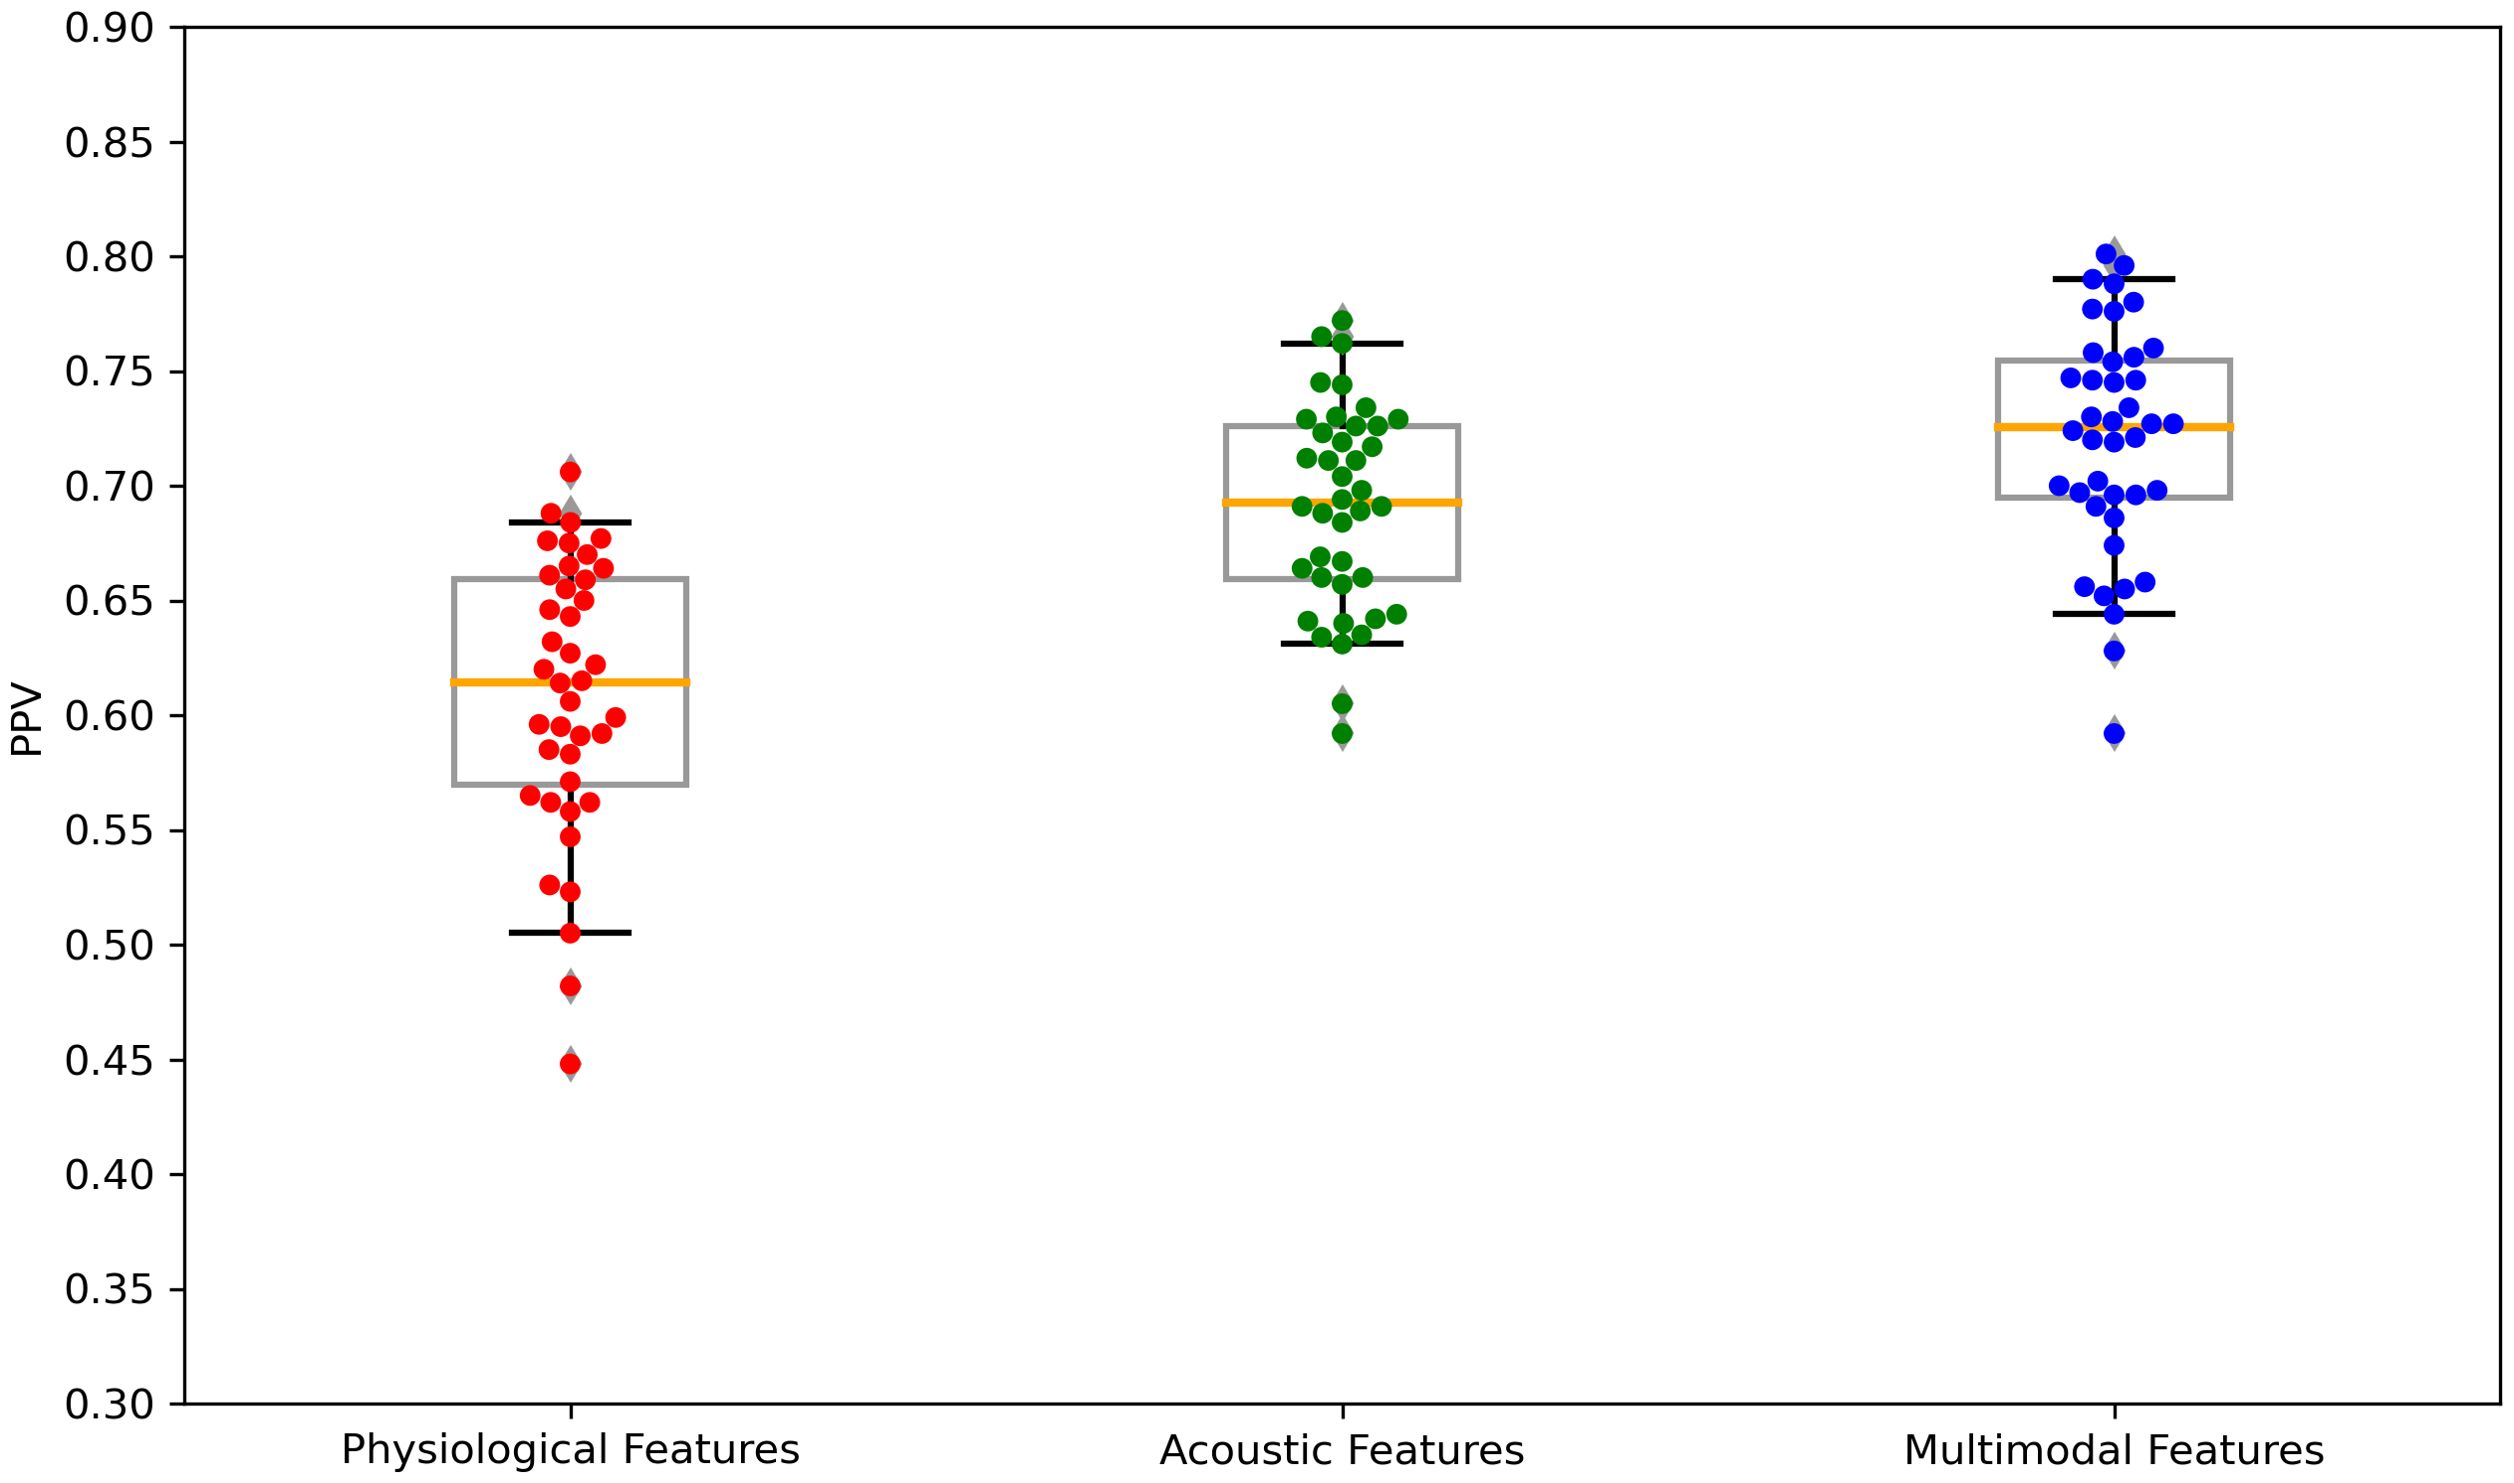
Figure 6. Boxplots of the PPV scores across feature sets: Physiological features, acoustic features, and multimodal features. PPV, positive predictive value. Each dot is a data point in the performance metric, and the yellow line is the median value.
The results of validating the best parameter models using LOOCV were presented in Table 6. With AUROC ranging from 0.725 to 0.835, the performance was slightly lower compared to the stratified cross-validation results, but the best prediction performance based on the AUROC was achieved using models that utilized multimodal features, and the same trend was observed in the results of the LOOCV.
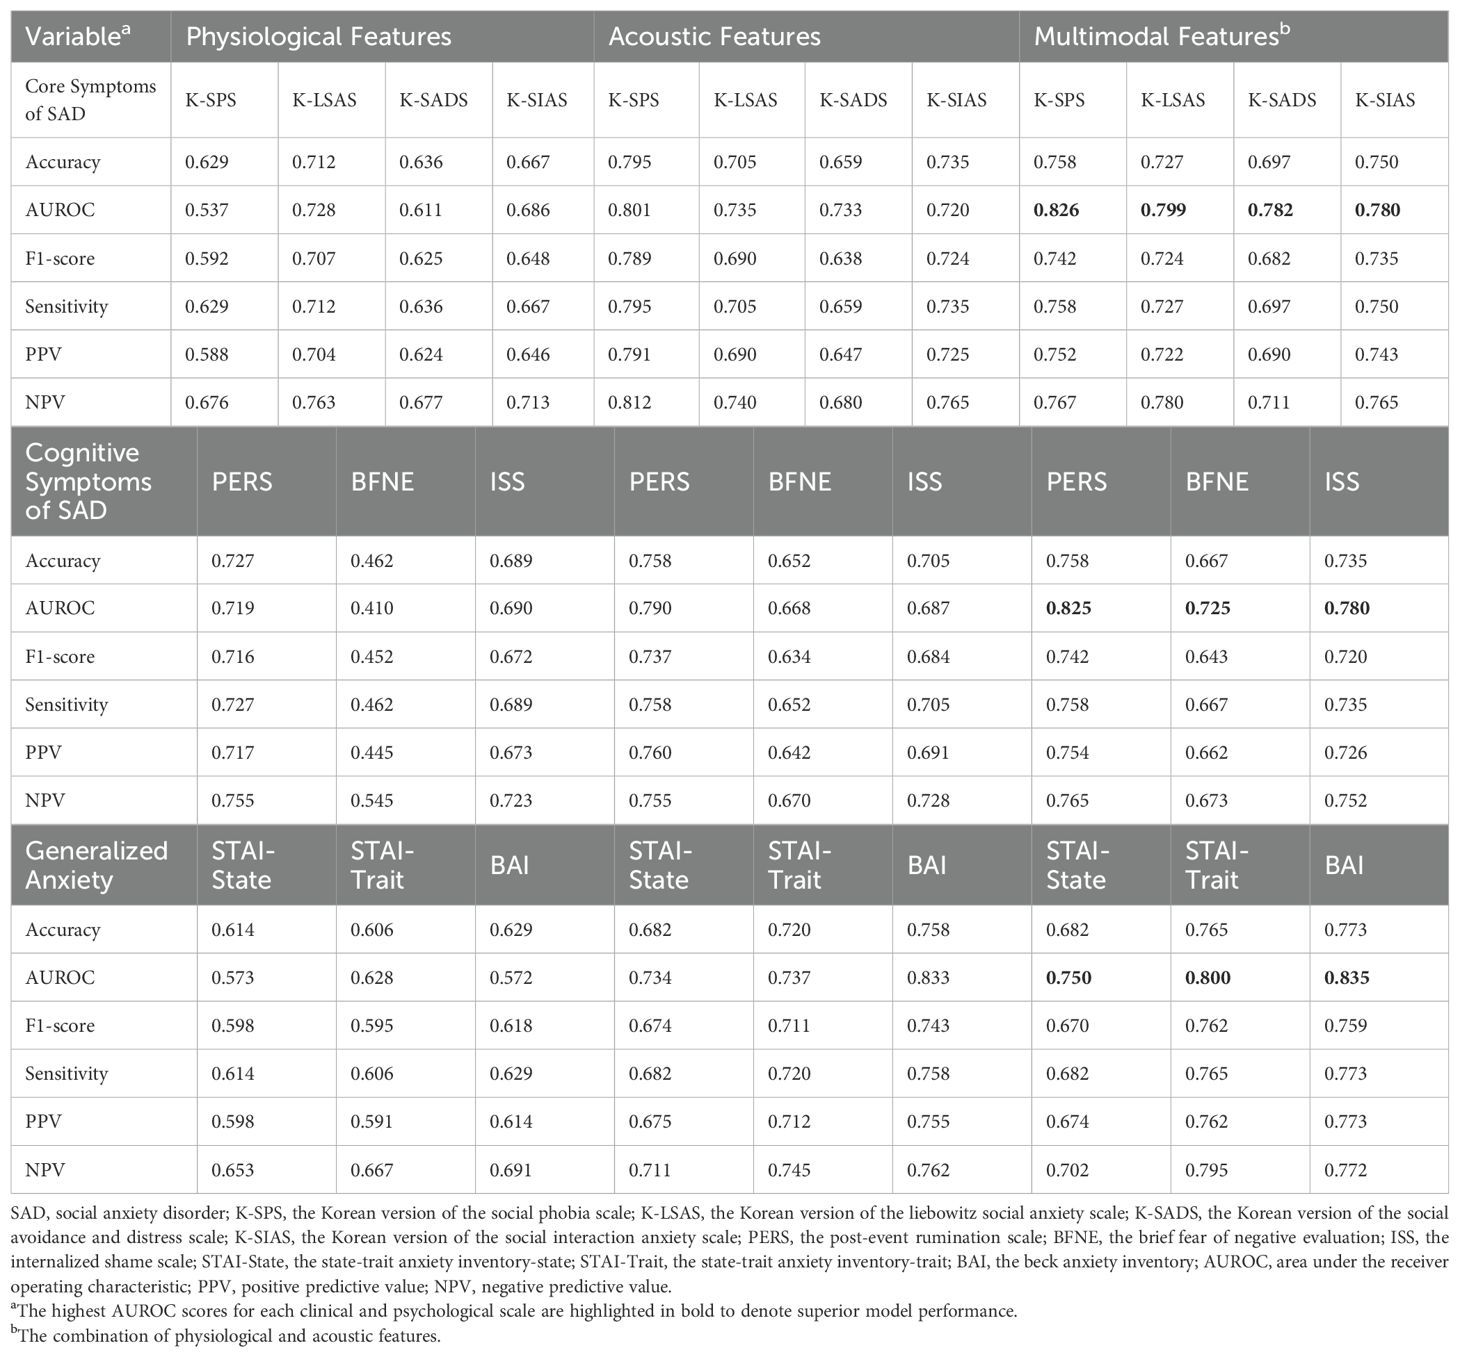
Table 6. The predictive performance of the four machine learning models on the severe group for all clinical and psychological scales using leave-one-out cross-validation of best parameter models.
The SHAP values for the models that demonstrated superior performance with multimodal features are shown in Figures 7–9. Overall, while acoustic features generally had a greater influence, the Liebowitz Social Anxiety Scale and the Post-Event Rumination Scale showed that GSR had the most significant impact on the model’s predictions.
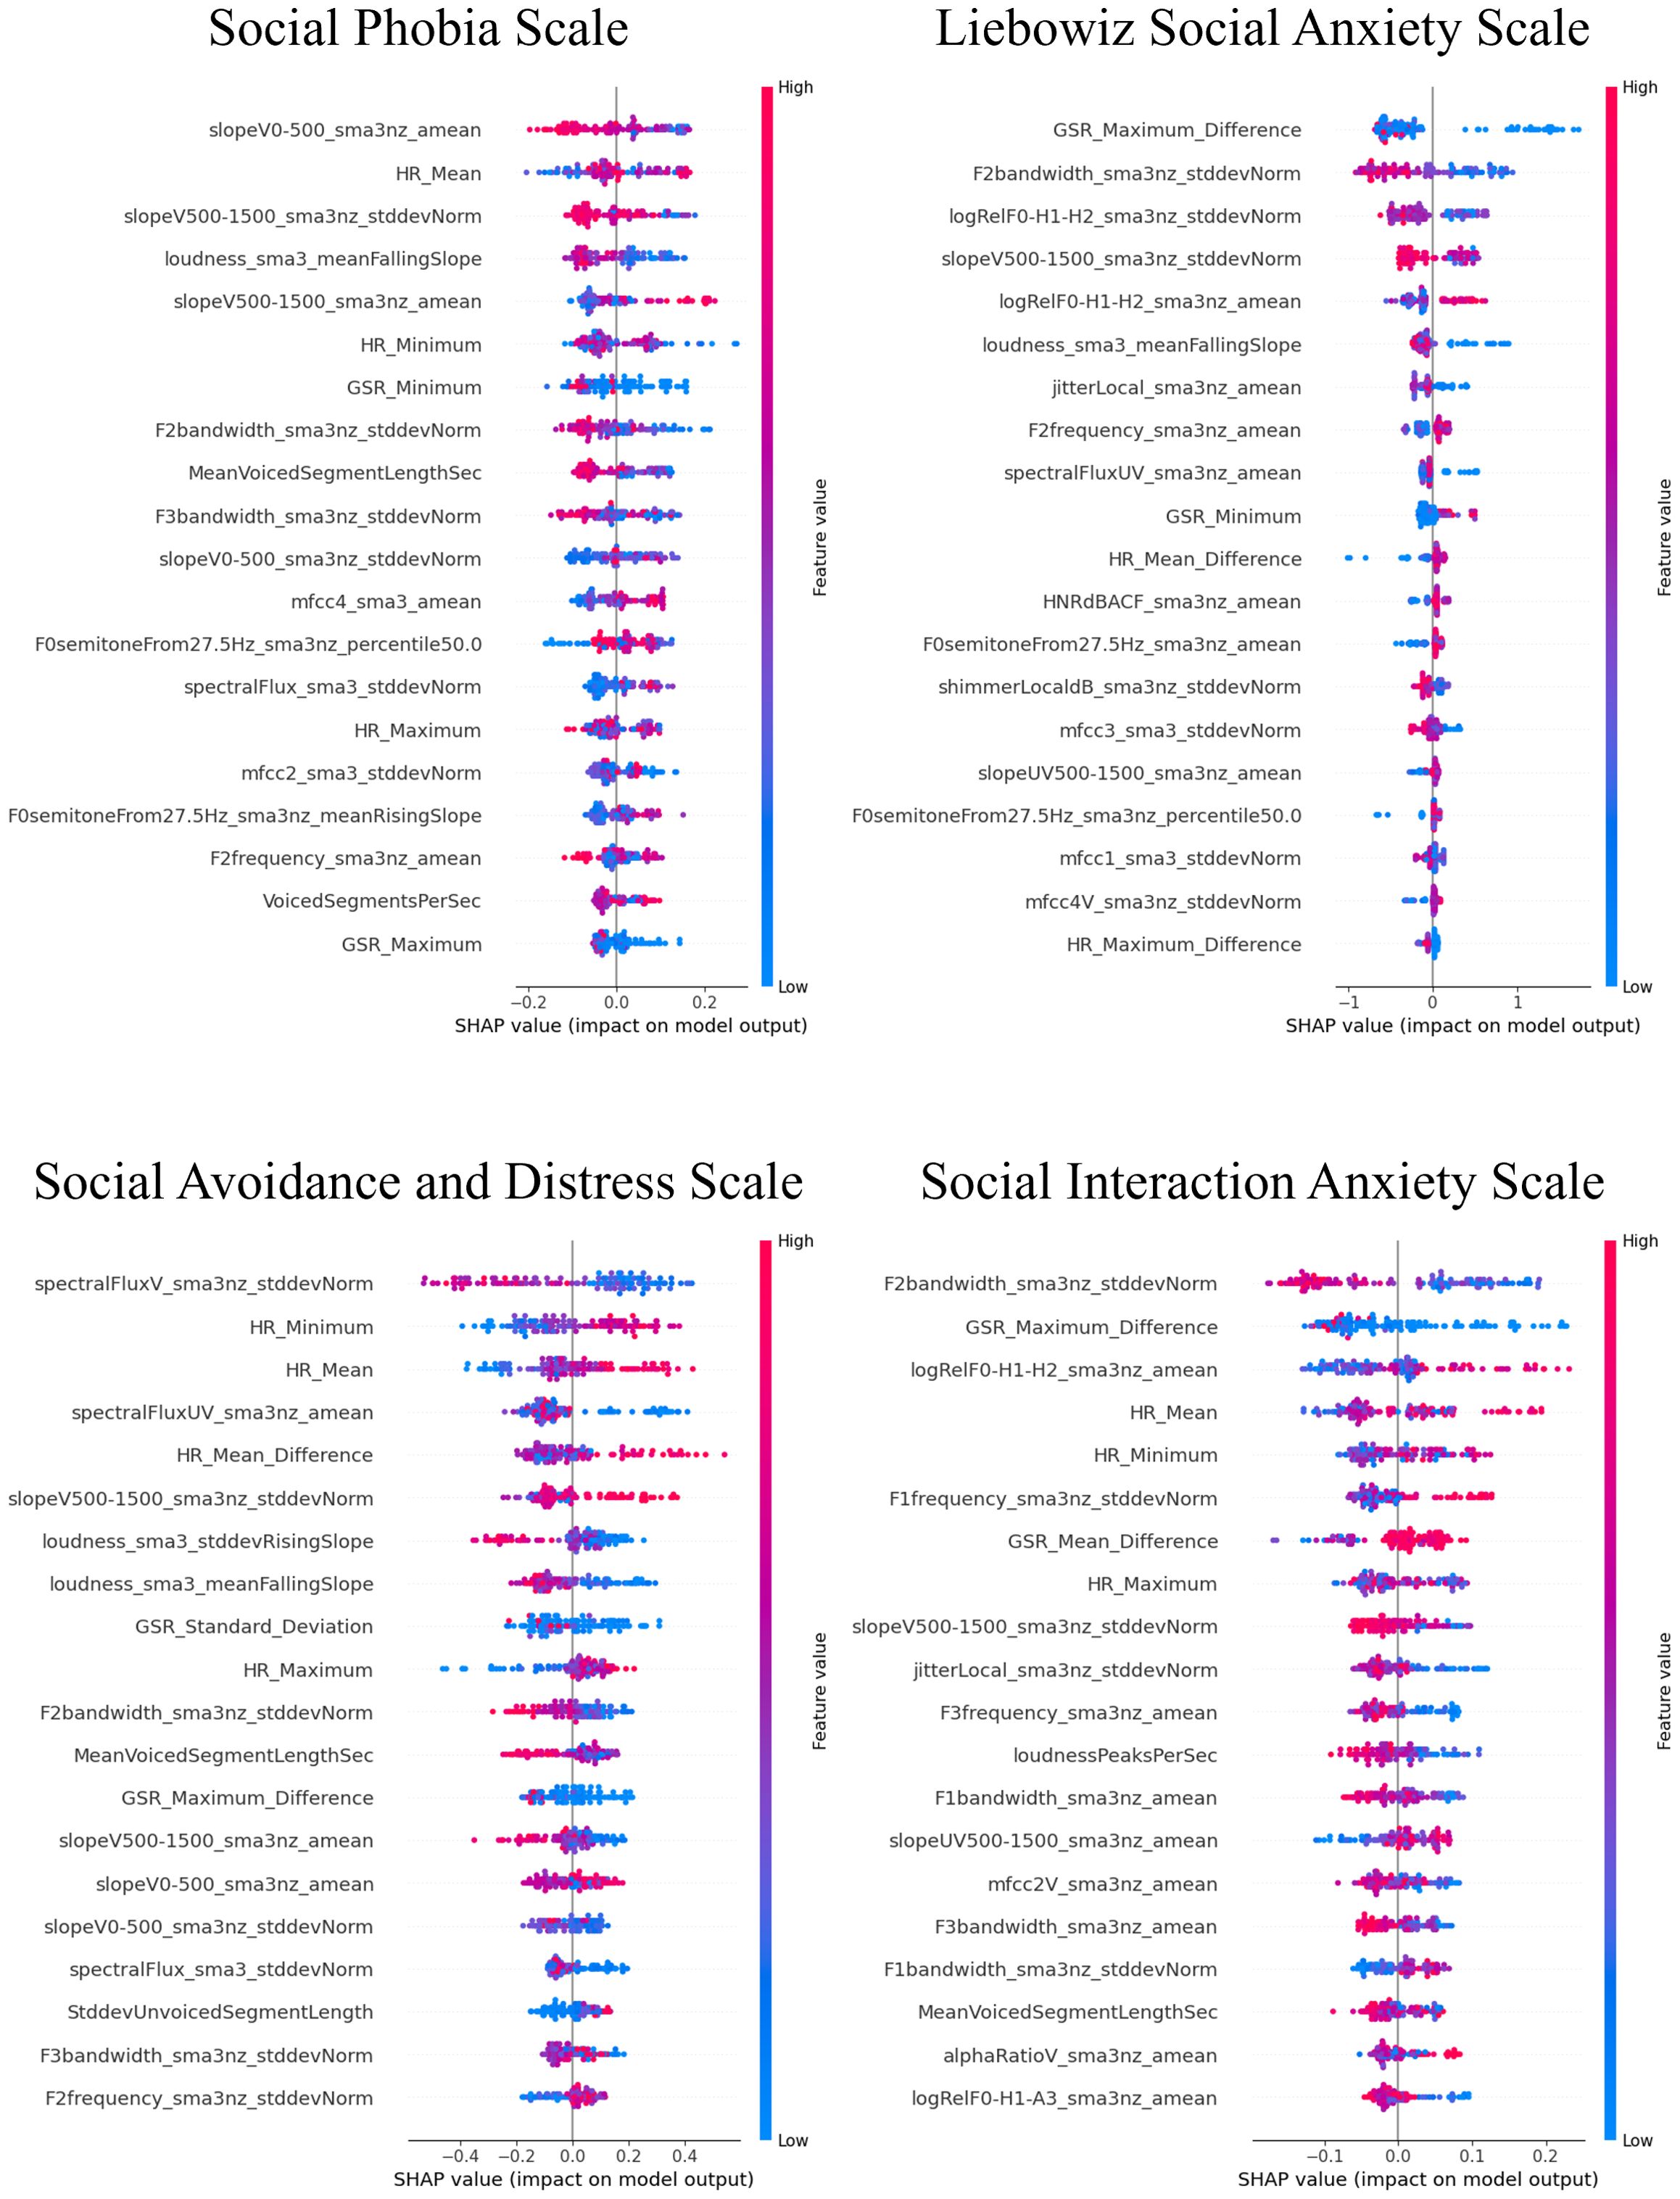
Figure 7. SHAP analysis: multimodal features impact on core symptoms of SAD severity prediction. SHAP, shapley additive explanations; SAD, social anxiety disorder. For the Social Phobia Scale, Liebowitz Social Anxiety Scale, Social Avoidance and Distress Scale, and Social Interaction Anxiety Scale, we used the Korean versions. This visual representation clearly demonstrated the impact of specific characteristics of multimodal features on model predictions across a range of clinical and psychological scales, with features listed in order of importance from the top of the y-axis.
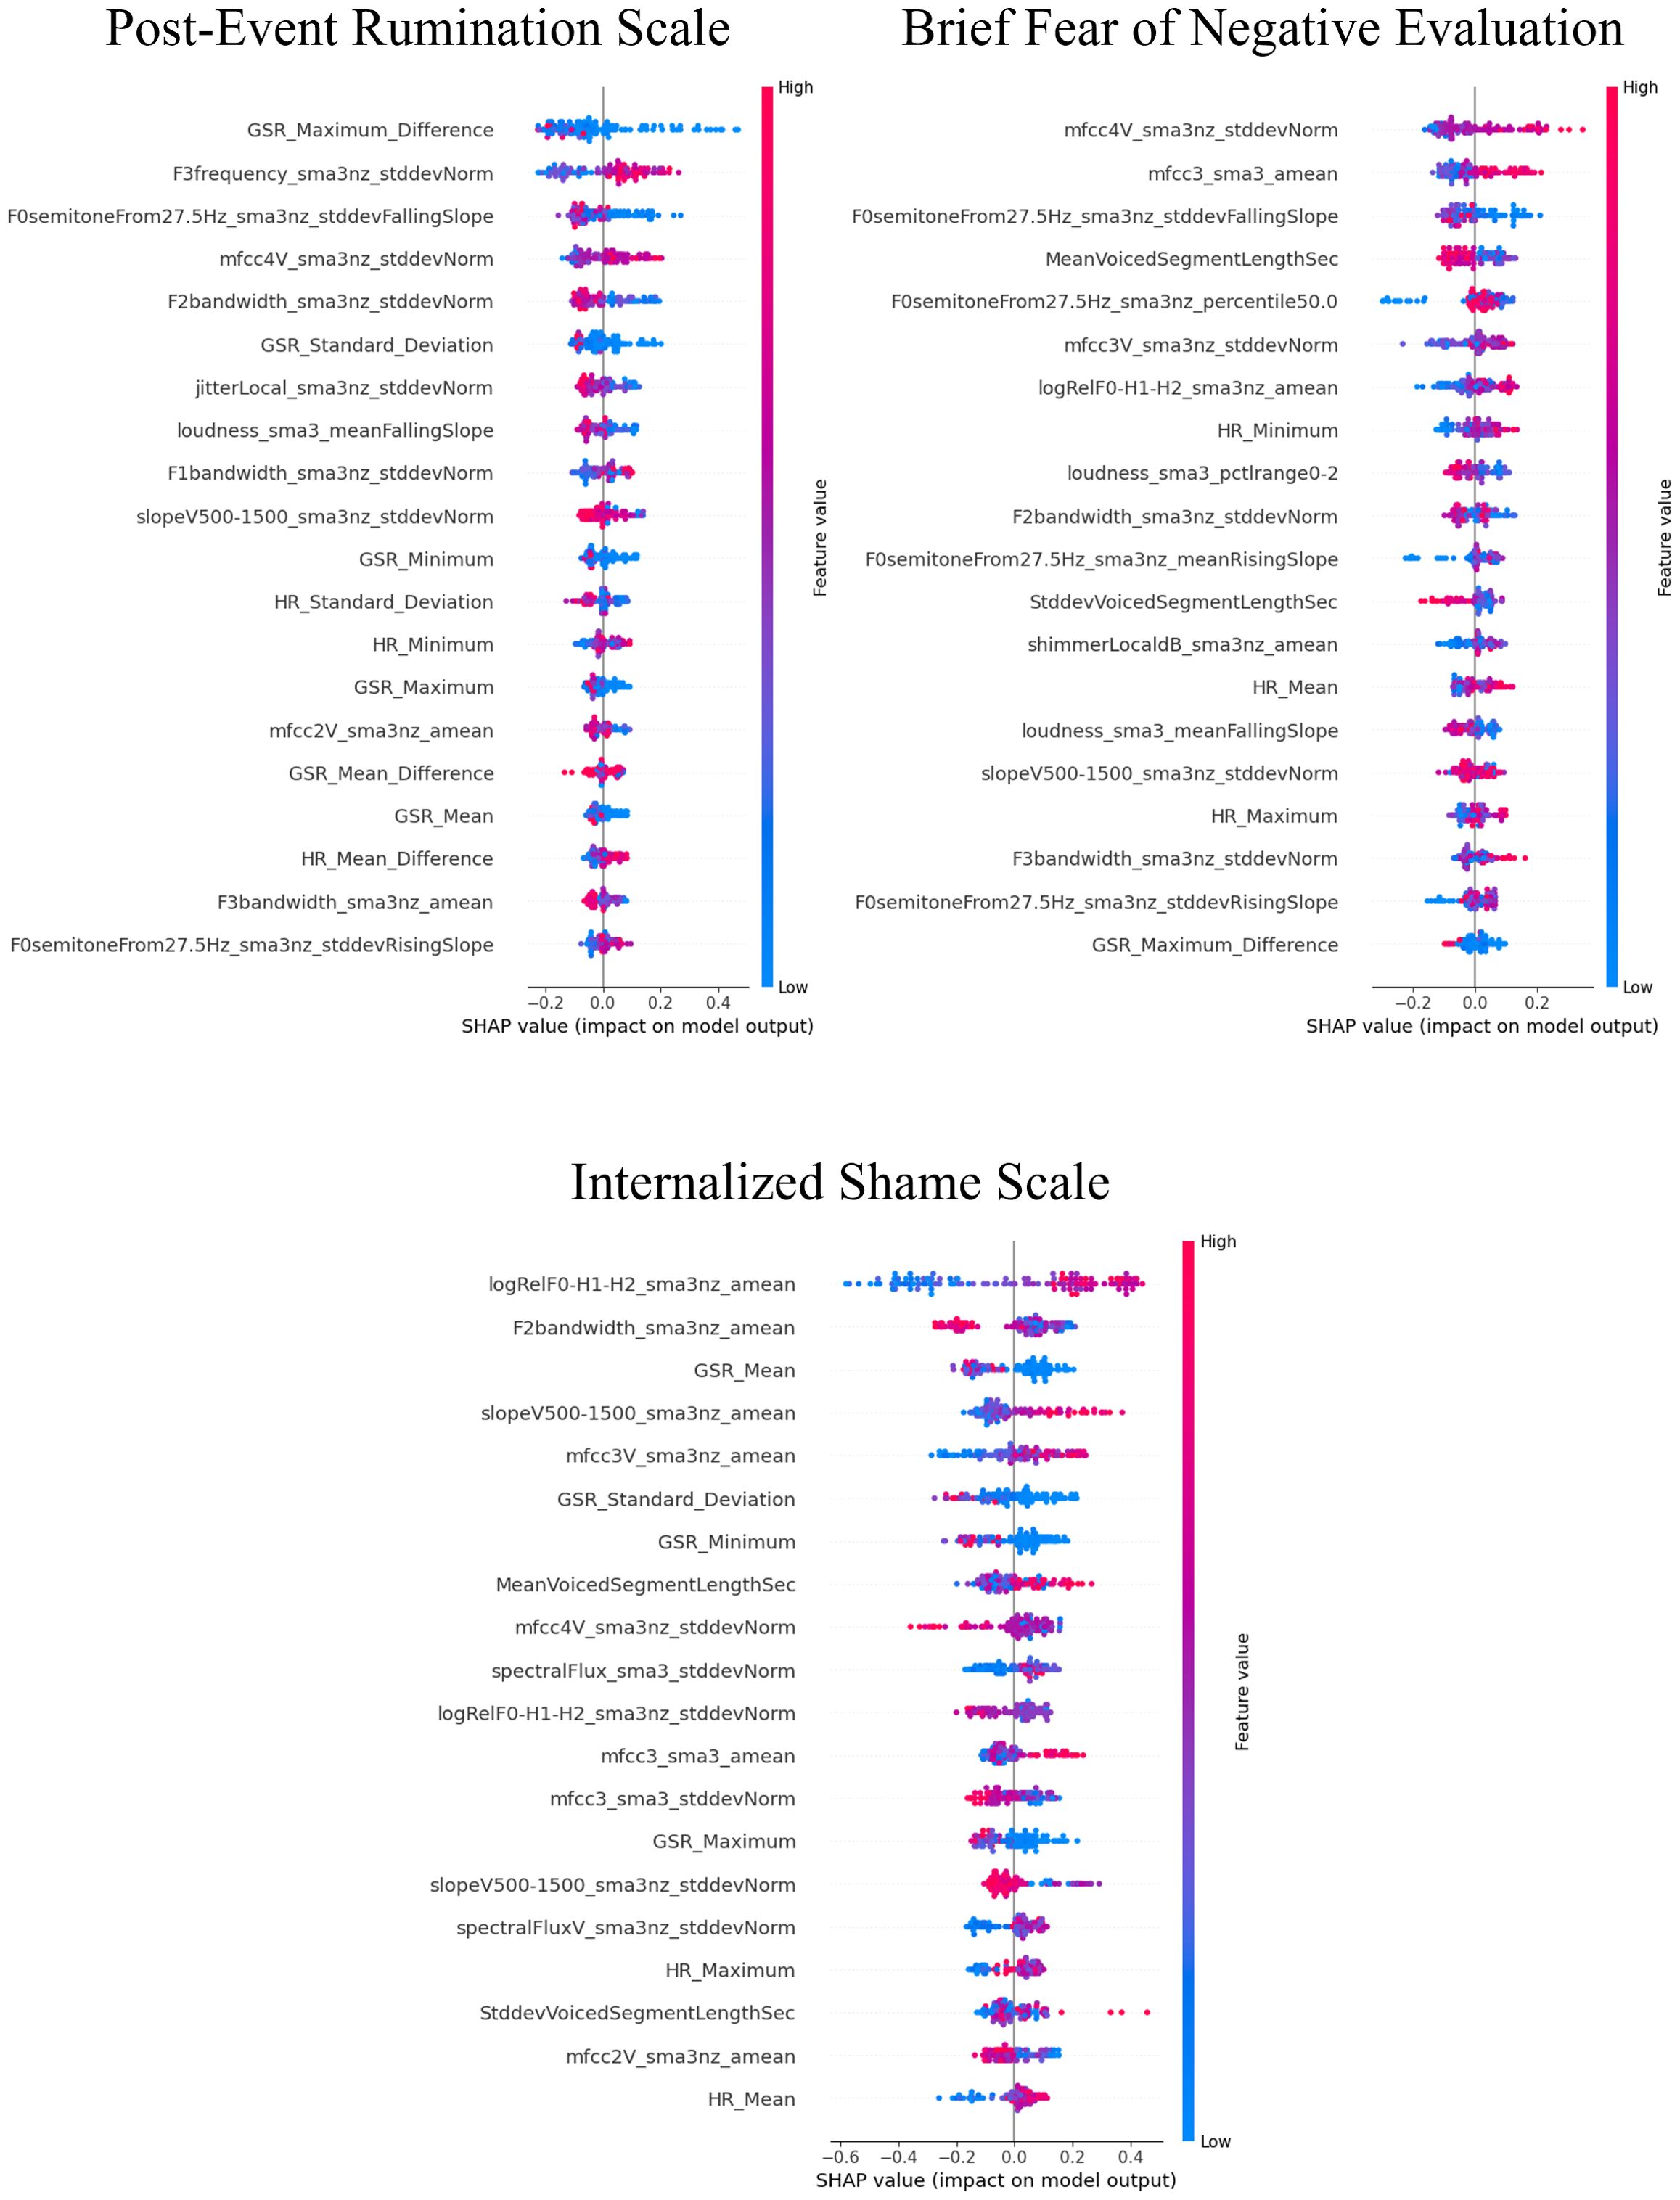
Figure 8. SHAP analysis: multimodal features impact on cognitive symptoms of SAD severity prediction. SHAP, shapley additive explanations; SAD, social anxiety disorder. This visual representation clearly demonstrated the impact of specific characteristics of multimodal features on model predictions across a range of clinical and psychological scales, with features listed in order of importance from the top of the y-axis.
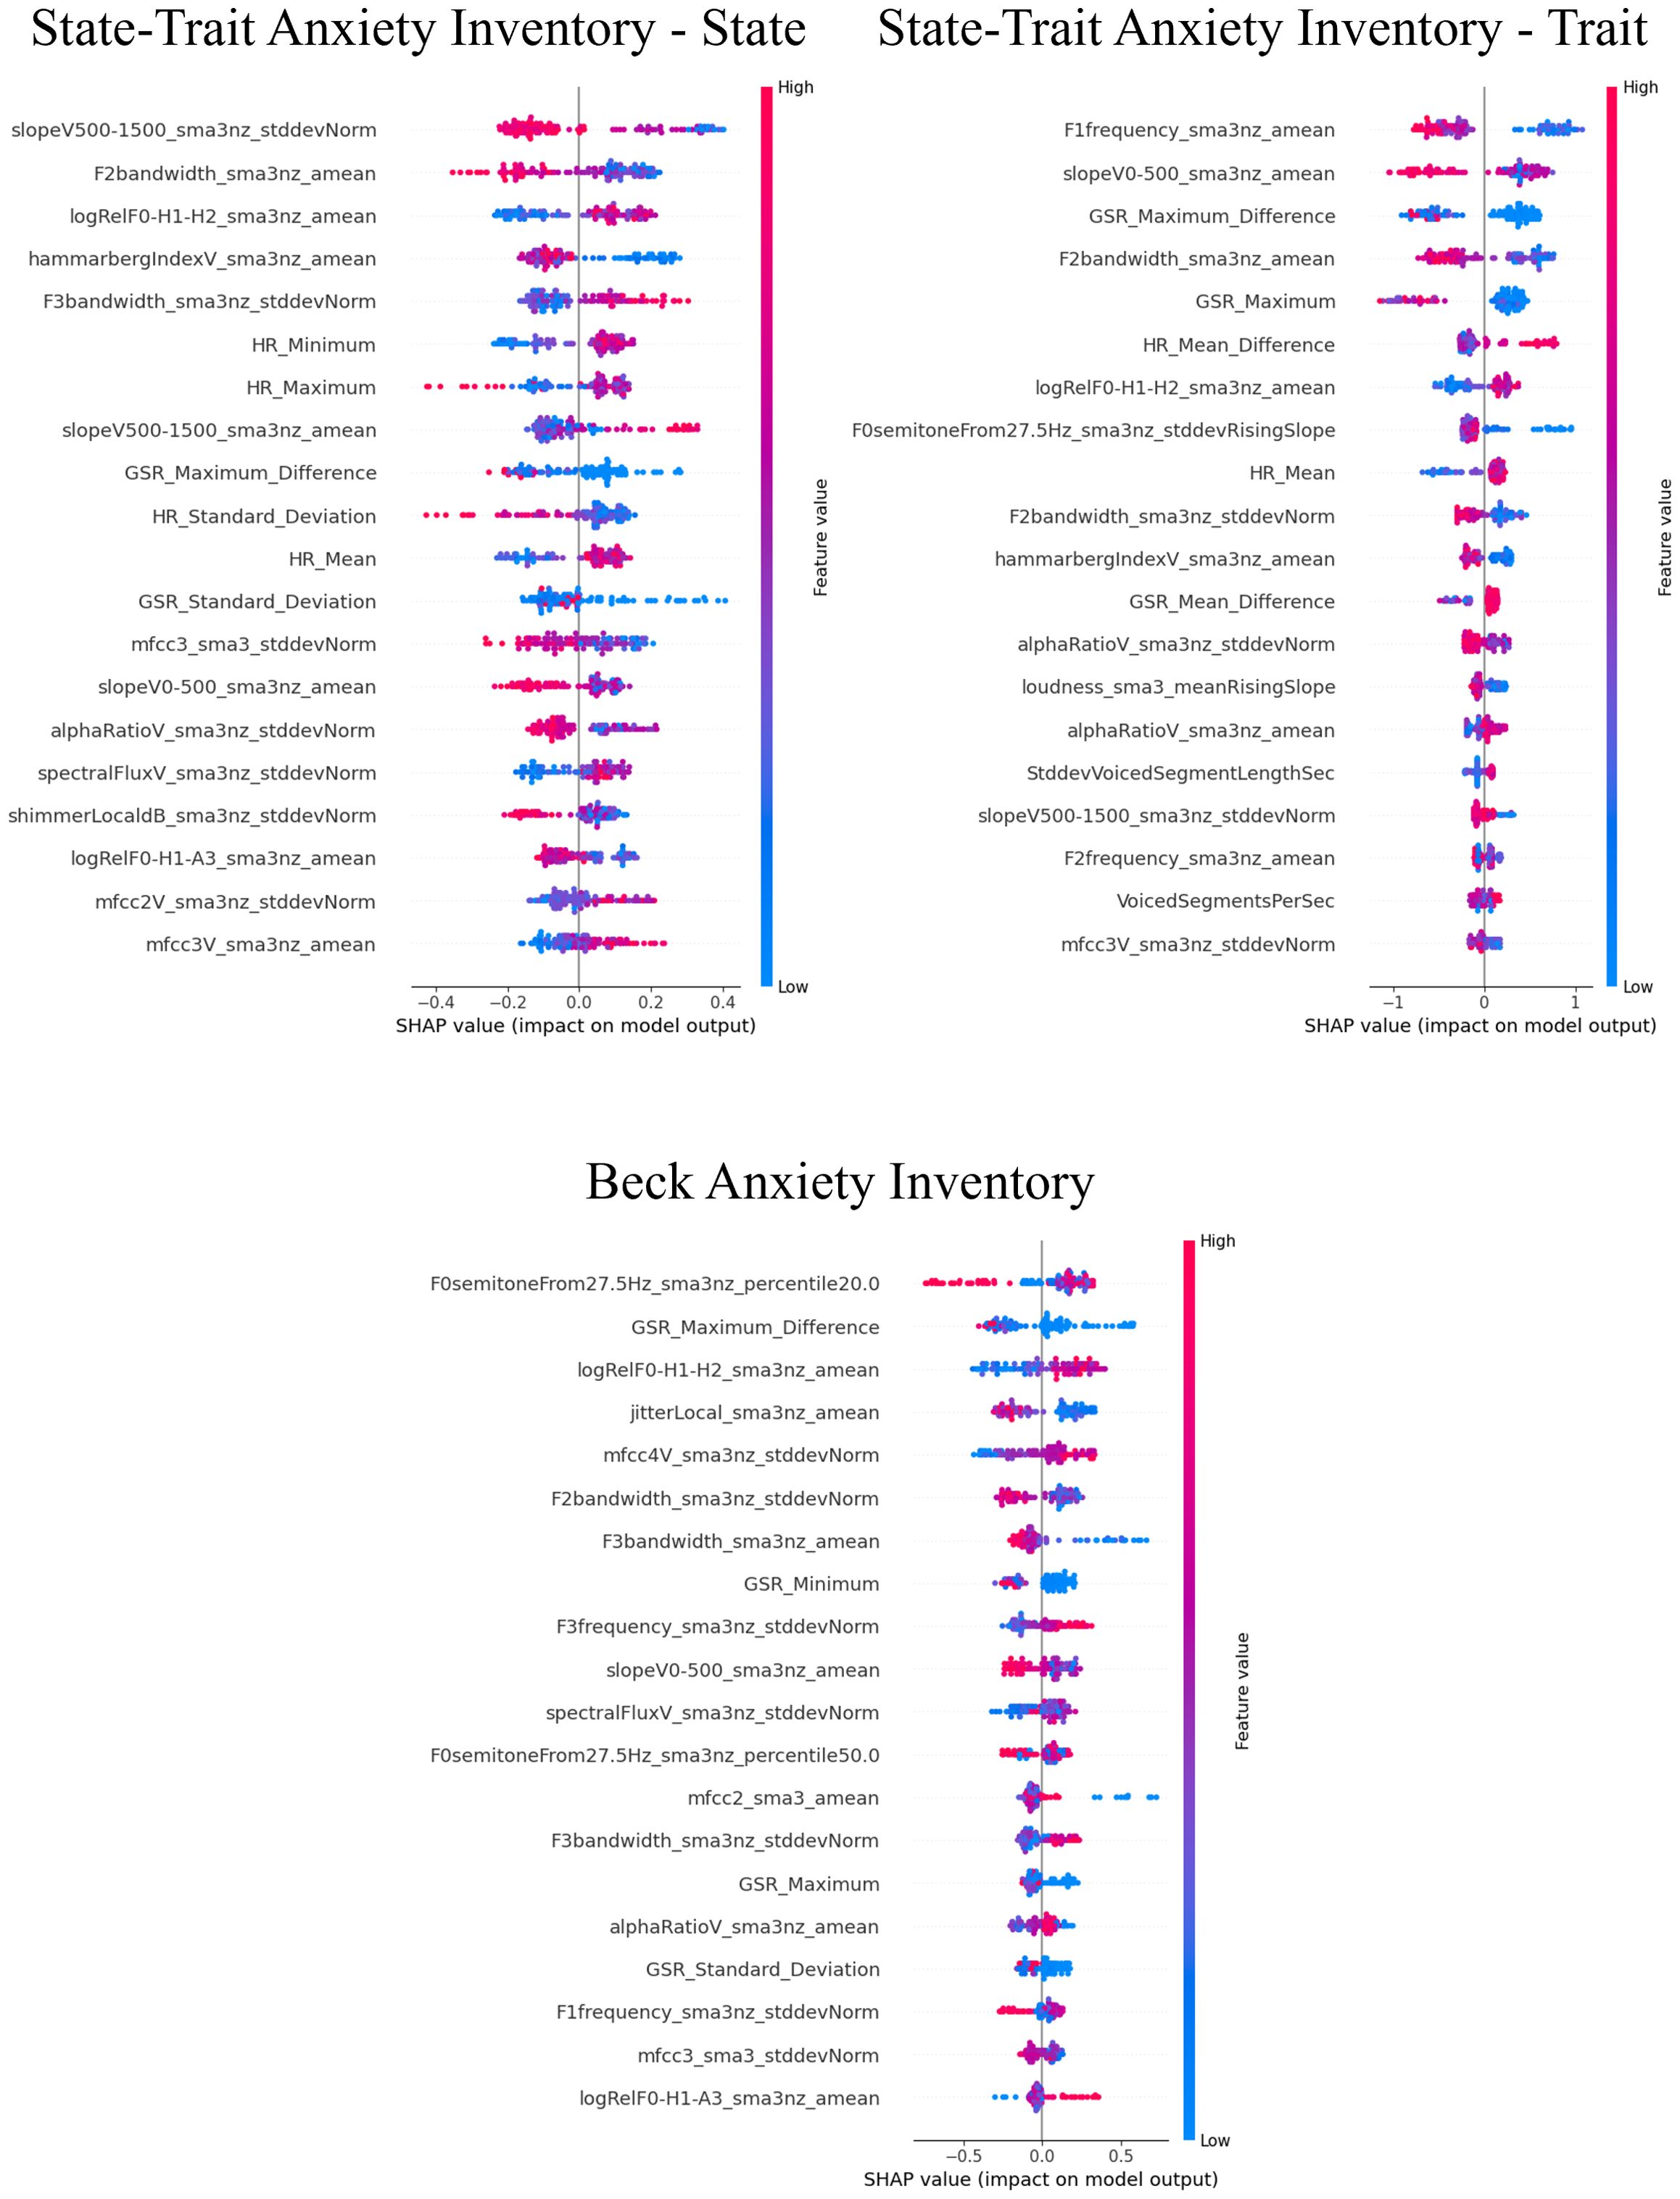
Figure 9. SHAP analysis: multimodal features impact on generalized anxiety severity prediction. SHAP, shapley additive explanations; SAD, social anxiety disorder. This visual representation clearly demonstrated the impact of specific characteristics of multimodal features on model predictions across a range of clinical and psychological scales, with features listed in order of importance from the top of the y-axis.
For the core symptoms of SAD, examining the top five features reveals that, aside from the Liebowitz Social Anxiety Scale, the mean and minimum values of HR exerted a significant influence on the predictions for the other three scales. In contrast, for the cognitive symptoms of SAD and the generalized anxiety, acoustic features played a major role in influencing the model’s predictions, apart from GSR.
This study aimed to examine the clinical utility of ML models using acoustic and physiological data, as well as combined multimodal data from VR sessions, as input data for the prediction of multifaceted SAD symptoms. The focus of this study was to address the potential of using multimodal features to build an ML model. Although models for the real time detection of the mental states of patients with anxiety have been widely developed, they have received relatively little attention in the development of symptom prediction models. This study aimed to identify individuals with severe symptoms in each SAD symptom domain. In general, study findings shed light on ML-driven identification of individuals who may not benefit from specific treatment settings, thereby helping clinicians have insights into ways to develop another approach for the treatment strategy.
In the burgeoning field of digital health, VR applications showcase their ability to elicit and modulate psychological responses in real time and integrate these data within an ML framework. To this end, ML-combined VRET systems have been developed to be predominantly capable of automatically detecting patients’ levels of anxiety (13, 64–66), arousal (12) and stress (67) in real-time, and to change subsequent scenarios depending on the detected patients’ state [i.e., VR-based biofeedback (12, 13)]. Concurrently, to extend this literature, the present study introduces a novel predictive model encompassing a range of SAD symptom facets and reports overall good performance with an average AUROC of 80.6% for multimodal ML models. It presents a diverse array of performance metrics across feature utilizations. This emphasizes the significance of AUROC as a measure of model performance at all threshold levels, providing insights into the influence of features on models that demonstrate high AUROC scores. Building on these findings, the CatBoost model demonstrated notable performance across various symptom domains of SAD, particularly in predicting severe cases of K-SPS and PERS, with AUROCs of 0.852 and 0.866, respectively. This superior performance can be attributed to CatBoost’s advanced algorithmic features, including its use of randomized permutations during training to mitigate overfitting and its capacity to effectively model high-order feature interactions. These characteristics are especially advantageous in multimodal datasets, where complex relationships between diverse features, such as psychological and physiological measures, must be captured (62). Overall, the results offer new promise for the development of ML models for classifying individuals at risk of not responding to ongoing treatment via the detection of those reporting greater severity in each symptom domain over therapy sessions.
The slight performance differences observed between stratified k-fold cross-validation and LOOCV suggest that the choice of validation method can influence model evaluation outcomes. While LOOCV provides a less biased estimate of performance by leveraging all available data for training, it can be computationally demanding. Stratified k-fold, on the other hand, mitigates potential class imbalance in the test folds, making it more suitable for datasets with uneven distributions. These findings underscore the need for methodologically robust approaches when evaluating machine learning models, particularly in small-scale studies like the present one (68). Future research should further explore how validation strategies influence generalizability and interpretability in similar contexts.
From an affective neuroscience perspective, as affective states are accompanied by significant physiological changes in human body, such as brain, heart, skin, blood flow, muscles and organs, their responses have been used as objective markers for identifying current mental states (69). In light of this, studies on VRET for patients with SAD have assessed physiological signals, particularly HR and GSR indices, for assessing anxiety states. Prior studies have shown that HR in patients with SAD significantly changed when confronting a conversation with avatars (70) and delivering a speech with increased virtual audiences (71). In terms of electrodermal activity, increased responses were synchronized with both increased negative affect and decreased positive affect (72) and observed when seeing a face with direct gaze (73). Our finding showing that the model utilizing physiological data alone achieved AUROC up to 0.754 is in alignment with previous findings.
The measurement of mental state has been significantly enhanced by leveraging diverse data streams. For instance, previous studies have presented ML models for detecting real time anxiety in patients by measuring the HR, GSR, blood volume pressure, skin temperature, and electroencephalography (13, 17, 64, 66). However, given that there have been few ML investigations on the potential of combining VRET and multimodality, this study was designed to describe an ML framework combined with multiple sources of information for the identification of at-risk patients. Consequently, the detection performance was superior when acoustic and physiological features were integrated. Specifically, AUROC ranged from 85.2% to 74.0%, comparable to previously reported values [i.e., accuracy, 89.5% (65), 86.3% (66), and 81% (64); AUROC, 0.86% (74)]. Regarding the notably powerful prediction for SPS, it is plausible that our VR content, which provides a self-introduction, could be particular to evaluating scrutiny fear (41), which is assessed by SPS, suggesting that the proposed algorithms might not be accurately predicted in other VRET scenarios. In summary, integrating multimodal data sources can significantly enhance our understanding of the ongoing patient symptomatology trajectories from a holistic perspective.
The results revealed that models utilizing acoustic features showed superior classification performance compared with those utilizing physiological features. Moreover, the interpretation provided by SHAP to obtain an overview of the important features in models with multimodal data highlighted that most predictors across a set of SAD symptoms were derived from audio data. Similarly, a previous study (75) reported that acoustic measures were better predictors of VRET effectiveness for mitigating public speaking anxiety than physiological measures. These findings corroborate an earlier finding that while physiological data (i.e., HR) are only predictive of task-induced stress levels in children with ASD, acoustic data are more predictive of ASD severity in both ASD and typically developing populations (76). Overall, physiological responses represent transient states of intense emotion (e.g., anxiety and stress), whereas voice acoustic changes may be more closely linked to the pathological development of psychiatric disorders.
Supporting this speculation, physiological responses such as HR and GSR are controlled by the autonomic nervous system, which is a part of the peripheral nervous system responsible for regulating involuntary physiological processes (77). Moreover, according to the James–Lange theory (78), emotional experience is largely due to the experience of physiological changes. Therefore, physiological responses strongly predict momentary emotional states. However, speech production involves not only a sound source (i.e., the larynx) coupled to a sound filter represented by the vocal tract airways [i.e., the oral and nasal cavities (79)], but also the engagement of widespread brain regions including several areas of the frontal lobe as well as cortico-subcortical loops traversing the thalamus and basal ganglia (80, 81). In particular, regions such as the amygdala, orbitofrontal cortex, and anterior cingulate cortex are involved in encoding the emotional valence of speech (82, 83). Meanwhile, dysfunction of such areas has been widely reported in patients with SAD (84, 85), suggesting a close link between acoustic characteristics and symptomatology of patients with SAD. In summary, our findings strongly support the integration of voice data to enhance the SAD status prediction.
An alternative explanation of the results regarding the accentuated power of acoustic over physiological data is that providing a speech in public, including a self-introduction, requires the engagement with active efforts to mitigate global physical and physiological changes that occur in the body, such as muscles, heart, and other important organs, in response to social threat and its consequence could be reflected on diverse voice metrics. For example, in terms of fundamental frequency (F0), one of the properties used in this study, its heightened value can be explained by increased vocal cord tension which is a plausible consequence of an increase in overall muscle tone, suggesting that freezing in response to social threat could lead to F0 alteration, alongside with increases in overall muscular tension (86). Similarly, the increase in lung pressure as a part of the body’s fight-flight response, mediated by the central nervous system regulation of the hypothalamic–pituitary–adrenal axis stress response, could also affect the increase in vocal intensity, as well as the delay in voice-onset-time (87, 88). Therefore, utilizing a variety of acoustic indices may provide more information about the pathological aspects of social anxiety than integrating a limited number of physiological indices, such as electrodermal and cardiovascular responses; yet, more studies are needed to understand which types of features are more critical than others for predicting SAD symptom trajectories.
Considering the generalizability of the study, it is important to note that our results were obtained from a relatively small sample of young adults with SAD. While our findings are promising, the limited sample size and specific demographic characteristics of our participants constrain the broad applicability of our models. Further research with larger and more diverse samples, involving patients with heterogeneous symptoms, is necessary to validate the robustness and reliability of these models across different populations with varying symptom profiles. Studies with other age ranges, such as adolescents and middle-aged and older adults with SA needed to improve the degree of generalization of the proposed ML models. Considering our findings from Korean sample comprising people who are well educated with relatively secure socioeconomic status, further external validation is required in order to generalize to other populations with different cultures and races. Moreover, implementing the proposed ML algorithms in other VR scenarios (e.g., providing public speeches or role-playing conversations) could be very challenging due to specificity of VR scenario employed in this study. Considering the scenario was specific to situation of a self-introduction in front of new colleagues, the proposed ML algorithms should be further validated with other anxiety-inducing contexts, such as shopping in a grocery store, conducting a job interview, providing a presentation in a business meeting, and attending a party. It is recognized that the reliance on binary classification limits the depth of analysis, particularly considering the complexity of SAD symptoms. Adopting a multiclass classification approach could provide a more nuanced perspective on symptom severity, thereby improving the capability to track symptom progression and tailor interventions more precisely. Future research should focus on developing and evaluating multiclass models to capture these varying severity levels, which would contribute significantly to precision psychiatry. Lastly, while physiological features such as HR and GSR provide valuable insights, the absence of continuous time-series analysis limits our understanding of dynamic symptom patterns. This limitation could be addressed in future research through the application of temporal data analysis techniques. Additionally, as HR data was not collected at a frequency of at least 100 Hz, performing a heart rate variability (HRV) analysis was not feasible, representing a limitation of the current study. Considering the important role of HRV as a biomarker to measure regularity of HR fluctuations (i.e., HR coherence) and as an indicator of autonomic regulation and the existing literature on associations not only between deep breathing and increased HRV, but also between pathological anxiety and reduced HRV, further incorporating HRV into the model may help improve predictive performance (89–92). Future research should incorporate high-frequency physiological measurements to facilitate HRV analysis and other temporal evaluations. Furthermore, incorporating multifaceted analyses of HR, GSR, and acoustic signals is recommended to develop a more comprehensive understanding of subjects’ responses over time. Moreover, integrating temporal analysis into real-time, adaptive VR therapy bridges the gap between static assessments and dynamic, patient-specific interventions. By leveraging temporal patterns, such as fluctuations in physiological and acoustic features, real-time adaptation of VR scenarios becomes possible.
Having carefully considered the challenges and limitations highlighted above, we present an abstract concept of ML-driven symptom prediction during mental health treatment, thereby helping clinicians follow patients’ therapeutic responses across therapy sessions without requiring a time-consuming evaluation procedure (i.e., traditional pen-and-paper assessment). The proposed concept will allow clinicians to explore whether patients respond to treatment, leading to important insights and providing the first steps toward precision psychiatry.
The datasets presented in this article are not readily available because of privacy concerns. Requests to access the datasets should be directed to ZGF2aWQwMjAzQGdtYWlsLmNvbQ==.
The studies involving humans were approved by the Institutional Review Board of the Korea University Anam Hospital. The studies were conducted in accordance with the local legislation and institutional requirements. The participants provided their written informed consent to participate in this study. Written informed consent was obtained from the individual(s) for the publication of any potentially identifiable images or data included in this article.
JP: Data curation, Formal analysis, Writing – original draft. YS: Formal analysis, Writing – original draft. DJ: Data curation, Writing – review & editing. JH: Data curation, Writing – review & editing. SP: Data curation, Writing – review & editing. HL: Supervision, Writing – review & editing. HL: Funding acquisition, Supervision, Writing – review & editing. CC: Funding acquisition, Supervision, Writing – review & editing.
The author(s) declare that financial support was received for the research, authorship, and/or publication of this article. This work was supported by the National Research Foundation (NRF) of Korea grants funded by the Ministry of Science and Information and Communications Technology (MSIT), Government of Korea (NRF-2021R1A5A8032895, RS-2024-00440371, and RS-2024-00469788), Information and Communications Technology and Future Planning for Convergent Research in the Development Program for R&D Convergence over Science and Technology Liberal Arts (NRF-2022M3C1B6080866), Institute of Information & Communications Technology Planning & Evaluation (IITP) grant funded by the Korea government (MSIT) (RS-2023-00224823), Korea Institute for Advancement of Technology grant funded by the Korean Government (MOTIE) (P0023675, HRD Program for Industrial Innovation), and “Development of AI Metaverse based Digital Health care and Mind care platform” of The Next-Generation Leading Technology Metaverse Project by Korea Radio Promotion Association.
The authors declare that the research was conducted in the absence of any commercial or financial relationships that could be construed as a potential conflict of interest.
The author(s) declare that no Generative AI was used in the creation of this manuscript.
All claims expressed in this article are solely those of the authors and do not necessarily represent those of their affiliated organizations, or those of the publisher, the editors and the reviewers. Any product that may be evaluated in this article, or claim that may be made by its manufacturer, is not guaranteed or endorsed by the publisher.
The Supplementary Material for this article can be found online at: https://www.frontiersin.org/articles/10.3389/fpsyt.2024.1504190/full#supplementary-material
1. Edition F. Diagnostic and statistical manual of mental disorders (5th ed.). Am Psychiatr Assoc. Arlington, VA: American Psychiatric Publishing (2013). doi: 10.1176/appi.books.9780890425596
2. Kessler RC, Berglund P, Demler O, Jin R, Merikangas KR, Walters EE. Lifetime prevalence and age-of-onset distributions of DSM-IV disorders in the National Comorbidity Survey Replication. Arch Gen Psychiatry. (2005) 62:593–602. doi: 10.1001/archpsyc.62.6.593
3. Hofmann SG, Smits JA. Cognitive-behavioral therapy for adult anxiety disorders: a meta-analysis of randomized placebo-controlled trials. J Clin Psychiatry. (2008) 69:621. doi: 10.4088/JCP.v69n0415
4. Vaswani M, Linda FK, Ramesh S. Role of selective serotonin reuptake inhibitors in psychiatric disorders: a comprehensive review. Prog Neuropsychopharmacol Biol Psychiatry. (2003) 27:85–102. doi: 10.1016/S0278-5846(02)00338-X
5. Cieślik B, Mazurek J, Rutkowski S, Kiper P, Turolla A, Szczepańska-Gieracha J. Virtual reality in psychiatric disorders: A systematic review of reviews. Complementary Therapies Med. (2020) 52:102480. doi: 10.1016/j.ctim.2020.102480
6. Emmelkamp PM, Meyerbröker K, Morina N. Virtual reality therapy in social anxiety disorder. Curr Psychiatry Rep. (2020) 22:1–9. doi: 10.1007/s11920-020-01156-1
7. Kampmann IL, Emmelkamp PM, Morina N. Meta-analysis of technology-assisted interventions for social anxiety disorder. J Anxiety Disord. (2016) 42:71–84. doi: 10.1016/j.janxdis.2016.06.007
8. Itani S, Rossignol M. At the crossroads between psychiatry and machine learning: Insights into paradigms and challenges for clinical applicability. Front Psychiatry. (2020) 11:552262. doi: 10.3389/fpsyt.2020.552262
9. Sun J, Dong Q-X, Wang S-W, Zheng Y-B, Liu X-X, Lu T-S, et al. Artificial intelligence in psychiatry research, diagnosis, and therapy. Asian J Psychiatry. (2023), 103705. doi: 10.1016/j.ajp.2023.103705
10. Cho G, Yim J, Choi Y, Ko J, Lee S-H. Review of machine learning algorithms for diagnosing mental illness. Psychiatry Invest. (2019) 16:262. doi: 10.30773/pi.2018.12.21.2
11. Zainal NH, Chan WW, Saxena AP, Taylor CB, Newman MG. Pilot randomized trial of self-guided virtual reality exposure therapy for social anxiety disorder. Behav Res Ther. (2021) 147:103984. doi: 10.1016/j.brat.2021.103984
12. Rahman MA, Brown DJ, Mahmud M, Harris M, Shopland N, Heym N, et al. Enhancing biofeedback-driven self-guided virtual reality exposure therapy through arousal detection from multimodal data using machine learning. Brain Informatics. (2023) 10:14. doi: 10.1186/s40708-023-00193-9
13. Bălan O, Moldoveanu A, Leordeanu M. A machine learning approach to automatic phobia therapy with virtual reality. In: Modern Approaches to Augmentation of Brain Function, ed. Opris I, Lebedev AM, Casanova FM. Cham: Springer International Publishing. (2021), 607–36. doi: 10.1007/978-3-030-54564-2_27
14. Halbig A, Latoschik ME. A systematic review of physiological measurements, factors, methods, and applications in virtual reality. Front Virtual Reality. (2021) 2:694567. doi: 10.3389/frvir.2021.694567
15. Lindner P, Miloff A, Hamilton W, Reuterskiöld L, Andersson G, Powers MB, et al. Creating state of the art, next-generation Virtual Reality exposure therapies for anxiety disorders using consumer hardware platforms: design considerations and future directions. Cogn Behav Ther. (2017) 46:404–20. doi: 10.1080/16506073.2017.1280843
16. Kerr JI, Weibel RP, Naegelin M, Ferrario A, SChinazi VR, La Marca R, et al. The effectiveness and user experience of a biofeedback intervention program for stress management supported by virtual reality and mobile technology: a randomized controlled study. BMC Digital Health. (2023) 1(1):42. doi: 10.1186/s44247-023-00042-z
17. Ding Y, Liu J, Zhang X, Yang Z. Dynamic tracking of state anxiety via multi-modal data and machine learning. Front Psychiatry. (2022) 13:757961. doi: 10.3389/fpsyt.2022.757961
18. Wallert J, Boberg J, Kaldo V, Mataix-Cols D, Flygare O, Crowley JJ, et al. Predicting remission after internet-delivered psychotherapy in patients with depression using machine learning and multi-modal data. Trans Psychiatry. (2022) 12:357. doi: 10.1038/s41398-022-02133-3
19. Cearns M, Opel N, Clark S, Kaehler C, Thalamuthu A, Heindel W, et al. Predicting rehospitalization within 2 years of initial patient admission for a major depressive episode: a multimodal machine learning approach. Trans Psychiatry. (2019) 9:285. doi: 10.1038/s41398-019-0615-2
20. Jung D, Choi J, Kim J, Cho S, Han S. EEG-based identification of emotional neural state evoked by virtual environment interaction. Int J Environ Res Public Health. (2022) 19:2158. doi: 10.3390/ijerph19042158
21. Kline A, Wang H, Li Y, Dennis S, Hutch M, Xu Z, et al. Multimodal machine learning in precision health: A scoping review. NPJ Digital Med. (2022) 5(1):171. doi: 10.1038/s41746-022-00712-8
22. Zhang D, Wang Y, Zhou L, Yuan H, Shen D. Multimodal classification of Alzheimer’s disease and mild cognitive impairment. NeuroImage. (2011) 55(3):856–67. doi: 10.1016/j.neuroimage.2011.01.008
23. Andrikopoulos D, Vassiliou G, Fatouros P, Tsirmpas C, Pehlivanidis A. Papageorgiou C. Machine learning-enabled detection of attention-deficit/hyperactivity disorder with multimodal physiological data: a case-control study. BMC Psychiatry. (2024) 24(1):547. doi: 10.1186/s12888-024-05987-7
24. Rapee RM, Heimberg RG. A cognitive-behavioral model of anxiety in social phobia. Behav Res Ther. (1997) 35(8):741–56. doi: 10.1016/S0005-7967(97)00022-3
25. Stein MB, Stein DJ. Social anxiety disorder. Lancet. (2008) 371:1115–25. doi: 10.1016/S0140-6736(08)60488-2
26. Hofmann SG. Cognitive factors that maintain social anxiety disorder: A comprehensive model and its treatment implications. Cogn Behav Ther. (2007) 36:193–209. doi: 10.1080/16506070701421313
27. Joesch JM, Golinelli D, Sherbourne CD, Sullivan G, Stein MB, Craske MG, et al. Trajectories of change in anxiety severity and impairment during and after treatment with evidence-based treatment for multiple anxiety disorders in primary care. Depression Anxiety. (2013) 30:1099–106. doi: 10.1002/da.2013.30.issue-11
28. Kaiser T, Volkmann C, Volkmann A, Karyotaki E, Cuijpers P, Brakemeier E-L. Heterogeneity of treatment effects in trials on psychotherapy of depression. Clin Psychology: Sci Practice. (2022) 29:294. doi: 10.1037/cps0000079
29. Skelton M, Carr E, Buckman JE, Davies MR, Goldsmith KA, Hirsch CR, et al. Trajectories of depression and anxiety symptom severity during psychological therapy for common mental health problems. psychol Med. (2023) 53:6183–93. doi: 10.1017/S0033291722003403
30. Lutz W, Stulz N, Köck K. Patterns of early change and their relationship to outcome and follow-up among patients with major depressive disorders. J Affect Disord. (2009) 118:60–8. doi: 10.1016/j.jad.2009.01.019
31. Skriner LC, Chu BC, Kaplan M, Bodden DH, Bögels SM, Kendall PC, et al. Trajectories and predictors of response in youth anxiety CBT: Integrative data analysis. J consulting Clin Psychol. (2019) 87:198. doi: 10.1037/ccp0000367
32. Cumpanasoiu DC, Enrique A, Palacios JE, Duffy D, McNamara S, Richards D. Trajectories of symptoms in digital interventions for depression and anxiety using routine outcome monitoring data: Secondary analysis study. JMIR mHealth uHealth. (2023) 11:e41815. doi: 10.2196/41815
33. Bauer-Staeb C, Griffith E, Faraway JJ, Button KS. Trajectories of depression and generalised anxiety symptoms over the course of cognitive behaviour therapy in primary care: An observational, retrospective cohort. psychol Med. (2023) 53:4648–56. doi: 10.1017/S0033291722001556
34. Yoo S-W, Kim Y-S, Noh J-S, Oh K-S, Kim C-H, NamKoong K, et al. Validity of Korean version of the mini-international neuropsychiatric interview. Anxiety mood. (2006) 2:50–5.
35. Lee J, Choi C. A study of the reliability and the validity of the Korean versions of Social Phobia Scales (K-SAD, K-FNE). Korean J Clin Psychol. (1997) 16:251–64.
36. Choe A HS, Kim J, Park K, Chey J, Hong S. Validity of the K-WAIS-IV short forms. Korean J Clin Psychol. (2014) 33:413–28. doi: 10.15842/kjcp.2014.33.2.011
37. Kim H-J, Lee S, Jung D, Hur J-W, Lee H-J, Lee S, et al. Effectiveness of a participatory and interactive virtual reality intervention in patients with social anxiety disorder: longitudinal questionnaire study. J Med Internet Res. (2020) 22:e23024. doi: 10.2196/23024
38. Watkins LL, Grossman P, Krishnan R, Sherwood A. Anxiety and vagal control of heart rate. Psychosomatic Med. (1998) 60:498–502. doi: 10.1097/00006842-199807000-00018
39. Naveteur J, Baque EFI. Individual differences in electrodermal activity as a function of subjects’ anxiety. Pers Individ differences. (1987) 8:615–26. doi: 10.1016/0191-8869(87)90059-6
40. Christian C, Cash E, Cohen DA, Trombley CM, Levinson CA. Electrodermal activity and heart rate variability during exposure fear scripts predict trait-level and momentary social anxiety and eating-disorder symptoms in an analogue sample. Clin psychol Science. (2023) 11:134–48. doi: 10.1177/21677026221083284
41. Mattick RP, Clarke JC. Development and validation of measures of social phobia scrutiny fear and social interaction anxiety. Behav Res Ther. (1998) 36:455–70. doi: 10.1016/S0005-7967(97)10031-6
42. Kim H. Memory bias in subtypes of social phobia (Masters thesis). Seoul, South Korea: Seoul National University (2001).
43. Liebowitz MR. Social phobia. Modern problems pharmacopsychiatry. (1987) 22:e173. doi: 10.1159/000414022
44. Yu E, Ahn C, Park K. Factor structure and diagnostic efficiency of a Korean version of the Liebowitz social anxiety scale. Korean J Clin Psychol. (2007) 26:251–70. doi: 10.15842/kjcp.2007.26.1.015
45. Watson D, Friend R. Measurement of social-evaluative anxiety. J consulting Clin Psychol. (1969) 33:448. doi: 10.1037/h0027806
46. Heimberg RG, Becker RE. Cognitive-behavioral group therapy for social phobia. In: Basic mechanisms and clinical strategies. New York: Guilford Press (2002).
47. Abbott MJ, Rapee RM. Post-event rumination and negative self-appraisal in social phobia before and after treatment. J Abnormal Psychol. (2004) 113:136. doi: 10.1037/0021-843X.113.1.136
48. Lim S, Kwon S, Choi H. The influence of post-event rumination on social self-efficacy & Anticipatory anxiety. Korean J Clin Psychol. (2007) 26:39–56. doi: 10.15842/kjcp.2007.26.1.003
49. Cook DR. Measuring shame: The internalized shame scale. In: The treatment of shame and guilt in alcoholism counseling. New York: Routledge (2013). p. 197–215.
50. Lee I, Choi H. Assessment of shame and its relationship with maternal attachment, hypersensitive narcissism and loneliness. Korean J Couns Psychotherapy. (2005) 17:651–70.
51. Spielberger CD, Gonzalez-Reigosa F, Martinez-Urrutia A, Natalicio LF, Natalicio DS. The state-trait anxiety inventory. Rev Interamericana Psicologia/Interamerican J Psychol. (1971) 5:145–58.
53. Beck AT, Epstein N, Brown G, Steer RA. An inventory for measuring clinical anxiety: psychometric properties. J consulting Clin Psychol. (1988) 56:893. doi: 10.1037/0022-006X.56.6.893
54. Yook SP, Kim Z. A clinical study on the Korean version of Beck Anxiety Inventory: comparative study of patient and non-patient. Korean J Clin Psychol. (1997) 16:185–97.
55. Eyben F, Scherer KR, Schuller BW, Sundberg J, André E, Busso C, et al. The Geneva minimalistic acoustic parameter set (GeMAPS) for voice research and affective computing. IEEE Trans Affect computing. (2015) 7:190–202. doi: 10.1109/TAFFC.2015.2457417
56. Eyben F, Wöllmer M, Schuller B eds. Opensmile: the munich versatile and fast open-source audio feature extractor. In: Proceedings of the 18th ACM international conference on Multimedia.
57. Kenward MG, Molenberghs G. Last observation carried forward: a crystal ball? J biopharmaceutical Stat. (2009) 19:872–88.
58. Barbato G, Barini E, Genta G, Levi R. Features and performance of some outlier detection methods. J Appl Statistics. (2011) 38:2133–49. doi: 10.1080/02664763.2010.545119
60. Chen T, Guestrin C eds. Xgboost: A scalable tree boosting system. In: Proceedings of the 22nd acm sigkdd international conference on knowledge discovery and data mining.
61. Ke G, Meng Q, Finley T, Wang T, Chen W, Ma W, et al. Lightgbm: A highly efficient gradient boosting decision tree. Adv Neural Inf Process Syst. (2017) 30.
62. Prokhorenkova L, Gusev G, Vorobev A, Dorogush AV, Gulin A. CatBoost: unbiased boosting with categorical features. Adv Neural Inf Process Syst. (2018) 31. doi: 10.48550/arXiv.1706.09516
63. Lundberg S. A unified approach to interpreting model predictions. arXiv preprint arXiv:170507874. (2017).
64. Petrescu L, Petrescu C, Mitruț O, Moise G, Moldoveanu A, Moldoveanu F, et al. Integrating biosignals measurement in virtual reality environments for anxiety detection. Sensors. (2020) 20:7088. doi: 10.3390/s20247088
65. Bălan O, Moise G, Moldoveanu A, Leordeanu M, Moldoveanu F. An investigation of various machine and deep learning techniques applied in automatic fear level detection and acrophobia virtual therapy. Sensors. (2020) 20:496. doi: 10.3390/s20020496
66. Šalkevicius J, Damaševičius R, Maskeliunas R, Laukienė I. Anxiety level recognition for virtual reality therapy system using physiological signals. Electronics. (2019) 8:1039. doi: 10.3390/electronics8091039
67. Cho D, Ham J, Oh J, Park J, Kim S, Lee N-K, et al. Detection of stress levels from biosignals measured in virtual reality environments using a kernel-based extreme learning machine. Sensors. (2017) 17:2435. doi: 10.3390/s17102435
68. Yates LA, Aandahl Z, Richards SA, Brook BW. Cross validation for model selection: A review with examples from ecology. Ecol Monogr. (2023) 93(1):e1557. doi: 10.1002/ecm.v93.1
69. McGaugh JL. Emotions and bodily responses: A psychophysiological approach. New York: Academic Press (2013).
70. Slater M, Guger C, Edlinger G, et al. Analysis of physiological responses to a social situation in an immersive virtual environment. Presence. (2006) 15:553–69. doi: 10.1162/pres.15.5.553
71. Mostajeran F, Balci MB, Steinicke F, Kühn S, Gallinat J. The effects of virtual audience size on social anxiety during public speaking, in: The proceeding of the 2020 IEEE Conference on Virtual Reality and 3D User Interfaces (VR), Atlanta, GA, USA, March 2020. IEEE (2020), 303–12.
72. Moscovitch DA, Suvak MK, Hofmann SG. Emotional response patterns during social threat in individuals with generalized social anxiety disorder and non-anxious controls. J Anxiety Disord. (2010) 24:785–91. doi: 10.1016/j.janxdis.2010.05.013
73. Myllyneva A, Ranta K, Hietanen JK. Psychophysiological responses to eye contact in adolescents with social anxiety disorder. Biol Psychol. (2015) 109:151–58. doi: 10.1016/j.biopsycho.2015.05.005
74. Ihmig FR, Neurohr-Parakenings F, Schäfer SK, Lass-Hennemann J, Michael T. On-line anxiety level detection from biosignals: Machine learning based on a randomized controlled trial with spider-fearful individuals. PloS One. (2020) 15:e0231517. doi: 10.1371/journal.pone.0231517
75. Springer A, Dillon R, Teoh AN, Dillon D eds. Detecting public speaking stress via real-time voice analysis in virtual reality: A Review. In: Sustainability, Economics, Innovation, Globalisation and Organisational Psychology Conference. Singapore: Springer.
76. Bone D, Mertens J, Zane E, Lee S, Narayanan SS, Grossman RB eds. Acoustic-prosodic and physiological response to stressful interactions in children with autism spectrum disorder. In: INTERSPEECH.
77. Waxenbaum JA, Reddy V, Varacallo M. Anatomy, autonomic nervous system. In: StatPearls. Treasure Island, FL: StatPearls Publishing. (2019).
78. Lange CG. The mechanism of the emotions. The classical psychologists. Boston: Houghton Mifflin (1885). p. 672–84.
79. Honda K. Physiological processes of speech production. In: Springer handbook of speech processing. Berlin, Heidelberg: Springer (2008). p. 7–26.
80. Ackermann H. Cerebellar contributions to speech production and speech perception: psycholinguistic and neurobiological perspectives. Trends neurosciences. (2008) 31:265–72. doi: 10.1016/j.tins.2008.02.011
82. Martin C, Quiñones I, Carreiras M. Humans in love are singing birds: socially-mediated brain activity in language production. Neurobiol Language. (2023) 4:501–15. doi: 10.1162/nol_a_00112
83. Westermann B, Lotze M, Varra L, Versteeg N, Domin M, Nicolet L, et al. When laughter arrests speech: fMRI-based evidence. Philos Trans R Soc B. (2022) 377:20210182. doi: 10.1098/rstb.2021.0182
84. Hahn A, Stein P, Windischberger C, Weissenbacher A, Spindelegger C, Moser E, et al. Reduced resting-state functional connectivity between amygdala and orbitofrontal cortex in social anxiety disorder. Neuroimage. (2011) 56:881–9. doi: 10.1016/j.neuroimage.2011.02.064
85. Klumpp H, Angstadt M, Phan KL. Insula reactivity and connectivity to anterior cingulate cortex when processing threat in generalized social anxiety disorder. Biol Psychol. (2012) 89:273–6. doi: 10.1016/j.biopsycho.2011.10.010
86. Scherer KR, Zei B. Vocal indicators of affective disorders. Psychother Psychosomatics. (1988) 49:179–86. doi: 10.1159/000288082
87. Gunnar M, Quevedo K. The neurobiology of stress and development. Annu Rev Psychol. (2007) 58:145–73. doi: 10.1146/annurev.psych.58.110405.085605
88. Giddens CL, Barron KW, Byrd-Craven J, Clark KF, Winter AS. Vocal indices of stress: A review. J Voice. (2013) 27(3):390.e21–90.e29. doi: 10.1016/j.jvoice.2012.12.010
89. Mujica-Parodi LR, Korgaonkar M, Ravindranath B, Greenberg T, Tomasi D, Wagshul M, et al. Limbic dysregulation is associated with lowered heart rate variability and increased trait anxiety in healthy adults. Hum Brain Mapp. (2009) 30(1):47–58. doi: 10.1002/hbm.20483
90. Bradley RT, McCraty R, Atkinson M, Tomasino D, Daugherty A, Arguelles L. Emotion self-regulation, psychophysiological coherence, and test anxiety: results from an experiment using electrophysiological measures. Appl Psychophysiol Biofeedback. (2010) 35(4):261–83. doi: 10.1007/s10484-010-9134-x
91. Tharion E, Samuel P, Rajalakshmi R, Gnanasenthil G, Subramanian RK. Influence of deep breathing exercise on spontaneous respiratory rate and heart rate variability: a randomised controlled trial in healthy subjects. Indian J Physiol Pharmacol. (2012) 56:80–7.
Keywords: machine learning, multimodal data, digital phenotyping, digital psychiatry, social anxiety disorder, virtual reality intervention, anxiety prediction
Citation: Park J-H, Shin Y-B, Jung D, Hur J-W, Pack SP, Lee H-J, Lee H and Cho C-H (2025) Machine learning prediction of anxiety symptoms in social anxiety disorder: utilizing multimodal data from virtual reality sessions. Front. Psychiatry 15:1504190. doi: 10.3389/fpsyt.2024.1504190
Received: 30 September 2024; Accepted: 09 December 2024;
Published: 07 January 2025.
Edited by:
Rosa M. Baños, University of Valencia, SpainReviewed by:
Pietro Cipresso, University of Turin, ItalyCopyright © 2025 Park, Shin, Jung, Hur, Pack, Lee, Lee and Cho. This is an open-access article distributed under the terms of the Creative Commons Attribution License (CC BY). The use, distribution or reproduction in other forums is permitted, provided the original author(s) and the copyright owner(s) are credited and that the original publication in this journal is cited, in accordance with accepted academic practice. No use, distribution or reproduction is permitted which does not comply with these terms.
*Correspondence: Hwamin Lee, aHdhbWluQGtvcmVhLmFjLmty; Chul-Hyun Cho, ZGF2aWQwMjAzQGtvcmVhLmFjLmty; ZGF2aWQwMjAzQGdtYWlsLmNvbQ==
†These authors have contributed equally to this work
Disclaimer: All claims expressed in this article are solely those of the authors and do not necessarily represent those of their affiliated organizations, or those of the publisher, the editors and the reviewers. Any product that may be evaluated in this article or claim that may be made by its manufacturer is not guaranteed or endorsed by the publisher.
Research integrity at Frontiers

Learn more about the work of our research integrity team to safeguard the quality of each article we publish.