 Aliza Pradhan1*
 Jagadish Rane1,2
 P. S. Basavaraj1
 Neeraj Kumar1
 Dhanashri Shid1
 Nobin C. Paul1
 K. K. Pal1
 K. Sammi Reddy1
- 1School of Drought Stress Management, ICAR-National Institute of Abiotic Stress Management, Pune, Maharashtra, India
- 2ICAR-Central Institute for Arid Horticulture, Bikaner, Rajasthan, India
Introduction: Recently, quinoa (Chenopodium quinoa Willd.) has gained global recognition as a nutritious, adaptable crop suitable to adverse soil and climatic conditions. However, knowledge about optimal management practices for its cultivation in marginal areas of India is limited.
Methods: In this context, a field experiment was conducted in a split-split plot design with four sowing dates (D1: 1st November; D2: 15th November; D3: 1st December, D4: 15th December) in main plots, two irrigation levels (I1: 40% ETc; I2: 80% ETc) in sub-plots, and three nitrogen doses (N1: 100 kg N ha-1; N2: 150 kg N ha-1; N3: 200 kg N ha-1) in sub-sub plots having three replications during 2021-22 and 2022-23 in shallow basaltic murram soils.
Results and discussion: Results indicated that sowing on 1st November yielded the highest seed production of 1446 kg ha-1, as temperatures aligned closely with optimal growth conditions. Quinoa's drought tolerance meant that deficit irrigation was able to maintain the crop growth and yield. While the crop responded positively to higher N doses, the study found that applying 100 kg N ha-1 was optimal, considering shallow basaltic soil conditions and potential lodging issues. Additionally, water productivity, protein, and saponin content reflected similar trends to seed yield. The results suggested that early sowing, irrigation at 40% ETc, and 100 kg N ha-1 produced a seed yield of 1446 kg ha-1, demonstrating higher carbon efficiency and sustainability while minimizing N2O emissions. However, these strategies should be tailored to specific agro-ecological conditions. Overall, the findings confirm quinoa’s potential for cultivation in India’s 26 million hectares of shallow basaltic murram soils, where other crops may not thrive economically.
1 Introduction
Recently, global agriculture has been emphasized by adopting climate-resilient and environmentally sustainable practices while aiming to reduce low greenhouse gas and carbon emissions. However, the dilemma lies between feeding a growing population and depletion of its natural resource base, particularly in water-scarce environments of semi-arid and arid regions. In emerging economies experiencing population growth like India, there is an urgent need to address food and nutrition demands amid climate variability (Srivastava et al., 2022). In this context, encouraging climate-smart, nutritious crop production systems is crucial for providing accessible, affordable, safe, and nutritious diets for communities. In recent years, quinoa (Chenopodium quinoa Willd.) has been gaining global attention as a highly nutritious agro-industrial crop, capable of thriving in adverse soil and climatic conditions (Fuentes and Bhargava, 2011; Hinojosa et al., 2018; Langyan et al., 2023). Due to its stress tolerance mechanism and minimal water requirement (300–400 mm), the crop is considered highly suitable for marginal areas of arid and semi-arid regions (Bhargava et al., 2006). Compared to dominant cereals such as rice, wheat, and maize, quinoa stands out as a gluten-free pesudocereal 1 rich in protein (13%–17%), well-balanced amino acids, essential vitamins, minerals, and bioactive compounds (Sindhu and Khatkar, 2019). Although quinoa's outer seed coat contains the bitter toxic compound saponin (0.1%–5%), which must be removed before consumption, it has significant industrial value due to its diverse biological activities, including antifungal, antiviral, anticancer, hypocholesterolemic, hypoglycemic, antithrombotic, diuretic, and anti-inflammatory effects (Vilcacundo and Hernández-Ledesma, 2016). Quinoa's resilience and superior nutritional profile have positioned it as a promising crop to combat silent hunger and malnutrition while reducing the global food environmental footprint (FAO, 2011). Further, cultivation of the crop demands minimal investment, and its yield potential could enhance farmers' profitability and resilience in climate change-affected environments.
Since the United Nations' declaration of the International Year of Quinoa in 2013, there has been a rapid expansion in the cultivated area dedicated to this crop, shifting perceptions and elevating its status from a minor to a potentially major crop (Bazile et al., 2016). With the expansion of quinoa cultivation to over 120 countries, most of the scientific studies have focused on location-specific technological aspects of crop production. While quinoa is well-suited to a variety of agro-climatic conditions, identifying the optimal planting date is crucial for successful cultivation in a given region. Most studies have suggested that the sowing window from October to December is ideal, with November being the optimal planting month in arid and semi-arid regions (Ramesh et al., 2019; Maamri et al., 2022). However, a few studies have highlighted January (Asher et al., 2020), as well as March–May, as preferable sowing windows for the crop (Taaime et al., 2023). Additionally, the stabilization of quinoa yields through deficit irrigation has been emphasized in studies by Garcia et al. (2003), Geerts et al. (2008); Pathan et al. (2023), and Mirsafi et al. (2024). Regarding nitrogen fertilization, research indicates an optimal nitrogen rate ranging from 90 kg N ha−1 to 225 kg N ha−1, depending on cultivar, management practices, and soil and environmental conditions (Kaul et al., 2005; Salim et al., 2019; Berti et al., 2000; Wang et al., 2020; Keshtkar et al., 2022). However, a positive increase in seed yield with higher irrigation levels combined with increased nitrogen doses has been reported by Bahrami et al. (2022) and AbdElgalil et al (2023). Further, Bhargava et al. (2006) highlighted quinoa's potential for both agricultural and industrial applications, particularly in India. Given that a substantial portion of the Indian population lacks access to protein-rich diets, quinoa's proteinaceous seed could significantly contribute to addressing hunger. The study also emphasized exploring the commercial potential of the crop for product development and marketing. However, to date, there have been limited developments in terms of quinoa's adaptation in India, despite the country's arid and marginal environments.
Edaphic constraints, such as shallow (26.4 million ha) and low-fertility soils (49.7 million ha), particularly in water-scarce and drought-prone agro-ecologies of peninsular India (Minhas and Obi Reddy, 2017), highlight the need for alternative crop-based interventions. Hence, this study was conducted to explore quinoa production techniques focusing on optimizing the sowing date, irrigation, and nitrogen management to ensure successful quinoa production in water-scarce marginal environments. The specific objective of our study was to assess the impact of these crop management strategies on quinoa yield, water productivity, quality, and environmental sustainability in shallow basaltic semi-arid regions.
2 Materials and methods
2.1 Study site
The field experiment was carried out during 2021–2022 and 2022–2023 at ICAR-National Institute of Abiotic Stress Management (NIASM), India (18°09′30.62″ N latitude and 74°30′30.08″ E longitude, altitude of 570 m above mean sea level) (Figure 1). The site falls within the hot semi-arid agro-ecological region in the Deccan Plateau of India, known for its extremely high temperatures, unpredictable rainfall patterns, and extended periods of dry weather (Pradhan et al., 2023). Its long-term average annual rainfall is 576 mm, 70% of which occurs during June–September as southwest monsoons and 21% during October–December as retreating monsoons. The average values for temperature (maximum and minimum), relative humidity (maximum and minimum), and total rainfall and open pan evaporation during the crop growing periods (November–March) were 30.8°C and 15.7°C, 84% and 39%, and 8.2 and 23.0 mm during 2021–2022 and 31.5°C and 14.3°C, 79.9% and 30.4%, and 7.8 mm and 25.1 mm during 2022–2023, respectively (Automatic Weather Station, ICAR-NIASM). The details of the weather parameters are provided in Supplementary Table 1. The soil of the experimental site is originated from parental basaltic rocks and characterized as shallow murrum (up to 40-cm depth) with 30% stones (>2 mm): 69% sand, 21% silt, 10% clay, and 5% available moisture holding capacity. At the beginning of the experiment, the pH (1:2.5 soil:water), electrical conductivity (EC), Walkley–Black carbon (C), KMnO4 oxidizable nitrogen (N), 0.5 M NaHCO3 extractable phosphorous (P), and 1 N NH4OAc extractable potassium (K) were 7.2, 0.18 dS m−1, 0.14%, 98.32 kg ha−1, 2.51 kg ha−1, and 207 kg ha−1, respectively.
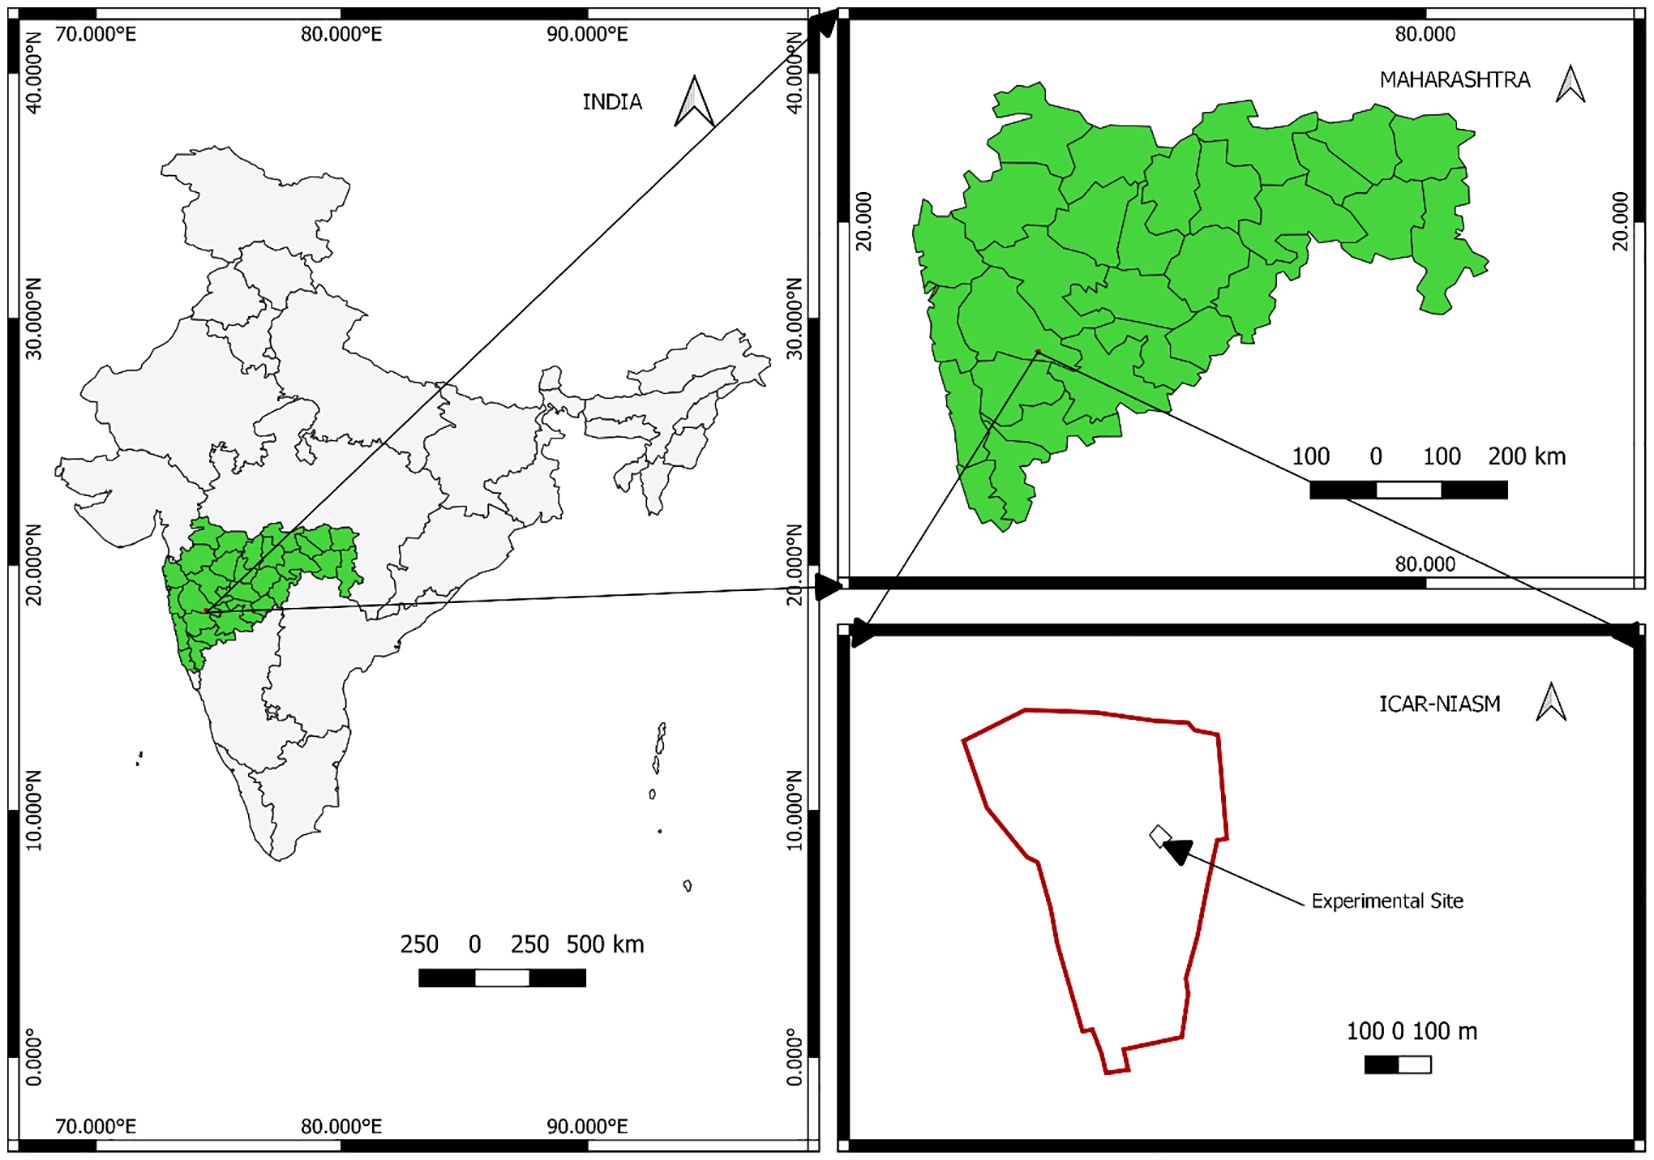
Figure 1. Location map of the study site.
2.2 Experimental details and crop management
The experiment was laid out in a split-split plot design with four sowing dates (D1, November 1; D2, November 15; D3, December 1, D4, December 15) in main plots, two irrigation practices (I1, 40% ETc; I2, 80% ETc) in sub plots, and three nitrogen doses (N1, 100 kg N ha−1; N2, 150 kg N ha−1; N3, 200 kg N ha−1) in sub-sub plots having three replications (Supplementary Figures 1, 2). The nitrogen quantity was applied in two splits: 50% as basal and 50% during the flowering period. The P and K doses (i.e., 60 kg ha−1) were applied as basal in all the treatments. The experiment was initiated in November 2021 using the quinoa accession "Jaipur Local", manually sown at a seed rate @ 5 kg ha−1 with 45 cm × 15 cm spacing. Sowing was established by dibbling five to six seeds per pocket in the soil to a depth of 1–2 cm. The gross and net plot areas under each treatment were 9 × 5 m and 7.5 × 4 m, respectively. To avoid border and interaction effects, a buffer area of 1.5 m was left between experimental units. Irrigation to the crops was provided via surface drip irrigation (having a discharge rate of 4 L h−1 through 16-mm laterals having inline emitters), and the crops were irrigated based on the actual crop evapotranspiration (ETc) approach. The crop ETc was computed using the following equation (Equation 1):
where Kp is the pan coefficient (0.70), Epan is the cumulative pan evaporation (mm), and Kc is the crop-specific coefficient. The Kc values for quinoa as reported by Garcia et al. (2003) were considered in our study. One common irrigation of 30 mm was provided after sowing for uniform germination and crop stand establishment. Scheduling of later irrigations was conducted as per the treatment, i.e., at 40% and 80% ETc to quinoa. The total quantity of water applied through drip irrigation to the cropping systems in both the study years is given in Supplementary Table 2. All recommended crop-specific packages and practices of weeding, intercultural operations, and disease pest management were strictly followed.
When the seeds matured and plants started drying, all the morphological and yield attributing parameters were measured from a total of 10 plants per treatment. The shoots (only stem and leaves) and roots were oven-dried at 60°C for 48 h to determine the respective dry matter content. The crops were manually harvested using sickles as they matured, followed by sun drying for 7 days. The dried panicles for each experimental plot were threshed and winnowed manually. Seed yield was recorded at 12% moisture content, while the stover was oven-dried at 60°C until constant weight was obtained and then expressed as kg ha−1 for respective treatments.
2.3 Water productivity
Water productivity (WP) was calculated using the following equation (Equation 2).
2.4 Phenology and growing degree days
The phenological developments, viz., 50% germination, 50% visible bud, 50% flowering, and 50% maturity were recorded as and when at least 50% of the plants were showing the indications in the whole plot. Days to maturity was calculated from the date of emergence to the date when the crop was harvested.
Growing degree days (GDD) was calculated based on the following formula (Equation 3):
where Tmax is the maximum temperature, Tmin is the minimum temperature, and Tbase is the base temperature, which was 3°C for quinoa (Jacobsen and Bach, 1998).
2.5 Protein and saponin contents in quinoa seed and husk
The seed protein content was determined using the Kjeldahl method of N estimation from plant samples with a conversion factor of 6.25. The seed protein content was then multiplied with the seed yield to estimate the protein yield under corresponding treatments. The total saponin content of quinoa seed and husk was estimated following the colorimetric determination procedure reported by Hiai et al. (1976). All quinoa samples were ground with a blender and passed through 1-mm sieve. Then, 10 g of each sample powder was dissolved in 40 mL of 25% ethanol and kept in a mechanical shaker for 12 hrs. Then, 0.5 mL of vanillin solution was added to 0.5 mL of aqueous ethanol sample, followed by the addition of 5 mL of 72% sulfuric acid and mixed in an ice-water bath. The mixture was then warmed in the bath at 60°C for 10 minutes, followed by cooling in an ice-water bath. A water blank with the reagents was also made. Absorbance at 450 nm was recorded against the blank with the reagents using a spectrophotometer. Quillaja saponin was used as a standard, and the total saponin content was expressed as g 100 g−1 of dry weight.
2.6 Carbon budgeting, efficiency, sustainable index, and nitrous oxide emissions
The total C input and output were determined by adding the carbon equivalents of all inputs and outputs during crop production. Carbon equivalents (CE) of all inputs, operational activities, and processes were combined to estimate the source-wise contribution to C input (Supplementary Figure 3; Supplementary Table 3). Similarly, the C output of each cropping system was quantified using methodologies provided by Choudhary et al. (2017) and Equation 4.
considering that C content accounts for 44% of the total plant biomass as given by Lal (2004).
Carbon efficiency, an indicator of total C production over the total input C, was calculated as follows (Equation 5).
Carbon sustainability index (CSI) was estimated as the net gain in C over the total C input as given by Lal (2004) and Choudhary et al. (2017) and depicted in Equation 6.
Carbon footprint (CF): Carbon footprints of the cropping systems indicated the total greenhouse gas (GHG) emissions in terms of kg CE ha−1 to produce 1 kg of the economic product and was computed as per Equation 7 as suggested by Yadav et al. (2021).
Estimation of nitrous oxide (N2O) emission included both direct and indirect emissions. As direct N2O emission is proportional to the amount of N applied, direct N2O emission was computed using Equation 8.
where 0.016 is the default emission factor for N fertilizer application, 1.571 is the conversion factor used to convert N2 to N2O, and 298 is the global warming potential (GWP) of N2O concerning CO2.
Similarly, indirect N2O emissions included loss of N fertilizer in the form of volatilization and were calculated using the Intergovernmental Panel on Climate Change (IPCC) guidelines of Tier 1 and Equation 9.
where 0.1 is the fraction used for volatilization, 0.010 is the default emission factor used for volatilization, 1.571 is the conversion factor used to convert N2 to N2O, and 298 is the GWP of N2O concerning CO2.
2.7 Statistical analysis
The recorded data were statistically analyzed using analysis of variance (ANOVA) for split-split plot design using the "Agricolae" package of R (R Development Core Team, 2015). A mixed model was used considering sowing date as the main plot factor, irrigation as sub plot factor, and nitrogen management as the sub-sub plot factor and analyzed in a split-split plot design. Since no major differences were observed among the treatments for the recorded observations, the results were averaged for 2021–2022 and 2022–2023. The F-test and least significant difference (LSD) (p < 0.05) were used to decipher the significance of the means of treatments and their interactions.
3 Results
3.1 Quinoa phenology
The impact of different sowing dates on quinoa's growth duration, developmental stages, and corresponding temperature ranges is illustrated in Figure 2. For sowing on November 1, the vegetative stage continued for 38 days after sowing (DAS), with temperatures ranging from a maximum of 27.35°C to 31.45°C and a minimum of 12.45°C to 19.1°C. The flowering period extended over 22 days, with temperatures reaching a maximum of 27.9°C to 31.4°C and a minimum of 11.25°C to 18.2°C. The seed-filling and maturity stages began at 60 DAS and continued for 33 days, resulting in a total crop duration of 99 days. During this phase, maximum temperatures ranged from 28°C to 31.5°C, while minimum temperatures ranged from 10.35°C to 14.9°C. Sowing on November 15 reduced the total crop duration by 1 week compared to November 1. The vegetative stage lasted 35 days, with a wider window for flowering (30 days). The seed-filling and maturity stages started at 65 DAS and lasted for 33 days. Temperatures during these stages were as follows: vegetative stage (27.35°C to 31.8°C maximum and 11.25°C to 19.1°C minimum), flowering stage (28°C to 31.4°C maximum and 11°C to 16.05°C minimum), and seed-filling and maturity stages (27.15°C to 32.1°C maximum and 10.35°C to 14.5°C minimum), respectively. Sowing in December resulted in a longer flowering period (35–40 days) and shorter seed-filling and maturity periods (20–23 days). During the seed-filling and maturity phases, temperatures were notably higher: 31.3°C to 34.85°C maximum and 11.6°C to 15.25°C minimum for December 1 sowing and 31.25°C to 35.25°C maximum and 14.5°C to 19.15°C minimum for December 15 sowing.
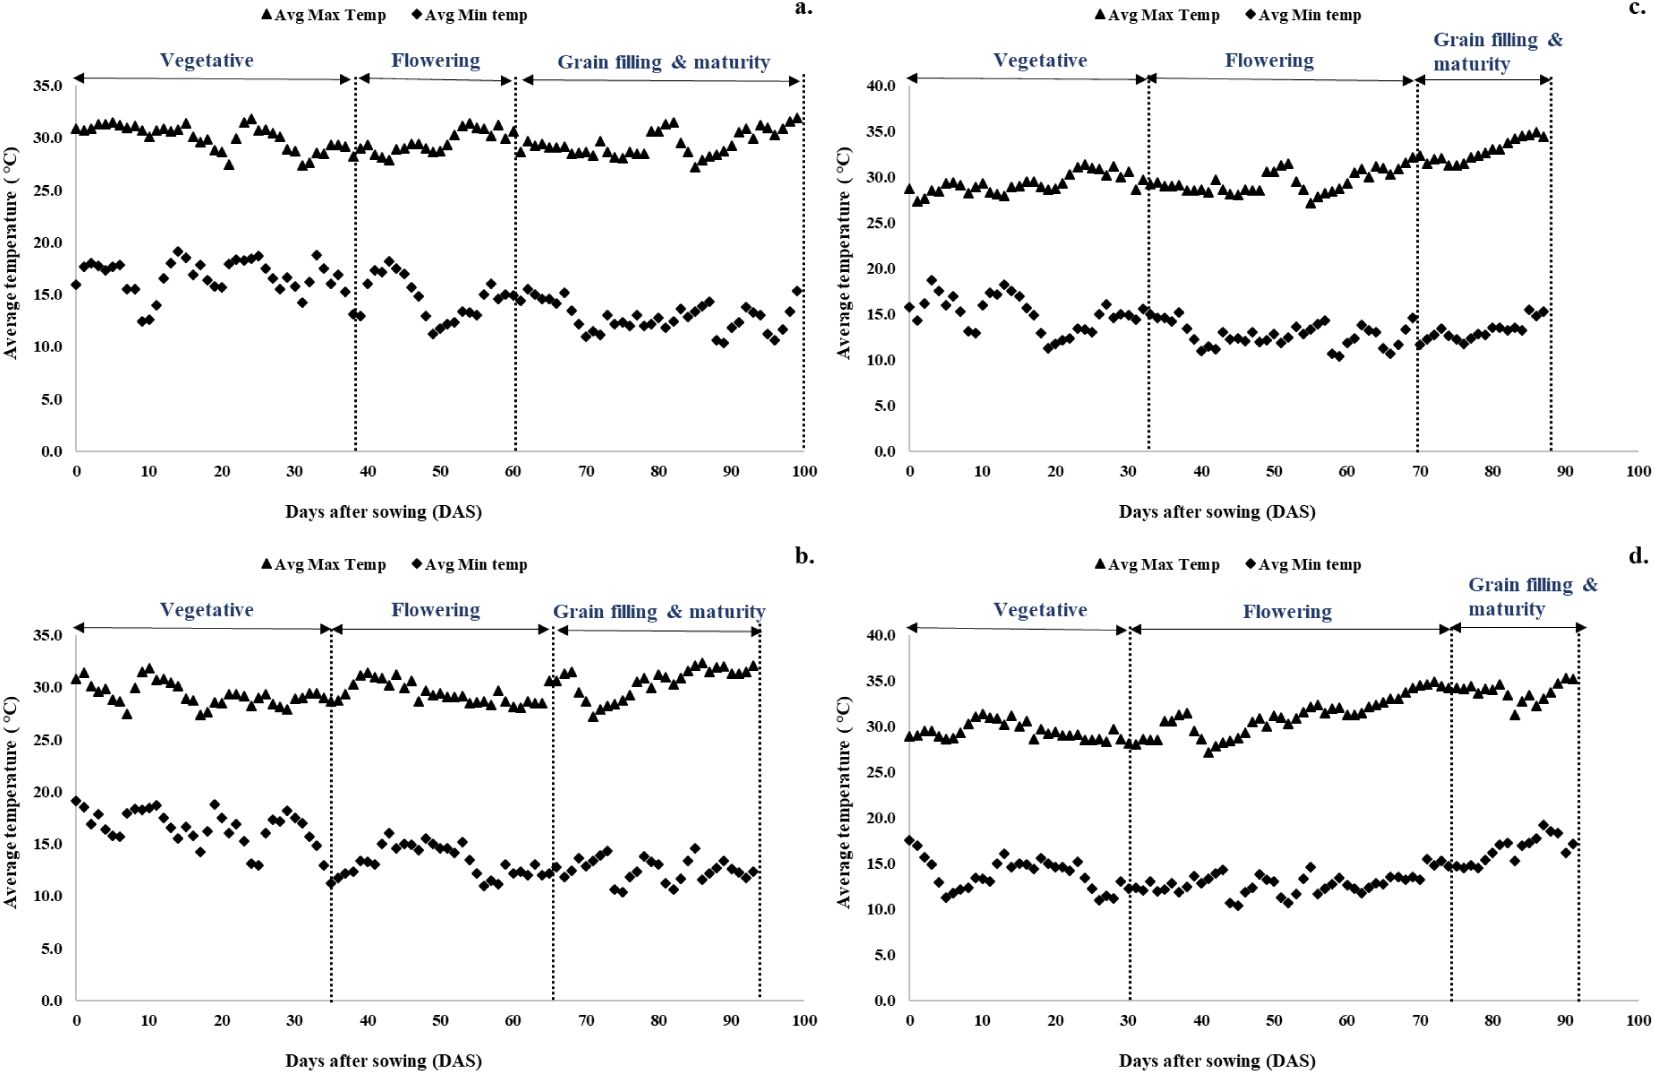
Figure 2. Effect of date of sowing on quinoa phenological stages. (a) November 1, (b) November 15, (c) December 1, and (d) December 15.
3.2 Cumulative growing degree days
For cumulative growing degree days (CGDD), the highest accumulation was observed for the earliest sowing date, November 1, with 1,900.40°C (Table 1). Sowing on November 15, December 1, and December 15 resulted in lower CGDD values of 1,785.30°C, 1,661.75°C, and 1,789.25°C, respectively.
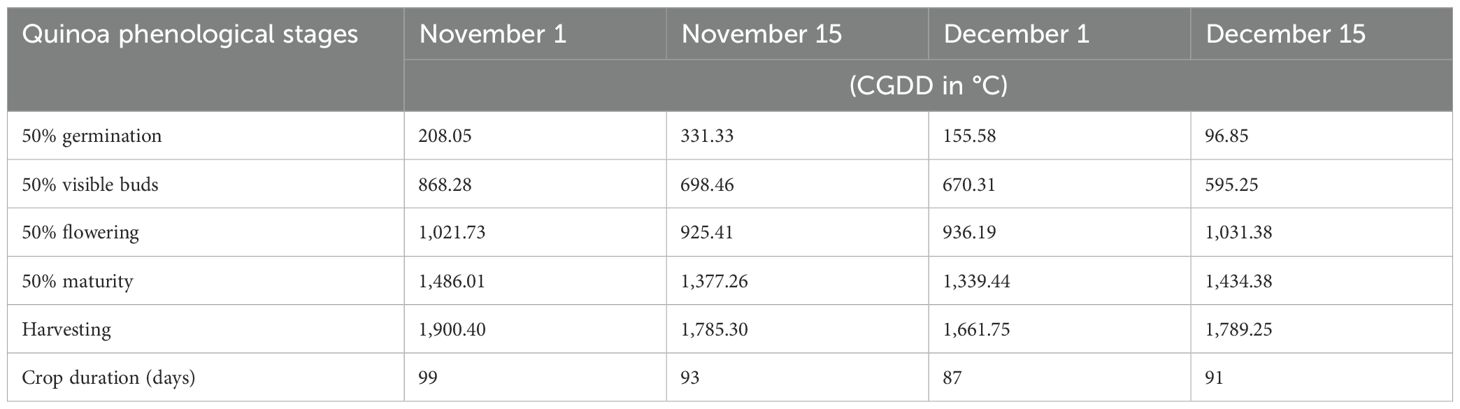
Table 1. Cumulative growing degree days (CGDD in °C) of different phenological stages for different sowing dates in quinoa.
3.3 Plant height, dry matter accumulation, and yield attributes
Sowing date and nitrogen levels showed significant effects (p < 0.05) on quinoa height, dry matter accumulation, and yield attributes (Table 2). The maximum plant height (113.67 cm) was obtained during the November 1 sowing. Height decreased by 7%–20% with later sowing dates, reaching a minimum (91.28 cm) for sowing on December 15. A similar trend was seen for both shoot and root dry matter, ranging from 11.39 to 72.43 g plant−1 and 3.52 to 8.69 g plant−1, respectively. Among the yield attributes, sowing on November 1 produced the maximum panicle weight, panicle length, seed weight, and husk weight, which were 2.6, 1.7, 7.2, and 2.7 times, respectively, than those from December 15 sowing (19.05 g plant−1, 18.24 cm plant−1, 10.15 g plant−1, and 4.70 g plant−1). However, irrigation levels did not significantly affect these parameters except panicle length, which was 8.8% higher in 80% ETc than in 40% ETc (22.93 cm plant−1) (Table 2). Among the nitrogen doses, the highest mean values for plant height, shoot dry matter, and yield attributes were achieved with N3 (200 kg N ha−1) and the lowest with N1 (100 kg N ha−1). The application of 150 kg N ha−1 was significant as compared to 100 kg N ha−1 only for shoot dry matter and seed weight. The maximum seed weight was observed under N3, which was 33% higher than that under N2 (39.25 g plant−1) and 56% higher than that under N1 (33.40 g plant−1). The seed weight of N2 was 18% higher than that of N1 (p < 0.05). Husk weight was significantly higher for November sowing (12. 8 g plant−1) and for 200 kg N ha−1 (11.95 g plant−1) (p < 0.05). The 1000-seed weight of quinoa ranged from 2.22 to 2.74 g, with plots sown in November recording a 17% higher value than that of December sown plots (2.2 g) (p < 0.05). Similarly, providing irrigation at 80% ETc and 200 kg N ha−1 reported 10% and 7% higher 1000-seed weight than 40% ETc (2.35 g) and 100 kg N ha−1 (2.39 g), respectively.
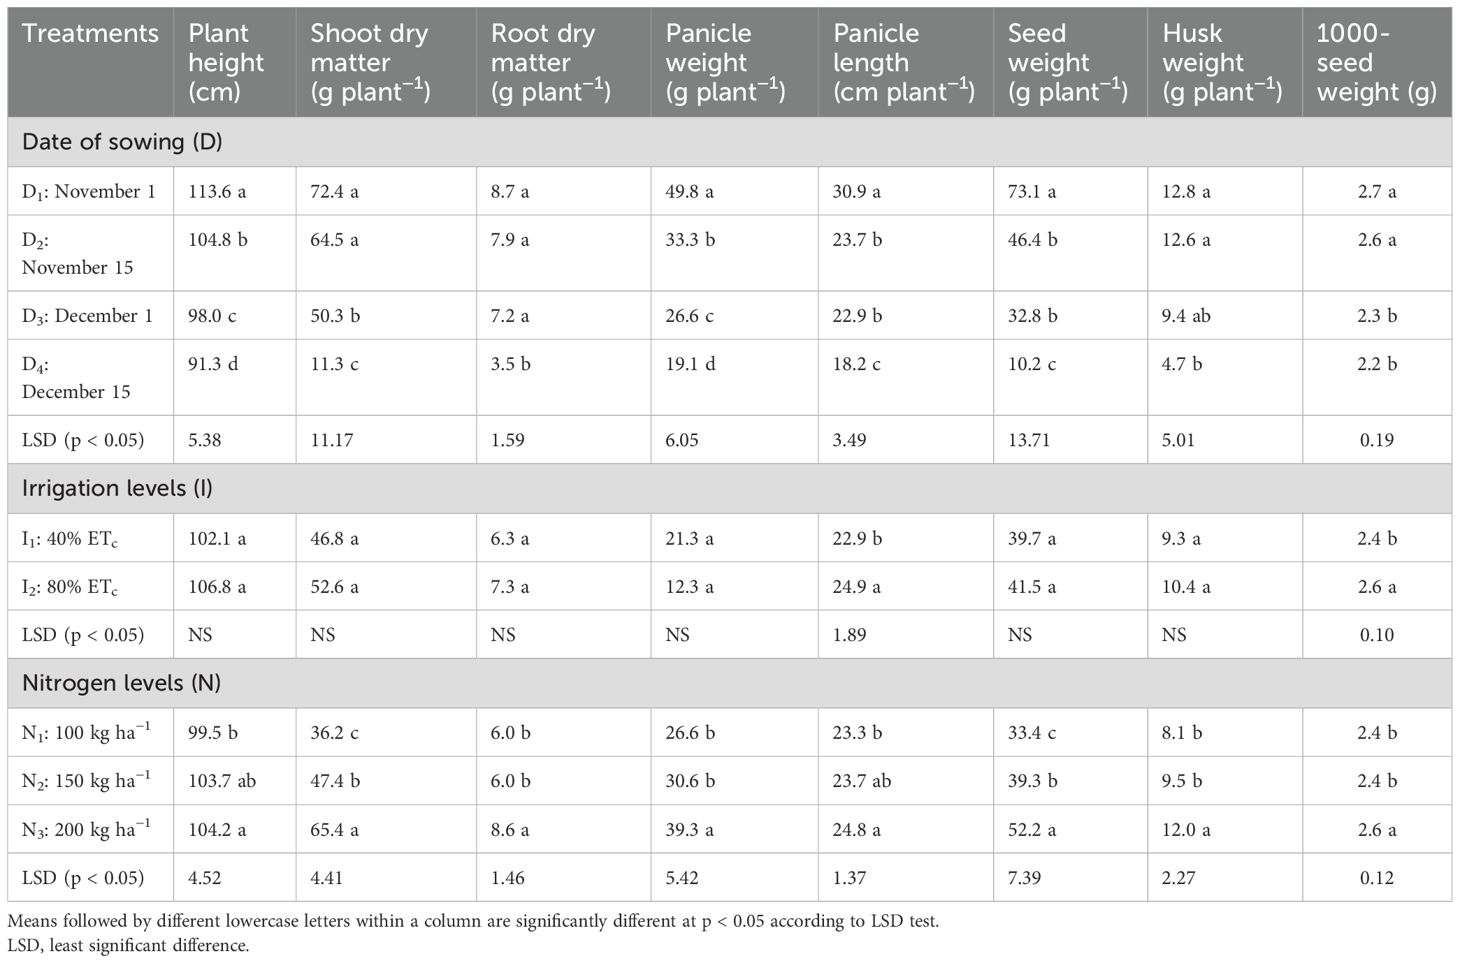
Table 2. Effect of sowing date, irrigation, and nitrogen levels on quinoa plant height, dry matter accumulation, and yield attributes.
3.4 Quinoa seed yield and water productivity
The seed yield was significantly higher in plots sown on November 1 (1,446 kg ha−1), which was reduced by 50% for sowings on November 15 and December 1 sowing, and the lowest yield was recorded for December 15 sowing (345.61 kg ha−1) (p < 0.05) (Figure 3). There were no differences in seed yield between the two irrigation levels. However, nitrogen levels had a significant effect on quinoa seed yield (p < 0.05) with maximum values under N3 (916.58 kg ha−1) and N2 (815.04 kg ha−1), with the latter being at par with N1 (723.50 kg ha−1).
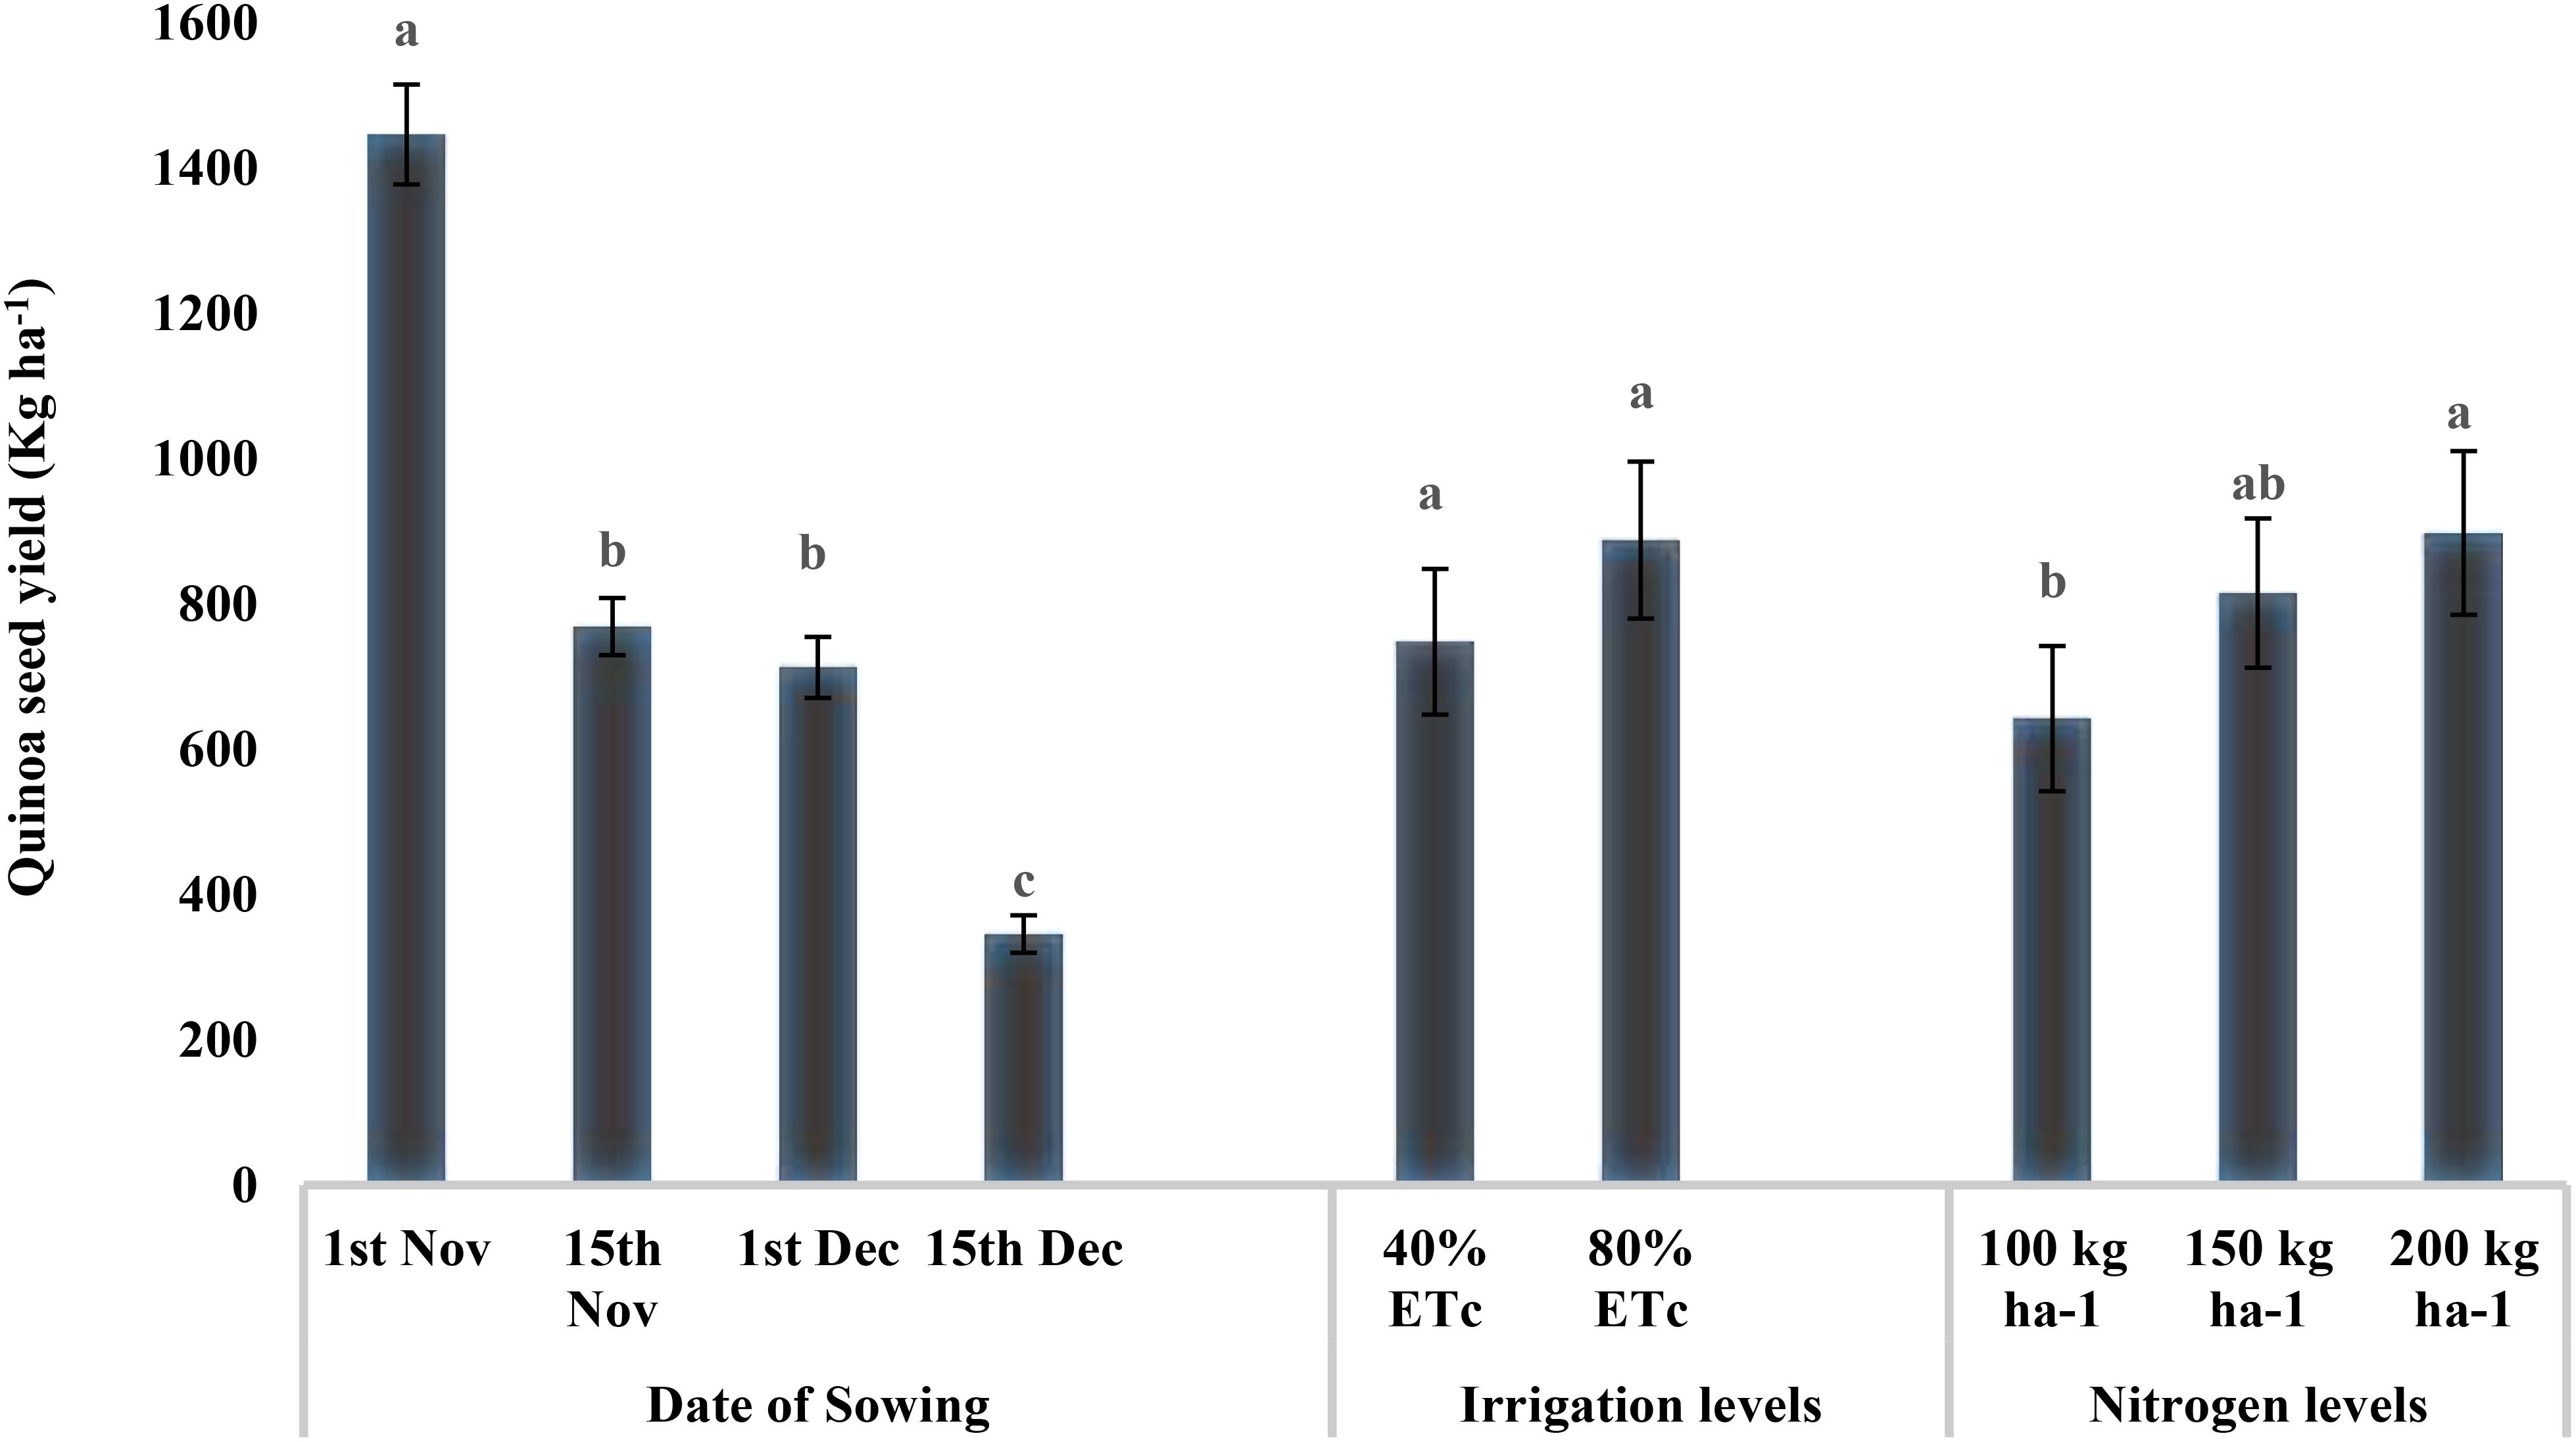
Figure 3. Effect of date of sowing, irrigation, and nitrogen levels on quinoa seed yield (kg ha−1). Vertical bars represent mean ± SE of the observed values. Values followed by different lowercase letters are significantly different at p < 0.05 within the treatment levels according to LSD test. LSD, least significant difference.
The water productivity of quinoa production ranged from 0.85 kg m−3 to 0.18 kg m−3 for our study (Figure 4). Water productivity was maximum for November 1 sowing (0.85 kg m−3), followed by November 15 (0.52 kg m−3) and December 1 (0.37 kg m−3), and minimum for December 15 (0.18 kg m−3). Providing irrigation at 40% ETc was 69.38% higher water productive than that at 80% ETc (0.36 kg m−3). However, water productivity was not significantly influenced by the nitrogen levels.
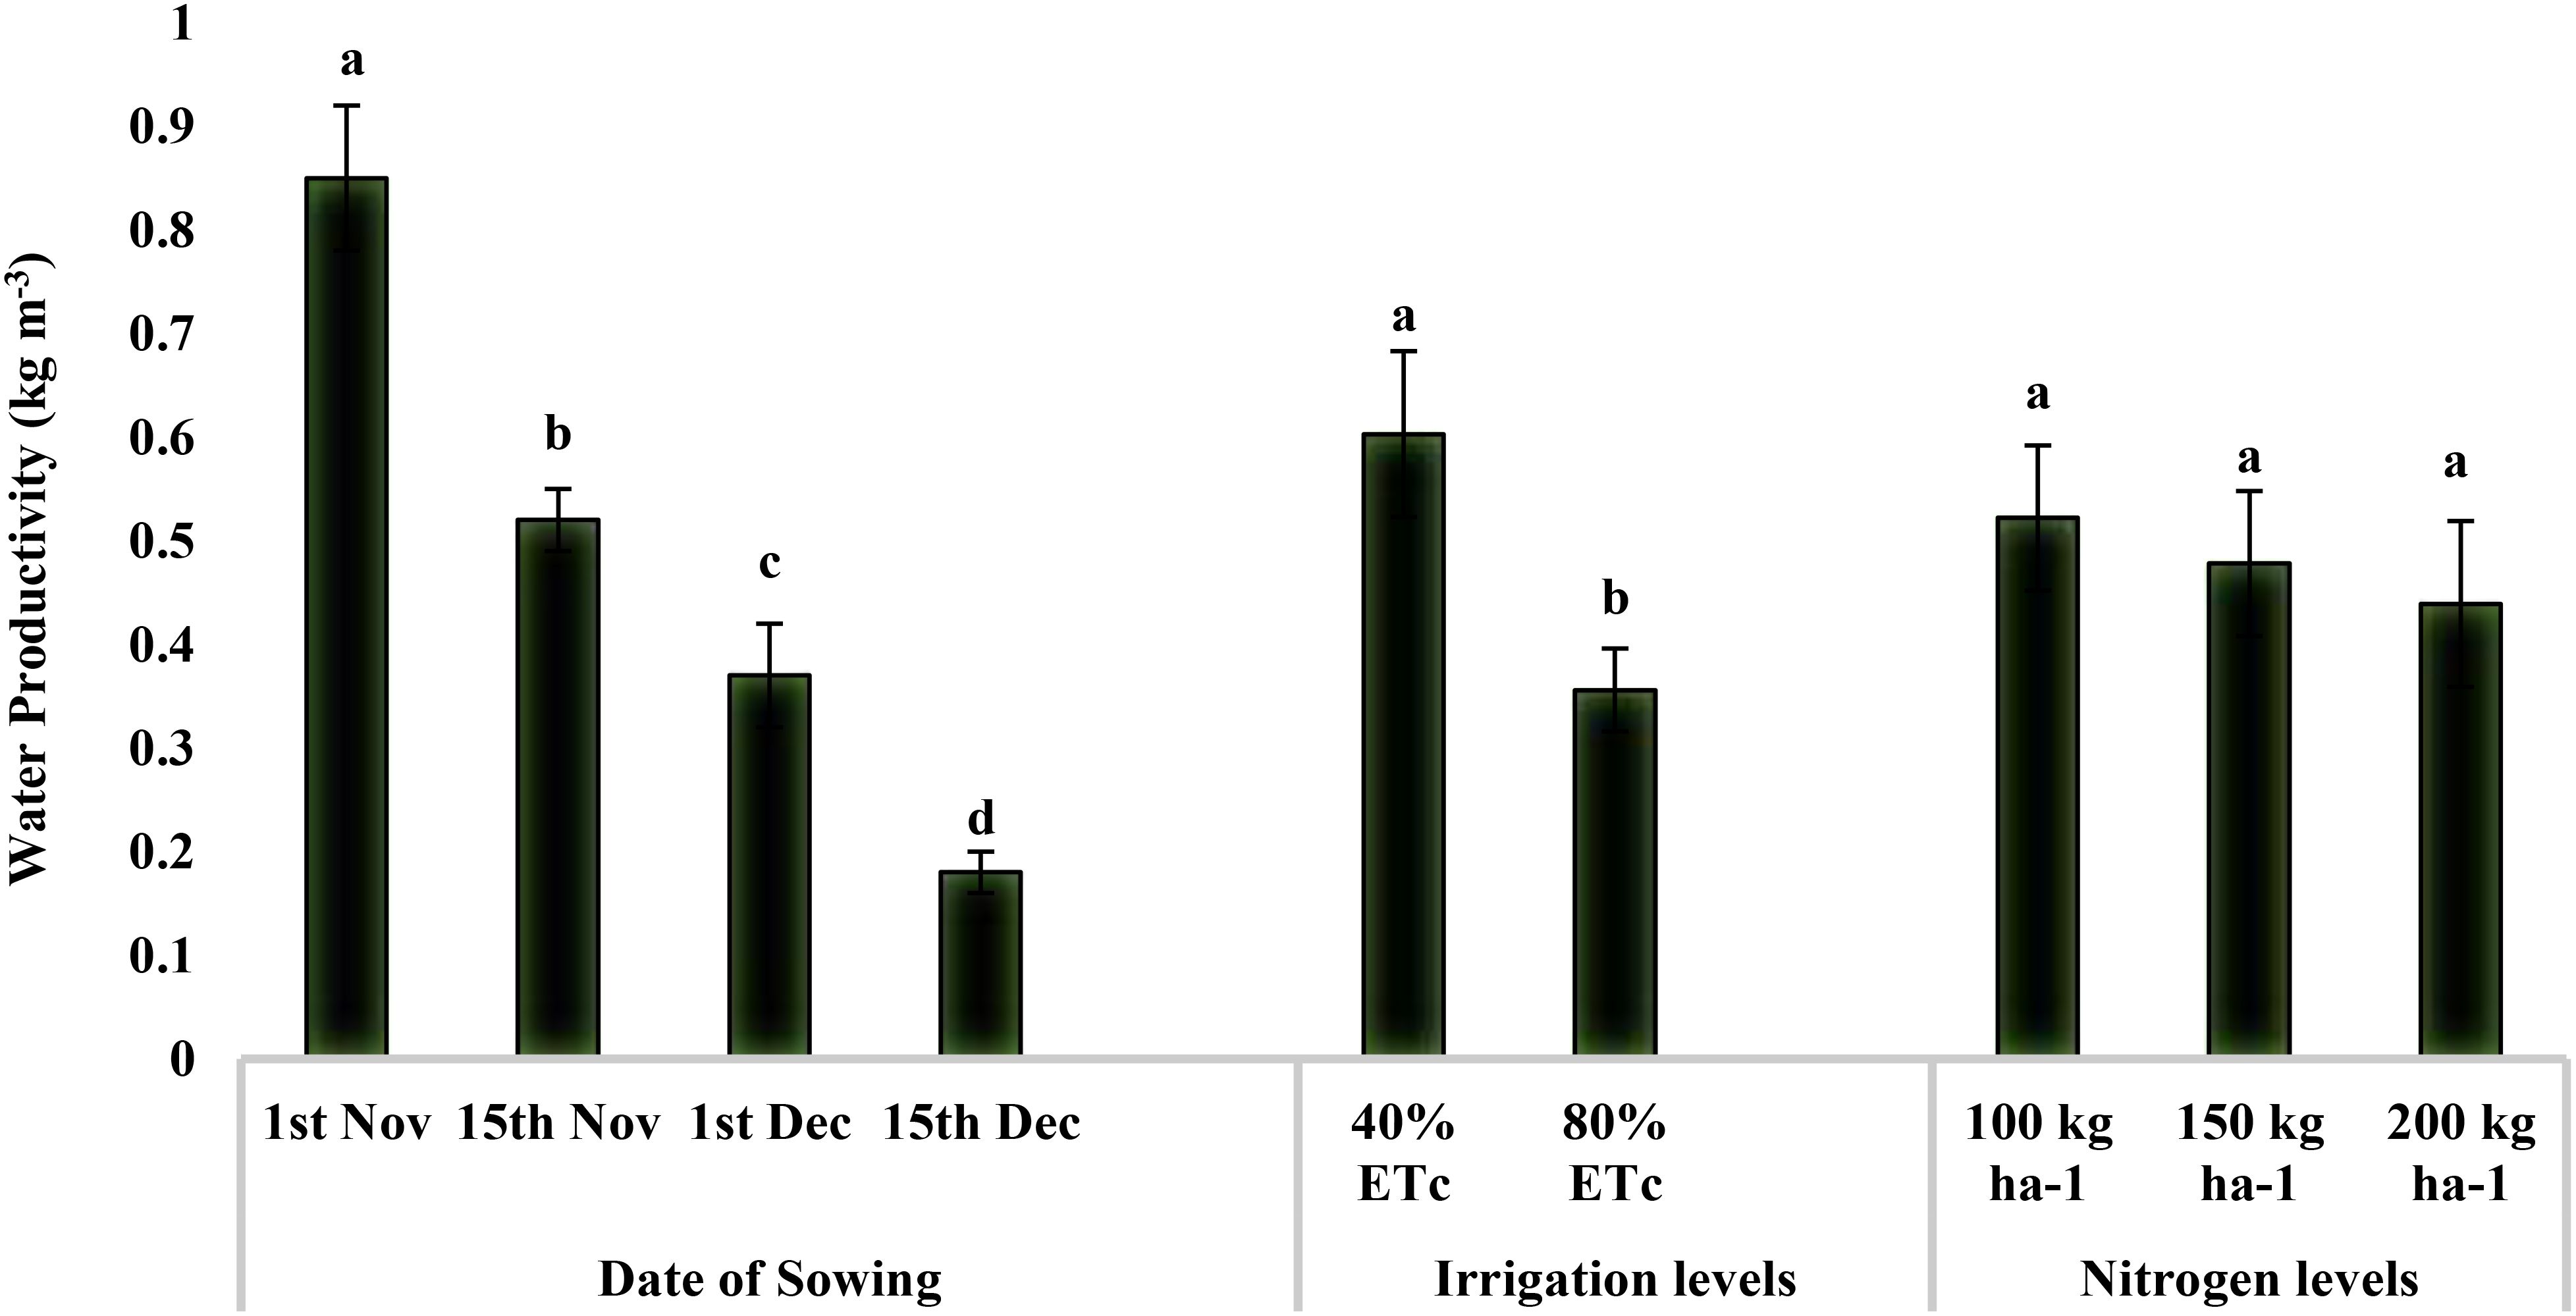
Figure 4. Effect of date of sowing, irrigation, and nitrogen levels on quinoa water productivity (kg m−3). Vertical bars represent mean ± SE of the observed values. Values followed by different lowercase letters are significantly different at p < 0.05 within the treatment levels according to LSD test. LSD, least significant difference.
3.5 Quinoa protein and saponin content
Since the treatment had no significant effect on seed protein content, the system protein yield followed a similar trend as that of seed yield (Supplementary Table 4; Supplementray Figure 4). Seed and husk saponin contents evaluated in the current study ranged from 0.51 to 1.26 g per 100-g dry weight and 0.64 to 1.67 g per 100-g dry weight, respectively (Figure 5). The seed saponin content was 19% higher in November sown crops than in the December 1 sowing (1.01 g 100 g−1 dry weight). However, the minimum saponin content of 0.51 g 100 g−1 dry weight was reported for the December 15 sowing. Similarly, providing irrigation at 40% ETc had 39% lower saponin as compared to that under 80% ETc (1.26 g 100 g−1 dry weight). The application of a higher dose of N increased the seed saponin content with N1 having the lowest value (0.77 g 100 g−1 dry weight), followed by N2 (1.06 g 100 g−1 dry weight) and N3 (1.21 g 100 g−1 dry weight). The saponin content of husk was higher than that of seed with irrigation levels having a significant impact, following a similar trend to that of seed saponin content. Delayed sowing, i.e., on December 15, also reported a reduced husk saponin content than the rest of the sowing dates.
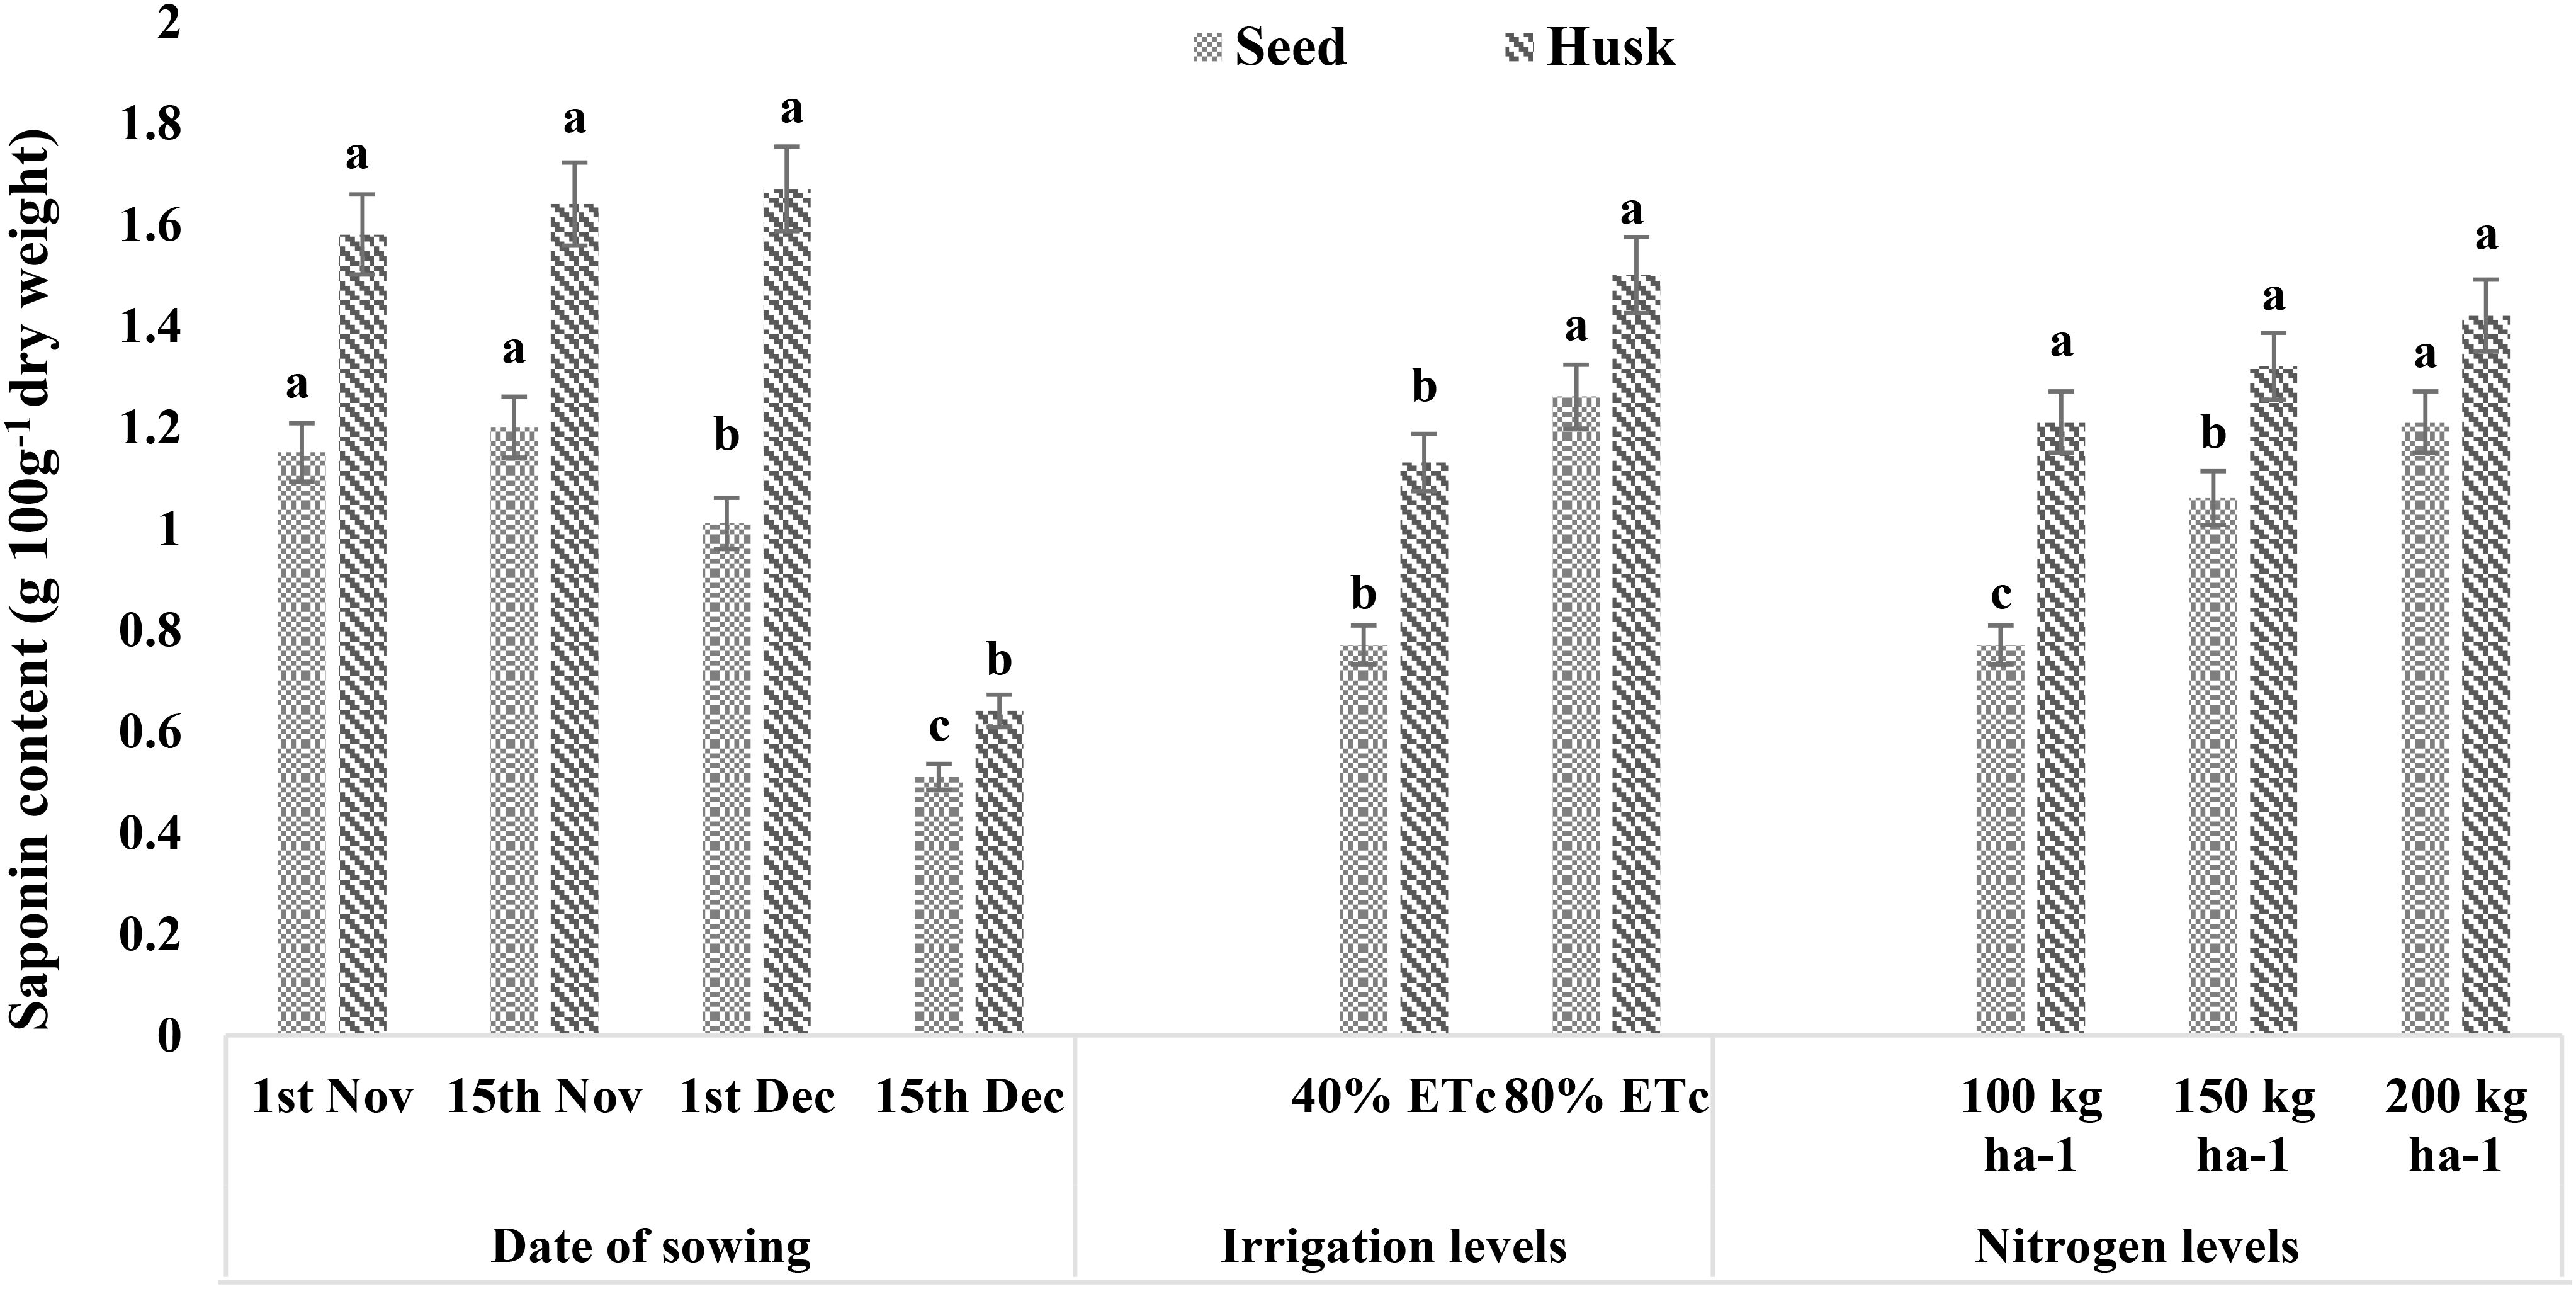
Figure 5. Effect of date of sowing, irrigation, and nitrogen levels on saponin contents of quinoa seed and husk (g 100 g−1 dry weight). Vertical bars represent mean ± SE of the observed values. Values followed by different lowercase letters are significantly different at p < 0.05 within the treatment levels according to LSD test. LSD, least significant difference.
3.6 Carbon budgeting, efficiency, and sustainability index
Averaged over 2 years, the carbon budgeting and related indices differed among the treatments (Table 3). Early sowing dates, i.e., November 1 sowing (D1), had the lowest C footprint (0.19 kg CE kg−1 seed) and the highest C efficiency (3.69) and were more sustainable (CSI, 2.69) (p < 0.05). This may be due to improved biomass production leading to higher C output (1,018.26 kg CE ha−1) and moderate C input (276 kg CE ha−1) in S1. Sowing during December 15 (D4) resulted in the highest C footprint (0.80 kg CE kg−1 seed) and the lowest C efficiency (0.88) and was not sustainable (CSI, −0.12), which was due to significantly less C output (243.31 kg CE ha−1) as proportionate to the quantity of C input (279.53 kg CE ha−1). Similarly, irrigating the crop at 40% ETc proved to be more C efficient and sustainable as compared to irrigating them at 80% Etc. Among the nitrogen levels, the application of 100 kg N ha−1 (N1) registered the lowest C footprint (0.33), higher C efficiency (2.14), and CSI (1.14), which was comparable to N2, i.e., 150 kg N ha−1. However, higher N levels, i.e., application at 200 kg ha−1 (N3), resulted in higher C output (632.07 kg CE ha−1) but at the cost of efficiency and increased C footprint; therefore, they were less sustainable (CSI, 0.86).
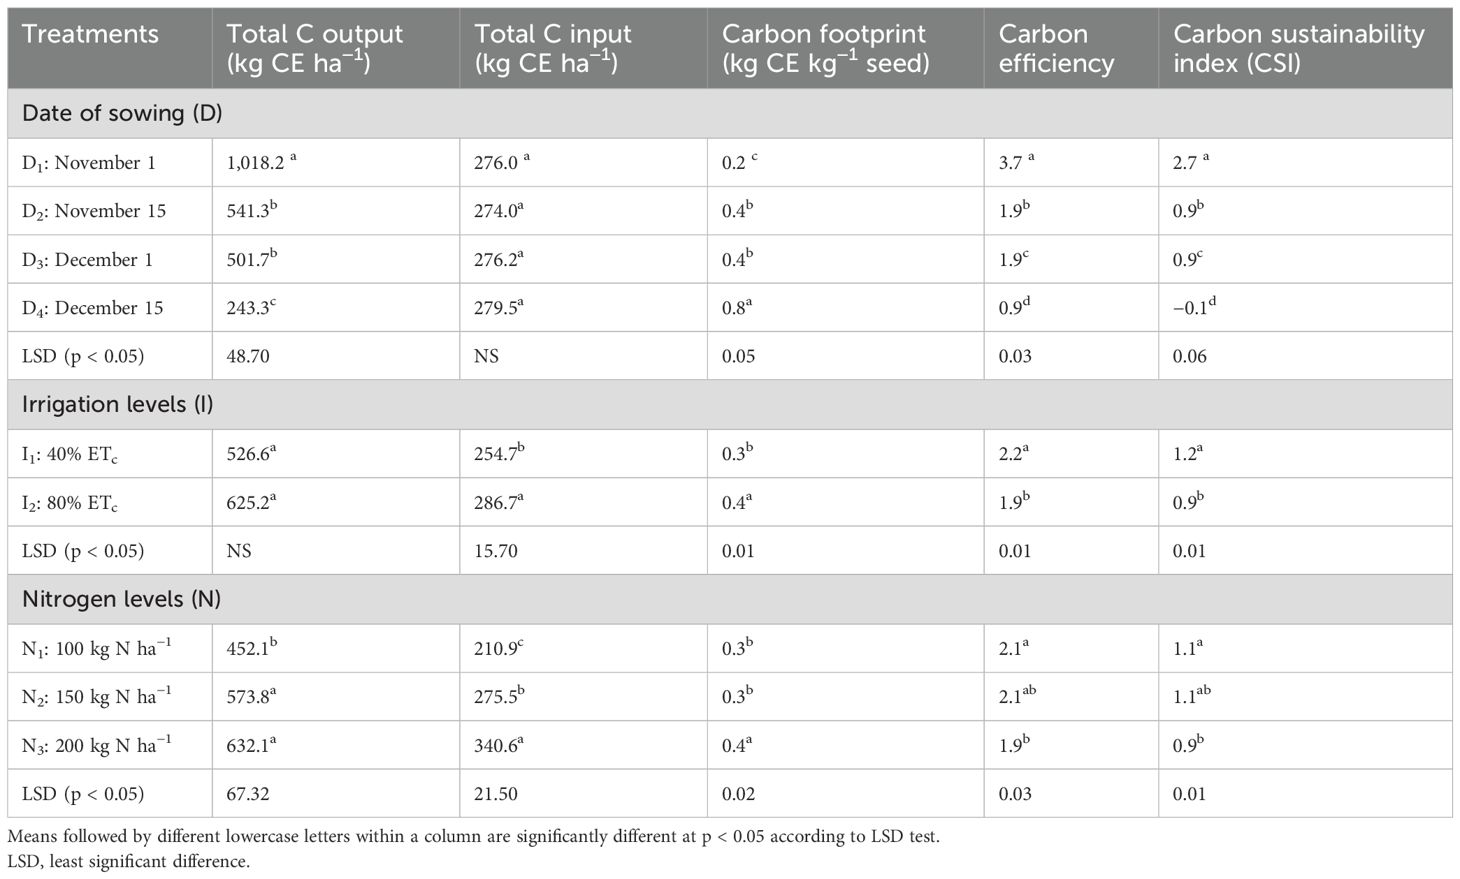
Table 3. Effect of date of sowing, irrigation, and nitrogen levels on carbon input–output parameters.
3.7 Nitrous oxide emissions
Among the treatments, N2O emissions (both direct and indirect) were significantly influenced only by N levels (Figure 6). The N2O emissions increased with the applied N fertilizer dose. The application of 200 kg N ha−1 had maximum direct (1,497.15 kg CO2-eq ha−1), indirect (93.57 kg CO2-eq ha−1), and total (1,590.72 kg CO2-eq ha−1) N2O emissions, followed by 150 and 100 kg N ha−1 (p < 0.05).
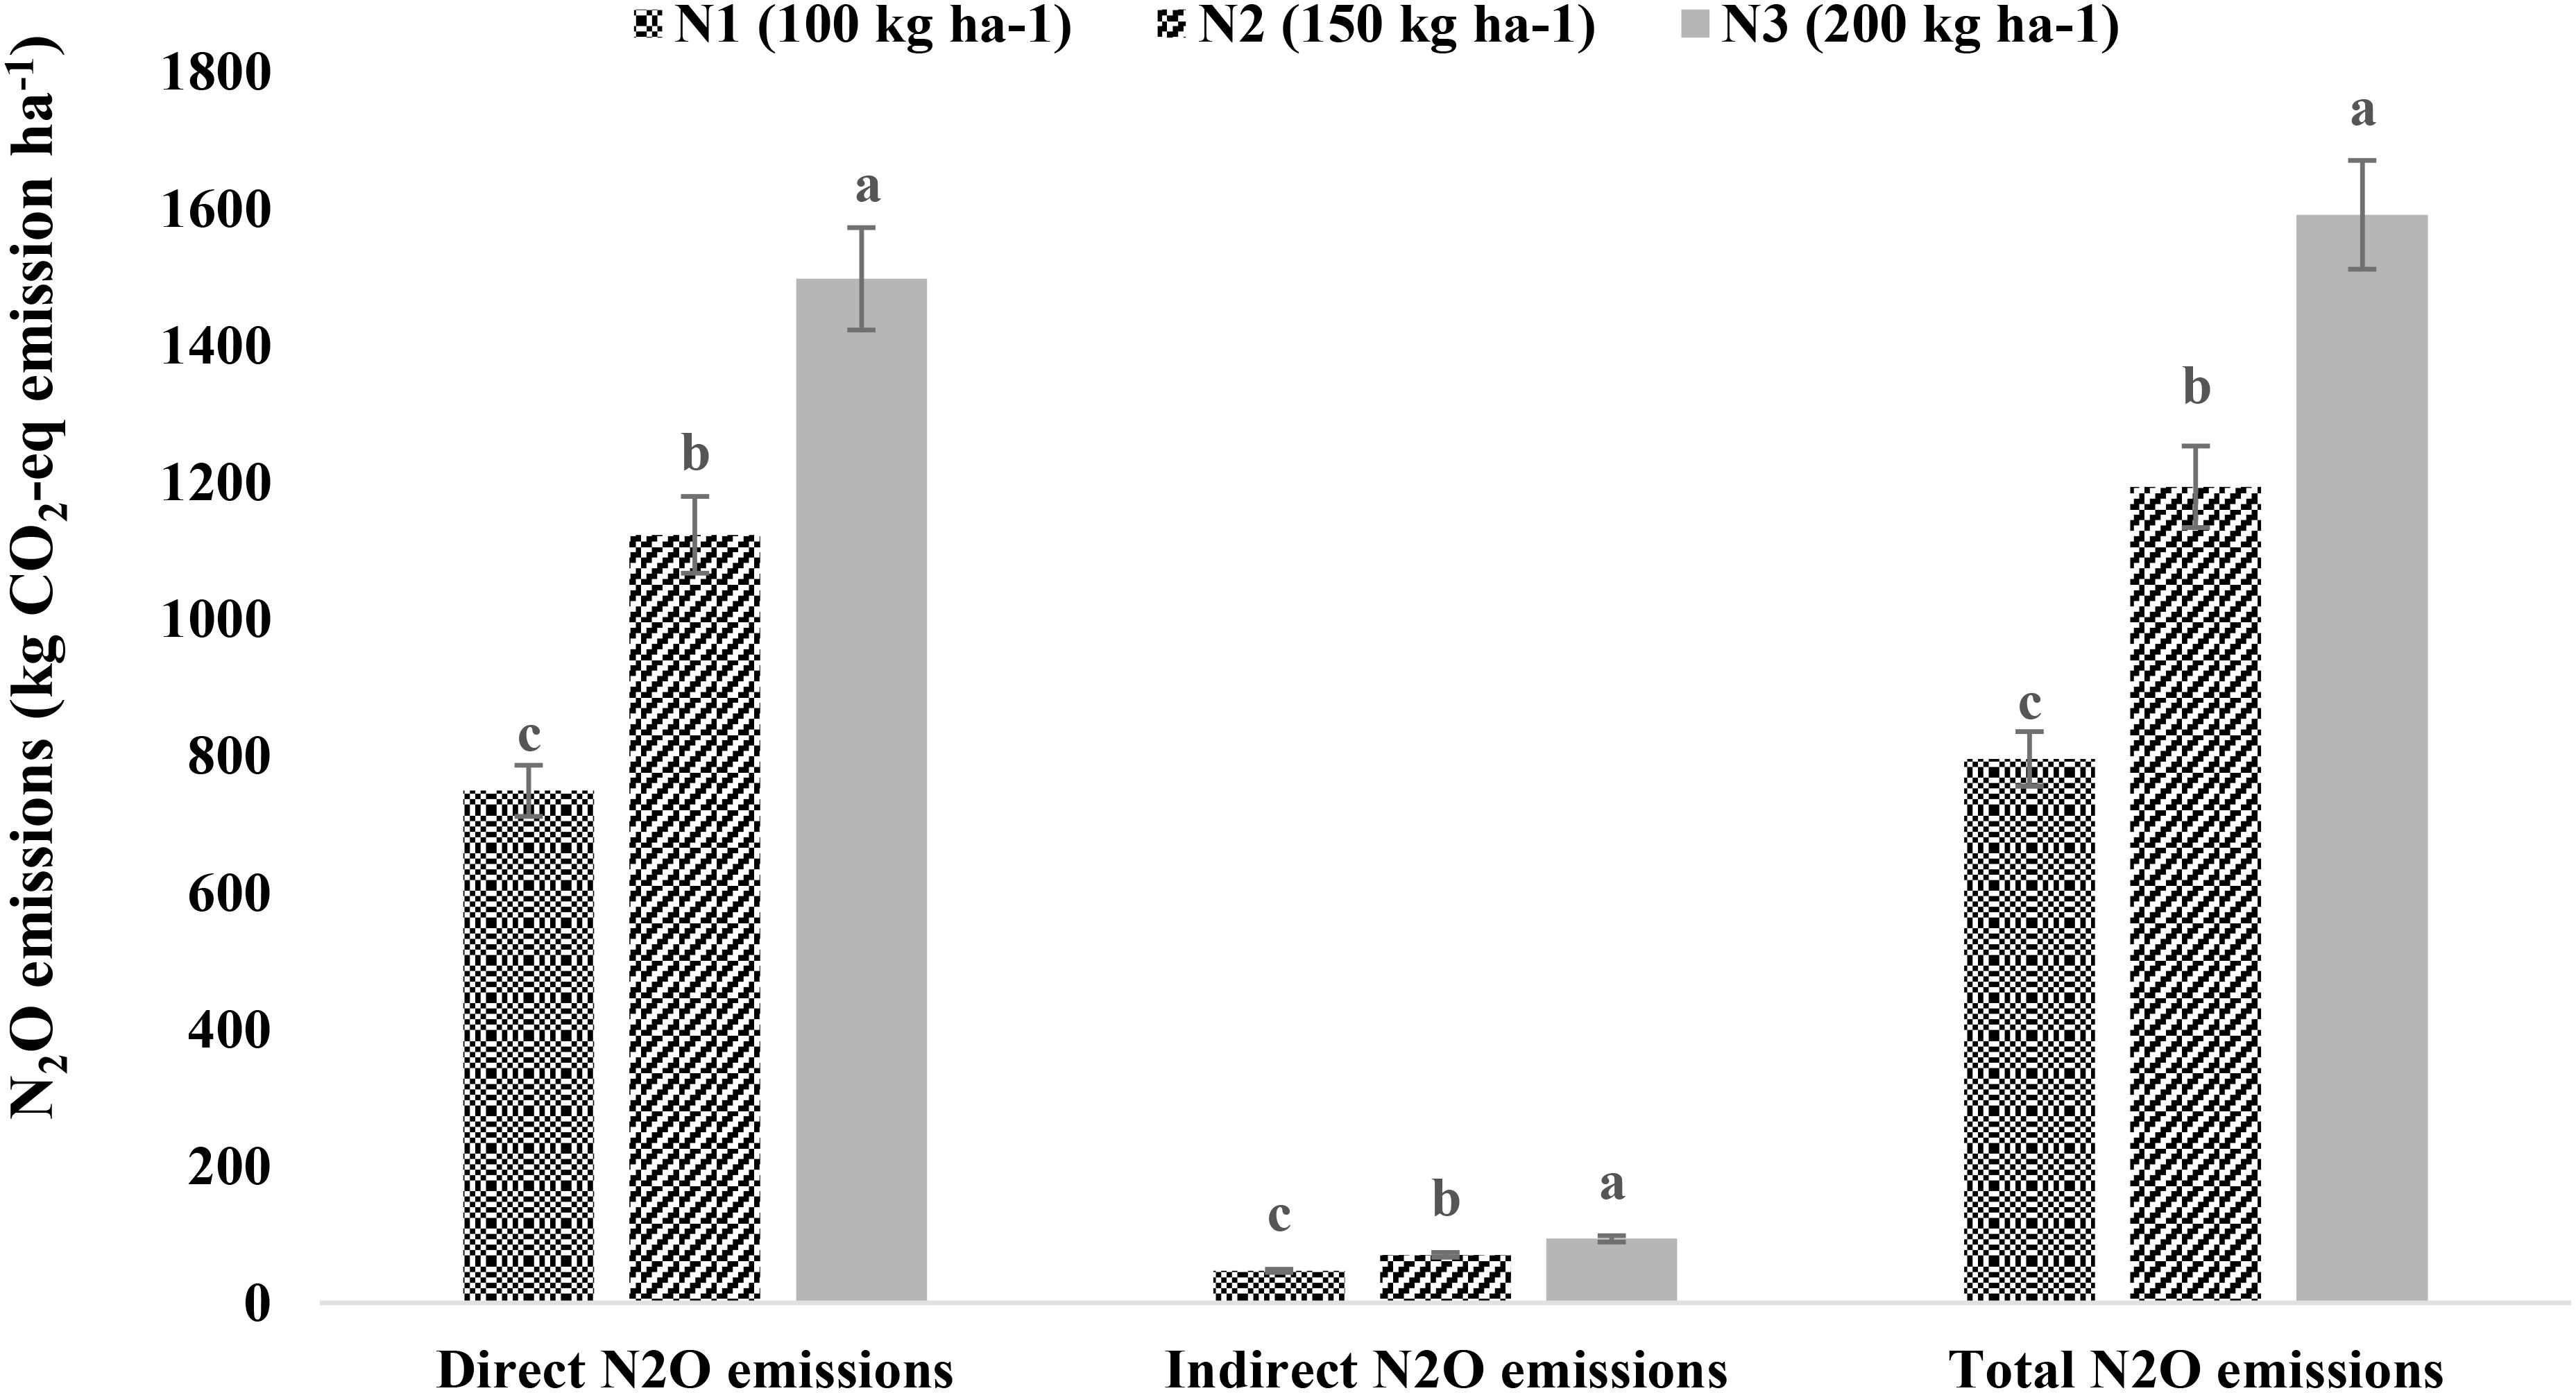
Figure 6. Nitrous oxide (N2O) emissions as affected by nitrogen levels. Means followed by different lowercase letters are significantly different at p < 0.05 according to LSD test. LSD, least significant difference.
4 Discussions
Optimizing production technology is essential for achieving the highest economic returns from any crop introduced to a new agro-ecological region. In this study, we evaluated how various sowing dates, irrigation regimes, and nitrogen management strategies affected quinoa yield, water productivity, and quality in shallow basaltic regions with a semi-arid climate. Our findings indicated significant differences in these parameters under different management scenarios. Although quinoa has the potential to tolerate a wide range of temperatures (−8°C to 35°C), this tolerance varies depending on the genotype and developmental stages. A sudden increase in temperature during the critical stages of the crop, i.e., flowering and seed filling, can significantly reduce yield and poses a major limitation to quinoa's global expansion (Dao et al., 2020). High temperatures at anthesis are crucial for quinoa pollination and can reduce pollen production and viability (Jacobsen et al., 2003). Temperatures above 35°C leading to substantial yield reductions due to empty seeds and seeds lacking inflorescence, reabsorption of quinoa seed endosperm, and inhibition of anther dehiscence has been reported by Bonifacio (1995). Even temperatures above 30°C hinder quinoa growth and productivity by reducing photosynthetic activity, flowering rates, and seed filling, leading to lower yields, as has already been highlighted by Hirich et al (2014). In our study, the average temperatures during critical growth stages for November 1 sowing were close to quinoa's optimal growth range (20°C–25°C), which may have led to better phenological development, growth, and yield. These findings are in agreement with Choukr-Allah et al. (2016) and Alvar-Beltrán et al. (2019). For early sowing dates (November 1 and 15), the maximum temperatures recorded were approximately 30°C during the anthesis, seed-filling, and maturity stages. However, December sowing experienced higher temperatures (34°C–35°C) during these stages, resulting in decreased yield and water productivity due to a shortened life cycle, with earlier flowering and improper seed maturation (Maestro-Gaitán et al., 2022; Matías et al., 2021). The temperature variations observed during this time of year and at this location were typical of tropical semi-arid zones. The length of the growing period varied with sowing dates, with the longest period occurring when sown on November 1 (99 days) and the shortest when sown on December 1 (87 days). This growing period was shorter compared to that observed in subtropical regions, which had durations of 169 and 134 days (Hassan, 2015; Präger et al., 2018). Regarding CGDD, the values reported in our study were comparable to those for similar agro-climatic regions (Präger et al., 2018). A higher accumulation of degree days among early sown plants of quinoa was also reported by Alvar-Beltrán et al. (2019).
In terms of irrigation, there was no significant difference in seed yield between 80% and 40% of crop evapotranspiration (ETc), as quinoa, being drought-tolerant, can thrive with limited water availability. By limiting water applications, this practice aims to enhance the water productivity and stabilize yields rather than maximize them (Geerts and Raes, 2009) and has been well investigated as an important and sustainable practice for arid and semi-arid regions (Garcia et al., 2003; Geerts et al., 2008). In contrast, other reports indicate that deficit irrigation can reduce seed yield by up to 50% compared to full irrigation (Hirich et al., 2012, Hirich et al., 2013). The variable response of irrigation on quinoa seed yield may be attributed to genotypes, soil, climate, and other crop management practices. However, crop WP ranged from 0.18 to 0.85 kg m−3 and was 67% higher under 40% ETc compared to 80% ETc (0.36 kg m−3). These findings align with the results reported by Fghire et al. (2013), confirming quinoa's high water use efficiency under drought-stress conditions. Quinoa's physiological responses to drought include rapid stomatal closure, sunken stomata, restricted root growth, and accelerated leaf senescence, which contribute to its adaptability in dry environments (Jacobsen et al., 2003).
Nitrogen is a well-known key factor influencing total plant biomass. However, optimizing crop yields with increased nitrogen rates depends on factors such as soil type, location, and management practices. In our study, significant differences were observed in various crop morphological traits, yield attributes, and seed yield between nitrogen rates of 100 kg ha−1 and 200 kg ha−1. However, both these doses were comparable to the moderate dose of 150 kg ha−1. Since the seed yield at 100 kg N ha−1 was at par with that of 150 kg N ha−1, indicating no proportional yield increase with an additional 50 kg N ha−1 application, 100 kg N ha−1 was considered optimal for our study. No differences in crop water productivity were found at higher nitrogen applications (150 and 200 kg ha−1) likely due to lower yield gain in proportion to the amount of water applied. Further, crop lodging (personal observation) occurred in plots receiving 200 kg N ha−1, likely due to increased plant biomass and the shallow soil depth at the study site, which restricted root growth and hindered proper anchorage. Similar reports of crop lodging with higher doses of N application were also reported by Wang et al. (2022). Our findings also align with reports from Kaul et al. (2005) and Shams (2012), which indicate that while quinoa yields and biomass increase with higher nitrogen application, they stabilize at a specific dosage for a given agro-ecological condition. In semi-arid regions, where water and nitrogen are crucial limiting factors, maintaining a well-developed crop canopy under full irrigation with high nitrogen doses is not sustainable. Therefore, leveraging the combined benefits of limited soil fertility and deficit irrigation can create a more effective strategy. Thus, for shallow basaltic regions using deficit irrigation, recommending a nitrogen application rate of 100 kg ha−1 will have optimum economic yield.
The 1000-seed weight observed in this study (2.22–2.74 g) is comparable with findings from other field studies (Tan and Temel, 2018) but lower compared to ranges reported for the Andean regions (3.0 g–4.7 g) (Miranda et al., 2012), which may be due to difference in terms of genotypes and pedo-climatic conditions. In general, early sowing is conducive to better seed filling and seed weight compared to late sowing. Therefore, the lower seed weight under late sowing dates can be attributed to the shortened seed-filling phase, where increased temperatures and longer photoperiods likely played significant roles. Other studies have also reported reduced 1000-seed weight due to limited irrigation and lower nitrogen application (Hirich et al., 2014b; Shams, 2018). Further, the seed and husk saponin content in our study falls within the range typically reported for quinoa (Pulvento et al., 2012; De Santis et al., 2016). The decrease in seed saponin content with delayed sowing may be related to the length of the crop growing period. Short-duration quinoa genotypes with lower seed saponin content (0.62 g 100 g−1 DM) were found to have less saponin compared to long-duration genotypes with higher content (1.92 g 100 g−1 DM), as noted by Oustani et al. (2023). Studies also reported that quinoa under water-deficit conditions tends to have lower saponin content, indicating better quality (Soliz-Guerrero et al., 2002; Gómez et al., 2011), which aligns with our results on irrigation levels. Further, saponin content with a positive and significant relationship with N dose has already been reported by Bilalis et al. (2012) and González et al. (2020).
Considering the impact of climate change and human-induced greenhouse gas emissions, promoting crop management practices that are more efficient and sustainable with minimal carbon footprints is essential (Yadav et al., 2021). The carbon input–output parameters reported in this study revealed that the early date of sowing, irrigation at 40% ETc, and the application of N @ 100 kg ha−1 were more C efficient and sustainable. This may be attributed to lesser emissions from irrigation and nitrogen coupled with higher proportionate C output. Similarly, the N2O emissions (both direct and indirect) increased in proportion to nitrogen fertilizer application. A significant and positive correlation of N2O emissions with N fertilizer application under drip irrigation was also reported by Kumar et al. (2021). Therefore, implementing optimal water and nutrient management strategies could stabilize N2O emissions while enhancing the carbon footprint and efficiency of quinoa production in shallow basaltic regions.
5 Conclusion
In shallow basaltic semi-arid regions, sowing quinoa on November 1, i.e., when temperatures align more closely with optimal quinoa growth conditions, can enhance crop biomass, yield, and water productivity. Higher temperatures during critical growth stages, i.e., anthesis and seed filling, and a short growing cycle are among the factors that reduced quinoa's yield in late November and December sowing. Therefore, planning agricultural activities, particularly through a well-planned sowing calendar, is crucial for quinoa cultivation so that temperatures during the critical growth stages must be as close as possible to the mean optimal temperatures. In our study, quinoa's growth, development, and yield were unaffected by irrigation levels. Therefore, frequent irrigation, but in small quantities, is highly suggested to reduce evapotranspiration and increase water productivity in quinoa in shallow basaltic murram soils. Further, nitrogen application at 100 g N ha−1 was found suitable considering the shallow basaltic rock, root restrictions, limited irrigation, and lodging issues. These optimization strategies are location-specific and can be tailored according to particular agro-ecological situations. However, the results confirm quinoa's ability to produce seed yields up to 1,446 kg ha−1, a level of production that most food crops cannot achieve economically in the shallow basaltic rocky terrains of drought-prone environments. This makes quinoa a promising candidate for crop diversification in India and other countries with similar climatic conditions. Furthermore, there is also a need to design a product marketing strategy and raise awareness among farmers and government agencies about quinoa's potential as a stress-tolerant alternative crop for marginal environments.
Data availability statement
The original contributions presented in the study are included in the article/Supplementary Material. Further inquiries can be directed to the corresponding author.
Author contributions
AP: Conceptualization, Formal analysis, Investigation, Methodology, Writing – original draft, Supervision. JR: Conceptualization, Project administration, Supervision, Writing – review & editing. PB: Investigation, Methodology, Resources, Writing – review & editing. NK: Formal analysis, Investigation, Resources, Writing – review & editing. DS: Formal analysis, Investigation, Writing – review & editing. NP: Formal analysis, Software, Writing – review & editing. KP: Project administration, Supervision, Validation, Writing – review & editing. KR: Project administration, Supervision, Validation, Writing – review & editing.
Funding
The author(s) declare financial support was received for the research, authorship, and/or publication of this article. The authors acknowledge the funding support received from ICAR–NIASM, Baramati and CIMMYT grant no. (OXX4926).
Acknowledgments
The authors are thankful to ICAR-National Institute of Abiotic Stress Management, India, for supporting the research under the institute's flagship program on "Exploiting under-utilized crops (ex. Quinoa) for augmenting income in water-scarce regions", IXX15656).
Conflict of interest
The authors declare that the research was conducted in the absence of any commercial or financial relationships that could be construed as a potential conflict of interest.
Generative AI statement
The author(s) declare that no Generative AI was used in the creation of this manuscript.
Publisher’s note
All claims expressed in this article are solely those of the authors and do not necessarily represent those of their affiliated organizations, or those of the publisher, the editors and the reviewers. Any product that may be evaluated in this article, or claim that may be made by its manufacturer, is not guaranteed or endorsed by the publisher.
Supplementary material
The Supplementary Material for this article can be found online at: https://www.frontiersin.org/articles/10.3389/fpls.2025.1522995/full#supplementary-material
Footnotes
- ^ The quinoa plant produces starchy seeds that resemble grains and are prepared and consumed in a similar manner, although botanically, it is classified as a dicotyledon.
References
AbdElgalil, M. A. S., Hefzy, M., Sas-Paszt, L., Ali, H. M., Lamlom, S. F., Abdelghany, A. M. (2023). Unraveling the influence of water and nitrogen management on Quinoa (Chenopodium quinoa Willd.) agronomic and yield traits. Water 15, 1296. doi: 10.3390/w15071296
Alvar-Beltrán, J., Dao, A., Dalla Marta, A., Saturnin, C., Casini, P., Sanou, J., et al. (2019). Effect of drought, nitrogen fertilization, temperature and photoperiodicity on quinoa plant growth and development in the sahel. Agronomy 9, 607. doi: 10.3390/agronomy9100607
Asher, A., Galili, S., Whitney, T., Rubinovich, L. (2020). The potential of quinoa (Chenopodium quinoa) cultivation in Israel as a dual purpose crop for grain production and livestock feed. Scientia Hortic. 272, 109534. doi: 10.1016/j.scienta.2020.109534
Bahrami, M., Talebnejad, R., Sepaskhah, A. R., Bazile, D. (2022). Irrigation regimes and nitrogen rates as the contributing factors in quinoa yield to increase water and nitrogen efficiencies. Plant 11, 2048. doi: 10.3390/plants11152048
Bazile, D., Jacobson, S., Verniau, A. (2016). The global expansion of quinoa:trends and limits. Front. Plant Sci. 7. doi: 10.3389/fpls.2016.00622
Berti, M., Wilckens, R., Hevia, F., Serri, H., Vidal and, C., Mendez, I. (2000). Nitrogen fertilization in quinoa (Chenopodium quinoa willd.). Cienc. Investig. Agrar. 27, 81–90. doi: 10.7764/rcia.v27i2.999
Bhargava, A., Shukla, S., Ohri, D. (2006). Chenopodium quinoa-an Indian perspective. Ind. Crops Products 23, 73–87. doi: 10.1016/j.indcrop.2005.04.002
Bilalis, D., Kakabouki, I., Karkanis, A., Travlos, I., Triantafyllidis, V., Hela, D. (2012). Seed and saponin production of organic quinoa (Chenopodium quinoa Willd.) for different tillage and fertilization. Notulae Botanicae Horti Agrobotanici Cluj-Napoca 40, 42–46. doi: 10.15835/nbha4017400
Bonifacio, A. (1995). Interspecific and intergeneric hybridization in chenopod species (Provo, UT, USA: Department of Botany and Range Sciences, Brigham Young University).
Choudhary, M., Rana, K. S., Bana, R. S., Ghasal, P. C., Choudhary, G. I., Jakhar, P., et al. (2017). Energy budgeting and carbon footprint of pearl millet-mustard cropping system under conventional and conservation agriculture in rainfed semi-arid agro-ecosystem. Energy 141, 1052–1058. doi: 10.1016/jenergy.2017.09.136
Choukr-Allah, R., Rao, N. K., Hirich, A., Shahid, M., Alshankiti, A., Toderich, K., et al. (2016). Quinoa for marginal environments: toward future food and nutritional security in MENA and central asia regions. Front. Plant Sci. 7. doi: 10.3389/fpls.2016.00346
Dao, A., Guira, A., Alvar-Beltrán, J., Gnan-Da, A., Nebie, L., Sanou, J. (2020). Quinoa's response to different sowing periods in two agro-ecological zones of Burkina Faso. Ital. J. Agrometeorol. 1, 63–72. doi: 10.13128/ijam-731
De Santis, G., Maddaluno, C., D'Ambrosio, T., Rascio, A., Rinaldi, M., Troisi, J. (2016). Characterisation of quinoa (Chenopodium quinoa Willd.) accessions for the saponin content in Mediterraneanenvironment. Ital. J. Agron. 11, 277–281. doi: 10.4081/ija.2016.774
FAO (2011). . Quinoa: an ancient crop to contribute to world food security. Available online at: https://www.fao.org/4/aq287e/aq287e.pdf (Accessed May 24, 2024).
Fghire, R., Oudou, I. A., Filali, K., Benlhabib, O., Wahbi, S. (2013). “Deficit irrigation and fertilization impact on quinoa water and yield productions,” in International conference on sustainable water use for securing food production in the mediterranean region under changing climate. Ed. Choukr-Allah, R. (SWUP-MED project, Agadir), 409–416.
Fuentes, F., Bhargava, A. (2011). Morphological analysis of quinoa germplasm grown under lowland desert conditions. J. Agron. Crop Sci. 197, 124–134. doi: 10.1111/j.1439-037X.2010.00445.x
Garcia, M., Raes, D., Jacobsen, S. E. (2003). Evapotranspiration analysis and irrigation requirements of quinoa (Chenopodium quinoa) in the Bolivian highlands. Agric. Water Manage. 60, 119–134. doi: 10.1016/S0378-3774(02)00162-2
Geerts, S., Raes, D. (2009). Deficit irrigation as a non-farm strategy to maximize crop water productivity in dry areas. Agric. Water Manage. 96, 1275–1284. doi: 10.1016/j.agwat.2009.04.009
Geerts, S., Raes, D., Garcia, M., Vacher, J., Mamani, R., Mendoza, J., et al. (2008). Introducing deficit irrigation to stabilize yields of quinoa (Chenopodium quinoa Willd.). Eur. J. Agron. 28, 427–436. doi: 10.1016/j.eja.2007.11.008
Gómez, M. B., Castro, P. A., Mignone, C., Bertero, H. D. (2011). Can yield potential be increased by manipulation of reproductive partitioning in quinoa (Chenopodium quinoa)? Evidence from gibberellic acid synthesis inhibition using Paclobutrazol. Funct. Plant Biol. 38, 420–430. doi: 10.1071/fp10168
González, J. A., Lizarraga, E. F., Erazzú, L. E., Martinez-Calsina, L., Buedo, S. E., González, D. A. (2020). Goat manure fertilization effect on saponin and protein content in quinoa (Chenopodium quinoa Willd.) grain of different origin. Middle East J. Agric. Res. 9, 434–443. doi: 10.36632/mejar/2020.9.2.34
Hiai, S., Oura, H., Nakajima, T. (1976). Color reaction of some sapogenins and saponins with vanillin and sulfuric acid. Planta Med. 29, 116–122. doi: 10.1055/s-0028-1097639
Hinojosa, L., González, J. A., Barrios-Masias, F. H., Fuentes, F., Murphy, K. M. (2018). Quinoa abiotic stress responses: a review. Plants 7, 106. doi: 10.3390/plants7040106
Hirich, A., Choukr-Allah, R., Jacobsen, S. E. (2013). The combined effect of deficit irrigation by treated waste water and organic amendment on quinoa (Chenopodium quinoa Willd.) productivity. Desalination Water Treat 52, 2208–2213. doi: 10.1080/19443994.2013.777944
Hirich, A., Choukr-Allah, R., Jacobsen, S. E. (2014a). Quinoa in Morocco effect of sowing dates on development and yield. J. Agron. Crop Sci. 200 (5), 371–377.doi: 10.1111/jac.12071
Hirich, A., Choukr-Allah, R., Jacobsen, S. E. (2014b). Deficit irrigation and organic compost improve growth and yield of quinoa and pea. J. Agron. Crop Sci. 200, 390–398. doi: 10.1111/jac.12073
Hirich, A., Choukr-Allah, R., Jacobsen, S. E., ElYousfi, L., ElOmari, H. (2012). Using deficit irrigation with treated waste water in the production of quinoa (Chenopodium quinoa Willd.) in Morocco. Rev. Científica UDO Agricola 12, 570–583.
Jacobsen, S., Bach, A. (1998). The influence of temperature on seed germination rate in quinoa (Chenopodium quinoa Willd.). Seed Sci. Technol. 26, 515–523.
Jacobsen, S. E., Mujica, A., Jensen, C. R. (2003). The resistance of Quinoa (Chenopodium quinoa Willd.) to adverse abiotic factors. Food Rev. Int. 19, 99–109. doi: 10.1081/FRI-120018872
Kaul, H. P., Kruse, M., Aufhammer, W. (2005). Yield and nitrogen utilization efficiency of the pseudocereals amaranth, quinoa, and buckwheat under differing nitrogen fertilization. Eur. J. Agron. 22, 95–100. doi: 10.1016/j.eja.2003.11.002
Keshtkar, A., Aien, A., Naghavi, H., Najafinezhad, H., And Shirzadi, M. H. (2022). Effect of the application of foliar jasmonic acid and drought stress on grain yield and some physiological and biochemical characteristics of Chenopodium quinoa cultivars. Tarim Bilim. Derg. 28, 171–180. doi: 10.15832/ankutbd.714568
Kumar, A., Rana, K. S., Choudhary, A. K., Bana, R. S., Sharma, V. K., Prasad, S., et al. (2021). Energy budgeting and carbon footprints of zero-tilled pigeonpea-wheat cropping system under sole or dual crop basis residue mulching and Zn-fertilization in a semi-arid agro-ecology. Energy 231, 120862. doi: 10.1016/j.energy.2021.120862
Lal, R. (2004). Carbon emission from farm operations. Environ. Int. 30, 981–990. doi: 10.1016/j.envint.2004.03.005
Langyan, S., Khan, F. N., Kumar, A. (2023). Advancement in nutritional value, processing methods, and potential applications of Pseudocereals in dietary food: a review. Food Bioprocess Technol. 16, 1–20. doi: 10.1007/s11947-023-03109-x
Maamri, K., Zidane, O. D., Chaabena, A., Fiene, G., Bazile, D. (2022). Adaptation of some quinoa genotypes (Chenopodium quinoa willd.), grown in a Saharan climate in Algeria. Life 12, 1854. doi: 10.3390/life12111854
Maestro-Gaitán, I., Granado-Rodríguez, S., Orús, M. I., Matías, J., Cruz, V., Bolaños, L., et al. (2022). Genotype-dependent responses to long-term water stress reveal different water-saving strategies in Chenopodium quinoa Willd. Environ. Exp. Bot. 201, 104976. doi: 10.1016/j.envexpbot.2022.104976
Matías, J., Rodríguez, M. J., Cruz, V., Calvo, P., Reguera, M. (2021). Heat stress lowers yields, alters nutrient uptake and changes seed quality in quinoa grown under Mediterranean field conditions. J. Agron. Crop Sci. 207, 481–491. doi: 10.1111/jac.12495
Minhas, P. S., Obi Reddy, G. P. (2017). Edaphic stresses and agricultural sustainability: an Indian perspective. Agric. Res. 6, 8–21. doi: 10.1007/s40003-016-0236-4
Miranda, M., Vega-Gálvez, A., Martinez, E., López, J., Rodriguez, M. J., Henriquez, K., et al. (2012). Genetic diversity and comparison of physicochemical and nutritional characteristics of six quinoa (Chenopodium quinoa Willd.) genotypes cultivated in Chile. Food Sci. Technol. 32, 835–843. doi: 10.1590/S0101-20612012005000114
Mirsafi, S. M., Sepaskhah, A. R., Ahmadi, S. H. (2024). Quinoa growth and yield, soil water dynamics, root growth, and water use indicators in response to deficit irrigation and planting methods. J. Agric. Food Res. 15, 100970. doi: 10.1016/j.jafr.2024.100970
Oustani, M., Mehda, S., Halilat, M. T., Chenchouni, H. (2023). Yield, growth development and grain characteristics of seven Quinoa (Chenopodium quinoa Willd.) genotypes grown in open-field production systems under hot-arid climatic conditions. Sci. Rep. 13, 1991. doi: 10.1038/s41598-023-29039-4
Pathan, S., Ndunguru, G., Clark, K., Ayele, A. G. (2023). Yield and nutritional responses of quinoa (Chenopodium quinoa Willd.) genotypes to irrigated, rainfed, and drought-stress environments. Front. Sustain. Food Syst. 7. doi: 10.3389/fsufs.2023.1242187
Pradhan, A., Wakchaure, G. C., Shid, D., Minhas, P. S., Biswas, A. K., Reddy, K. S. (2023). Impact of residue retention and nutrient management on carbon sequestration, soil biological properties, and yield in multi-ratoon sugarcane. Front. Sustain. Food Syst. 7. doi: 10.3389/fsufs.2023.1288569
Präger, A., Munz, S., Nkebiwe, P., Mast, B., Graeff-Hönninger, S. (2018). Yield and quality characteristics of different quinoa (Chenopodium quinoa Willd.) cultivars grown under field conditions in Southwestern Germany. Agronomy 8, 197. doi: 10.3390/agronomy8100197
Pulvento, C., Riccardi, M., Lavini, A., Iafelice, G., Marconi, E., d'Andria, R. (2012). Yield and quality characteristics of quinoa grown in open field under different saline and non-saline irrigation regimes. J. Agron. Crop Sci. 198, 254–263. doi: 10.1111/j.1439-037X.2012.00509.x
R Development Core Team. (2015). R: a language and environment for statistical computing. Vienna, Austria: R Foundation for Statistical Computing. Available online at: https://www.R--project.org. (Accessed April 18, 2024).
Ramesh, K., Devi, K. B. S., Gopinath, K. A., Praveen, K. (2019). Geographical adaptation of quinoa in India and agrotechniques for higher productivity of quinoa. J. Pharmacognosy Phytochem. 8, 2930–2932.
Salim, S. A., Al-Hadeethi, I. K., Alobaydi, S. A. J. (2019). Role of irrigation scheduling and potassium fertilization on soil moisture depletion and distributino of quinoa root (irrigation schedulling fertilization and their effect on moisture depletion and yield). Plant Arch. 19, 3844–3852.
Shams, A. S. (2012). “Response of quinoa to nitrogen fertilizer rates under sandy soil conditions,” in Proceedings 13th international conference agronomy, faculty of agriculture (Benha University, Benha, Egypt), 9–10.
Shams, A. (2018). Preliminary evaluation of new quinoa genotypes under Sandy Soil Conditions in Egypt. Agric. Sci. 9, 1444–1456. doi: 10.4236/as.2018.911100
Sindhu, R., Khatkar, B. (2019). “Pseudocereals: nutritional composition, functional properties, and food applications,” in Food bioactives. Eds. Deka, S. C., Seth, D., Hulle, N. R. S. (Apple Academic Press, New Jersey), 129–147.
Soliz-Guerrero, J. B., de Rodriguez, D. J., Rodríguez-García, R., Angulo Sánchez, J. L., Méndez-Padilla, G. (2002). “Quinoa saponins: concentration and composition analysis,” in Trends in new crops and new uses. Eds. Janick, J., Whipkey, A. (Alexandria: ASHSPress), 110–114.
Srivastava, S., Bose, S., Parthasarathy, D., Mehta, L. (2022). Climate justice for whom? Understanding the vernaculars of climate action and justice in marginal environments of India. IDS Bull. 53, 4. doi: 10.19088/1968-2022.141
Taaime, N., Rafik, S., El Mejahed, K., Oukarroum, A., Choukr-Allah, R., Bouabid, R., et al. (2023). Worldwide development of agronomic management practices for quinoa cultivation: a systematic review. Front. Agron. 5. doi: 10.3389/fagro.2023.1215441
Tan, M., Temel, S. (2018). Performance of some quinoa (Chenopodium quinoa Willd.) genotypes grown in different climate conditions. Turkish J. Field Crops 23, 180–186. doi: 10.17557/tjfc.485617
Vilcacundo, R., Hernández-Ledesma, B. (2016). Nutritional and biological value of quinoa (Chenopodium quinoa Willd.). Curr. Opin. Food Science. 14, 1–6. doi: 10.1016/j.cofs.2016.11.007
Wang, X., Feng, Y., Yu, L., Shu, Y., Tan, F., Gou, Y., et al. (2020). Sugarcane/soybean intercropping with reduced nitrogen input improves crop productivity and reduces carbon footprint in China. Sci. Total Environ. 719, 137517. doi: 10.1016/j.scitotenv.2020.137517
Wang, N., Wang, F., Shock, C. C., Gao, L., Meng, C., Huang, Z., et al. (2022). Evaluating quinoa lodging risk and yield under different irrigation thresholds,nitrogen rates and planting densitiesin north-western China. Front. Agr. Sci. Eng. 9, 614–626. doi: 10.15302/J-FASE-2021430
Keywords: quinoa, semi-arid, shallow basaltic, sustainability, water productivity, yield
Citation: Pradhan A, Rane J, Basavaraj PS, Kumar N, Shid D, Paul NC, Pal KK and Reddy KS (2025) Optimizing crop management strategies for improved yield, water productivity, and sustainability of quinoa in shallow basaltic semi-arid regions. Front. Plant Sci. 16:1522995. doi: 10.3389/fpls.2025.1522995
Received: 05 November 2024; Accepted: 17 February 2025;
Published: 10 March 2025.
Edited by:
Ravinder Kumar, Indian Agricultural Research Institute (ICAR), IndiaReviewed by:
Basavaiah Mohan Raju, University of Agricultural Sciences, Bangalore, IndiaDinesh Jinger, Indian Institute of Soil and Water Conservation (ICAR), India
Copyright © 2025 Pradhan, Rane, Basavaraj, Kumar, Shid, Paul, Pal and Reddy. This is an open-access article distributed under the terms of the Creative Commons Attribution License (CC BY). The use, distribution or reproduction in other forums is permitted, provided the original author(s) and the copyright owner(s) are credited and that the original publication in this journal is cited, in accordance with accepted academic practice. No use, distribution or reproduction is permitted which does not comply with these terms.
*Correspondence: Aliza Pradhan, YWxpemFwcmFkaGFuQGdtYWlsLmNvbQ==