 Lin Yang1
 Dan He
- 1Chongqing Pharmaceutical Preparation Engineering Technology Research Center, Chongqing Medical and Pharmaceutical College, Chongqing, China
- 2Chongqing Research Center for Pharmaceutical Engineering, College of Pharmacy, Chongqing Medical University, Chongqing, China
- 3Medicinal Chemistry Institute of Traditional Chinese Medicine, Chongqing Academy of Chinese Material Medica, Chongqing, China
Quisqualis fructus (QF) is a traditional Chinese medicine (TCM) that it has a long history in the therapeutic field of killing parasites, eliminating accumulation, and stopping diarrhea. However, the therapeutic material basis of QF is remaining ambiguous nowadays. The geographical origin differences of QF are also usually ignored in the process of medication. In this study, the alcohol–aqueous soluble constituents in QF from different origins were systematically characterized and accurately measured by ultra-high performance liquid chromatography coupled to quadrupole-time-of-flight mass spectrometry (UPLC-Q-TOF-MS) and high-performance liquid chromatography (HPLC) respectively. Chemometric analysis was performed for origin differentiation and screening of potential quality marker (Q-marker). Finally, A total of 106 constituents were tentatively characterized in positive and negative ion modes, including 29 fatty acids, 26 organic acids, 11 amino acids and derivatives, 10 glycosides, 9 alkaloids and derivatives, and 21 other constituents. QF from different origins were effectively distinguished and 16 constituents were selected as the potential Q-markers subsequently. Four representative components (trigonelline, adenosine, ellagic acid, and 3,3’-di-O-methylellagic acid) in QF samples were simultaneously determined. HPLC fingerprint analysis indicated that the similarity between 16 batches of QF was in the range of 0.870–0.999. The above results provide some insights for the research on the pharmacodynamic constituents, quality control, and geographical discrimination of QF.

Graphical Abstract
1 Introduction
Quisqualis fructus (QF) is a dried ripe fruit belonging to the combretum family with an oval shape and five longitudinal edges, 2.5–4 cm long and approximately 2 cm in diameter, dark brown to purple-black on the surface. It has the following functions: killing parasites and eliminating accumulation, strengthening the spleen, and stopping diarrhea in the clinic (China Pharmacopoeia [Part I], 2020). Modern pharmacological research revealed that the alcohol extract of QF has insecticidal properties such as anti-mosquito, anti-silkworm, and anti-Giardia lamblia (Govindarajan et al., 2016; Cao et al., 2023), as well as antibacterial (Agarwal et al., 2017) and antioxidant (Rastogi et al., 2019) characteristics; it can also inhibit liver cancer cell proliferation (Song et al., 2021) and improve benign prostatic hyperplasia (Kim et al., 2020). It is one of the clinical prescription ingredients that include 50 kinds of Chinese patent medicine prescriptions and 166 kinds of herbal prescriptions. However, research on the pharmacodynamic constituents, quality control, and origin differences of QF is relatively rare by retrieving relevant databases such as PubMed, CNKI, and Web of Science (Yaozh Traditional Chinese medicine of Quisqualis indica L., 2024).
The medical books in past dynasties recorded that QF originated in India. It was first recorded in “southern grasses and trees” of the Jin Dynasty with the name of “Liu Qiu Zi” (Wang et al., 2015). It was one of the major genuine medicinal materials in Chongqing China according to the fourth national survey of traditional Chinese medicine (TCM) resources, and also widely distributed in the southwest regions such as Sichuan, Yunnan, and Guangxi provinces in China (Zhong et al., 2020). Genuine medicinal materials is usually selected based on the quality standard, whereas research on relevant material basis and quality evaluation of QF is deficient both domestically and globally all the time (Luo et al., 2021). In terms of the qualitative analysis aspect, a previous study reported that nine constituents including 3,3’-di-O-methylellagic acid, 3,3’,4’-tri-O-methylellagic acid, and others were isolated and identified from the ethanol extract of QF by traditional separation and purification (Zhang et al., 2015). It is not neglected that the above approach has limitations such as cumbersome operation and incomplete identification. In terms of the quantitative analysis aspect, trigonelline and quisqualic acid in QF were determined simultaneously by ultra-hydrophilic interaction chromatography-tandem mass spectrometry (UHILIC-MS/MS). They were also determined individually by high-performance liquid chromatography (HPLC) through pre-column derivatization (China Pharmacopoeia [Part I], 2020; Liao et al., 2021; Wang et al., 2023), while the single constituent is monotonous to comprehensively reflect the quality of QF.
Ultra-high-performance liquid chromatography coupled with quadrupole time-of-flight mass spectrometry (UPLC-Q-TOF-MS) combines the efficient and rapid separation ability of chromatography, as well as the accurate and sensitive qualitative and quantitative ability of mass spectrometry. With the advantages of high sensitivity and high resolution, a scanning speed of microseconds, and a wide range of quality detection, it was widely utilized to identify chemical constituents, evaluate quality, and elucidate the pharmacodynamic mechanism of TCM (Ma et al., 2022; Yang et al., 2023). As a significant data processing means for quality control and authentication of various herbs, chemometrics could visualize the repetitive data by explaining and simplifying the large amount of data information generated by high-throughput mass spectrometry (Rebiai et al., 2022). Furthermore, the fast and convenient approach of HPLC has also played a vital role in the quality evaluation of TCM during the past few decades (Ren et al., 2020).
In this study, the chemical constituents including 16 batches of QF samples from four main producing areas were identified and parsed by UPLC-Q-TOF-MS. Subsequently, chemometrics was employed to screen potential Q-markers and compare the geographical differences of QF from different origins. In combination with the above qualitative result, a rapid and convenient reversed-phase HPLC method was established to simultaneously determine the four constituents of QF, namely, trigonelline, adenosine, ellagic acid, and 3,3’-di-O-methylellagic acid. Meanwhile, fingerprints were utilized to evaluate the similarity of QF between 16 batches. Overall, the above research comprehensively elucidated the therapeutic material basis of QF by qualitative analysis and effectively distinguished the origin differences by chemometric analysis. The established quantitative analysis approach could be widely used for quality evaluation in the future.
2 Materials and methods
2.1 Chemicals and materials
Acetonitrile (LC-MS grade) and methanol (HPLC grade) were purchased from Merck (Darmstadt, Germany). Formic acid (HPLC grade) and sodium 1-octane sulfonate (HPLC grade) were purchased from Shanghai Mackin Biochemical Co., Ltd (Shanghai, China). Phosphoric acid (HPLC grade) and other analytical reagents (AR) were obtained from Chuandong Chemical Group Co., Ltd (Chongqing, China). Distilled water was obtained by a Milli-Q water system (Millipore, Bedford, MA, USA). Trigonelline (315D021), ellagic acid (P1884386), and 3,3’-di-O-methylellagic acid (P2775319) were purchased from Shanghai Taitan Bio-Technology Co., Ltd (Shanghai, China). Adenosine (110879–200202), arginine (140685–202209), glutamic acid (140690–202305), palmitic acid (190029–201904), and myristic acid (190162–201501) were purchased from the National Institutes for Food and Drug Control. The purity of all compounds was not less than 98%.
2.2 Plant materials and sample preparation
A total of 16 samples of QF from Chongqing (S1–S4), Sichuan (S5–S8), Yunnan (S9–S12), and Guangxi (S13–S16) were purchased from native herb markets and drug retail stores in various producing areas. It was identified as the dry and mature fruit of Quisqualis fructus by Associate Researcher Qin Weihan (Chongqing Institute of Traditional Chinese Medicine).
2.3 Standard solutions and sample preparation
The standard stock solutions of trigonelline, ellagic acid, 3,3’-di-O-methylellagic acid, adenosine, arginine, glutamic acid, palmitic acid, and myristic acid were made by accurate weight and individual dissolution in methanol. To obtain a series of working standard solutions, the above stock solutions were mixed and diluted to the appropriate concentration in methanol gradually. Finally, all solutions were stored at 4°C until analysis.
According to the extraction method of Chinese Pharmacopoeia (China Pharmacopoeia [Part I], 2020), the QF samples were pulverized as powder and passed through an 80-mesh sieve for subsequent utilization. The powder (0.5 g) was accurately weighed and ultrasonically extracted in 80% methanol (5 mL) for 30 min (250 W, 40 kHz). It was centrifuged at 10,000 rpm for 5 min and passed through a 0.22-μm microporous membrane for HPLC analysis. Furthermore, the above solutions were used for UPLC-Q-TOF analysis after 20 times dilution. Moreover, blank solution was prepared in the same way for the deduction of background interference. Mixing aliquots of each sample was taken as quality control (QC) sample, and it was used to investigate the stability and repeatability every six sequence samples.
2.4 UPLC-QTOF-MS conditions
A Shimadzu LC 20ADXR UPLC system (Kyoto, Japan) coupled with an ACE Excel 3 Super C18 column (100 mm × 2.1 mm, 3.0 μm) was used for chromatographic separation. The mobile phase was 0.1% formic acid in water (A) and acetonitrile (B) with a flow rate of 0.25 mL/min. The injection volume was 2 μL. The conditions of gradient elution were as follows: 0–1.2 min, 6% B; 1.2–9.5 min, 6%–75% B; 9.5–11 min, 75%–90% B; 11.0–13 min, 90% B; 13–14 min, 90% B; 14–15 min, 6% B.
Mass spectrometry was performed on an AB SCIEX Q-TOF 5600 mass spectrometer (Foster City, CA, USA) with an ESI source. Information-dependent acquisition (IDA) of ions was employed in both positive and negative ion modes with the mass range of 100–1,000 m/z. The ion temperature was 600°C with the 5,500 V and −4,500 V of spray voltages. The ion source gas 1 (GS1), ion source gas 2 (GS2), and curtain gas (CUR) were 55 psi, 55 psi, and 25 psi, respectively. The declustering potential, collision energy, and collision energy spread were 100 eV, 40 eV, and 15 eV, respectively. Multiple mass defect function and dynamic background subtraction were the conditions to trigger the second stage and gave priority to secondary scanning.
2.5 HPLC conditions
A Shimadzu LC 20AT HPLC system coupled with an SPD-M40 detector (Kyoto, Japan) was used for quantitative analysis. The column of Thermo GOLD C18 (250 mm×4.6 mm, 5 μm) was maintained at 30°C. The flow rate of the mobile phase was 1 mL/min with 0.1% phosphoric acid–10 mmol/L sodium 1-octane sulfonate in water (A) and acetonitrile (B). The conditions of gradient elution were as follows: 0–20 min, 3%–8% B; 20–30 min, 8%–10% B; 30–45 min, 10%–15% B; 45–60 min, 15%–40% B; 60–70 min, 40% B. The injection volume and detection wavelength were 20 μL and 254 nm, respectively.
2.6 Data processing and analysis
Raw UPLC-QTOF-MS files of each batch were imported into Peakview1.2 software for self-constructed database comparison, which was constructed according to relevant literature, including chemical names, molecular formula, and CAS numbers. After converting the raw UPLC-QTOF-MS files from wiff to abf format by the ABF converter, each raw file was imported into MS Dial for public database comparison (http://prime.psc.riken.jp/compms/msdial/main.html#MSP), including peak extraction, peak recognition, peak alignment, setting of addition ion, and importing database.
Chemometric analysis was performed on SIMCA14.1 software (Umetrics AB, Umea, Sweden). To obtain the three-dimensional matrix data [including sample name, retention time-mass charge ratio (tR-m/z), and peak intensity] of UPLC-QTOF-MS for chemometric analysis, peak extraction, peak alignment, peak matching, and normalization were performed by using Notepad software. The similarity evaluation was performed on the Similarity Evaluation System for Chromatographic Fingerprint of Traditional Chinese Medicine (2012 Edition).
3 Results and discussion
3.1 Qualitative analysis of QF from different origins by UPLC-Q-TOF-MS
The extract solutions of QF were comprehensively identified through UPLC-Q-TOF-MS. The total ion chromatograms (TICs) in positive and negative ion mode are displayed in Figure 1. Meanwhile, the chemical constituents containing secondary fragment ions were analyzed and processed in Peakview1.2 and MS Dial ver.5.1 software. A total of 106 constituents were identified and characterized through the self-constructed database, public database, relevant literature, and reference standard, namely, 29 fatty acids, 26 organic acids, 11 amino acids and derivatives, 10 glycosides, 9 alkaloids and derivatives, and 21 other compounds. Among them, 68 constituents were first characterized through public database matching because of the more sensitive detection methods and comparative analysis of multiple producing areas. Meanwhile, 30 constituents were consistent with previous literature report and were further proved to be present in QF. Furthermore, eight constituents were first characterized through reference standards to provide a scientific basis for the identification of QF. The detailed information is listed in Table 1.

Figure 1 TICs of QF in the positive (A) and negative (B) mode.
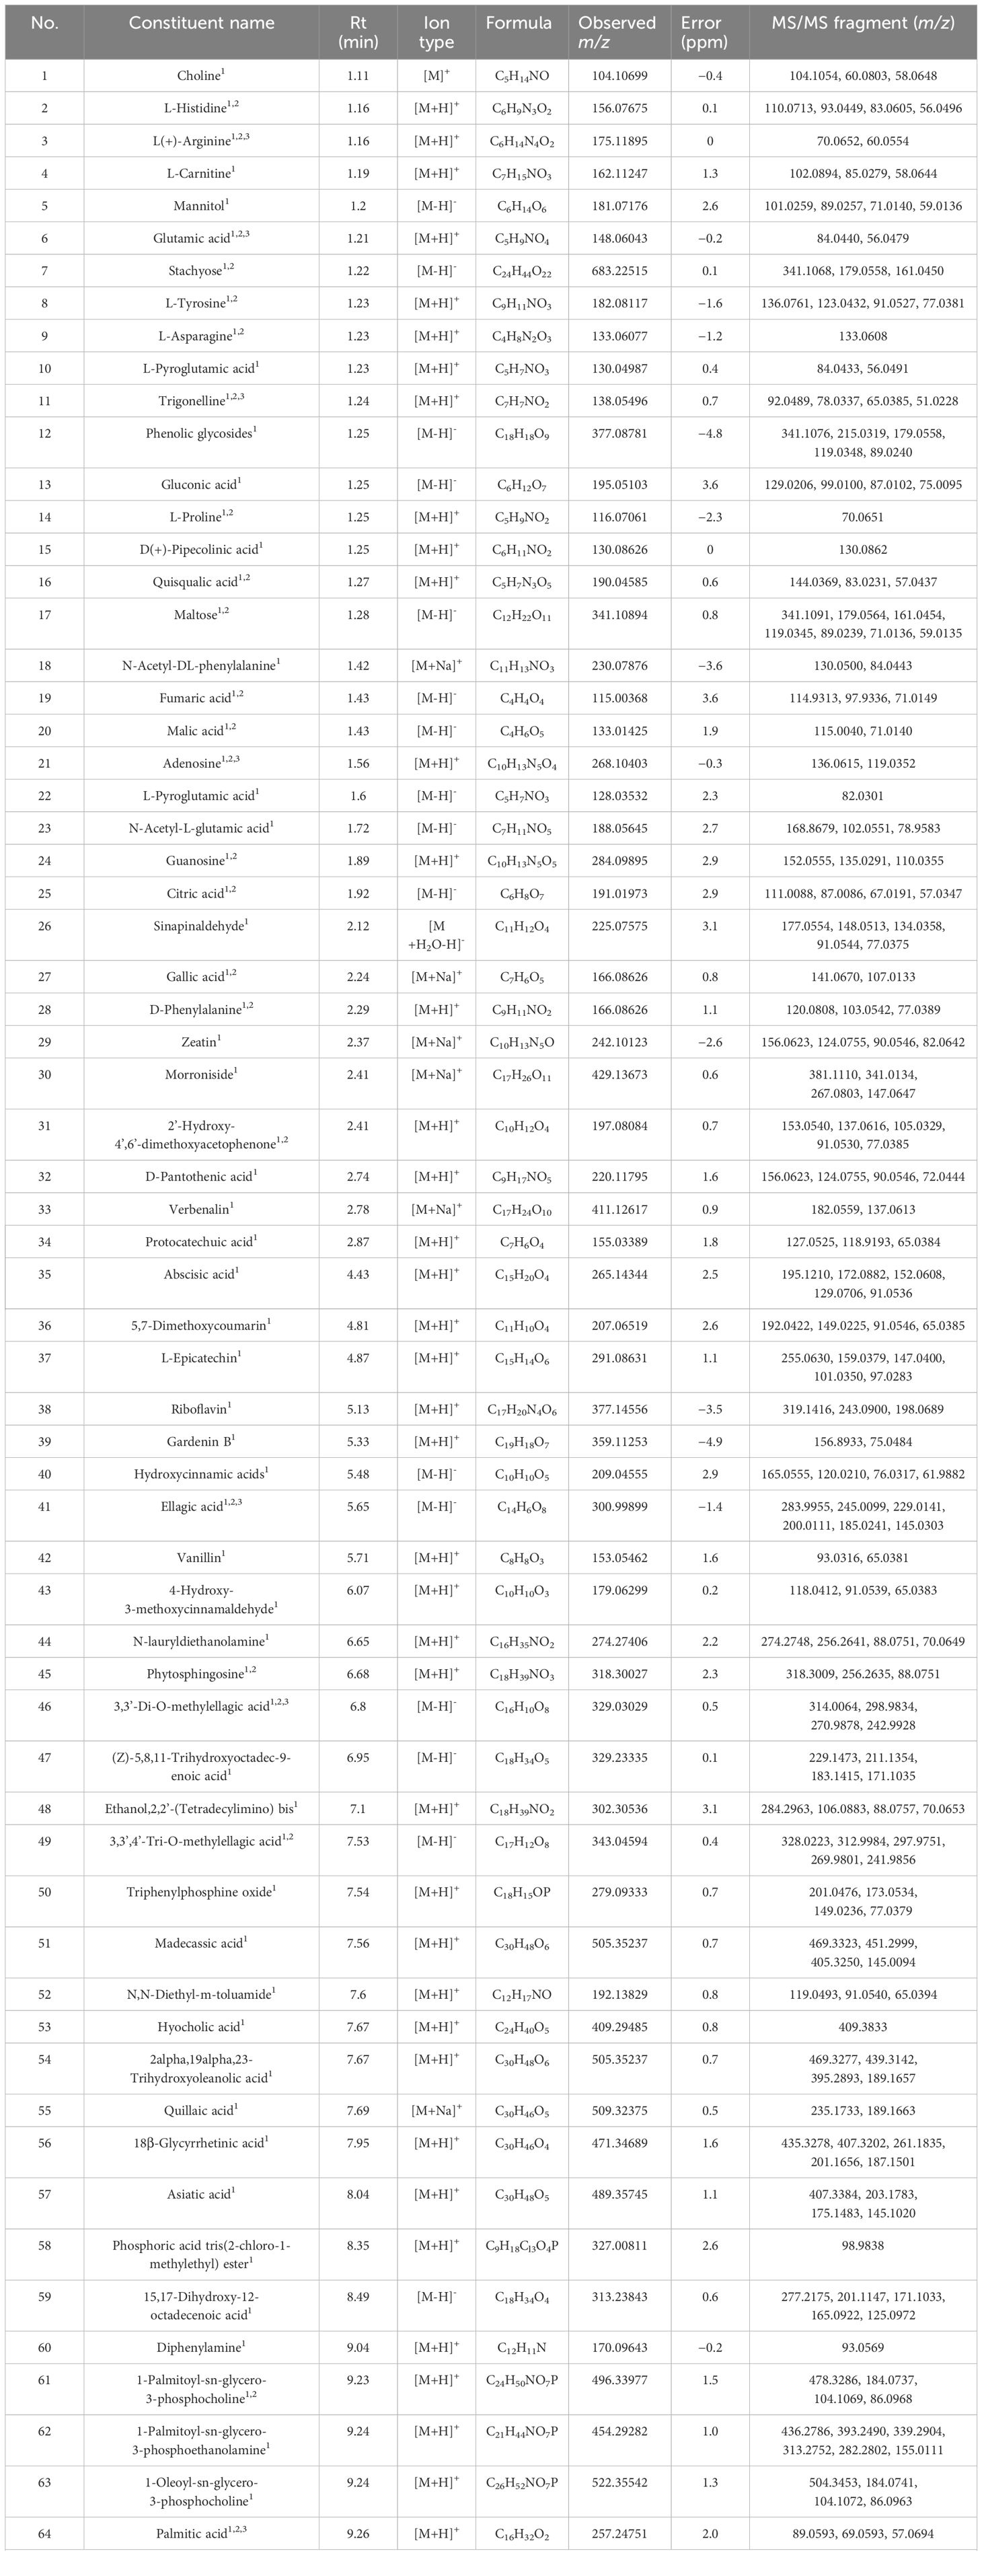
Table 1 The identified chemical constituents of QF by UPLC-Q-TOF-MS.
3.1.1 Identification of fatty acids
A total of 29 fatty acids and their derivatives were tentatively identified in QF, including 10 saturated fatty acids (48, 64, 84, 86, 93, 97–99, 102, and 104) and 19 unsaturated fatty acids (47, 59, 65, 67, 69, 70, 76, 79, 82, 83, 87, 89–92, 95, 96, 100, and 105). Take 15,17-dihydroxy-12-octadecenoic acid (constituent 59) for example to elucidate the cracking law of fatty acids. The precursor ion at m/z 313.2383 [M-H]- was predicted to be the formula of C18H34O4, and the major MS/MS fragment ions were observed at m/z 295.2281 [M-H2O-H]-, 277.2177 [M-2H2O-H]- and 183.1394 [M-2H2O-C7H10-H]-, respectively. It could be noted that the fragment ions of 295.2281 [M-H]- and 277.2177 [M-H]- were identified as 17-dihydroxy-12,14-octadecenoic acid (constituent 82) and linolenic acid (constituent 83) based on accurate mass weights and public database comparison. The process of cracking was illustrated in Figure 2A. Meanwhile, the fatty acids of constituent 64 (glutamic acid) and 97 (myristic acid) were identified based on reference standard and previous literature (Lu et al., 2014; Dai et al., 2024).
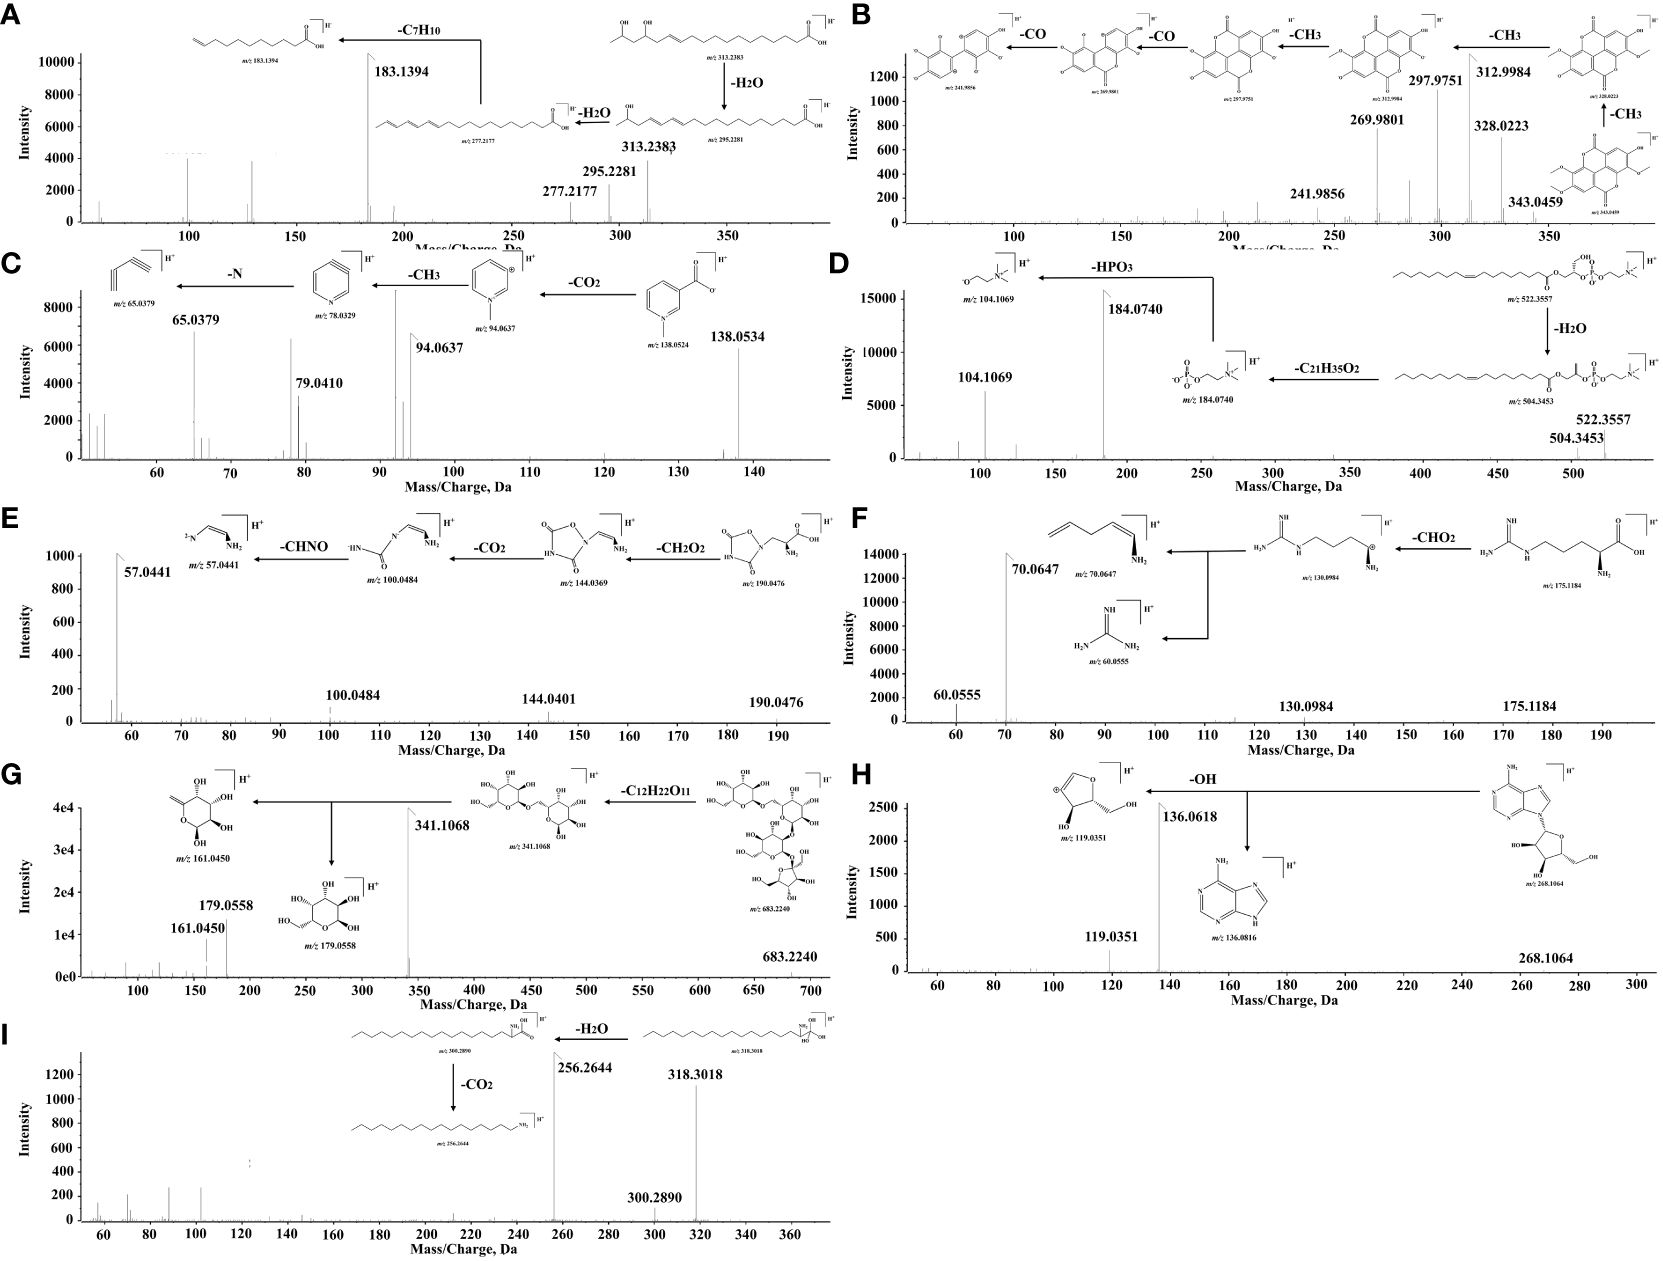
Figure 2 The cracking process of main compounds. (A) 15,17-Dihydroxy-12-octadecenoic acid. (B) 3,3’,4’-O-Trimethyl ellagic acid. (C) Trigonelline. (D) 1-Oleoyl-sn-glycero-3-phosphocholine. (E) Quisqualic acid. (F) L (+)-Arginine. (G) Stachyose. (H) Adenosine. (I) Phytosphingosine.
3.1.2 Identification of organic acids and phenolic acids
A total of 26 organic acids and phenolic acids (6, 15, 19, 20, 25, 27, 31, 32, 34, 35, 37, 39–42, 46, 49, 53–57, 66, 71, 81, and 88) were initially characterized in QF. For instance, the formula of C17H12O8 was inferred according to the precursor ion at m/z 343.0459 [M-H]-, and the MS/MS fragment ions were exhibited at m/z 328.0223 [M-CH3-H]-, 312.9984 [M-2CH3-H]-, 297.9751 [M-3CH3-H]-, 269.9801 [M-3CH3-CO-H]-, and 241.9856 [M-3CH3-CO-H]-, respectively. The successive neutral losses of CH3 were easily produced, which may be attributed to the instability of methoxy on the benzene ring. Therefore, the fragment ions at m/z 343.0459 [M-H]-, 328.0223 [M-H]-, and 297.9751 [M-H]- were ascribed as the 3,3’,4’-O-trimethyl ellagic acid (constituent 49), 3,3’-di-O-methylellagic acid (constituent 46), and ellagic acid (constituent 41), respectively. They were confirmed by the reference standards and the report of relevant literature (Zhang et al., 2015). The process of cracking is shown in Figure 2B.
3.1.3 Identification of alkaloids and derivatives
A total of nine alkaloids (1, 4, 11, 29, 61–63, 75, and 85) were potentially determined in QF. For instance, the formula of C7H8NO2 was conjectured to be trigonelline (constituent 11) based on the precursor ion at m/z 138.0524 [M+H]+ and the major MS/MS fragment ions at m/z 93.0563 [M-CHO2+H]+, 79.0410 [M-CHO2-CH2-H]+, and 65.0379 [M-CHO2-CH2-N-H]+, respectively. It was eventually confirmed by the reference standard and literature (Wang et al., 2023). The proposed cleavage pathway is presented in Figure 2C. Constituents 61, 63, 65, and 73 were presumed to be the polyene phosphatidylcholine series constituents with a similar parent ion at m/z 184.0710 [M+H]+. The precursor ion at m/z 522.3557 [M+H]+ was considered to be the formula of C26H52NO7P. It was inferred as 1-Oleoyl-sn-glycero-3-phosphocholine with the MS/MS fragment ions at m/z 504.3453 [M-H2O+H]+, 184.0740 [M-H2O-C21H35O2+H]+, and 104.1069 [M-H2O-C21H35O2-HPO3+H]+, respectively. The above constituents were preliminarily determined through the public database comparison by characteristic fragments and previous literature (Song et al., 2023). The degradation process is described in Figure 2D.
3.1.4 Identification of amino acids and derivatives
A total of 11 amino acids and derivatives (2, 3, 8, 9, 10, 14, 16, 18, 22, 23, and 28) were putatively observed in QF. For instance, the precursor ion at m/z 190.0476 [M+H]+ was deduced to be the formula of C5H7N3O5. It was inferred that the major MS/MS fragment ions of quisqualic acid were at m/z 144.0401 [M-CH2O2+H]+, 100.0484 [M-CH2O2-CO2+H]+, and 57.0441 [M-CH2O2-CO2-CHNO+H]+, respectively. It was consistent with the public database comparison and previous literature (Wang et al., 2023). The cracking rule is provided in Figure 2E. The precursor ion at m/z 175.1184 [M+H]+ was suspected to be the formula of C6H14N4O2. It was inferred to be L (+)-Arginine with the major MS/MS fragment ions at m/z 130.0984 [M-CHO2+H]+ and the cracked fragment ions at m/z 70.0647 [M+H]+ and 60.0555 [M+H]+. It was also confirmed by the public database comparison, reference standard, and previous literature (Liao, 2021). The fragmentation pathway is given in Figure 2F.
3.1.5 Identification of glycosides
A total of 10 glycosides (5, 7, 12, 13, 17, 21, 24, 30, 33 and 51) were preliminarily revealed in QF. For instance, the precursor ion at m/z 683.2240 [M-H]- was speculated to be the formula of C24H44O22. It was inferred as stachyose with the major MS/MS fragment ion at m/z 341.1068 [M-C12H22O11-H]-, which was cracked to the fragment ions at m/z 179.0558 [M-H]- and 161.0450 [M-H]- subsequently. The cracking law was in agreement with the public database comparison and previous literature (Li et al., 2023 ). The process of cleavage is shown in Figure 2G. The precursor ion at m/z 268.1064 [M+H]+ was believed to be the formula of C10H13N5O4. It was confirmed to be adenosine with the major MS/MS fragment ion at m/z 136.0618 [M+H]+ and 119.0351 [M+H]+, which was the same as the database comparison and reference standard. The cracking rule is illustrated in Figure 2H.
3.1.6 Identification of others
A total of 21 other constituents (26, 36, 38, 43–45, 50, 52, 58, 60, 68, 72–74, 77, 78, 80, 94, 101, 103, and 106) were tentatively presumed in QF. For instance, the precursor ion at m/z 318.3018 [M+H]+ was considered to be the formula of C18H39NO3. It was inferred as phytosphingosine with the major MS/MS fragment ion at m/z 300.2090 [M-H2O+H]+, which was cracked to the fragment ion at m/z 256.2644 [M-H2O-CO2+H]+ due to the unstable enol structure. It was identified through database comparison by characteristic fragment ions and previous literature (Liu et al., 2014). The cracking process is described in Figure 2I. Moreover, other constituents were also preliminarily identified through public database comparison by the characteristic fragments and previous literature (Wen et al., 2020).
3.2 Chemometric analysis
To screen potential Q-markers and compare geographical differences of QF from different origins, chemometric analysis was performed for further analysis. The converted data including 2,552 variables in positive ion mode and 912 variables in negative ion mode were employed for principal component analysis (PCA), which was an unsupervised recognition mode and could observe the distribution trend of samples through data downscaling. Model parameters of PCA in positive (R2X = 0.649, Q2 = 0.266) and negative (R2X = 0.802, Q2 = 0.421) modes were relatively poor. Cumulative variance contribution rate (PC1 and PC2) explained 24.6% and 17.1% in positive ion mode, and explained 36.9% and 12.1% in negative ion mode, respectively. The score plot of PCA (Figures 3A, 4A) showed that the distinction between CQ, SC, and YN samples was ambiguous except for GX samples.
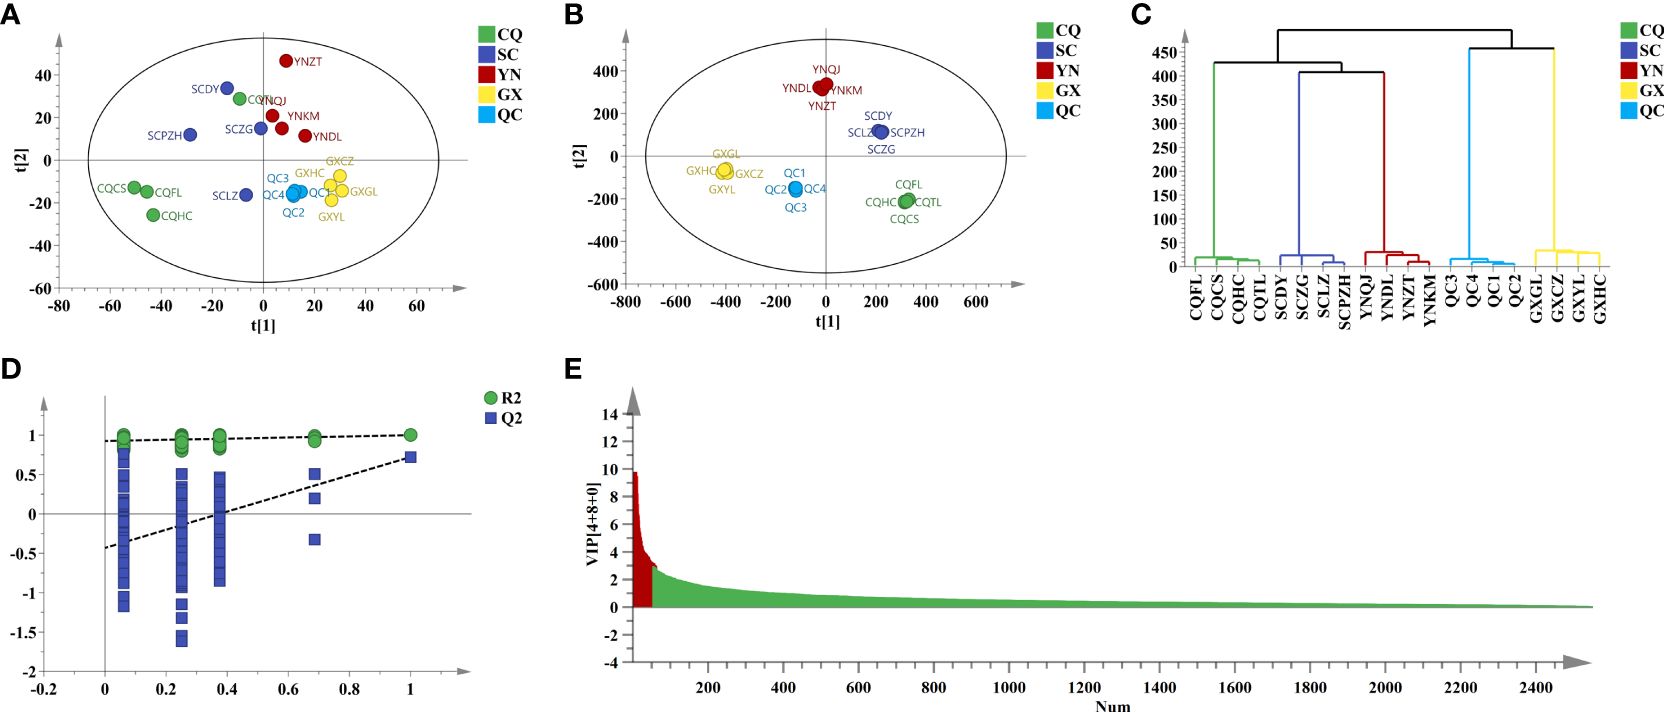
Figure 3 Chemometric analysis of QF from different origins in pos. (A) PCA score plot. (B) OPLS-DA score plot. (C) HCA score plot. (D) Two hundred times permutation. (E) VIP value.
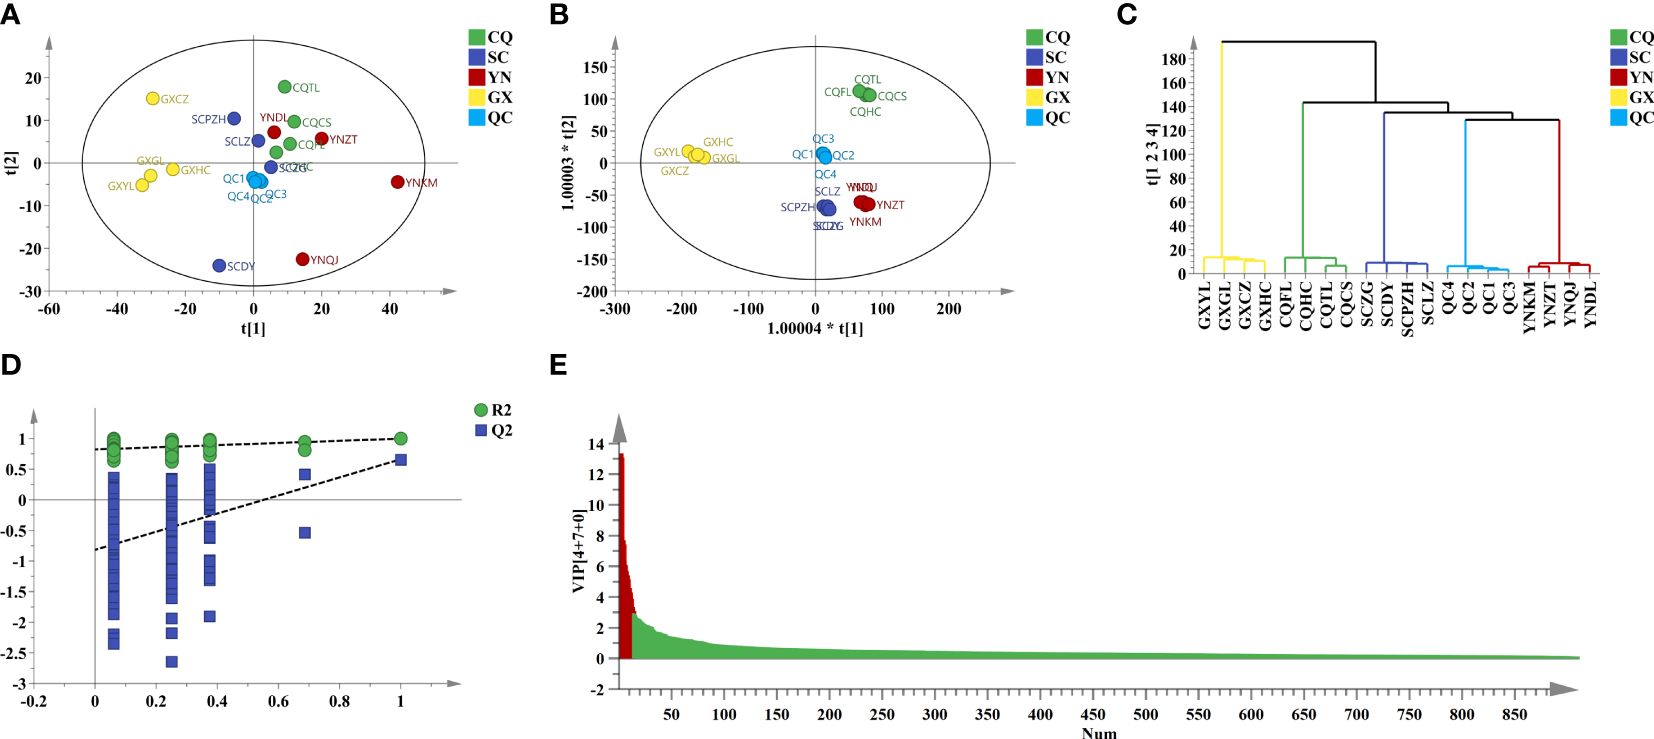
Figure 4 Chemometric analysis of QF from different origins in neg. (A) PCA score plot. (B) OPLS-DA score plot. (C) HCA score plot. (D) Two hundred times permutation. (E) VIP value.
To amplify the differences between groups and visual presentation, orthogonal partial least squares discriminant analysis (OPLS-DA) was applied subsequently to better-distinguished origins. The model parameters of OPLS-DA in positive (R2X = 0.926, R2Y = 0.997, and Q2 = 0.740) and negative (R2X = 0.975, R2Y = 0.995, and Q2 = 0.604) ion modes were greater than 0.5, which indicated that the reliability and predictability of the model were well (Gao et al., 2023). The score plot of OPLS-DA (Figures 3B, 4B) showed that the QF from different origins could be divided into four categories based on geographical resources. The distinction of hierarchical cluster analysis (HCA) presented in Figures 3C, 4C was more obvious and intuitive, which was consistent with the result of OPLS-DA. The validity of the model was evaluated by 200 permutation tests (Figures 3D, 4D). The model parameter of 200 permutation tests in positive (R2 = 0.927, Q2 = −0.432) and negative (R2 = 0.822, Q2 = −0.817) ion modes indicated that the model was not over-fitting.
Potential Q-makers in QF were screened by variable importance for projection (VIP). The higher the VIP score (Figures 3E, 4E) of the constituents presented, the more relevant to origin distribution. A total of 16 components were screened with a VIP score > 3 and p-value > 0.05, as presented in Table 2. Among them, the fatty acids including oleic acid, palmitic acid, linoleic acid, linolenic acid, myristic acid, glyceryl monooleate, and 17-dihydroxy-12,14-octadecenoic acid were the common constituents in plants with the various pharmacological activities including cardiovascular disease and anti-inflammatory and immunomodulatory effect (Shayan et al., 2020; Coniglio et al., 2023). The polysaccharides including stachyose and maltose have the effects of regulating gut microbiota and liver protection (Cui et al., 2021; Xu et al., 2022). The polyene phosphatidylcholine including 1-oleoyl-sn-glycero-3-phosphocholine and POPC could ameliorate synovial inflammation and acute liver injury (Sun et al., 2023; Yin et al., 2023). As the characteristic components in QF, trigonelline, quisqualic acid, and 3,3’-di-O-methylellagic acid had several pharmacological activities including antidiabetic effects, neural paralysis, anticancer, and others (Ranger et al., 2011; Rad et al., 2022; Liang et al., 2023). They could be widely used for quality evaluation in the future. The rich pharmaceutical active ingredients in QF reflected the enormous development prospects in TCM discovery.
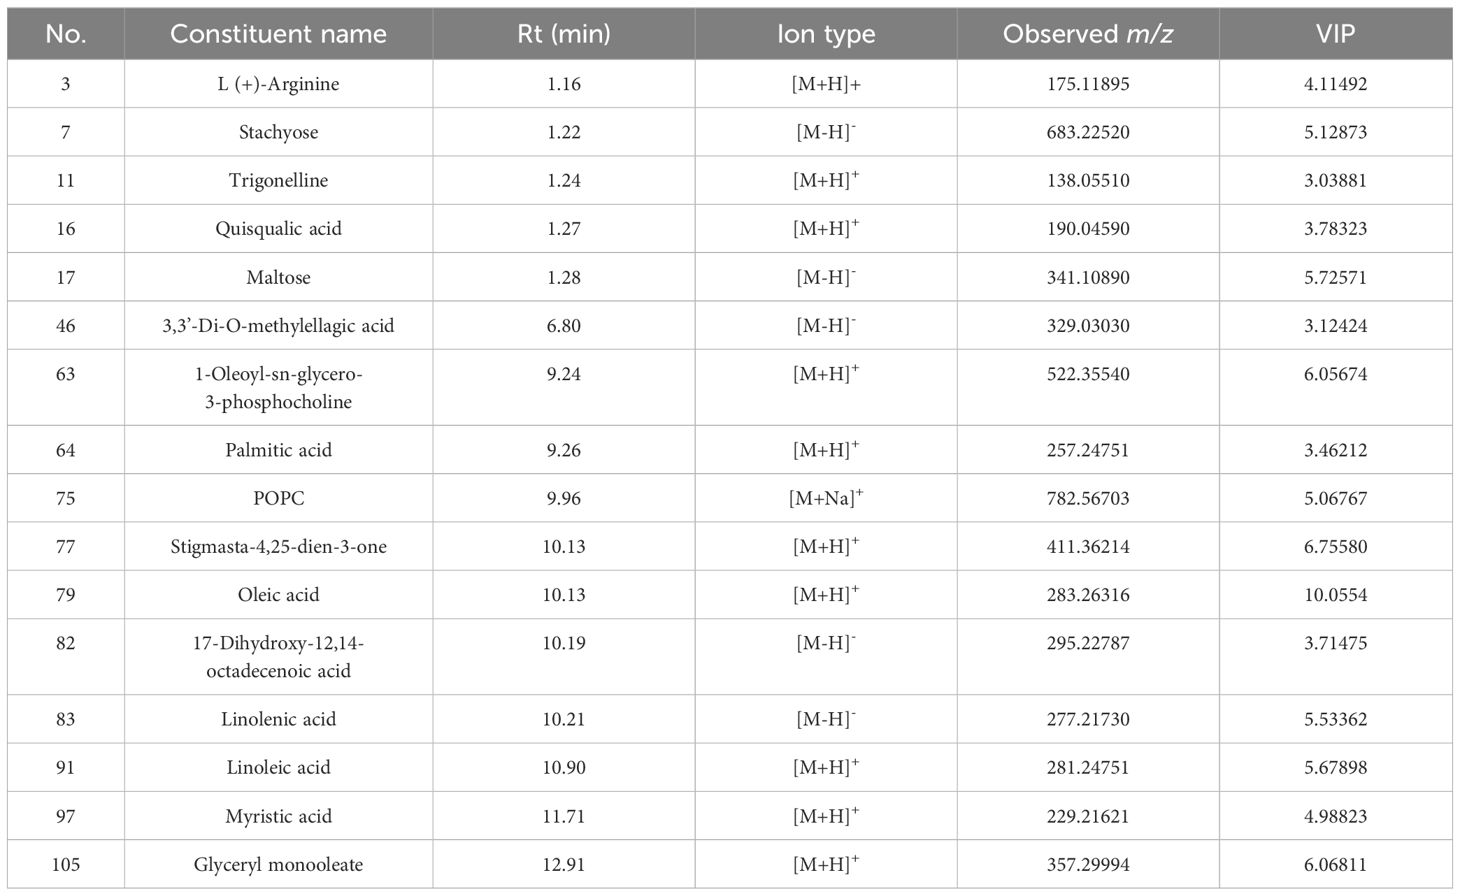
Table 2 Screening potential quality markers in different origins of QF.
3.3 Quantitative analysis of QF from different origins
3.3.1 Condition optimization
In this study, the extraction method (ultrasonication and reflux), extraction time (15 min, 30 min, 45 min, and 60 min), extraction solvent (water and 25%, 50%, 80%, and 100% methanol), and solvent–sample ratios (10:1, 20:1, 35:1, and 50:1) were investigated. It was found that 0.5 g of QF sample powder in 5 mL of 80% methanol was ultrasonically extracted for 30 min with the advantages of easy extraction, smooth chromatogram baseline, and high response of each common peak. Therefore, the above conditions were determined as the method to prepare the test solutions.
The amino column was employed to detect the content of trigonelline under the content determination in the Chinese Pharmacopoeia (China Pharmacopoeia [Part I], 2020). However, the stability and durability of amino columns are poor and not widely used. Relevant literature reported that trigonelline was an amphoteric compound, which was not retained on C18 columns. Therefore, ion-pairing reagents were added to increase its retention time on C18 columns (Arai et al., 2015). In addition, flow rates (0.8 mL/min, 1.0 mL/min, and 1.2 mL/min), column temperatures (25°C, 30°C, and 35°C), and acetonitrile and methanol with different modifiers (0.05%, 0.1%, 0.2% phosphoric acid, 4, 6, 8, 10 mmol/L sodium 1-octane sulfonate, 10 mmol/L sodium dodecyl sulfonate, and 0.2 mmol/L ammonium chloride) were optimized. The results indicated that the shape of chromatographic peaks and the separation were better when the mobile phase is as follows: In acetonitrile–10 mmol/L sodium 1-octanesulfonate with 0.1% phosphoric acid, the flow rate was 1.0 mL/min and the column temperature was 30°C. Gradient elution conditions and equilibration time before sample injection were optimized at the same time, the details as shown in Section 2.5.
The maximum absorption wavelengths of trigonelline, adenosine, ellagic acid, and 3,3’-di-O-methylellagic acid were 264 nm, 257 nm, 254 nm, and 247 nm, respectively, as depicted in Figure 5A. All of them were compared with the maximum absorption wavelength and retention time of the corresponding reference standards, which were also consistent with the results of UPLC-QTOF-MS analysis. As the wavelength at 254 nm performed a higher response of each chromatographic peak by comparing with other wavelengths, it was selected to be the detection wavelength of HPLC.
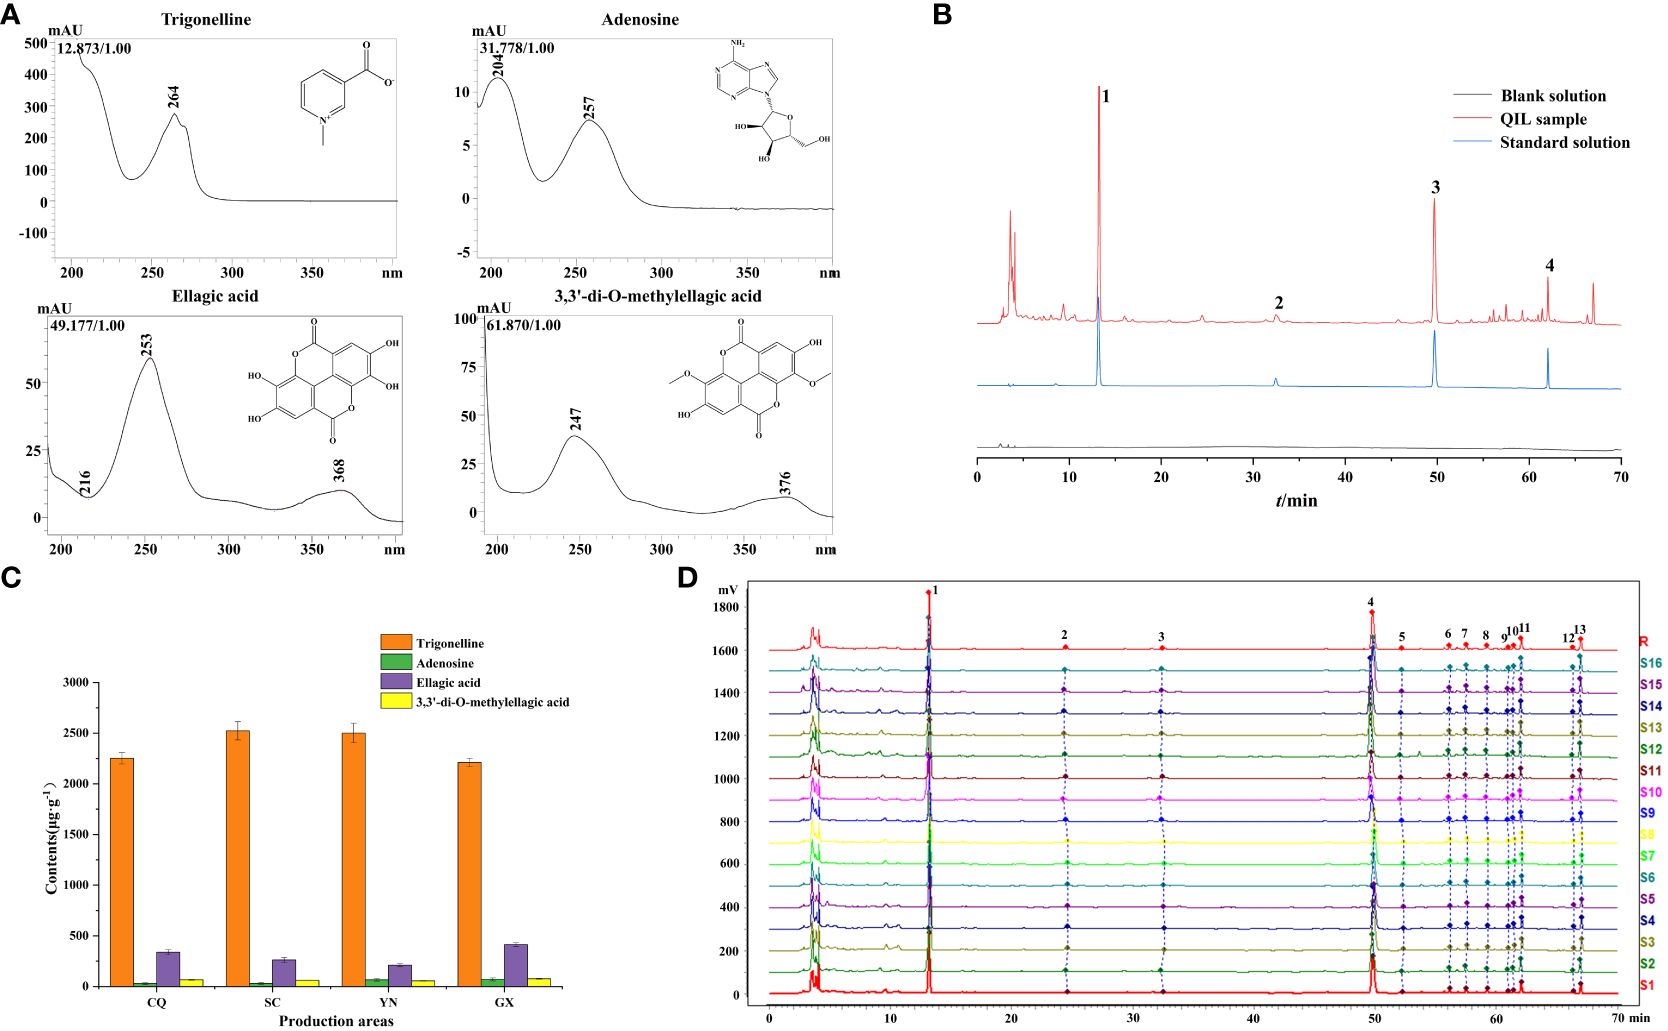
Figure 5 (A) The maximum absorption wavelengths. (B) The HPLC chromatograms of QF. (1) Trigonelline; (2) adenosine; (3) ellagic acid; (4) 3,3’-di-O-methylellagic acid. (C) The contents of target constituents in QF from different origins. (D) HPLC fingerprints of 16 batches QF.
3.3.2 Method validation
According to the Guidelines of Analytical Methods Validation in Chinese Pharmacopoeia (China Pharmacopoeia [Part I], 2020), the specificity, linearity, limit of detection (LOD), limit of quantitation (LOQ), precision, stability, repeatability, and recovery were evaluated to confirm the reliability of the established HPLC method. The HPLC chromatograms of sample S1 are demonstrated in Figure 5B for specificity. In the linearity test, the mixture of standard solutions of different concentrations was determined to establish regression equations, which were calculated by the abscissa X of concentrations (x, μg/mL) and ordinate Y of peak areas (y). Additionally, the signal-to-noise ratios of 10 and 3 were defined individually as the LOQ and LOD, which were evaluated by diluting the mixture of standard solutions successively. The appropriate mixture of standard solutions was consecutively analyzed six times for precision tests. The same S1 sample after being stored at room temperature for 0 h, 2 h, 4 h, 8 h, 12 h, and 24 h were analyzed for stability tests. Six samples of the same solution preparation method were analyzed for repeatability tests. Meanwhile, the four reference standards equivalent to 100% of the sample S1 content were added individually into the six sample S1 for recovery.
In summary, the results indicated that the correlation coefficients (r) were greater than 0.9997. The relative standard deviations (RSDs) of precision, stability, and repeatability were less than 1.5%, and the recoveries were in the range of 98.8%–103.3%, which indicated that the above method was reliable, as summarized in Table 3.
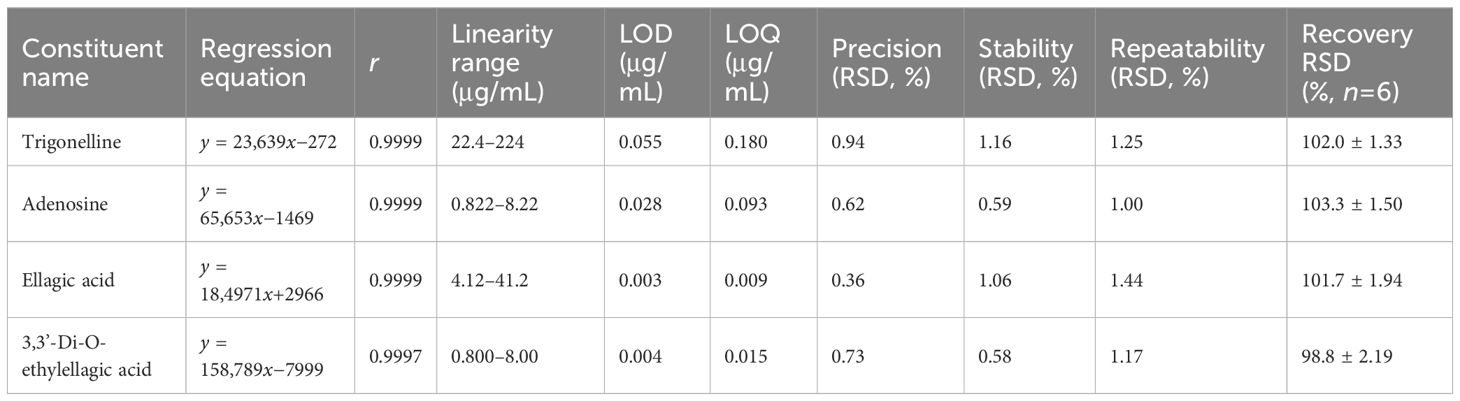
Table 3 The results of HPLC methodology validation.
3.3.3 Quantification of four target constituents
Each batch of QF powder (0.5 g) was prepared according to Section 2.3 conditions and determined according to Section 2.5 conditions. The content of four target constituents in QF was calculated through the peak area by the calibration curves. The results of content determination showed that the content of trigonelline (2,165–2,615 μg/g) and 3,3’-di-O-methylellagic acid (52.69–79.79 μg/g) in QF varied little among the different origins. It also indicated that the content of trigonelline met the requirement of Chinese Pharmacopeia (2020 edition) and was consistent with the previous report (Wen et al., 2020), while the content of adenosine (15.92–84.52 μg/g) and ellagic acid (189.3–434.8 μg/g) in QF varied greatly among the different origins. It could be observed from Figure 5C that the average content of adenosine in QF from the origins of YN (66.19 μg/g) and GX (70.30 μg/g) were significantly higher than the origins from CQ (28.29 μg/g) and SC (29.38 μg/g). The highest and lowest content of ellagic acid were found in the origins of GX (413.3 μg/g) and YN (210.1 μg/g), respectively. Meanwhile, many research has found that the above constituents were rich in pharmacological properties at the appropriate dose, such as treating memory impairment (Aktar et al., 2024), attenuating neuroinflammation (Liu et al., 2023), and immunomodulatory (Zhang et al., 2022) and antioxidant (Mohamed et al., 2018) properties. The above result of content determination provided reference for the quality evaluation and drug application.
3.3.4 HPLC fingerprints analysis
HPLC fingerprints of QF were obtained by introducing the raw data of 16 batch samples into the “Similarity Evaluation System for Chromatographic Fingerprint of Traditional Chinese Medicine (2012 Edition)” software in AIA format. A total of 13 peaks were matched as the common constituents after setting the 0.2 widths of the time window, matching automatically and taking S1 as the reference spectrum (R). Moreover, the peak 1 (Trigonelline), peak 3 (Adenosine), peak 4 (Ellagic acid), and peak 11 (3,3’-di-O-methylellagic acid) were identified based on reference standard comparison and maximum absorption wavelengths. The HPLC fingerprints of 16 batches of QF are shown in Figure 5D. In addition, peak 1 (Trigonelline) was set as the reference peak to evaluate the reliability of the method and conditions. It showed that the RSDs of the retention time (RT) and average peak area of the other 12 common peaks were less than 3%, indicating that the method was admitted with perfect precision, accurate repeatability, and stable test solution.
The results of the similarity evaluation are provided in Table 4. The similarity between 16 batches of QF was in the range of 0.870–0.999, indicating that the active compounds of QF from different origins were extremely similar. The established HPLC fingerprint method of QF could be used for quality consistency evaluation and species identification in the future.
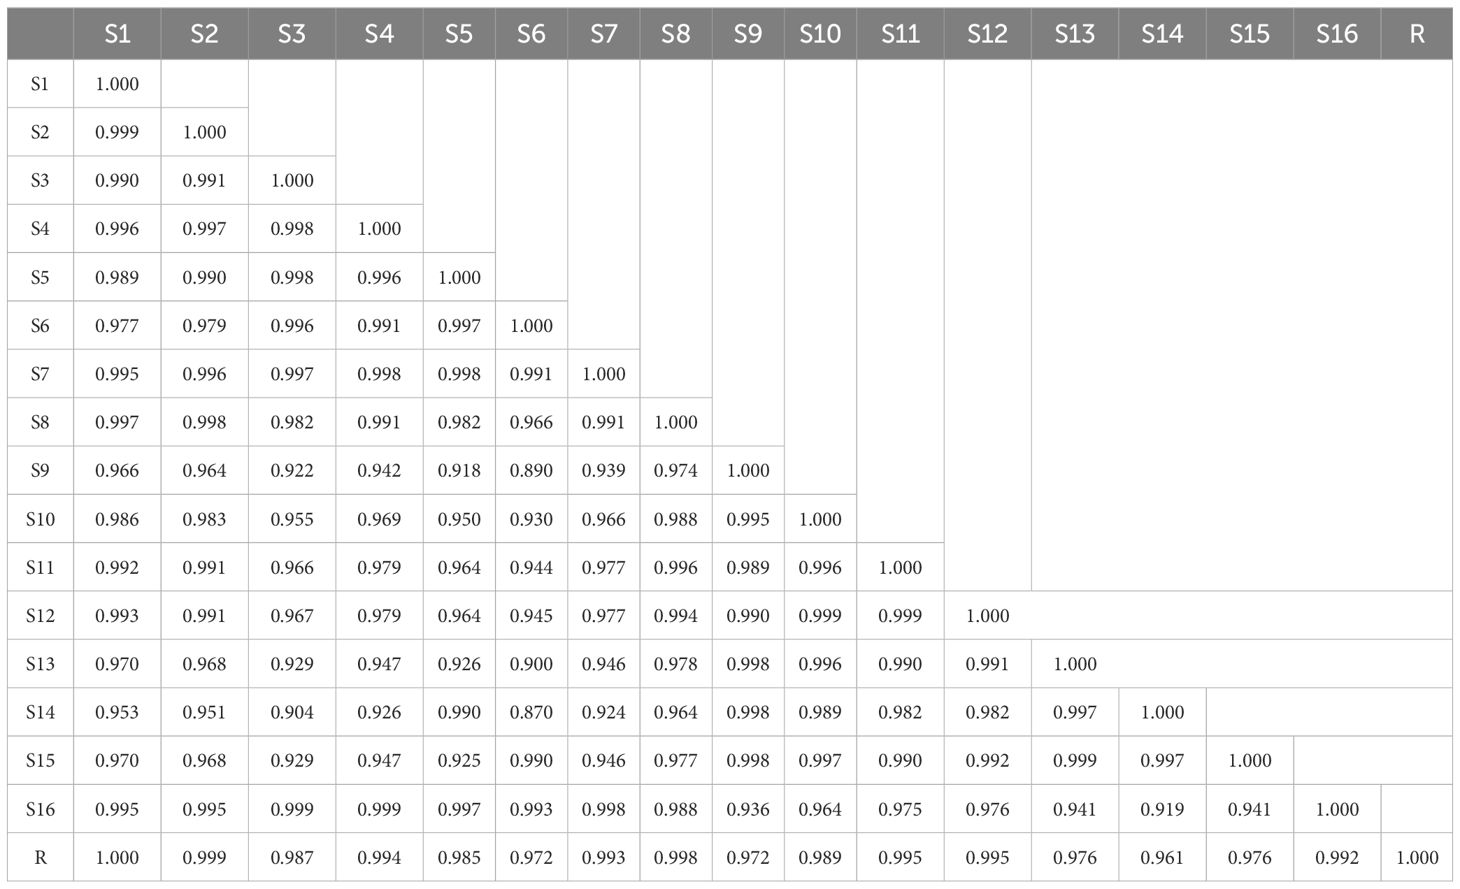
Table 4 The results of similarity evaluation between different batches of QF.
4 Conclusion
In this study, an accurate and systematic UPLC-Q-TOF-MS approach was first established to characterize the alcohol–aqueous soluble constituents of QF from different origins. A total of 106 constituents were tentatively identified through reference standards, public database comparison, and previous literature, namely, 29 fatty acids, 26 organic acids, 11 amino acids and derivatives, 10 glycosides, 9 alkaloids and derivatives, and 21 other compounds. Among them, a total of 68 constituents, 30 constituents, and 8 constituents were characterized through database matching, previous report, and reference standards, respectively. The chemometric analysis was utilized to screen potential Q-markers and compare the differences in the geographical origin of QF. Eventually, QF from different origins were effectively distinguished and 16 components were screened as the important differential markers.
In addition, an effective and convenient reversed-phase HPLC method was established to simultaneously determine four target constituents in QF. Meanwhile, it was confirmed that the analytical method was reliable in terms of linearity, precision, stability, repeatability, and recovery. The HPLC fingerprint of QF further proved that the common constituents of 16 batches of QF were extremely similar, and the similarity was in the range of 0.870–0.999. The above research provides some insights for the research on the pharmacodynamic constituents, quality control, and origin identification of QF. It also lays a scientific basis for the effective utilization and development of QF.
Data availability statement
The original contributions presented in the study are included in the article/supplementary material. Further inquiries can be directed to the corresponding author.
Author contributions
DH: Funding acquisition, Supervision, Writing – review & editing. LD: Conceptualization, Data curation, Writing – original draft. LY: Conceptualization, Data curation, Writing – original draft. WQ: Formal analysis, Project administration, Writing – review & editing. YW: Formal analysis, Project administration, Writing – review & editing. JZ: Investigation, Methodology, Writing – review & editing. SP: Investigation, Methodology, Writing – review & editing.
Funding
The author(s) declare financial support was received for the research, authorship, and/or publication of this article. This research was supported by grants from the Research Program of Chongqing Municipal Education Commission (KJQN202302814) and Chongqing Graduate Tutor Team Construction Project of Chongqing Municipal Education Commission Foundation (cqmudstd202216).
Conflict of interest
The authors declare that the research was conducted in the absence of any commercial or financial relationships that could be construed as a potential conflict of interest.
Publisher’s note
All claims expressed in this article are solely those of the authors and do not necessarily represent those of their affiliated organizations, or those of the publisher, the editors and the reviewers. Any product that may be evaluated in this article, or claim that may be made by its manufacturer, is not guaranteed or endorsed by the publisher.
References
Agarwal, A., Prajapati, R., Raza, S. K., Thakur, L. K. (2017). GC-MS analysis and antibacterial activity of aerial parts of quisqualis indica plant Extracts Indian. J. Pharm. Educ. 51, 329–336. doi: 10.5530/ijper.51.2.39
Aktar, S., Ferdousi, F., Kondo, S., Kagawa, T., Isoda, H. (2024). Transcriptomics and biochemical evidence of trigonelline ameliorating learning and memory decline in the senescence-accelerated mouse prone 8 (SAMP8) model by suppressing proinflammatory cytokines and elevating neurotransmitter release. Geroscience 46, 1671–1691. doi: 10.1007/s11357-023-00919-x
Arai, K., Terashima, H., Aizawa, S., Taga, A., Yamamoto, A., Tsutsumiuchi, K., et al. (2015). Simultaneous determination of trigonelline, caffeine, chlorogenic acid and their related compounds in instant coffee samples by HPLC using an acidic mobile phase containing octanesulfonate. Anal. Sci. 31, 831–835. doi: 10.2116/analsci.31.831
Cao, X. Q., Tong, Y., Fang, Z. F., Shi, L., Fang, H., Liu, J. C. (2023). Study on Combretum indicum extracts against Giardia intestinalis in vitro, Heilongjiang Anim. Sci. Vet. Med. 66, 110–115+126. doi: 10.13881/j.cnki.hljxmsy.2022.07.0101
Chinese Pharmacopoeia Commission (2020). Pharmacopoeia of China, part 1 (Beijing, China: China Medical Science Press).
Coniglio, S., Shumskaya, M., Vassiliou, E. (2023). Unsaturated fatty acids and their immunomodulatory properties. Biol. (Basel). 12, 279. doi: 10.3390/biology12020279
Cui, L., Guan, X. N., Ding, W. B., Luo, Y., Wang, W., Bu, W. Q., et al. (2021). Scutellaria baicalensis Georgi polysaccharide ameliorates DSS-induced ulcerative colitis by improving intestinal barrier function and modulating gut microbiota. Int. J. Biol. Macromol. 166, 1035–1045. doi: 10.1016/j.ijbiomac.2020.10.259
Dai, L., Yang, L., Li, Y., Li, S. Y., Yang, D., Li, Y. X., et al. (2024). Origin differentiation based on volatile constituents of genuine medicinal materials Quisqualis indica L. via HS-GC-MS, response surface methodology, and chemometrics. Phytochem. Anal. 35, 567–578. doi: 10.1002/pca.3313
Gao, H. F., Chen, X. L., Li, Y. M., Gao, X., Wang, J. J., Qian, M. Y. (2023). Quality evaluation of ginkgo biloba leaves based on non-targeted metabolomics and representative ingredient quantification. J. Chromatogr B Analyt Technol. BioMed. Life Sci. 1214, 123549. doi: 10.1016/j.jchromb.2022.123549
Govindarajan, M., Vijayan, P., Kadaikunnan, S., Alharbi, N., Benelli, G. (2016). One-pot biogenic fabrication of silver nanocrystals using Quisqualis indica: Effectiveness on malaria and Zika virus mosquito vectors, and impact on non-target aquatic organisms. J. Photochem. Photobiol. B. 162, 646–655. doi: 10.1016/j.jphotobiol.2016.07.036
Kim, D. G., Kwon, H. J., Lim, J. H., Kim, J. H., Lee, K. P. (2020). Quisqualis indica extract ameliorates low urinary tract symptoms in testosterone propionate-induced benign prostatic hyperplasia rats. Lab. Anim. Res. 26, 36. doi: 10.1186/s42826-020-00059-9
Li, W., Wang, Y. P., Han, J. B., Zhang, J. J., Li, B., Qi, X. D., et al. (2023). UPLC-Q-TOF-MS and UPLC-QQQ-MS were used for the qualitative and quantitative analysis of oligosaccharides in Fufang Ejiao Syrup. J. Pharm. BioMed. Anal. 224, 115193. doi: 10.1016/j.jpba.2022.115193
Liang, Y. D., Dai, X. L., Cao, Y., Wang, X., Lu, J., Xie, L., et al. (2023). The neuroprotective and antidiabetic effects of trigonelline: A review of signaling pathways and molecular mechanisms. Biochimie 206, 93–104. doi: 10.1016/j.biochi.2022.10.009
Liao, J. H. (2021). Study on the improvement of quality standard (Sichuan, China: Chengdu edical College).
Liao, J. H., Chu, H. J., Xie, R., Xu, S. Y., You, Y. Y. (2021). Comparison of Quisqualic Acid in fruit and seeds from Shijunzi (Quisqualis Fructus) before and after processing by pre-column derivatization HPLC. Guid. J. Traditi. Chin. Med. Pharm. 27, 60–63. doi: 10.13862/j.cnki.cn43–1446/r.2021.11.011
Liu, Y. L., Huang, H. J., Sheu, S. Y., Liu, Y. C., Lee, I. J., Chiang, S. C., et al. (2023). Oral ellagic acid attenuated LPS-induced neuroinflammation in rat brain: MEK1 interaction and M2 microglial polarization. Exp. Biol. Med. (Maywood). 248, 656–664. doi: 10.1177/15353702231182230
Liu, Y. T., Peng, J. B., Jia, H. M., Cai, D. Y., Zhang, H. W., Yu, C. Y., et al. (2014). UPLC-Q/TOF MS standardized Chinese formula Xin-Ke-Shu for the treatment of atherosclerosis in a rabbit model. Phytomedicine 21, 1364–1372. doi: 10.1016/j.phymed.2014.05.009
Lu, H., Zhang, Y. S., Li, Q., Lu, J. Q., Li, B. C. (2014). Headspace solid phase microextraction combined with gas chromatography-mass spectrometry to analysis the volatile components of Quisqualis indica L. Hubei J. Tradi. Chin. Med. 36, 76–78.
Luo, H., Zhao, Y., Hua, H., Zhang, Y., Zhang, X. B., Fang, Q. M., et al. (2021). Research progress on quality assurance of genuine Chinese medicinal in Sichuan. Chin. Med. 16, 19. doi: 10.1186/s13020-021-00428-z
Ma, J. Y., Li, K. L., Shi, S. L., Li, J., Tang, S. N., Liu, L. H. (2022). The application of UHPLC-HRMS for quality control of traditional chinese medicine. Front. Pharmacol. 13. doi: 10.3389/fphar.2022.922488
Mohamed, S., Ablat, A., Mohamad, J. (2018). The antioxidant and xanthine oxidase inhibitory activity of plumeria rubra flowers. Molecules 23, 400. doi: 10.3390/molecules23020400
Rad, J. S., Quispe, C., Castillo, C. M. S., Caroca, R., Vélez, M. L., Antonyak, H., et al. (2022). Ellagic acid: A review on its natural sources, chemical stability, and therapeutic potential. Oxid. Med. Cell Longev. 2022, 3848084. doi: 10.1155/2022/3848084
Ranger, C. M., Winter, R. E., Singh, A. P., Reding, M. E., Frantz, J. M., Locke, J. C., et al. (2011). Rare excitatory amino acid from flowers of zonal geranium responsible for paralyzing the Japanese beetle. Proc. Natl. Acad. Sci. U S A. 108, 1217–1221. doi: 10.1073/pnas.1013497108
Rastogi, S., Pandey, M. M., Rawat, A. K. S., Kushwaha, V., Murthy, P. K. (2019). In vitro antifilarial activity, antioxidant potential and phenolic constituents of Quisqualis indica L. Indian J. Tradit. Knowl. 18, 648–654.
Rebiai, A., Hemmami, H., Zeghoud, S., Seghir, B. B., Kouadri, I., Eddine, L. S., et al. (2022). Current application of chemometrics analysis in authentication of natural products: A review. Comb Chem. High Throughput Screen. 25, 945–972. doi: 10.2174/1386207324666210309102239
Ren, J. L., Zhang, A. H., Kong, L., Han, Y., Yan, G. L., Sun, H., et al. (2020). Analytical strategies for the discovery and validation of quality-markers of traditional Chinese medicine. Phytomedicine 67, 153165. doi: 10.1016/j.phymed.2019.153165
Shayan, M., Kamalian, S., Sahebkar, A., Najaran, Z. T. (2020). Flaxseed for health and disease: review of clinical trials. Comb Chem. High Throughput Screen. 23, 699–722. doi: 10.2174/1386207323666200521121708
Song, W., Gao, W. H., Tan, X. Y., Song, C. Q. (2021). Inhibition of the proliferation, invasion and migration of liver cancer cells by down-regulating TPT1-AS1 of alcohol extract of Quisqualis indica L. China Pharm. 24, 850–855.
Song, Y., Wang, H. T., Wang, X. C., Wang, X. X., Cong, P. X., Xu, J., et al. (2023). Comparative lipidomics study of four edible red seaweeds based on RPLC-Q-TOF. J. Agric. Food Chem. 71, 2183–2196. doi: 10.1021/acs.jafc.2c07988
Sun, F. F., Hao, W. T., Meng, X. R., Xu, D. X., Li, X. Y., Zheng, K. Y., et al. (2023). Polyene phosphatidylcholine ameliorates synovial inflammation: involvement of PTEN elevation and glycolysis suppression. Mol. Biol. Rep. 50, 687–696. doi: 10.1007/s11033-022-08043-3
Wang, C. H., Liu, X., Zhang, Z. W. (2015). Textual research of materia media and genuine evolution research of Quisqualis Indica L. Lishizhen Med. Mater. Med. Res. 26, 2477–2479.
Wang, L. N., Zhang, Y., Wen, X. P., Xu, W., Yu, B., Xu, W., et al. (2023). Determination of two alkaloids in Quisqualis Fructus Semen by UHILIC-MS/MS and NIRS method. Chin. J. Pharm. Anal. 43, 999–1011. doi: 10.16155/j.0254–1793.2023.06.11
Wen, X. P., Peng, Q., Zou, F. X., Zhang, G. L., Yu, H. M., Xu, W., et al. (2020). Simultaneous determination of nine compounds in Fruits of Quisqualis indica by UPLC-MS/MS. Mod. Chin. Med. 22, 1830–1839. doi: 10.13313/j.issn.1673–4890.20200810004
Xu, B. C., Hao, K. Y., Chen, X. G., Wu, E. Y., Nie, D. Y., Zhang, G. Y., et al. (2022). Broussonetia papyrifera polysaccharide alleviated acetaminophen-induced liver injury by regulating the intestinal flora. Nutrients 14, 2636. doi: 10.3390/nu14132636
Yang, X. F., Miao, Y., Yang, D. W., Kong, R., Yuan, B., Quan, J. Y., et al. (2023). UPLC-Q TOF-MS-Based metabolomics and anti-myocardial ischemia activity of Dioscoreae Nipponicae Rhizoma from different geographical origins. J. Pharm. BioMed. Anal. 234, 115551. doi: 10.1016/j.jpba.2023.115551
Yaozh Traditional Chinese medicine of Quisqualis indica L. (2024). Available online at: https://db.yaozh.com/Search? typeid=8452&content= Quisqualis indica L (Accessed 10 April 2024).
Yin, Q. M., Song, X., Yang, P., Yang, W., Li, X. Y., Wang, X. J., et al. (2023). Incorporation of glycyrrhizic acid and polyene phosphatidylcholine in lipid nanoparticles ameliorates acute liver injury via delivering p65 siRNA. Nanomedicine 48, 102649. doi: 10.1016/j.nano.2022.102649
Zhang, T., Yu, J. L., Ma, T. (2022). The immunomodulatory function of adenosine in sepsis. Front. Immunol. 25. doi: 10.3389/fimmu.2022.936547
Zhang, Y., Xu, H. S., Fan, L. D., Yao, H., Sun, B. H. (2015). The constituents of Quisqualis indica L. J. Shenyang Pharm. Univ. 32, 515–518. doi: 10.14066/j.cnki.cn21–1349/r.2015.07.003
Keywords: Quisqualis fructus, UPLC-Q-TOF, HPLC, chemometric, fingerprint
Citation: Yang L, Dai L, Qin W, Wang Y, Zhao J, Pan S and He D (2024) Chemical constituent characterization and determination of Quisqualis fructus based on UPLC-Q-TOF-MS and HPLC combined with fingerprint and chemometric analysis. Front. Plant Sci. 15:1418480. doi: 10.3389/fpls.2024.1418480
Received: 16 April 2024; Accepted: 31 May 2024;
Published: 21 June 2024.
Edited by:
Marta Olech, Medical University of Lublin, PolandCopyright © 2024 Yang, Dai, Qin, Wang, Zhao, Pan and He. This is an open-access article distributed under the terms of the Creative Commons Attribution License (CC BY). The use, distribution or reproduction in other forums is permitted, provided the original author(s) and the copyright owner(s) are credited and that the original publication in this journal is cited, in accordance with accepted academic practice. No use, distribution or reproduction is permitted which does not comply with these terms.
*Correspondence: Dan He, ZGFuaGVAY3FtdS5lZHUuY24=