 Fen-Guo Zhang
 Sanqing Zhang
 Kefan Wu
 Ruxia Zhao
 Guanghua Zhao
 Yongji Wang
- 1College of Life Science, Shanxi Engineering Research Center of Microbial Application Technologies, Shanxi Normal University, Taiyuan, Shanxi, China
- 2Administrative Office, Shanwei Middle School, Shanwei, China
Introduction: Tilia amurensis Rupr (T. amurensis) is one endangered and national class II key protected wild plant in China. It has ornamental, material, economic, edible and medicinal values. At present, the resources of T. amurensis are decreasing, and the prediction of the distribution of its potential habitat in China can provide a theoretical basis for the cultivation and rational management of this species.
Methods: In this study, the R language was used to evaluate 358 distribution records and 38 environment variables. The MaxEnt model was used to predict the potential distribution areas of T. amurensis under the current and future climate scenarios. The dominant environmental factors affecting the distribution of T. amurensis were analyzed and the Marxan model was used to plan the priority protected areas of this species.
Results: The results showed that Bio18, Slope, Elev, Bio1, Bio9 and Bio2 were the dominant environmental factors affecting the distribution of T. amurensis. Under the future climatic scenarios, the potential suitable areas for T. amurensis will mainly distribute in the Northeast China, the total suitable area will reduce compared with the current climate scenarios, and the general trend of the centroid of suitable habitat will be towards higher latitudes. The SPF value of the best plan obtained from the priority conservation area planning was 1.1, the BLM value was 127,616, and the priority conservation area was about 57.61×10⁴ km2. The results suggested that climate, soil and topographic factors jointly affected the potential geographical distribution of T. amurensis, and climate and topographic factors had greater influence than soil factors.
Discussion: The total suitable area of T. amurensis in China under different climate scenarios in the future will decrease, so more effective protection should be actively adopted.
1 Introduction
T. amurensis is a deciduous tree of the family Tiliaceae, genus Tilia. It mainly grows in mixed woods and forests at altitudes of 500-1200 meters and distributes in the northeastern region of China. Over the years, the population of T. amurensis has declined greatly due to climatic factors and deforestation, and it has been listed as a national class II protected plant. Climatic factors are one of the most important constraints on the distribution of plant species, and as global climate problems intensify, scientists are increasingly studying climate system models. Studies have shown that climate warming and human activities, to a certain extent, not only pose a serious threat to the distribution patterns of species but even exacerbate the risk of species extinction (Urban, 2015). In addition to climatic factors, topographical and soil factors have an important influence on the distribution of plants (Chen et al., 2019). Therefore, clarifying the distribution range of suitable habitats for T. amurensis is important for the conservation of this species. At present, many scholars at home and abroad have conducted a great deal of research on this species in terms of breeding and afforestation (Liu et al., 2020; Li et al., 2021; Li et al., 2022b), population structural characteristics (Zhang et al., 2022), morphological features (Kim et al., 2018; Li et al., 2022a) and physiological characteristics (Sun et al., 2019). There are few studies on prediction of the potential distribution area of T. amurensis and the research area is small. For example, Qian Du took Heilongjiang Basin as the research area and applied MaxEnt model to simulate and predict the geographical distribution of potential species richness of major woody plants under future climate change scenarios (SSP126, SSP245, SSP585), and T. amurensis was one of the study objects in this study (Du, 2022).
Species Distribution Models (SDMs) correlate the geographical distribution data of species with the information on environmental variables related to the target species, and then obtain the relationship between the geographical distribution of species and environmental variables, so as to estimate the distribution of the target species by geospatial projection (Guisan and Thuiller, 2005; Wang and Ni, 2006; Guo et al., 2020). Currently, commonly used species distribution models include Classification Tree Analysis, Random Forest, Generalized Linear Models, Generalized Additive Models, Genetic Algorithms for Rule-set Prediction, and Maximum Entropy Model (Xu et al., 2015). The MaxEnt model is based on the maximum entropy, and according to the environmental variables of known pixels as the constraint condition, the possible distribution of the maximum entropy under this condition is explored, and the habitat distribution of species is predicted accordingly. MaxEnt has the advantages of low data requirements, good stability, high precision and simple operation. Its output result is a habitat suitability map with open space, and it has a built-in jackknife method to test and evaluate the significance level of individual environmental variables. Maxent has been widely used by many researchers at home and abroad to predict the potential distribution area of species. The main fields include invasive species (Ward, 2007; Zhang et al., 2023a, b), rare and endangered species (Xia et al., 2023; Li et al., 2023), and pest control (Tang et al., 2021). In this study, based on the existing distribution data of T. amurensis, we integrated climate, topographical and soil factors, applied the MaxEnt model to predict the potential habitat of this species in the current and future, and explored the impact of climate change on its distribution pattern. The aim of this study is to provide a basic basis for the conservation and management of the resources of this species.
Systematic conservation planning is an approach often used internationally for biodiversity conservation and the identification of priority conservation areas. The approach protects the biodiversity characteristics of an entire region through a sustainable systematic process that is purposeful, efficient in investment and of great significance to global biodiversity conservation efforts. Currently, the Marxan model is the most widely used, which is based on a simulated annealing algorithm for systematic conservation planning and can solve the minimum set problem in conservation planning (Massimiliano et al., 2016; Domisch et al., 2019; Hou et al., 2020). Some scholars have carried out relevant studies on biodiversity conservation using the Marxan model, for example, Zhang (Zhang et al., 2021) took Maoming City, Guangdong Province as the research area, applied the model to extract the elastic ecological protection space, and verified the effectiveness of the relevant results.
In conclusion, the study aimed to (1) predict the potential distribution areas of T. amurensis in China and compare the spatial distribution pattern under different climate scenarios; (2) analyze the main environmental factors affecting the potential geographic distribution of T. amurensis; and (3) delineate the priority conservation areas using the Marxan model. The results of the study can provide a scientific basis for the conservation of wild Tilia and its germplasm resources.
2 Materials and methods
2.1 Source of data
2.1.1 Collection and collation of T. amurensis distribution points
Specimens recorded of T. amurensis used in this study were obtained from (1) Chinese Virtual Herbarium (CVH, http://www.cvh.ac.cn), the National Specimen Information Infrastructure (NSII, http://www.nsii.org.cn/), and other botanical herbariums; (2) Literature search. The collected distribution points of T. amurensis were sorted out, and 358 distribution points were obtained by manually deleting the duplicated, unclear and suspected wrong sample points. Then the geographical location information was converted into latitude and longitude coordinates of the distribution points by using the function of Baidu map “Coordinate Conversion”. In order to avoid overfitting and inaccuracy of the MaxEnt model caused by too many distribution points, this study applied the function of spThin package (Aiello-Lammens et al., 2015) in the R environment to filter the redundant distribution points in the buffer zone with a radius of 4.5km, so that only one distribution point was kept in each buffer zone to be used for the prediction work, and finally 194 distribution points were obtained. (Figure 1).
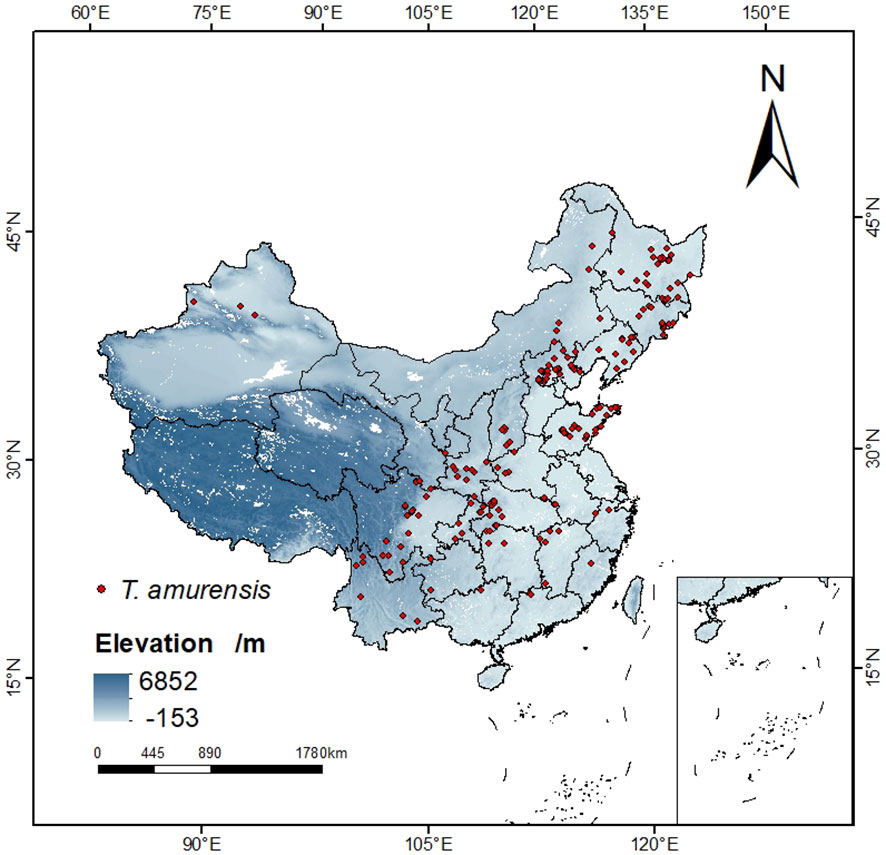
Figure 1 Sample distribution of T. amurensis.
2.1.2 Environmental variable data acquisition and preprocessing
In this study, the climate factors, soil factors and topographic factors were selected as the environmental variables based on the existing literature and the ecological characteristics of T. amurensis. 38 environmental variables that may affect the geographical distribution pattern of T. amurensis were initially considered, including 19 bioclimatic factors, 16 soil factors (0-30 cm), and 3 topographic factors. The 19 bioclimatic factors for the current (1970-2000), 2050s (2041-2060), and 2090s (2081-2100) were downloaded from the World Climate Database WorldClim (v2.1) (http://www.worldclim.org), and the spatial resolution of the data was 2.5 arc-minutes (5km), using SSP126, SSP245 and SSP585 from the Beijing Climate Center-Climate System Model-Medium Resolution (BCC-CSM2- MR),which model participated in CMIP6 (Coupled Model Intercomparison Project Phase 6) historical test simulations. Studies have shown that the simulation performance of BCC-CSM2-MR model is significantly improved compared with the earlier version BCC-CSM-1.1m (Chen et al., 2019). Soil factors and topographic factors data were obtained from the Food and Agriculture Organization of the United Nations database (http://www.fao.org/faostat/en/#data). A total of 38 environmental variables were obtained, and all environmental variable data were converted to *.asc format using ArcGIS 10.8, and it was assumed that there would be no significant changes in the soil and topographic factors in the future period (OuYang et al., 2019). Due to the collinearity problem among various environmental factors, the model prediction overfit and affect the prediction result, so the R package was used to screen all environmental variables, and the screening criteria refer to Zhang (Zhang and Liu, 2017). Spearman correlation analysis and multicollinear VIF variance expansion factor analysis were performed on the point interpolation data in R environment, and the environmental factors with correlations less than 0.7 and VIF variance expansion factor values less than 5 were initially screened. The contribution of each environmental factor in the modeling was calculated by the Jackknife method, the environmental factors with larger contributions were screened out, and then combined with the results of the previous screening, the environmental factors involved in the modeling were finally determined.
2.2 Model construction and evaluation
The data of 194 T. amurensis sample points and environment variables were imported into MaxEnt model. 75% of the sample points were randomly selected as the training set, and the remaining 25% of the sample points were used as the test set. The Jackknife test was selected to evaluate the importance of the environmental variables in the process of model construction, and to draw the Create response curve, select Random seed, the maximum number of iterations is set to 5000, select “Subsample” repetition type, repeat 10 times. The final results were output in the form of Logistic, and the other parameters were the default values of the software. The environmental factors with high contribution rates were selected based on the percentage contribution and permutation importance of each environmental factor.
The simulation results are validated in two ways, and they use the area under curve (AUC) and the size of true skill statistic (TSS) to evaluate the prediction accuracy of MaxEnt model. The AUC takes the value range of 0-1, 0.5-0.6 indicates the prediction failure, 0.6-0.7 indicates the poor prediction result, 0.7-0.8 indicates the general prediction result, 0.8-0.9 indicates the better prediction result and values between 0.9 and 1.0 indicate excellent performance. The closer the AUC value is to 1, the higher the prediction accuracy of the MaxEnt model, the more reliable the model is indicated (Dang et al., 2016). The TSS value ranges from -1 to 1, the closer the value is to 1, the better the prediction is, and 0.6 to 1 indicates a good prediction (Allouche and Kadmon, 2006).
2.3 MaxEnt model optimization
The regularization level of the MaxEnt model contains two parameters, regularization multiplier (RM) and feature combination (FC), which are regulated by referring to the methods of Zhao et al (Zhao et al., 2021). The MaxEnt model provides five features: linear (L), quadratic (Q), fragmentation (Hinge, H), product (P) and threshold (T). In this study, the default parameters of Maxent software are RM = 1, FC =LQHPT; in order to optimize the Maxent model, RM is set to 0. 5 ~ 4, and every time it is increased by 0. 5, a total of 8 regulated frequency doubling is made. At the same time, six combinations with one or more features were used: L; L and Q; H; L, Q and H; L, Q, H and P; and L, Q, H, P and T. According to the permutation and combination, 48 parameter combinations are calculated. In the above simulation results, if the delta.AICc value and or.10p.avg value (10% test omission rate) is lower and lower than the default parameter combination values, which indicates that the prediction results are more accurate, which leads to the optimal settings and the final model.
2.4 Classification of suitable areas
In this study, the Equal training sensitivity and specificity Logistic threshold is used to define the model threshold as 0.32. Based on the suitability thresholds predicted by the MaxEnt model, ArcGIS software was used to reclassify the habitat suitability index of T. amurensis using the natural discontinuous breakpoint grading method, which was divided into four grades: unsuitable suitable area (P<0.32), low suitable area (0.32≤P<0.5), medium suitable area (0.5≤P<0.68), high suitable area (P≥0.68).
2.5 Systematic conservation planning
This study is based on Marxan model for priority conservation area planning of T. amurensis distribution in China in the current period. The priority protection area is determined according to the following steps: (1) Planning cell and cost setting: The study area was divided into 224,767 20000m*20000m grids as planning cells, and each cell was assigned a unique ID value (Arabic numerals), and the area of each cell was set as protection cost, in square meters; (2) Construct the species distribution matrix: The potential distribution layer of T. amurensis in China in the current period was imported into ArcGIS, and the Zonal Statistics as Table tool of ArcGIS was used to calculate the species existence probability value (the value range is 0-1) of T. amurensis in each planning unit, and the species distribution matrix was constructed; (3) Determination of conservation targets: In this study, about 50% of the total number of species with a probability of species presence value greater than 0.387 was selected as the target amount for conservation; (4) Calculation of unit boundary length: ArcGIS software is applied to add plug-in ArcMarxan2.pyt to generate this data; (5) Marxan operation: The iteration times of the software were set to 1000000, and the Species Penalty Factor (SPF) and boundary length modifier (BLM) were constantly modified for optimization while the other parameters remained unchanged, with 100 operations; and (6) Visualize the priority area.
2.6 Validity of the results of the model simulation on the scale of the country’s administrative districts
In order to explore the validity of the model simulation results in China’s administrative region, this paper simulated the potential distribution of T. amurensis at the provincial and local scale in China in the current period. In this study, Heilongjiang Province and Beijing Municipality were selected as the study area. Firstly, ArcGIS software was used to extract the environmental factor data and crop vector maps of the study area. Then the MaxEnt model was used to predict the distribution of the habitable zone of T. amurensis, and finally the simulation results were visualized.
2.7 Data processing
The spThin package in R 4.2.0 software was used to process the distribution points of T. amutilia, the usdm package (https://cran.r-project.org/web/packages/usdm/usdm) was used to pre-process the environmental variables, the ENMeval package (Muscarella et al., 2015) was used to optimize the MaxEnt model, the SDMTool package (Naimi and Araujo, 2016)was used to calculate the position of the center of gravity in the suitable area of T. amurensis under the current and future climate scenarios, the geosphere package (https://cran.r-project.org/package=geosphere) was used to count the range shift distance of the centroids in different climate scenarios, and so on. The Marxan model calculated the current priority conservation areas of T. amurensis in China. ArcGIS 10.8 software was used for format conversion of the environmental variables, processing of the suitability classification and visualization of T. amurensis, and visualization of the priority protection areas. Excel software was used to organize the data and calculate the relevant area of the suitable area.
3 Results and analyses
3.1 Screening of T. amurensis distribution sites and environmental variables
After screening, 194 distribution point data with 17 environmental variables were finally used in this study (Table 1). The environmental variables include 10 bioclimatic factors (Bio 1, Bio 2, Bio 3, Bio 5, Bio 6, Bio 8, Bio 9, Bio 11, Bio 18, Bio 19), 5 soil factors (t_bs, t_cec_clay, t_oc, t_cec_soil, t_ece), 2 topographic factors (elev, slope).
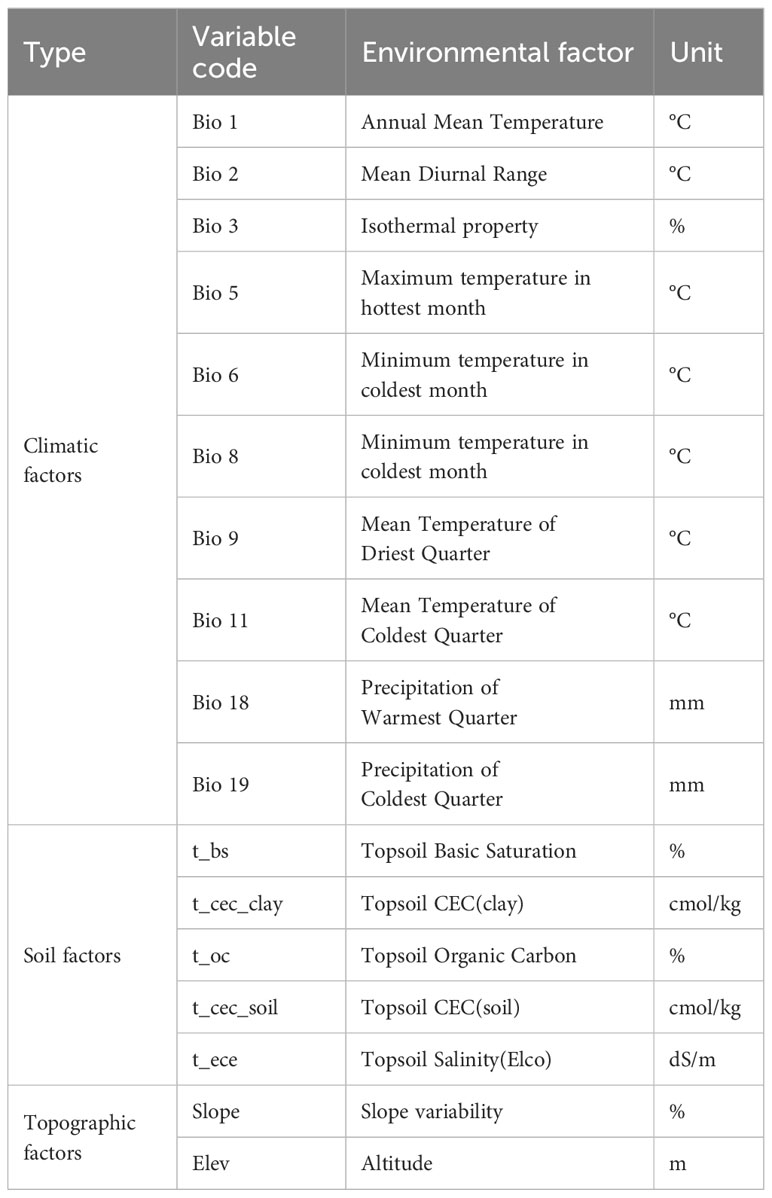
Table 1 Environmental factors involved in modeling.
3.2 Model optimization and accuracy evaluation
Based on 194 distribution points of T. amurensis and 17 environmental factors selected for modeling, the potential distribution area of T. amurensis was simulated by Maxent model. According to the method proposed by Cobos (Cobos et al., 2019), there are two models that meet the criteria, when delta.AICc=0, RM=2.5, FC type is “LQHP”, or.10p.avg=0.098, the value of the 10% training omission rate is significantly lower than the default value, and it is 40.61% lower than the default value, the model is the optimal (Muscarella et al., 2015) model.
The size of the AUC value can reflect the accuracy of the model simulation effect (Han et al., 2017). In this study, MaxEnt was run under the optimal model parameter settings and cross-validated 10 times, with an average AUC = 0.892 (Figure 2), and the Tss value was 0.79, which indicated that the MaxEnt model can be used to simulate the prediction of the distribution of suitable areas for T. amurensis.
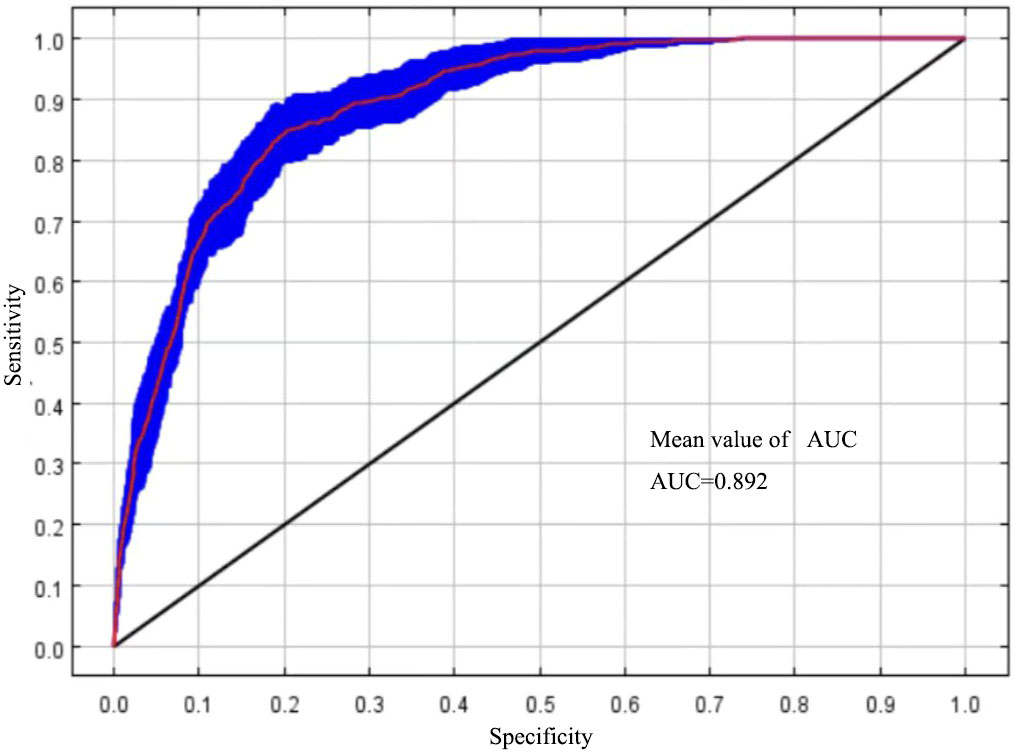
Figure 2 ROC curves and AUC values of MaxEnt model prediction results.
3.3 Analysis of dominant environmental factors
In this study, the importance of environmental variables in the process of model construction was evaluated by the Jackknife test. The results showed that: In terms of contribution rate, the top six environmental factors were Bio 18 (39.3%), Slope (14.5%), Elev (13.5%), Bio 1 (9%), Bio 9 (7.7%) and Bio 2 (5.2%), with a cumulative contribution rate of 89.2%. From the perspective of importance value, the environmental factors from high to low were Bio 18 (25.5%), Elev (20.1%), Bio 1 (19.1%), Slope (11.3%), Bio 9 (7.5%), Bio 2 (2.4%), and the cumulative importance value was up to 85.9% (Table 2). Among them, the contribution rate and importance value of Bio 18 are significantly higher than other environmental factors, indicating that Bio 18 was the most important environmental factor affecting the potential geographical distribution of T. amurensis.
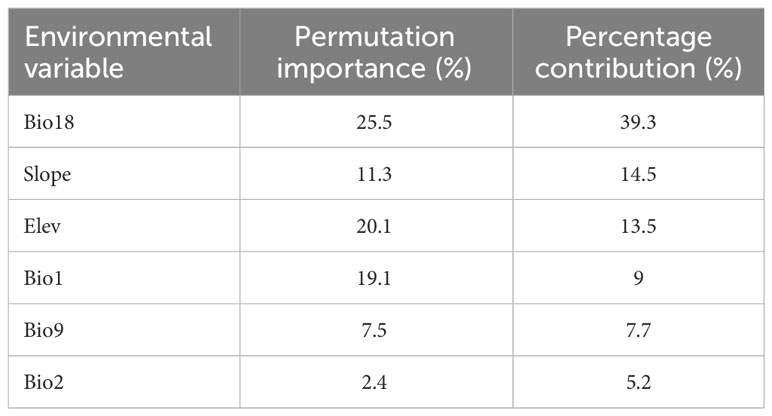
Table 2 Contribution rate and importance of environmental variables.
Environmental factors response curves reflect the dependence of suitability on variable (Zhang et al., 2020). Based on the above results, one-factor modeling was performed separately and one-factor response curves were plotted (Figure 3). The Bio18 value of about 407.31 is optimal for the survival of T. amurensis, and as this value increases, the suitability of T. amurensis for survival decreases. The mean temperature of driest quarter for the survival of T. amurensis is around 0°C.When the altitude is higher than 1200m, the suitability of T. amurensis decreases sharply with the increase of altitude. Slope variability of about 2.2×10⁵ is the most suitable for T. amurensis. The survival probability of T. amurensis is greatest when the Mean Diurnal Range and Annual Mean Temperature ranges are between 6°C and 12°C and around 10°C, respectively. The results are consistent with the fact that T. amurensis prefers cool and humid climates, does not tolerate wet and swampy areas, is cold-tolerant, born on slopes and in mixed coniferous and broad forests, and has only sporadic distribution at altitudes above 1200 m.
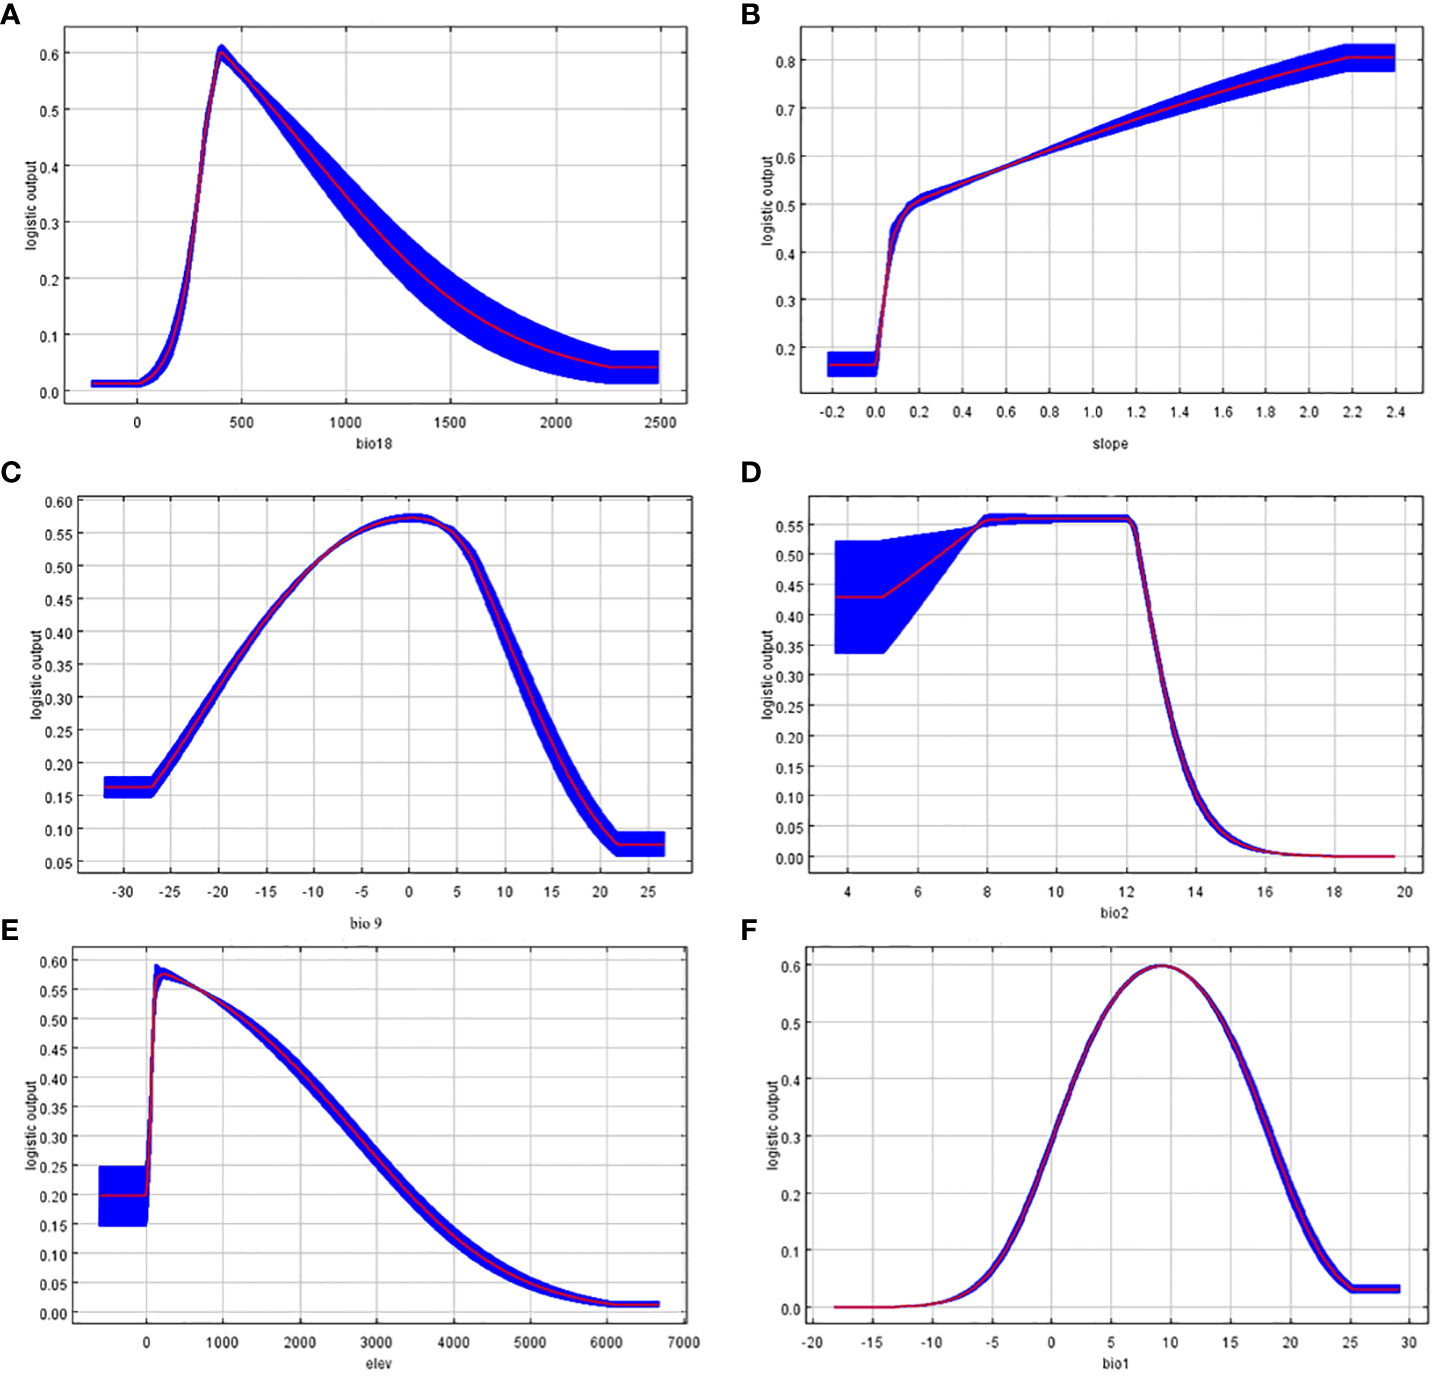
Figure 3 Response curve of dominant environmental factors. (A: bio18; B: slope; C: bio9; D: bio2; E: elev; F: bio1).
3.4 Distribution prediction and center-of-mass range shift of T. amurensis in suitable areas of China
3.4.1 Current potential distribution area and size
The suitable ecological distribution division of T. amurensis is shown in Figure 4, and the distribution area of each suitable area and the proportion of the total suitable area in the total study area are shown in Table 3. The suitable areas of T. amurensis in China are mainly distributed in North China, Northeast China and part of West China. The total suitable area of T. amurensis is about 14.15×10⁴ km2, accounting for 14.74% of the total area of China. Among them, the medium suitable areas are mainly distributed in Shannan and Linzhi City of Tibet, South Central Sichuan, Chongqing Municipality, Gannan Tibetan Autonomous Prefecture and Longnan Municipality of Gansu Province, South Shaanxi, West Hubei, West Henan, Southwest Anhui, Shandong Province, Hebei Province, Liaoning Province, Jilin Province, and Heilongjiang Province. The medium suitable area is about 4.9 ×10⁴ km2, accounting for 34.60% of the total suitable area. And the high suitable areas are mainly distributed in South Central Sichuan, South Shaanxi, West Hubei and Liaoning Province, and its area is about 1.61×10⁴ km2, accounting for 11.38% of the total suitable area.
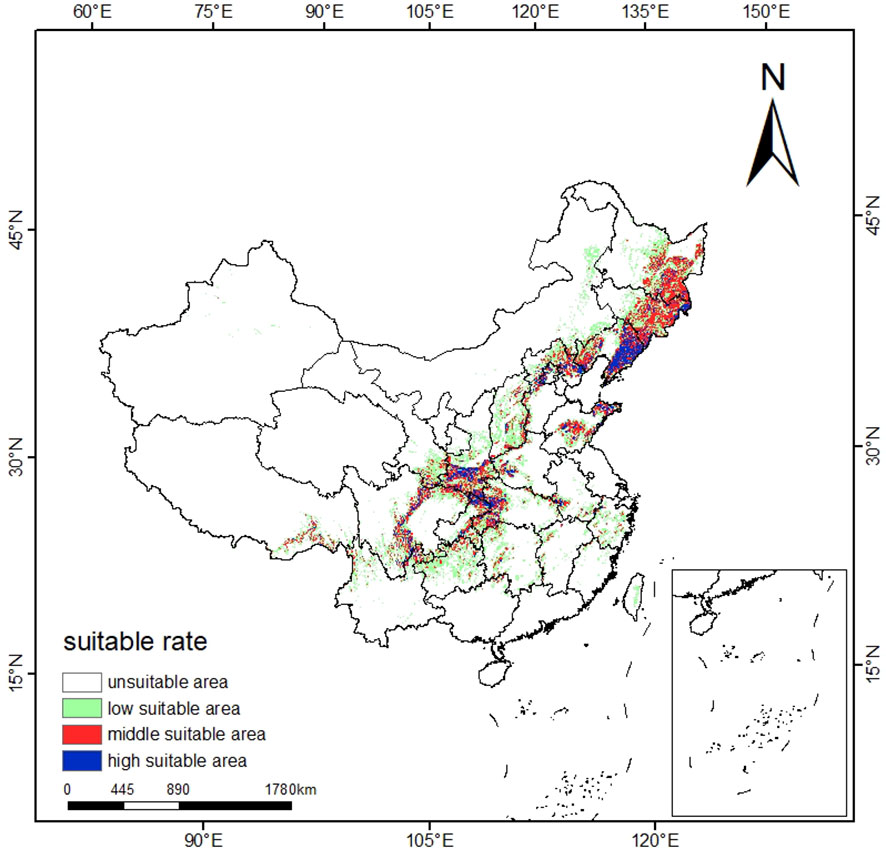
Figure 4 Schematic representation of the current potential distribution area of T. amurensis in China.
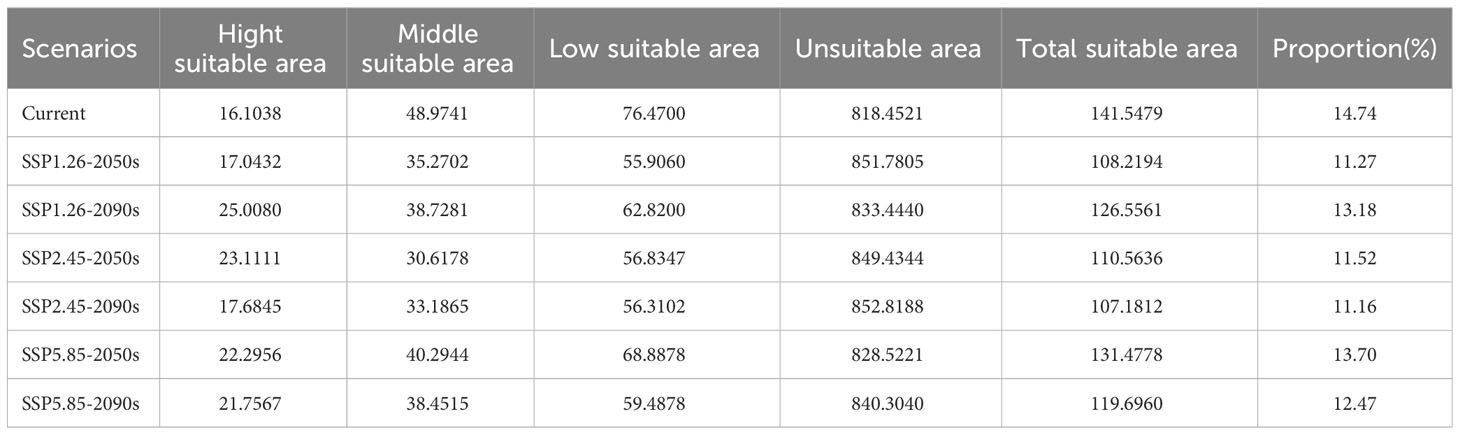
Table 3 Suitable area of T. amurensis in China in the current and future periods (×104 km2).
3.4.2 Prediction of suitable area of T. amurensis in China under different climate scenarios
The prediction results of suitable distribution area of T. amurensis in China under future climate scenarios are shown in Figure 5. The potential suitable areas of T. amurensis are mainly distributed in Heilongjiang, Jilin and Liaoning Provinces, and the total suitable area will redeced under future climate scenarios. In the scenario of SSP1-2.6, the total suitable area of T. amurensis in 2050s and 2090s is about 10.82×10⁴ km2 and 12.66 ×10⁴ km2 respectively, decreasing by 23.55% and 10.60% compared with the current period. In the scenario of SSP2-4.5, the total suitable area of T. amurensis in 2050s and 2090s is about 11.06 ×10⁴ km2 and 10.72 ×10⁴ km2 respectively, decreasing by 21.89% and 24.28% compared with the current period. In the scenario of SSP1-2.6, the total suitable area of T. amurensis in 2050s and 2090s is about 13.15 ×10⁴ km2 and 11.97 ×10⁴ km2 respectively, decreasing by 7.11% and 15,44% compared with the current period. In the future climate scenario, unsuitability area and high suitability area will increase compared with the current period, while low suitability area, middle suitability area and total suitability area will decrease compared with the current period. The SSP5-8.5 scenario has the largest total suitable area for T. amurensis in 2050s, while the SSP1-2.6 scenario has the largest total suitable area in 2090s. According to Figure 6, it can be seen that under future climate scenarios, the suitable areas for T. amurensis in China will mainly increase in Heilongjiang, Jilin, and Liaoning provinces, while the lost areas will mainly distribute in central China. This trend is most obvious in the SSP90585 emission scenario.
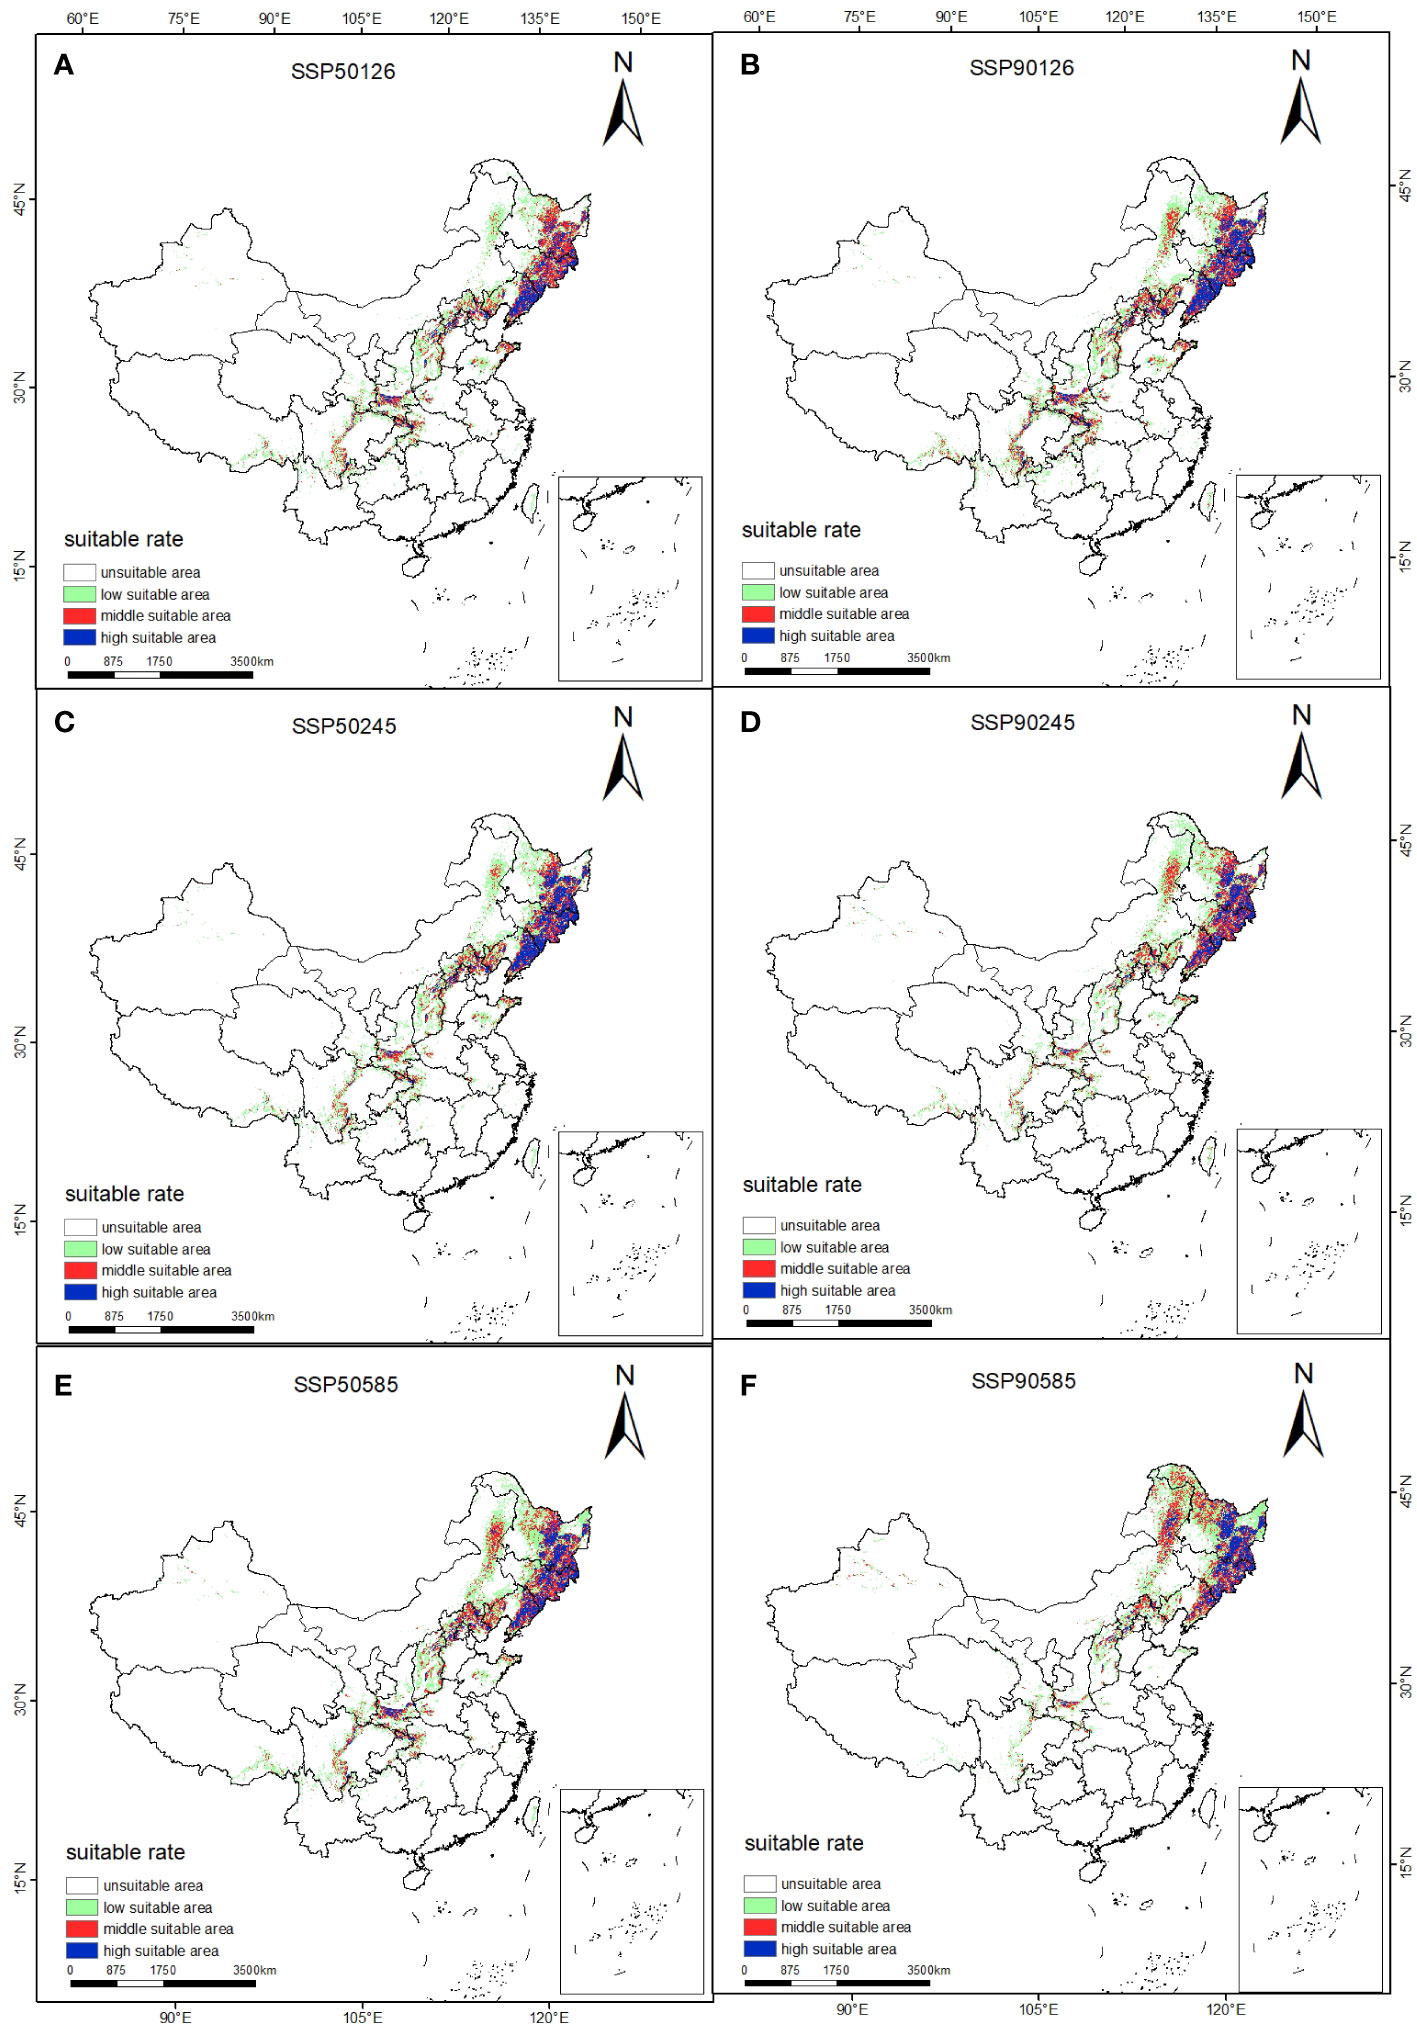
Figure 5 Suitable distribution for T. amurensis in China under different climate change scenarios in the future. (A, B: SSP126; C, D: SSP245; E, F: SSP585; A, C, E: scenarios in the 2050s; B, D, F: scenarios in the 2090s).
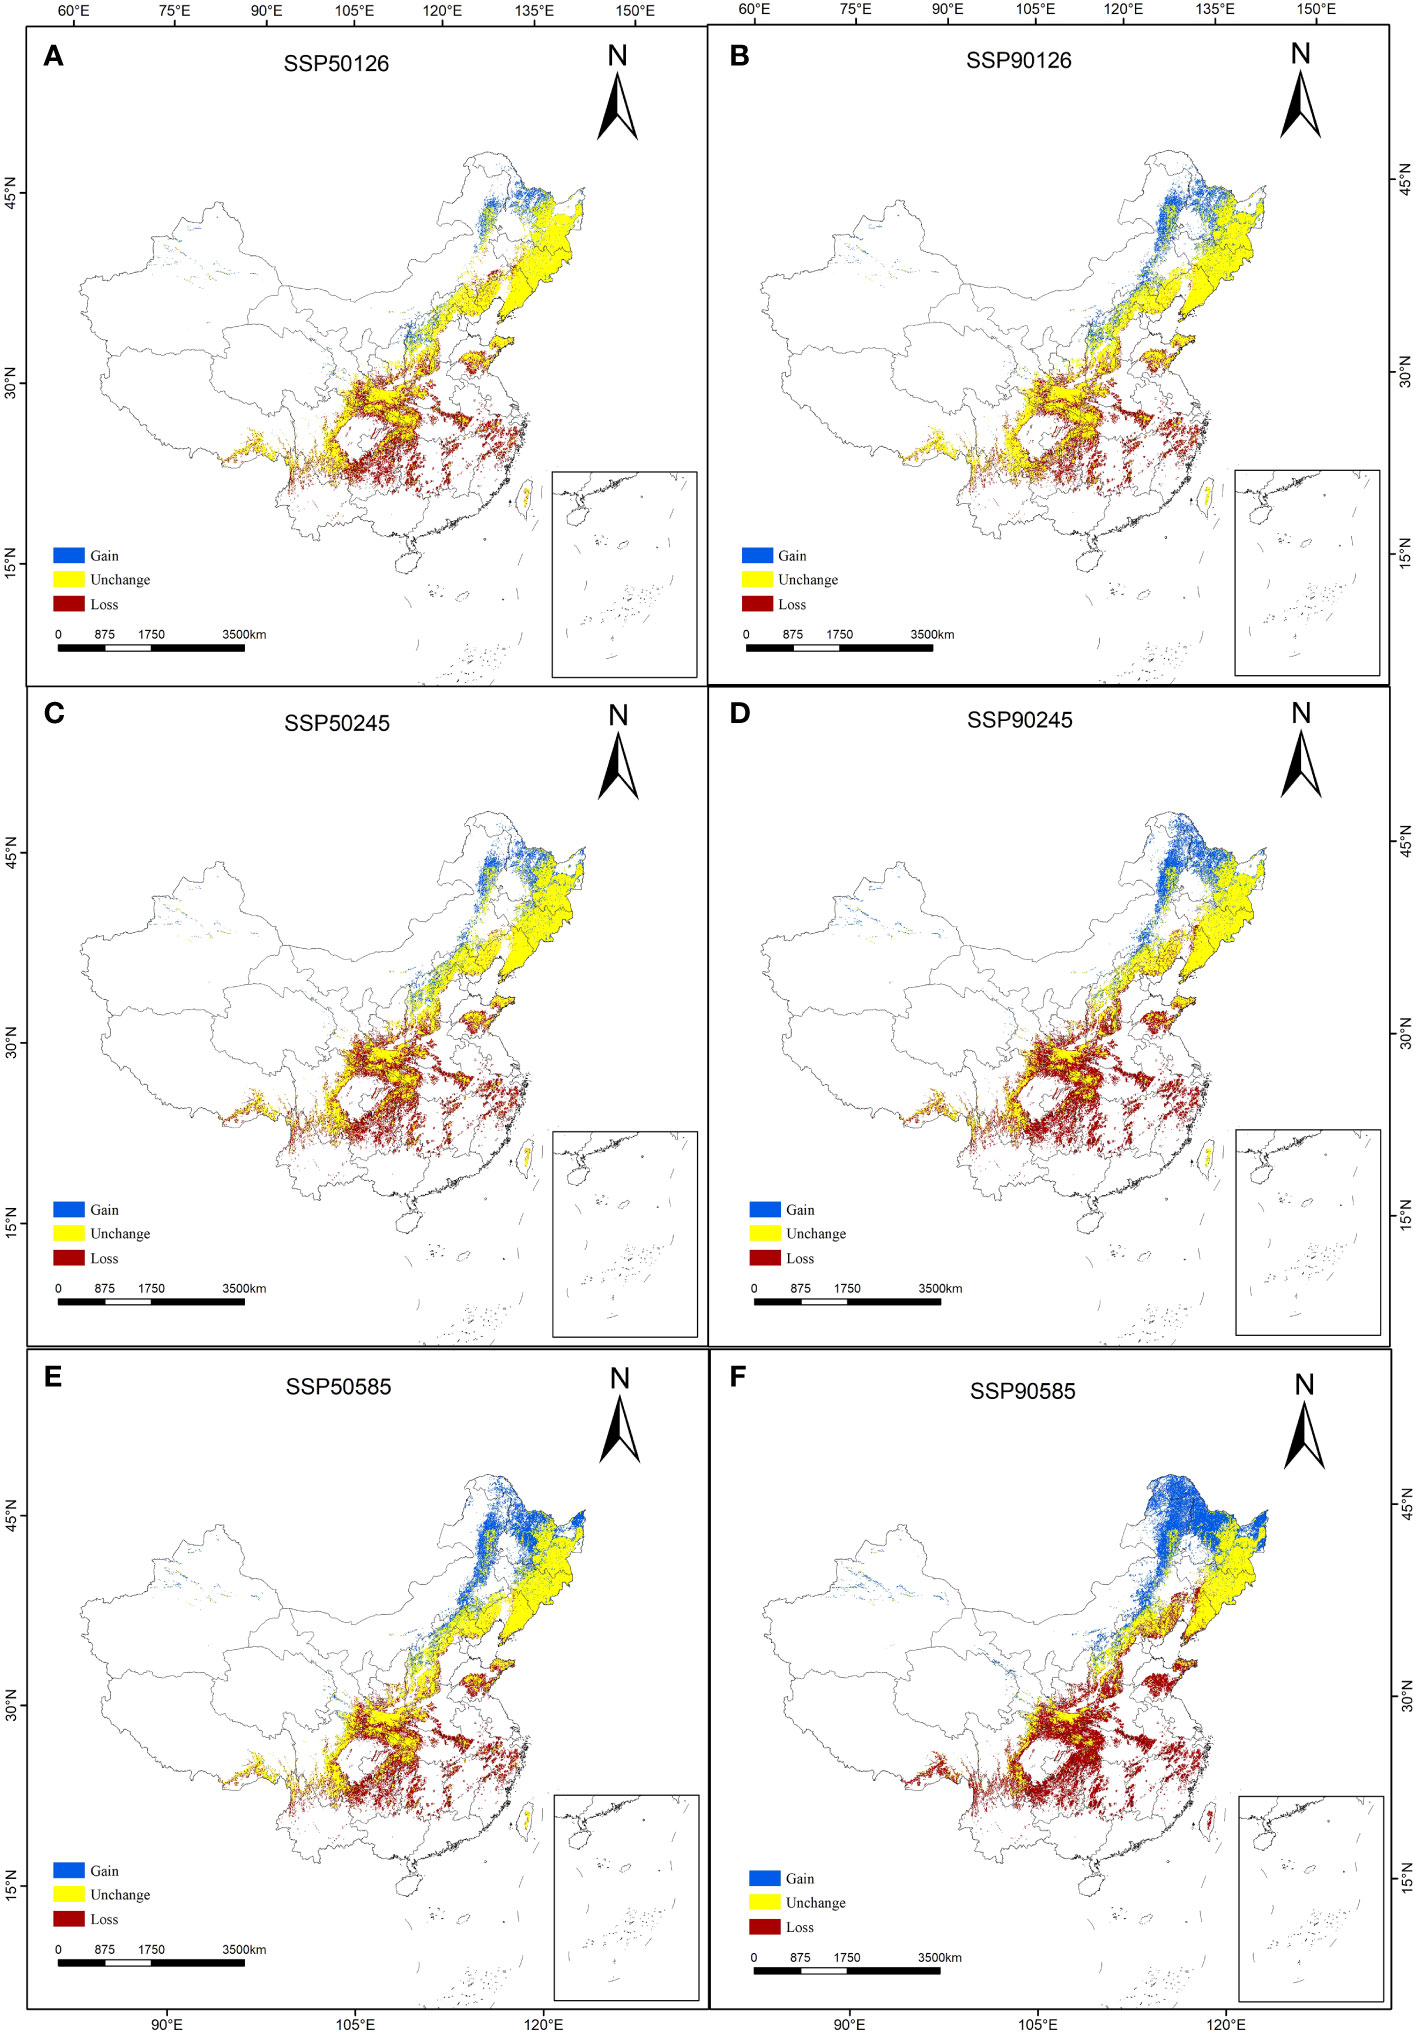
Figure 6 Changes in the potential habitat suitability of T. amurensis. (A, B: SSP126; C, D: SSP245; E, F: SSP585; A, C, E: scenarios in the 2050s; B, D, F: scenarios in the 2090s).
3.4.3 Changes in the center-of-mass of T. amurensis’s suitable area under climate change conditions
To further explore the response of T. amurensis to future climate, this study analyzed the centroid range shift of potentially suitable habitats for T. amurensis under different climate scenarios in the future. The center of suitable habitat for T. amurensis generally tends to move to higher latitudes (Figure 7). The center of suitable area of T. amurensis in the current period is at Zigui County, Yichang City, Hubei Province. In 2050s, the center of suitable area of T. amurensis under the climate scenario of SSP1-2.6, SSP2-4.5 and SSP5-8.5 are located in Lanzhou City, Gansu Province, Zhoukou City, Henan Province and Pingdingshan City, Henan province, with the distances from the current center of suitable area of 895km, 289km and 515km, respectively. In 2090s, the center of suitable area of T. amurensis under the climate scenario of SSP1-2.6, SSP2-4.5 and SSP5-8.5 are located in Pingdingshan City, Henan province, Anyang City, Henan province and Handan City, Heubei province, with the distances from the current center of suitable area of 373km, 486km and 693km respectively.
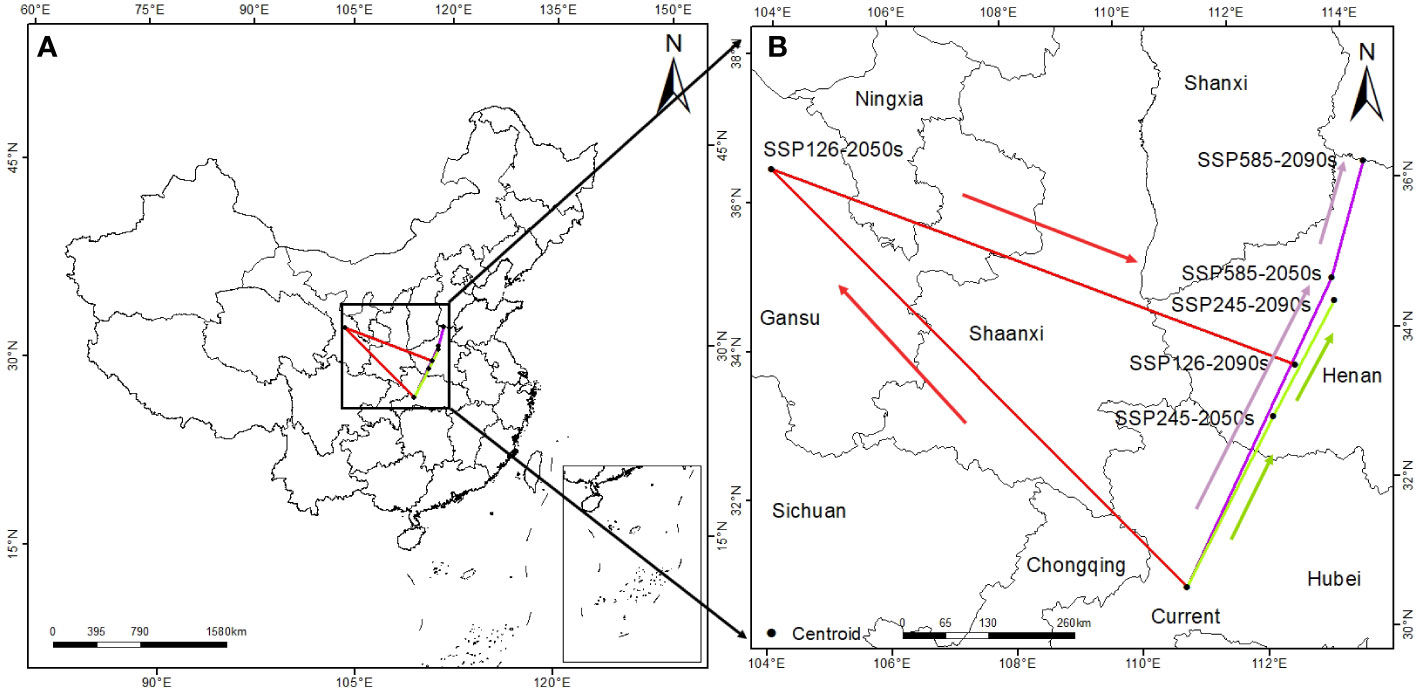
Figure 7 Center-of-mass range shift of suitable habitats for T. amurensis under different climate change scenarios. (A: original image; B: enlarged version).
3.5 Ecological characteristics of the distribution area
The results of this study showed that the habitat suitability of T. amurensis will decrease under different climate scenarios in the future (Table 4). However, compared with the current situation, the habitat suitability of T. amurensis under the SSP5-8.5 climate scenario will significantly reduce, and the habitat suitability is 0.45 in 2050s and 0.41in 2090s, respectively, which are 16.67% and 20.37% lower than the current situation. Precipitation of warmest quarter, annual mean temperature, and mean temperature of driest quarter were the opposite of the change in habitat suitability for T. amurensis, and were all higher than in the current period, but with less variation in daily differences in air temperature.
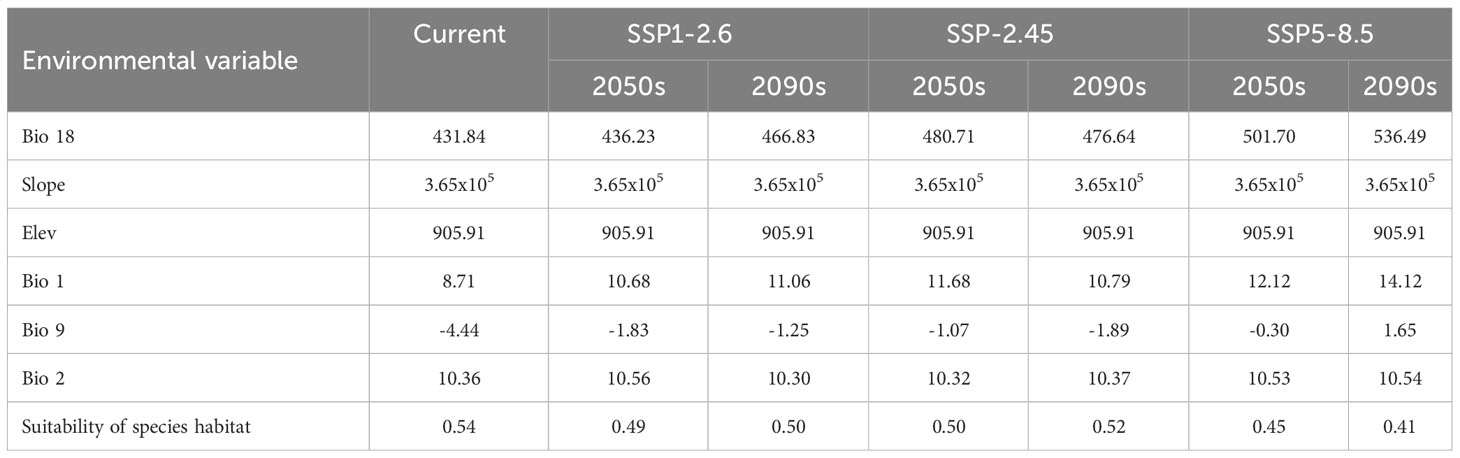
Table 4 Results analysis of major environmental variables.
3.6 Priority protected area planning
Through sensitivity analysis, different SPF and BLM combinations were compared, and the optimal combination was finally determined as SPF=1.1, BLM=127616, 1632 planning units were selected, and the priority protection area was about 5.76×10⁴ km2. The priority conservation areas of T. amurensis are shown in Figure 8, mainly distributed in Jilin, Heilongjiang, Hebei, Gansu, Shaanxi, Henan, Sichuan, Chongqing and other provinces as well as Beijing Municipality, which is basically consistent with the distribution results of T. amurensis in middle and high suitability areas in China as predicted by Maxent model.
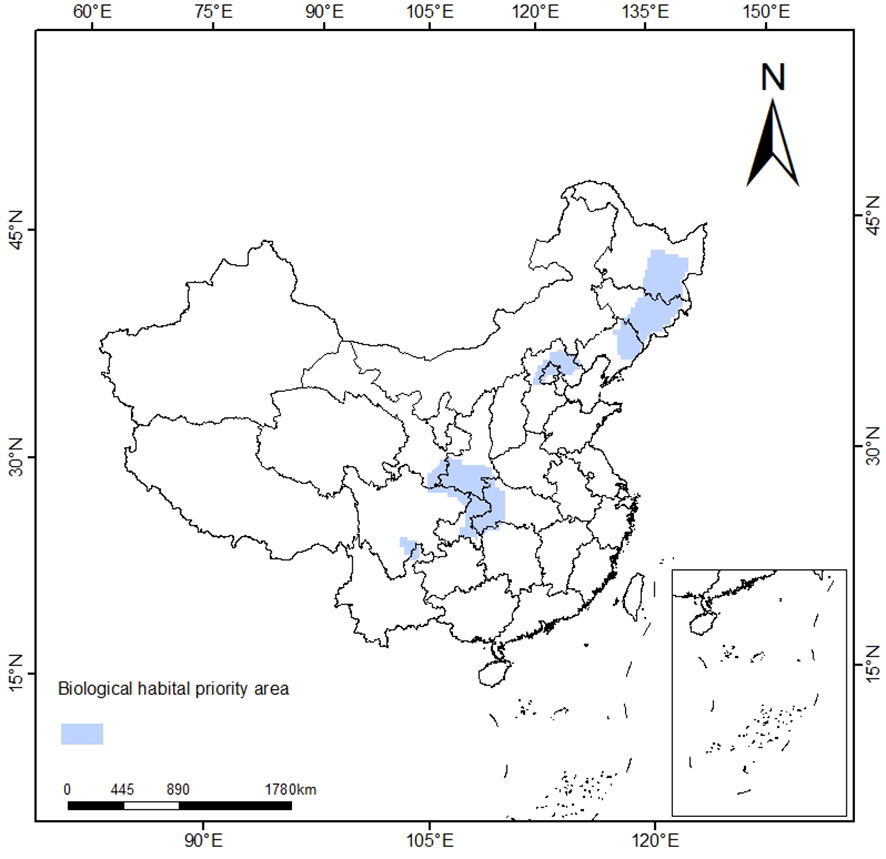
Figure 8 Priority Conservation Area Plan.
3.7 Validity of modelling results at national, provincial and local scale
The results of the potential distribution of T. amurensis in Heilongjiang Province and Beijing are shown in Figure 9. The results show that the potential distribution of T. amurensis in Heilongjiang Province is basically consistent with the predicted results of T. amurensis at the national scale, whereas the distribution of T. amurensis in Beijing is inconsistent, therefore, the results of this study are only valid at the national and provincial levels, and can not be applied to local microclimates. In addition, the vector map of Beijing extracted during the analysis and validation process tends to be blurred, so the vector map of China used in this paper is not in a position to be suitable for the prediction of the potential distribution area of T. amurensis in smaller administrative units.
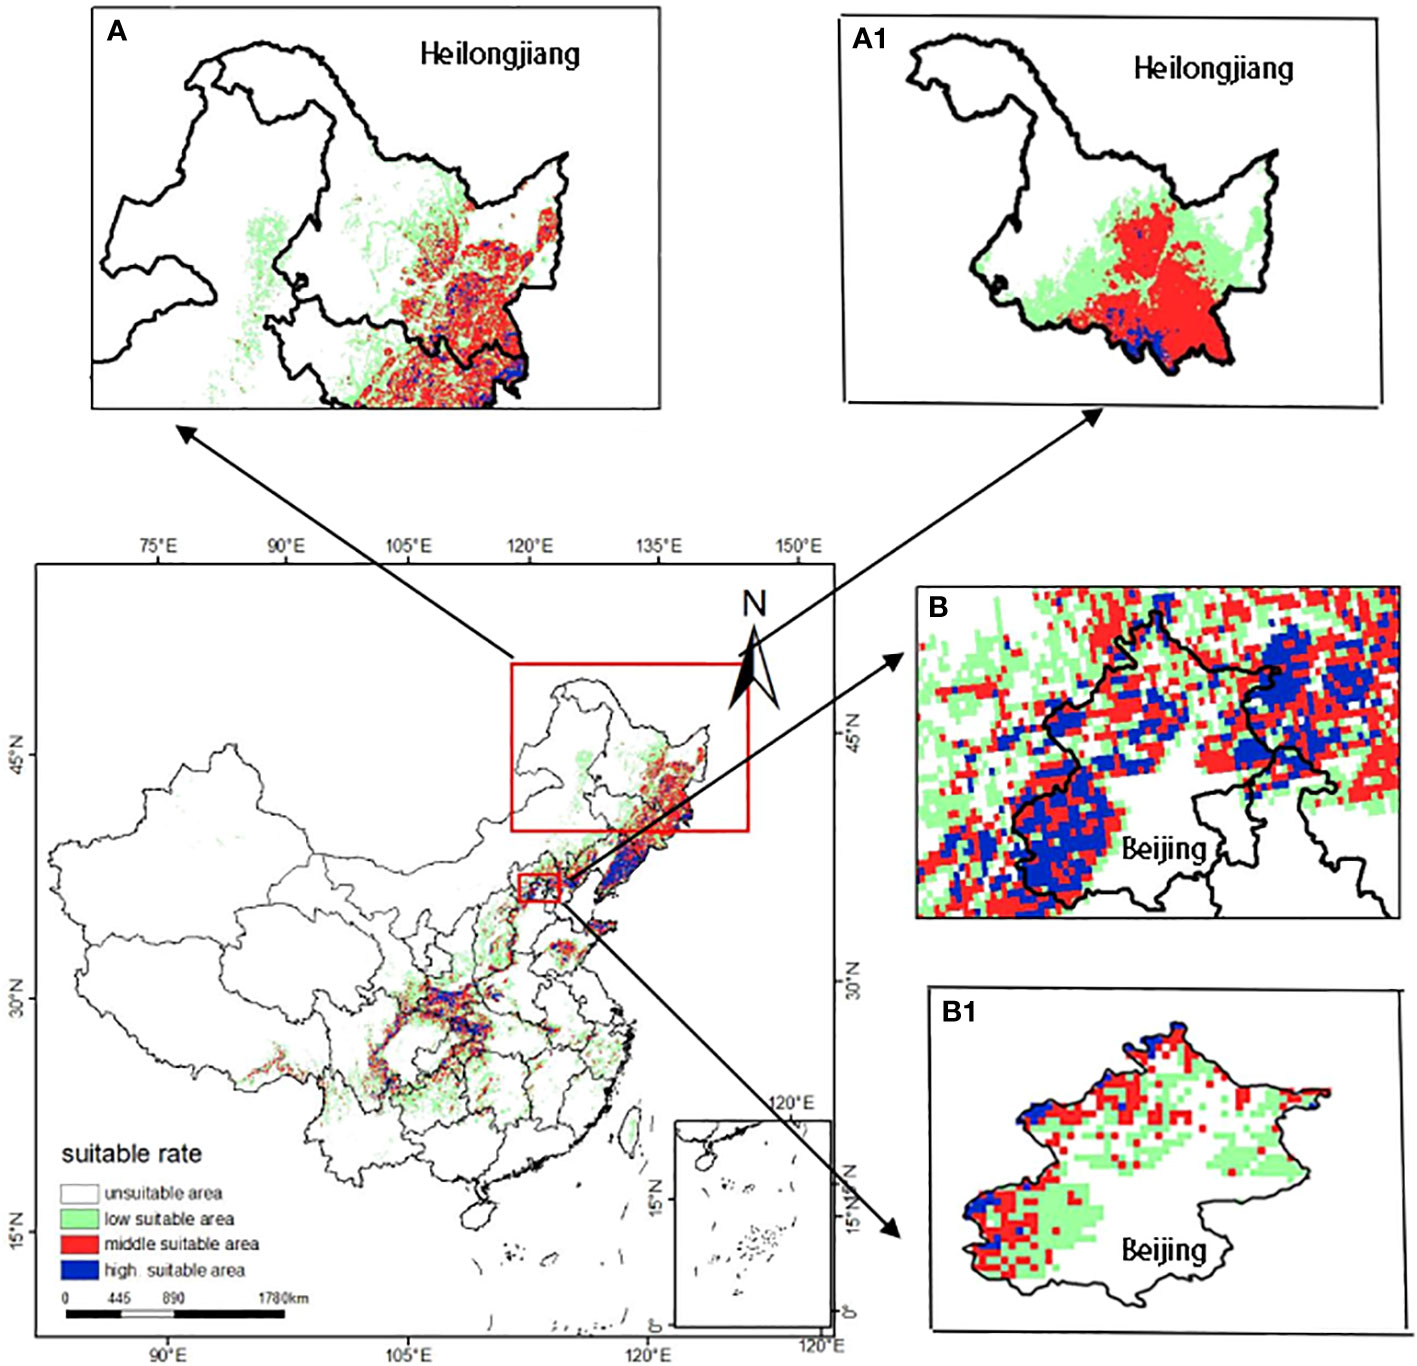
Figure 9 Potential distribution areas of T. amurensis at different administrative scales (A, B:national scale; A1 :provincial scale; B1 :local scale).
4 Discussion
4.1 Evaluation of the MaxEnt model simulation results
Among the species distribution models, the MaxEnt model is more popularly used, and the default parameters in this model are derived from earlier tests on 226 species (Phillips and Dudík, 2008). The study of species distribution under the default parameters is prone to overfitting, high complexity and may reduce the accuracy of the results. Therefore, in this study we optimized the model using the AICc parameters and adjusting the multiplicity parameter to reduce model complexity and improve the fit of predictions to the actual fit. In this study, MaxEnt was run with the optimal model parameter settings and cross-validated 10 times with an average AUC = 0.892, indicating that the model predictions were reliable. When establishing the species distribution model, some researchers only consider the climate factors. In this study, we selected climate, topography and soil factors for modelling. The results showed that the distribution of T. amurensis was less affected by soil factors and more affected by climate factors and topographic factors. However, there are limitations in this study, such as anthropogenic factors that may affect the distribution of T. amurensis. In addition, the results of this study are only valid at the national and provincial levels, and can not be applied to local microclimates.
4.2 Dominant environmental factors affecting potential suitable habitat of T. amurensis
Based on the distribution data of climate, soil, topographic environmental factors and T. amurensis in China, this study used MaxEnt model to evaluate the habitat suitability of T. amurensis in China at present and in the future.
The results showed that this model was reliable in predicting the habitat suitability of T. amurensis, and that bio18, slope, elev, bio1, bio9 and bio2 were the dominant environmental factors affecting the potential suitable habitat of T. amurensis. Du (Du, 2022) found that hydrothermal conditions were the dominant environmental factors driving the distribution pattern of woody plants in Heilongjiang basin, and the suitability distribution of T. amurensis was jointly affected by both temperature and precipitation, which is similar to the results of this paper. In addition to temperature and precipitation factors, the growth of T. amurensis is closely related to altitude and slope. Zheng (Zheng et al., 2022) found that the growth of the diameter of the chest of T. amurensis was relatively fast in the area of 800~900 m altitude, and the effect of slope on the growth of the diameter of the chest of this species was significant. The growth rate of T. amurensis was faster on mild slope and slower on steep slope. T. amurensis prefers fertile, well-drained moist soil and is a good landscape tree. T. amurensis is strongly influenced by altitude and can be used on a vertical scale to exploit its characteristics, increase its ornamental value and enhance the landscape benefits while afforestation and greening. Comparing the previous studies we found that for different woody plants, the dominant environmental factors affecting the distribution of their suitability are different. Bangken Ying (Ying et al., 2024) explored the effects of terrestrial climatic variables and ocean surface marine environmental factors on Kandelia obovata. The results showed that ocean surface mean water temperature, isothermality, precipitation in the warmest quarter, mean annual air temperature, and maximum temperature in the hottest month may be the main environmental factors affecting the distribution of autumn eggplant. Sun & Zhang (Sun et al., 2020) found that seasonal variations in annual precipitation and temperature were the main drivers affecting the species richness of Quercus spp. in China.
4.3 Potentially suitable habitat conditions
Understanding the potential distribution patterns of species in the context of climate change plays an important role in measuring the impacts of climate change on species and developing conservation strategies (Deb et al., 2017). The results of this study showed that the general trend of the center-of-mass of suitable habitat for T. amurensis will move to higher latitudes under future climate scenarios, which may be related to global warming. Some research results indicated that the range shift of organisms is unavoidable due to the earth’s warming and global climate change. For example, one study (Wang et al., 2023) show that the distribution of plants of the Chinese alpine oak group has a tendency to migrate to the low altitude and low latitudes under future climate conditions; and that the total fitness area of endangered plants Eleutharrhena macrocarpa (Diels) Forman has migrated to the direction of higher latitude since the last interglacial period (Zhao and Fan, 2021). In this study, the potential suitable areas for T. amurensis in the future period will be mainly distributed in Heilongjiang, Jilin and Liaoning Provinces, and the total suitable area distribution will be reduced to different degrees compared to the current period, and the habitat suitability of T. amurensis will decline compared to the current period, with the largest decline compared to the current period under the SSP5-8.5 climate scenario. Range shift to higher altitudes or latitudes is a major strategy for species to adapt to global warming, however, most species face a crisis of habitat loss during range shift to higher altitudes or latitudes (Williams et al., 2007), and the results of this study show that habitat suitability for T. amurensis in the future period will decrease, so it is particularly important to develop effective conservation measures.
The quantity and quality of T. amurensis populations have declined over the years as a result of extensive logging and utilization. In addition, the species has developed the characteristic of seed dormancy during phylogeny in order to adapt to the external environment. This characteristic can hinder the reproduction of T. amurensis which can lead to a decline in the population of the species. Therefore, the restoration of high quality populations of T. amurensis is urgent. At present, many scholars have carried out systematic studies on the breeding of T. amurensis, mainly by sowing seeds, cuttings and tissue culture. In the future, the protection of T. amurensis still needs efforts. On the one hand, it is necessary to strengthen the publicity, improve people’s ideological awareness, and strengthen the environmental protection and artificial forest protection of wild T. amurensis; On the other hand, based on the results of the study of potential suitable distribution areas for T. amurensis under future climate scenarios, it is particularly important to develop a long-term comprehensive conservation plan that implements the national policy guidelines and does not destroy the original land.
5 Conclusion
This study showed that hydrothermal conditions and topographic factors of altitude and slope were the dominant factors affecting the distribution of T. amurensis. The suitable habitat area of T. amurensis was about 14.15×10⁴ km2 under the current climatic conditions, accounting for 14.74% of the total area in China. In the future, under different climate scenarios, the total suitable area will reduce to different degrees compared to the current period, the distribution area of the high suitable area will increase and the distribution area of the medium and low suitable areas will decrease. The habitat suitability of T. amurensis will reduce, and the suitable habitat will generally move to higher latitudes. The priority protected area of T. amurensis was about 5.76×10⁴ km2, which was mainly distributed in Liaoning, Jilin, Heilongjiang, Hebei, Gansu, Shaanxi, Henan, Sichuan and Beijing. Therefore, when planning protected areas, the impact of future climate change should also be taken into account. The establishment of protected areas should be moderately shifted to higher latitudes on the basis of the current projected areas.
Data availability statement
The raw data supporting the conclusions of this article will be made available by the authors, without undue reservation.
Author contributions
F-GZ: Data curation, Formal analysis, Investigation, Writing – original draft. SZ: Conceptualization, Methodology, Software, Writing – review & editing. KW: Investigation, Validation, Writing – review & editing. RZ: Investigation, Validation, Writing – review & editing. GZ: Resources, Supervision, Writing – review & editing. YW: Funding acquisition, Supervision, Validation, Writing – review & editing.
Funding
The author(s) declare financial support was received for the research, authorship, and/or publication of this article. This work was supported by the National Natural Science Foundation of China (41801027 and 31700434), the Fundamental Research Program of Shanxi Province (202203021211250 and 202203021211252), the Fund Program for the Scientific Activities of Selected Returned Overseas Professionals in Shanxi Province (20230025 and 20230027), the Research Project Supported by Shanxi Scholarship Council of China (2023-110), and Shanxi Normal University 2023 Graduate Student Research and Innovation Program (2023XSY062 and 2023XSY063).
Acknowledgments
We thank LetPub (www.letpub.com) for its linguistic assistance during the preparation of this manuscript.
Conflict of interest
The authors declare that the research was conducted in the absence of any commercial or financial relationships that could be construed as a potential conflict of interest.
Publisher’s note
All claims expressed in this article are solely those of the authors and do not necessarily represent those of their affiliated organizations, or those of the publisher, the editors and the reviewers. Any product that may be evaluated in this article, or claim that may be made by its manufacturer, is not guaranteed or endorsed by the publisher.
References
Aiello-Lammens, M. E., Boria, R. A., Radosavljevic, A., Vilela, B., Anderson, R. P. (2015). spThin: an R package for spatial thinning of species occurrence records for use in ecological niche models. Ecography 38, 541–545. doi: 10.1111/ecog.01132
Allouche, O., Kadmon, T. R. (2006). Assessing the accuracy of species distribution models: prevalence, kappa and the true skill statistic (TSS). J. Appl. Ecol. 43, 1223–1232. doi: 10.1111/j.1365-2664.2006.01214.x
Chen, X. X., Yong, X. D., Zeng, X. X., Chen, L. B., Xie, C. L., Huang, J. X., et al. (2019). Influences of environmental factors on species distribution in forest community in Wengyuan Qingyunshan Nature Reserve, Guangdong. Chin. J. Ecol. 38, 3642–3650. doi: 10.13292/j.1000-4890.201912.015
Cobos, M. E., Peterson, A. T., Barve, N., Osorio-Olvera, L. (2019). kuenm: an R package for detailed development of ecological niche models using Maxent. PeerJ 7, e6281. doi: 10.7717/peerj.6281.
Dang, J., Zhao, M., YUAN, A., Gong, X., Luo, L., Li, Y. (2016). The influence factors of Fuzi quality. Lishizhen Med. Materia Med. Res. 27, 2744–2746. doi: 10.3969/j.issn.1008-0805.2016.11.071
Deb, J., Phinn, S., Butt, N., Mcalpine, C. (2017). The impact of climate change on the distribution of two threatened Dipterocarp trees. Ecology 7, 2238–2248. doi: 10.1002/ECE3.2846
Domisch, S., Kakouei, K., Martinez-Lopez, J., Bagstad, K. J., Magrach, A., Balbi, S., et al. (2019). Social equity shapes zone-selection: Balancing aquatic biodiversity conservation and ecosystem services delivery in the transboundary Danube River Basin. Sci. Total Environ. 656, 797–807. doi: 10.1016/j.scitotenv.2018.11.348
Du, Q. (2022). MaxEnt model analysis on the evolution of woody plant distribution pattern in the Amur River Basin under climate change. [master’s thesis]. Harbin City(IL): Northeast Forestry University.
Guisan, A., Thuiller, W. (2005). Predicting species distribution: offering more than simple habitat models. Ecol. Lett. 8, 993–1009. doi: 10.1111/j.1461-0248.2005.00792.x
Guo, Y., Zhang, Z., QIAO, H., Wang, R., Wei, H., Wang, L., et al. (2020). Challenges and development trend of species distribution model. Adv. Earth Sci. 35, 1292–1305. doi: 10.11867/j.issn.1001-8166.2020.110
Han, J., Li, C., Li, Y. (2017). Construction of green space ecological network based on GIS of western ecological new district in Zhuhai. J. Northeast Forestry Univ. 32, 243–251. doi: 10.3969/j.issn.1001-7461.2017.05.41
Hou, M., Chang, X., Huang, G., LI, R. (2020). Identification of the priority conservation areas of national park: A case study of Lishui City. Chin. J. Appl. Ecol. 31, 2332–2340. doi: 10.13287/j.1001-9332.202007.015
Kim, M., Lee, A., Kang, D., Kim, S. (2018). Flowering and nectar characteristics of Tilia amurensis, T. mandshurica and T. insularis. Acta Hortic. 1229), 271–276. doi: 10.17660/ActaHortic.2018.1229.41
Li, J., Zheng, J., Guo, Z., Fan, C., Wang, S. (2021). Tilia amurensis afforestation experiment in the gap of secondary deciduous broad-leaved forest. J. Northeast Forestry Univ. 49, 1–5. doi: 10.13759/j.cnki.dlxb.2021.06.001
Li, L., Jin, G., Liu, Z. (2022a). Variations and correlations of lamina and petiole traits of three broadleaved species in a broadleaved Korean pine forest. Chin. J. Plant Ecol. 46, 687–699. doi: 10.17521/cjpe.2022.0045
Li, Q., Wang, Y., Kong, Y., Yao, J., Lu, Y., Yan, L., et al. (2022b). Study on tissue culture and rapid propagation of Tilia amurensis. J. Agric. 12, 60–64. doi: 10.11923/j.issn.2095-4050.cjas20200200029
Li, S., Mo, S., Hu, X., Deng, T. (2023). Prediction of potential suitable areas of endangered plant Abies ziyuanensis based on MaxEnt and ArcGIS. Chin. J. Ecol. 1000-4890, 1–11. doi: 10.13292/j.1000-4899.2022.0045
Liu, Y., Zhang, D., Ji, L., Xu, L., Dong, L., Yang, L. (2020). Effects of selective cutting on the distribution pattern and inter-specific association of arbor seedlings in Tilia amurensis secondary forest. Chin. J. Appl. Ecol. 31, 3296–3304. doi: 10.13287/j.1001-9332.202010.004
Massimiliano, F., Carranza, M. L., Garfì, V., Febbraro, M. D., Marchetti, M., Loy, A. (2016). A systematic conservation planning approach to fire risk management in Natura 2000 sites. J. Environ. Manage. 181, 574–581. doi: 10.1016/j.jenvman.2016.07.006.
Muscarella, R., Galante, P. J., Soley-Guardia, M., Boria, R. A., Kass, J. M., Uriarte, M., et al. (2015). ENMeval: An R package for conducting spatially independent evaluations and estimating optimal model complexity for Maxent ecological niche models. Methods Ecol. Evol. 5, 1198–1205. doi: 10.1111/2041-210X.12261
Naimi, B., Araujo, M. B. (2016). sdm: a reproducible and extensible R platform for species distribution modelling. Ecography 39, 368–375. doi: 10.1111/ecog.01881
OuYang, L., Chen, S., Liu, X., He, S., Zhang, W. (2019). Suitable geographic Range for Eucalyptus camaldulensis in China and its Response to climate change. Scientia Silvae Sin. 55, 1–11. doi: 10.11707/j.1001-7488.20191201
Phillips, S. J., Dudík, M. (2008). Modeling of species distributions with Maxent: new extensions and a comprehensive evaluation. Ecography 31, 161–175. doi: 10.1111/j.0906-7590.2008.5203.x
Sun, J., Yao, F., Zhang, Z. (2019). Differences of leaf dark respiration and light inhibition between saplings and mature trees of Pinus koraiensis and Tilia amurensis. Chin. J. Appl. Ecol. 30, 1463–1468. doi: 10.13287/j.1001-9332.201905.008
Sun, S., Zhang, Y., Huang, D., Wang, H., Wang, R. (2020). The effect of climate change on the richness distribution pattern of Oaks (Quercus L.) in China. Sci. Total Environ. 744, 140786. doi: 10.1016/j.scitotenv.2020.140786
Tang, X., Yuan, Y., LI, X., Zhang, J. (2021). Maximum entropy modeling to predict the impact of climate change on pine wilt disease in China. Front. Plant Sci. 12. doi: 10.3389/fpls.2021.652500
Urban, M. C. (2015). Accelerating extinction risk from climate change. Science 348, 571–573. doi: 10.1126/science.aaa4984
Wang, X., Duan, Y., Jin, L., Wang, C., Peng, M., Li, Y., et al. (2023). Prediction of historical,present and future distribution of Qucercus sect Heterobalanus based on the optimized MaxEnt in China. Acta Ecologica Sin. 43, 6590–6604. doi: 10.20103/j.stxb.2022103133093
Wang, J., Ni, J. (2006). Review of modelling the distribution of plant species. J. Plant Ecol. 06), 1040–1053. doi: 10.17521/cjpe.2006.0133
Ward, D. (2007). Modelling the potential geographic distribution of invasive ant species in New Zealand. Biol. Invasions 9, 723–735. doi: 10.1007/s10530-006-9072-y
Williams, J. W., Stephen T, J., John, E. ,. K. (2007). Projected distributions of novel and disappearing climates by 2100AD. Proc. Natl. Acad. Sci. U.S.A. 104, 5738–5742. doi: 10.1073/pnas.0606292104
Xia, Z., Su, J., Yin, H., Kong, F. (2023). Temporal and spatial patterns of habitat of Nipponia nippon in China under the background of climate change. Chin. J. Appl. Ecol. 34, 1467–1473. doi: 10.13287/j.1001-9332.202306.008
Xu, Z. L., Peng, H. H., Peng, S. Z. (2015). The development and evaluation of species distribution models. Acta Ecol. Sin. 35 (02), 557–567. doi: 105846/stxb201304030600
Ying, B., Kuo, K., Guo, H., Yang, X., Li, W., Li, Q., et al. (2024). Predicting potential suitable habitats of Kandelia obovata in China under future climate scenarios based on MaxEnt model. Acta Ecologica Sin. 44, 1–11. doi: 10.20103/j.stxb.202210313093
Zhang, J., Ge, S., Liang, J., Li, J. (2022). Population structure and dynamic characteristics of Tilia amurensis in broad leaved Korean pine mixed forest in Changbai Mountain. Acta Ecologica Sin. 42, 5381–5390. doi: 10.5846/stxb202106191629
Zhang, X., Jin, X., Wu, X., Liang, X., Han, B., Sun, R., et al. (2021). Delineation of flexibe ecological protection space based on the concept of systematic conservation: take Maoming CITY of Guangdong Province as an example. Acta Ecologica Sin. 41, 7393–7405. doi: 10.5846/stxb202010192655
Zhang, T., Liu, G. (2017). Study of methods to improve the temporal transferability of niche model. J. China Agric. Univ. 22, 98–105. doi: 10.11841/jissn.1007-4333.2017.02.12
Zhang, Y., Si, Q., Hu, J., Chen, J., Wang, C., Xie, R., et al. (2023b). Prediction of the potential geographical distribution of the invasive plant Gymnocoronis spilanthoides in China under climate change. Acta Ecologica Sin. 43, 8852–8864. doi: 10.20103/j.stxb.202210212992
Zhang, H., Xu, L., Lyu, W., Zhou, Y., Wang, W., Gao, R., et al. (2023a). Multidimensional climatic niche conservatism and invasion risk of Phenacoccus solenopsis. Chin. J. Appl. Ecol. 34, 1649–1658. doi: 10.13287/j.1001-9332.202306.018
Zhang, H., Zhao, H. X., Wang, H. (2020). Potential geographical distribution of populus euphratica in China under future climate change scenarios based on Maxent model. Acta Ecol. Sin. 40 (18), 6552–6563. doi: 10.5846/stxb201906111232
Zhao, G., Cui, X., Wang, Z., Jing, H., Fang, B. (2021). Prediction of Potential Distribution of Ziziphus jujuba var. spinosa in China under Context of Climate Change. Scientia Silvae Sin. 57, 158–168. doi: 10.11707/j.1001-7488.20210618
Zhao, G., Fan, B. (2021). Prediction on spatial migration of suitable distribution of Eleutharrhena macrocarpa (Diels) forman since last inter glacial. Southwest China J. Agric. Sci. 34, 174–182+229. doi: 10.16213/j.cnki.scjas.2021.1.026
Keywords: Tilia amurensis Rupr, MaxEnt model, dominant environmental factor, Marxan model, suitable area
Citation: Zhang F-G, Zhang S, Wu K, Zhao R, Zhao G and Wang Y (2024) Potential habitat areas and priority protected areas of Tilia amurensis Rupr in China under the context of climate change. Front. Plant Sci. 15:1365264. doi: 10.3389/fpls.2024.1365264
Received: 04 January 2024; Accepted: 07 February 2024;
Published: 15 March 2024.
Edited by:
Yuanrun Zheng, Chinese Academy of Sciences (CAS), ChinaCopyright © 2024 Zhang, Zhang, Wu, Zhao, Zhao and Wang. This is an open-access article distributed under the terms of the Creative Commons Attribution License (CC BY). The use, distribution or reproduction in other forums is permitted, provided the original author(s) and the copyright owner(s) are credited and that the original publication in this journal is cited, in accordance with accepted academic practice. No use, distribution or reproduction is permitted which does not comply with these terms.
*Correspondence: Yongji Wang, d2FuZ3lvbmdqaTEyNkAxMjYuY29t