 Yongqin Yang1
 Dingming Kang
- 1Ministry of Education of the People's Republic of China (MOE) Key Laboratory of Crop Heterosis and Utilization, College of Agronomy and Biotechnology, China Agricultural University, Beijing, China
- 2Department of Applied Physics, College of Science, China Agricultural University, Beijing, China
- 3Department of Electrical Engineering, College of Information and Electrical Engineering, China Agricultural University, Beijing, China
Introduction: NIR spectroscopy combined with chemometric algorithms has been widely used for seed authenticity detection. However, the study of seed genetic distance, an internal feature that affects the discriminative performance of classification models, has rarely been reported.
Methods: Therefore, maize seed samples of different genotypes were selected to investigate the effect of genetic distance on the authenticity of single seeds detected by NIR spectroscopy. Firstly, the Support vector machine (SVM) model was established using spectral information combined with a preprocessing algorithm, and then the DNA of the samples was extracted to study the correlation between genetic and relative spectral distances, the model identification performance, and finally to compare the similarities and differences between the results of genetic clustering and relative spectral clustering.
Results: The results were as follows: the average accuracy of the models was 93.6% (inbred lines) and 93.7% (hybrids), respectively; Genetic distance and correlation spectral distance exhibited positive correlation significantly (inbred lines: r=0.177, p<0.05; hybrids: r=0.238, p<0.05), likewise genetic distance and model accuracy also showed positive correlation (inbred lines: r=0.611, p<0.01; hybrids: r=0.6158, p<0.01); Genetic clustering and spectral clustering results were essentially uniform for 94.3% (inbred lines) and 93.9% (hybrids), respectively.
Discussion: This study reveals the relationship between the genetic and relative spectral distances of seeds and the accuracy of the model, which provides theoretical basis for the establishment of the standardized system for detecting the authenticity of seeds by NIR spectroscopic techniques.
1 Introduction
Since its domestication by humans 9,000 years ago, maize has played an increasingly diverse role in global agricultural systems and is an important food and feed crop in the world (Kennett et al., 2020). The purity and authenticity of maize hybrids is not only indication of seed identity, but also at least one of the most important indicators of seed quality. Related studies have shown that for every 1% reduction in seed purity, the yield of maize is reduced by 180 kg/ha (Zhao and Wang, 2013). Authenticity of maize inbred lines, on the other hand, is the critical factor in determining the authenticity of progeny hybrids (Frascaroli et al., 2007).
Currently popular detection methods, seed or seedling morphology testing is simple to operate, but the scope of application is narrow; field planting identification results are intuitive but the cycle time is long; protein fingerprinting technology experimental results are unstable; DNA fingerprinting technology is authoritative and accurate because of its detection of DNA molecular level differences; however, like protein fingerprinting technology, the method must be damaged samples, and requires a certain sample size, the required equipment, personnel costs and technology costs are higher, in addition to the testing process of the waste will also pollute the environment (Ertiro et al., 2015). Therefore, it is necessary to explore a more rapid, convenient, reliable and accurate technique for seed sample authenticity detection (ElMasry et al., 2019).
Near-infrared (NIR) spectroscopy is the qualitative and quantitative detection of hydrogen-containing groups (e.g. C-H, N-H, O-H, etc.) by analyzing the information of octave and combined frequency between them, which is widely used in the identification of the purity of crop seed varieties due to the advantages of non-destructive, rapid and high throughput (Osborne and Fearn, 1986). The PLS-DA classification model was able to achieve 80-100% accuracy in studies applying NIR spectroscopy to differentiate wheat seeds of different ploidy (Ziegler et al., 2016). In addition, previous studies have used chemometric algorithms such as multiple scattering correction (MSC), principal component analysis (PCA), and K-nearest neighbor algorithm (KNN) to test the authenticity of 520 rice samples of different quality grades and origins, and the classification results exceeded 90% (Teye et al., 2019). However, the former researchers mainly focused on factors including basic statistics, selection of classification methods, and data processing methods, while the effect of genetic differences between different samples, i.e. genetic distances, on the identification performance of the model has rarely been published, furthermore, there is as yet no systematic study on the correlation between genetic distances and relative spectral distances, and between the genetic clustering results and the spectral clustering results.
Therefore, in this experiment, different maize inbred lines and hybrids were selected to study the relationship between genetic distance and spectral distance among samples and the performance of the model discrimination. Specifically, the experiments included: 1) using spectral data of samples to build a SVM discrimination model combined with preprocessing; 2) using near-infrared spectral data to calculate the relative spectral distance among samples and carry out spectral clustering; 3) extracting DNA from samples, calculating genetic distance, and performing genetic clustering; 4) comparing and analyzing the results of the two clustering methods, as well as the relationships between relative spectral distance, genetic distance, and model discrimination performance among samples.
2 Materials and methods
2.1 Preparation of seed samples
In this research, 35 inbred lines and 33 hybrids were selected from the production base of maize seed in Zhangye City, Gansu Province, which were harvested in 2018 (Table 1). All the genotypes were the main inbred lines and hybrids in different maize planting areas in China. There were 150 grains of each genotype, totalling 10200 samples, were chosen from seeds with full kernels and free of pests and diseases. After moisture equilibration, the moisture content of all samples was maintained at 10% to 11%.
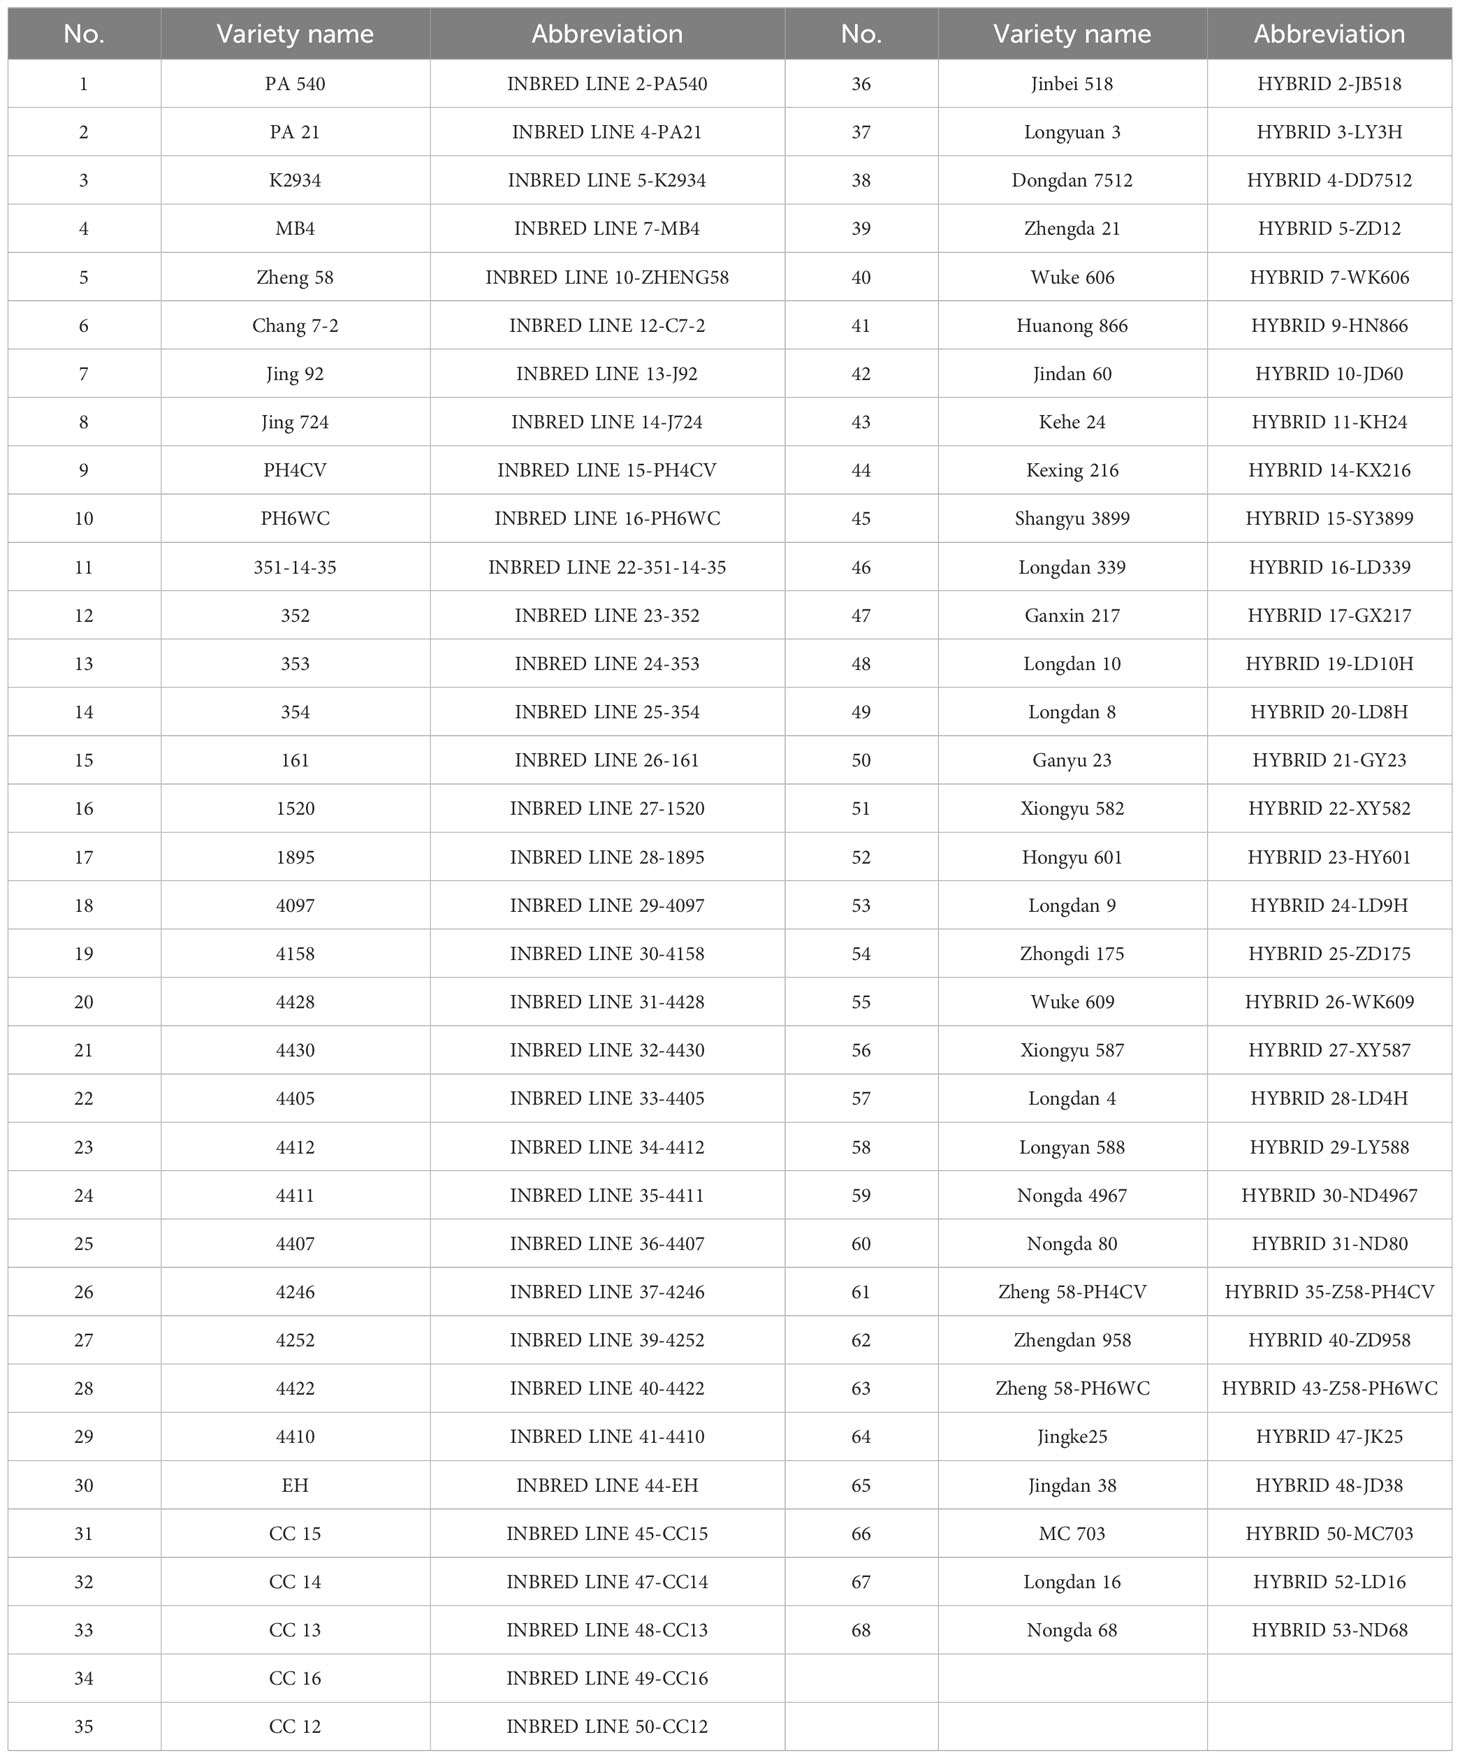
Table 1 Number, name and abbreviation of 68 maize seed samples.
2.2 Acquisition of NIR spectral information
Spectral data were acquired using a Micro NIR 1700ES near infrared spectrometer manufactured by JDSU (Figure 1). The spectral range was from 908.1 to 1677.2 nm, with the gap between neighbouring bands being 6.1944 nm, totalling 125 wavelength points (Pu et al., 2021). The spectroscopic equipment was warmed up for 45 min before use and a black and white reference correction was made with a BaSO4 correction whiteboard: the correction whiteboard was completely covered on the upper end of the spectrometer; the tungsten lamp was switched off and the dark correction was collected; the light was switched on and the white correction was collected. The spectral data of single seeds were collected in all experiments, and the embryonic part of the seeds was placed on one side of the detector, and five spectra were acquired for each sample, and the average value was taken as the raw spectral data of the samples. The details of the parameters of the spectral acquisition are as follows: the number of integrations is 200, the spectral acquisition time is 2 s (Agelet and Hurburgh, 2014).
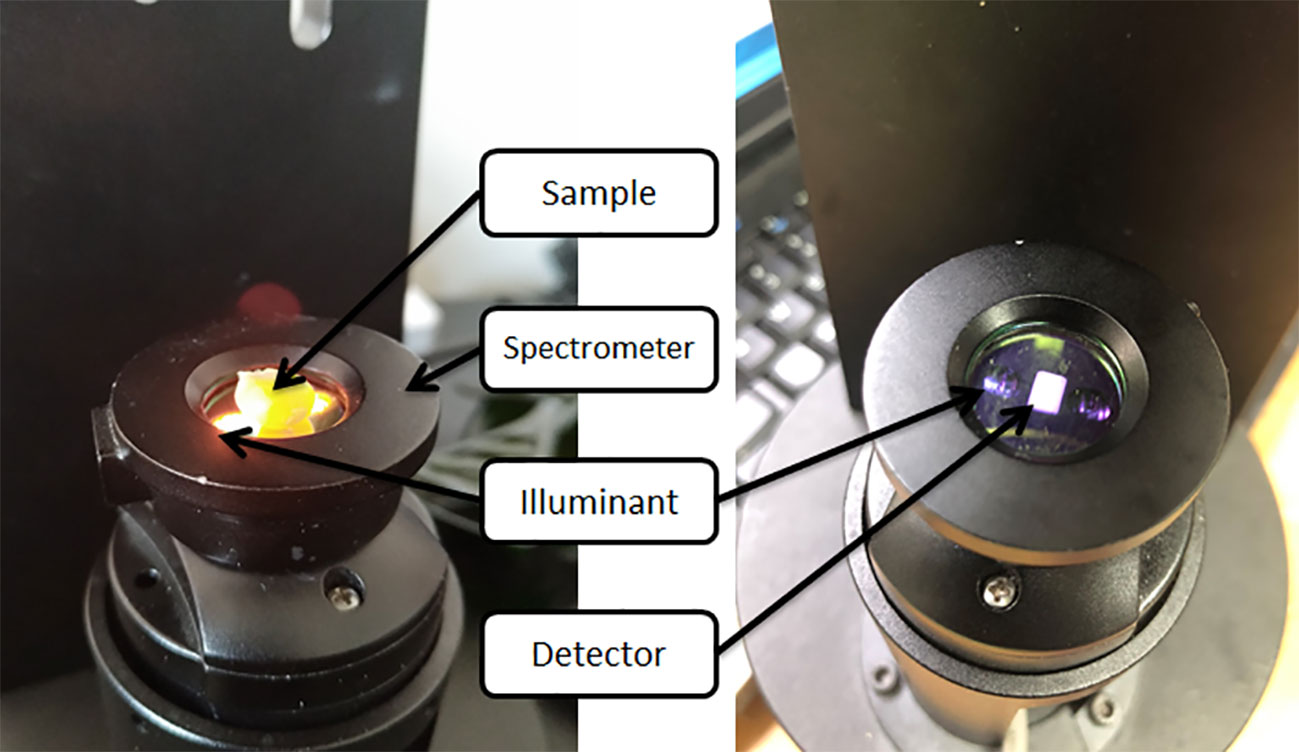
Figure 1 Instruments scheme of transmission mode.
2.3 NIR spectral data analysis
Spectral data were analyzed using the software The Unscrambler X version 10.5.1 (CAMO Analytics, Magnolia, TX, USA).
2.3.1 Detection of spectral outliers
PCA is a commonly used technique for data dimensionality reduction. The original data is mapped by a linear transformation to a new coordinate system, where the coordinates are called principal components (Fabiyi et al., 2019). In the new coordinate system, the features according to the variance of the data from the largest to the smallest are located sequentially on different principal components. Thus, PCA can be used to detect outliers in spectral data. The acquired spectral data were utilized for PCA to detect spectral outliers as well as to explore common patterns between spectra.
2.3.2 Spectral pre-processing
Savitzke-Golay Derivatives (SGD) and Standard Normal Variate (SNV) were chosen for spectral preprocessing to improve the signal-to-noise ratio of the spectra. SGD is based on the spectral smoothing results, and the derivative values of the spectral curves are calculated at different positions, highlighting spectral variations and features (Zhang and Mouazen, 2023). SNV is used to improve the comparability and interpretability of spectral data, making spectral variations between different samples more obvious, and is suitable for applications such as interpretation, classification and prediction of spectral data (Lanjewar et al., 2023).
2.3.3 Establishment of authenticity identification model
In this experiment, we chose to use the SVM algorithm to build classification models. As a common supervised learning algorithm, the support vector machine is a binary classification model that maps the sample data into a high-dimensional space and then finds an optimal hyperplane in that space, which in turn separates samples of different categories. The choice of hyperplane is based on the principle of maximizing the separation of two samples of different categories (Devos et al., 2009). The Radial Basis Function (RBF) in this algorithm is a common kernel function for nonlinear classification, also known as Gaussian kernel function. It is calculated as follows:
where x and x’ are the input vectors and γ is a hyperparameter controlling the decay rate of the function. ||x-x’||² denotes the square of the Euclidean distance. Specifically, the radial basis kernel function achieves classification of linearly indistinguishable problems by measuring the similarity between the samples and projecting the samples into a high-dimensional space centered on the support vectors (Wu et al., 2019).
The preprocessed spectral data were divided into modelling set and external test set according to 2:1.That is, 100 spectra of each material were randomly selected as the modelling set, and the remaining 50 spectra were used as the external test set, which were sequentially combined with the spectral data of other genotypes, and the optimal hyperplane needed to be found by grid searching during the selection of the SVM modelling process, and the model performance was cross-validated by the Leave-One-Out method (Kavdir et al., 2009). Then, the penalty factor C and kernel function parameter γ are determined by calculating the model training accuracy and cross-validation accuracy, and the optimal parameter combination is sought (Alves and Poppi, 2013). Finally, the performance of the recognition model is evaluated based on the accuracy of the external test set.
2.3.4 Cluster analysis of spectral data
Based on the pre-processed spectral data, the Euclidean distance between the samples was calculated by using the dist function in R language and selecting the “Euclidean” method (Li et al., 2015). Then the Euclidean distance matrix was imported into Power Marker V3.25 software to obtain the Neighbor-Joining clustering results of the spectral data, and the clustering diagram was drawn with MEGA7 software.
2.4 DNA analysis of seed samples
The DNA of the samples was extracted by CTAB method (Wang et al., 2011). The 40 pairs of SSR primers used in this study are all primers published in the Chinese industry standard for maize variety identification. These primers have good polymorphism and are evenly distributed on the 10 chromosomes of maize. The specific primer names, sequences, and fragment lengths are referred to in published literature, and 40 pairs of cores SSR fluorescent primers were shown in Table 2. SSR-PCR system: The total volume of the reaction solution is 20 μL, including 10 μL of 2×Taq Plus Master Mix, 7.75 μL of ddH2O, 0.25 μL of primers, and 2 μL of DNA sample. PCR program: pre-denaturation at 95°C for 5 min; denaturation at 94°C for 40 s, annealing at 60°C for 35 s, extension at 72°C for 45 s, 35 cycles; extension at 72°C for 10 min; PCR products are stored at 4°C.
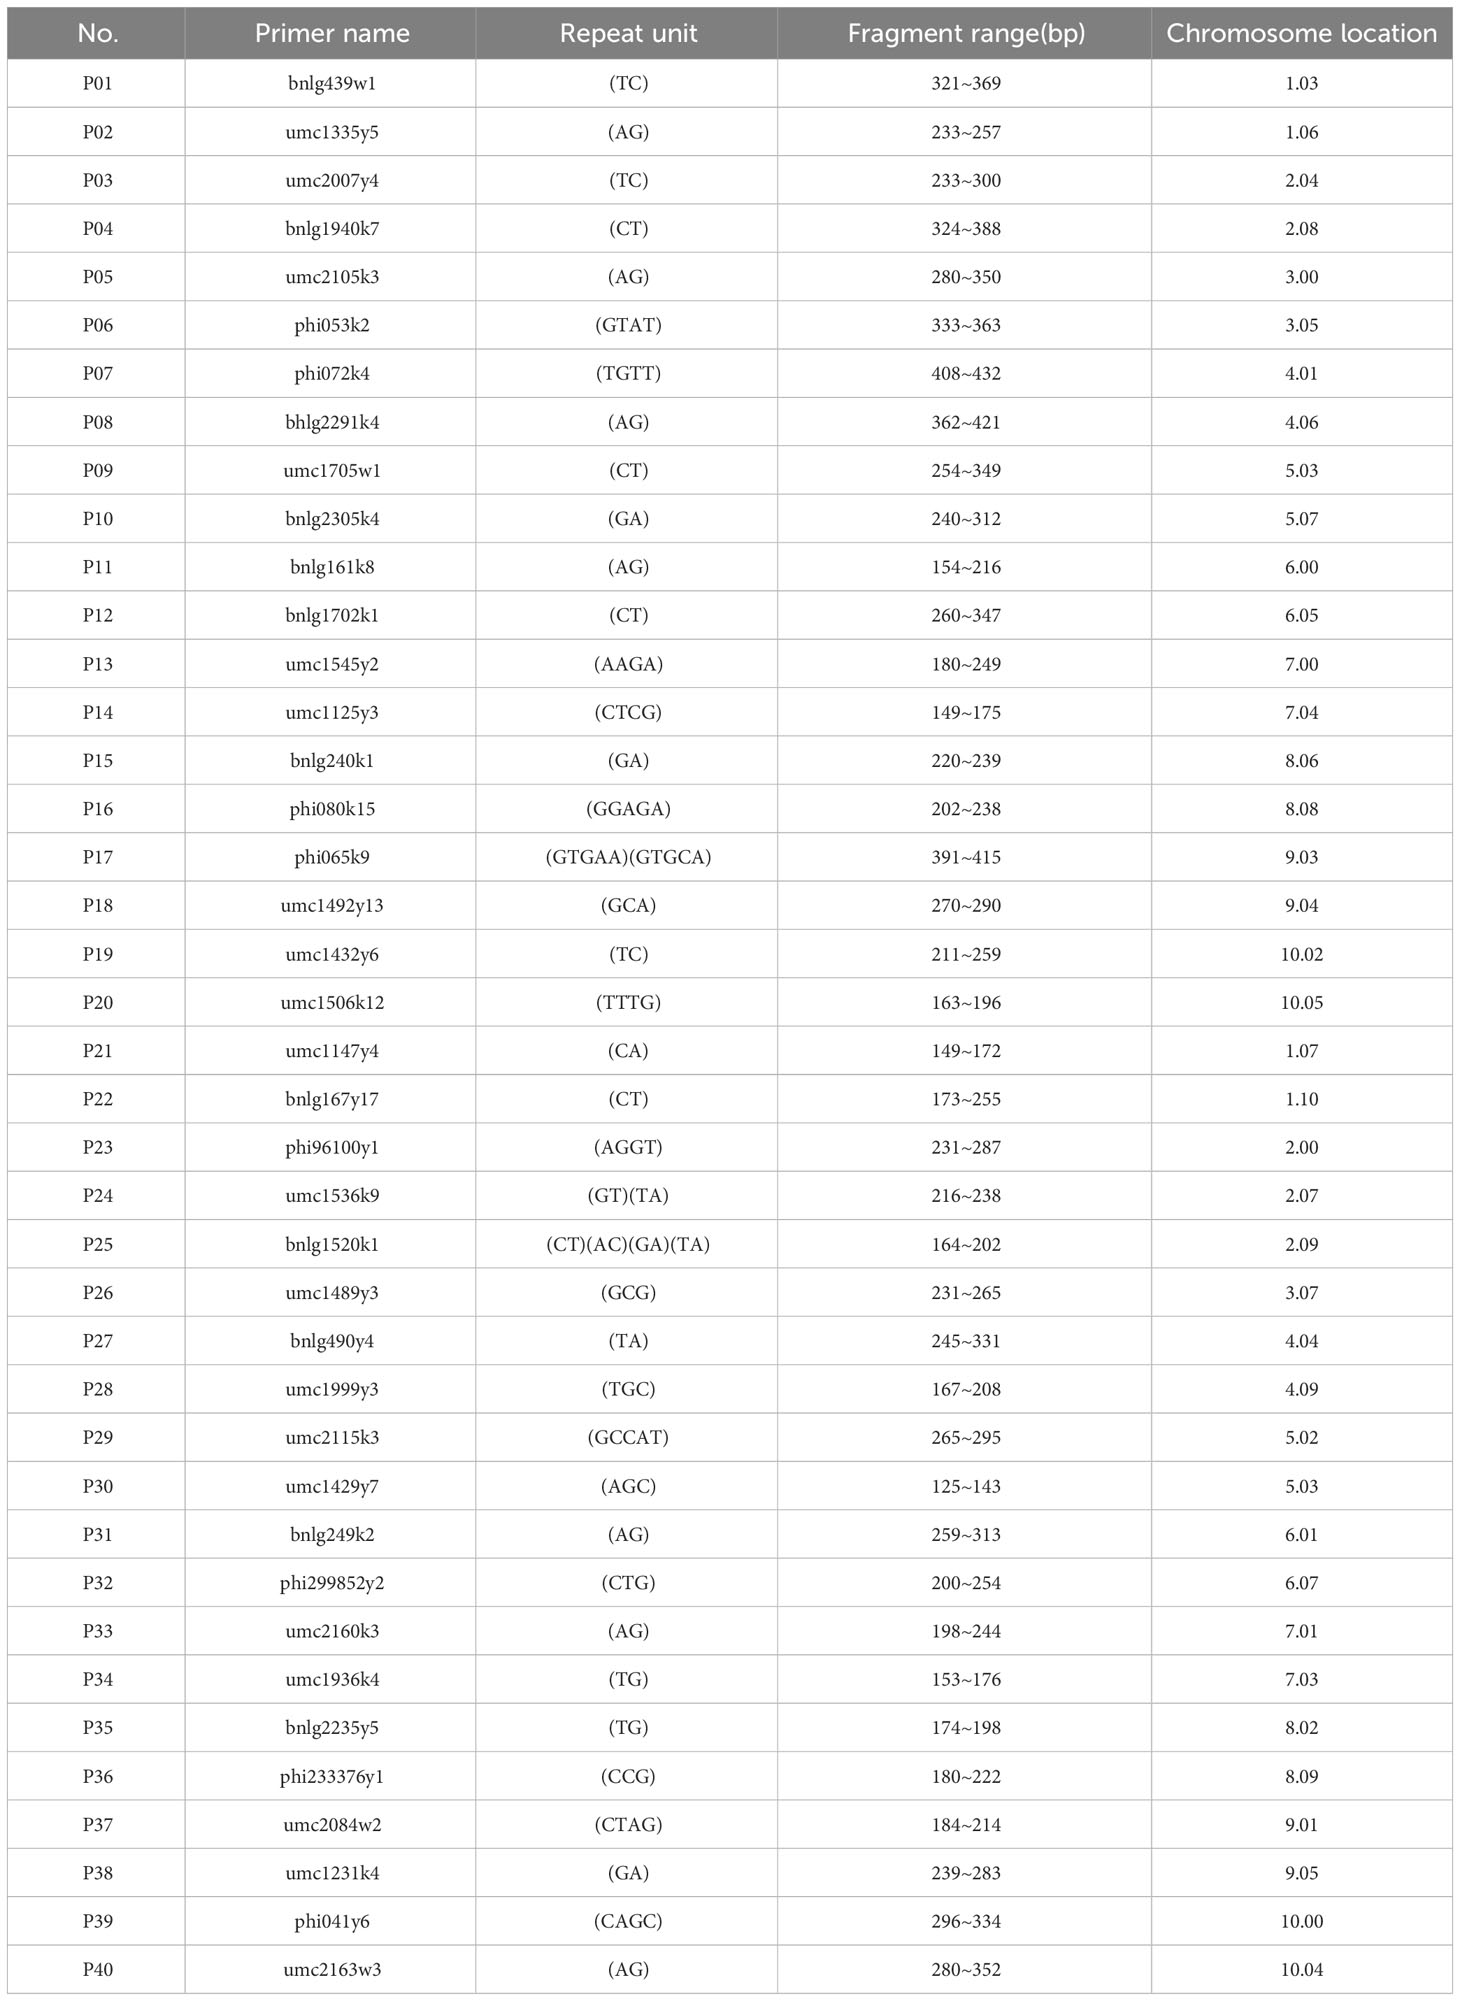
Table 2 Name, repeat unit, fragment range and chromosome location of 40 pairs of cores SSR primers.
PCR product detection: A method of electrophoresis detection of 10-fold PCR products was used. 2 μL of 10-fold PCR mixed products and 10 μL of formamide containing 1% GS3730-500 molecular weight internal standard was added to individual wells of a 96-well electrophoresis plate. The above mixed samples were placed in a PCR instrument for denaturation at 95°C for 5min, stored at 4°C for 10 min, centrifuged at 2000 rpm for 30 s, and then electrophoresed on an ABI 3730XL DNA analyzer using fluorescence capillary electrophoresis (Wang et al., 2017). The electrophoresis time was 30 min and the raw data were collected by Data Collection software, and the data were genotyped and analyzed using SSR Analyzer (V1.2.4) fingerprint analyzer.
Genetic clustering was analyzed with reference to previous studies (Liu et al., 2021). SSR genotype data were analyzed using Power Marker V3.25 software, and genetic distances between samples were calculated based on Saitou and Nei's (1987) method to obtain the Neighbor-Joining clustering results of SSR markers, which were combined with MEGA7 software to draw the clustering diagram (Nei and Li, 1979).
3 Results and analysis
3.1 Genetic clustering of maize seed samples
The SSR genotype data was clustered by using the Unweighted Pair Group Method with Arithmetic Mean (UPGMA) method, and a clustering diagram was plotted using the MEGA7 software. Thirty-five inbreds and 33 hybrids were clustered and analyzed and the results are shown in Figure 2. 35 inbreds were clustered into four groups with a minimum genetic distance of 0.0250 and a maximum genetic distance of 0.9000. 33 hybrids were also clustered into four groups with a minimum genetic distance of 0.0500 and a maximum genetic distance of 0.8947.
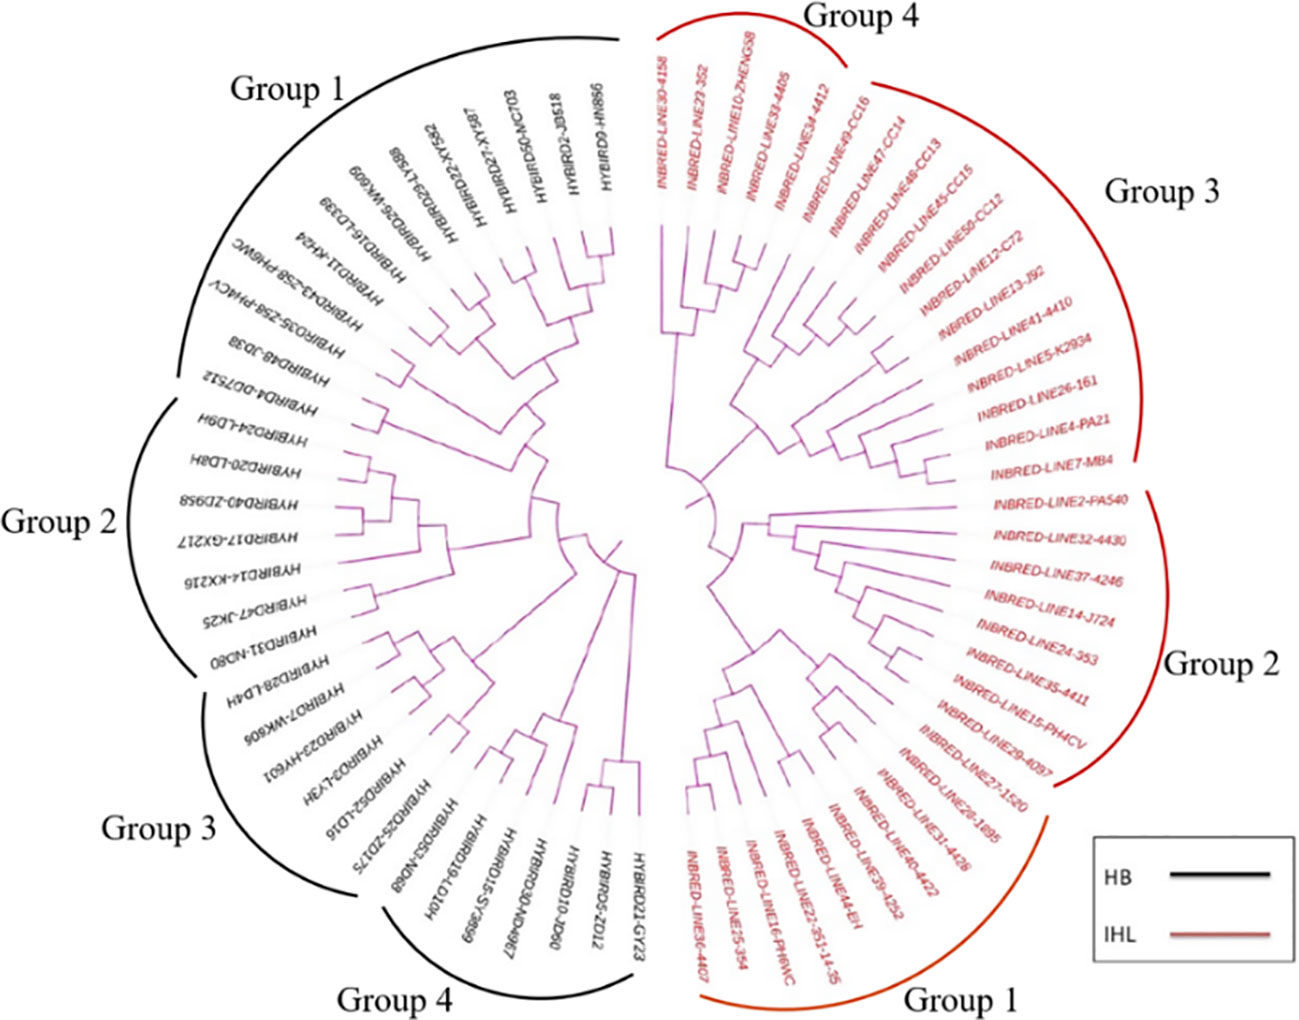
Figure 2 Genetic clustering plots between maize seed samples of different genotypes, with results based on genetic distances between samples, combined with the unweighted Pair-Group Method using Arithmetic averages. HB, hybrids; IHL, inbred lines.
3.2 NIR spectral characterization and spectral pre-processing
Single kernel detection, combined with diffuse reflectance, was used to collect spectral information from the embryo surface position of the maize samples, and the spectral features are detailed in Figure 3. Subsequently, the spectral information was subjected to principal component analysis, using mean-centered data. The results indicate that no outliers were found in any of the datasets. As shown in Figure 4, the graph demonstrates the first 2 PC score plots. From the figure, it is easy to find that the different genotypes of maize seeds show the trend of clustering, which suggests that the NIR spectral information contains information related to the genotypes of the samples. However, PCA analysis of inbred lines and hybrids cannot effectively distinguish different genotypes of samples based on spectra.
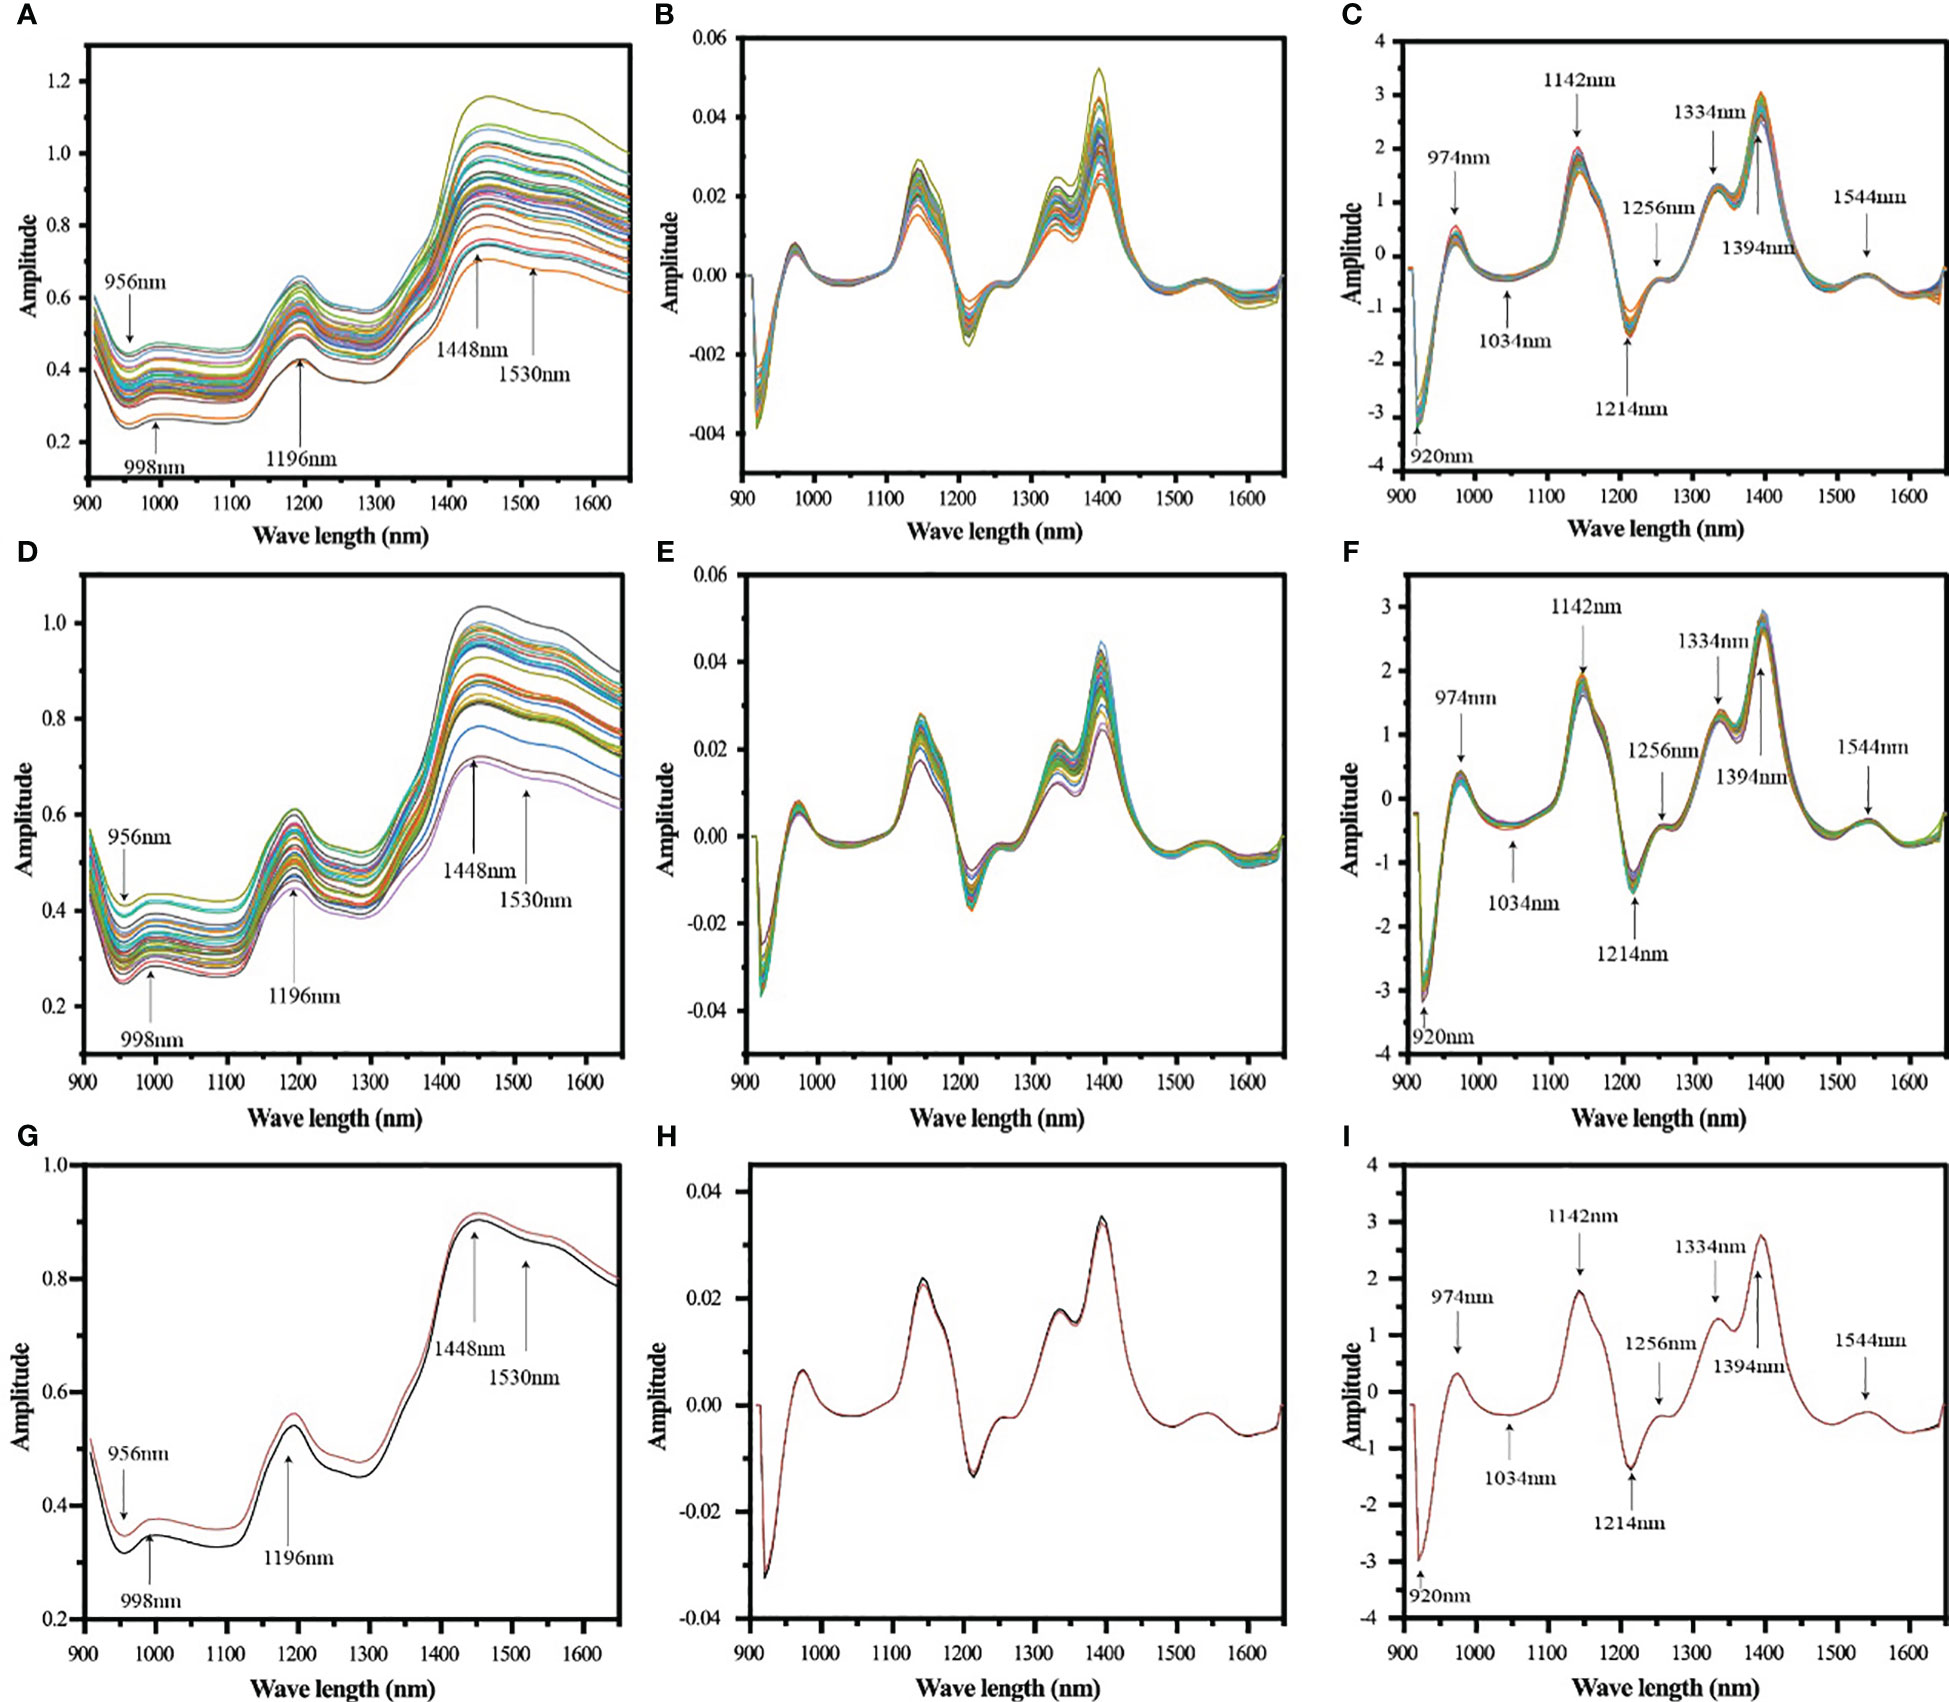
Figure 3 Average spectra of single grain samples of maize seeds of different genotypes acquired with Micro NIR 1700ES near infrared spectrometer (900~1700 nm) (A: inbred lines, D: hybrids, G: hybrids and inbred lines), spectra of SGD pretreatment (B: inbred lines, E: hybrids, H: hybrids and inbred lines), and SGD+SNV pretreatment spectra (C: inbred lines, F: hybrids, I: hybrids and inbred lines), with different colored lines reflecting the average spectra of maize seed samples of different genotypes, and the red and black lines in (G–I) represent the average spectra of inbred lines and hybrids, respectively.
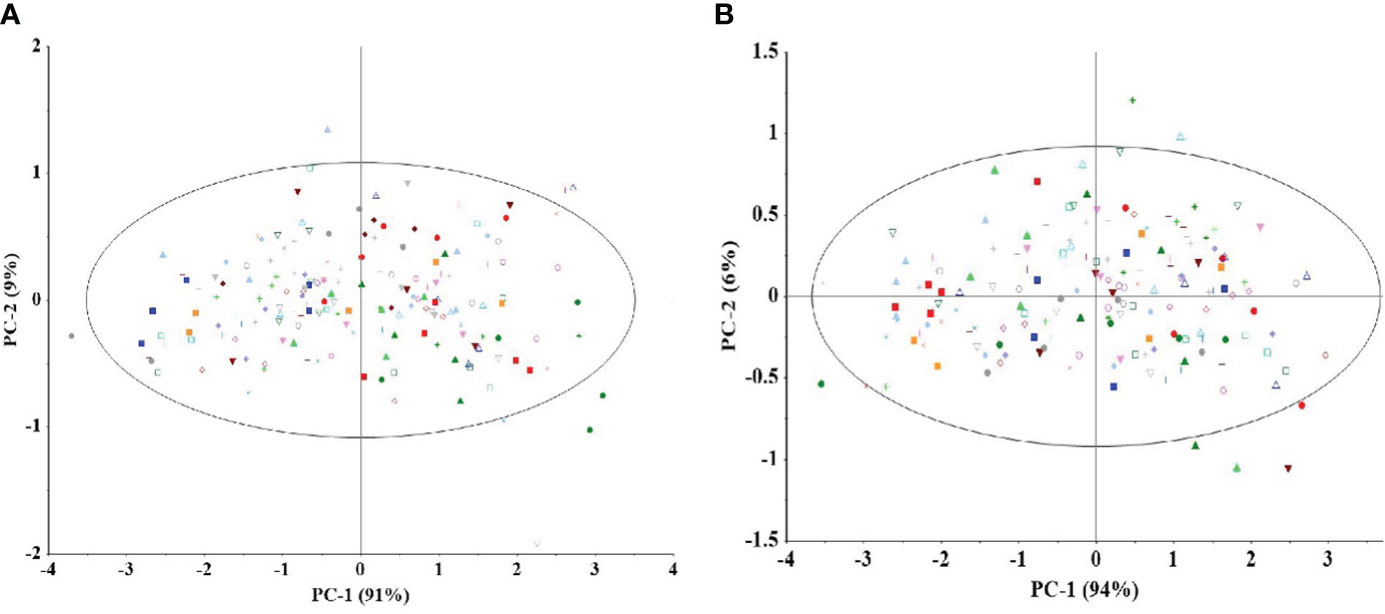
Figure 4 Score plots using the first two components of all NIR spectra (mean centers). Principal component analysis was performed on the spectral data of inbred lines (A) and hybrids (B). In the figure, each point of the same color and shape represents the distribution of different inbred lines (A) or hybrid (B) (5 spectral data were randomly selected for each genotype sample) in the first two principal component spaces. PCA analysis of inbred lines and hybrids cannot effectively distinguish different genotypes based on spectra.
The spectral data were preprocessed using SGD and SNV. It can be seen from Figure 3 that the spectral peak changes of the pretreated near-infrared spectra are clearer, especially the baseline shift has been significantly corrected.
3.3 NIR spectral clustering of maize seeds
Spectral clustering analysis was carried out using the preprocessed spectral data. In Figure 5, 35 inbred samples were clustered into four groups, while 33 hybrid samples were also clustered into four groups. Subsequent comparison of the genetic clustering results with the spectral clustering results revealed that among the inbreds, 33 samples, or 94.3 per cent of the total, had the same clustering. Among the hybrids, 31 samples had the same clustering, accounting for 93.9% of the total. It can be seen that to a certain extent the NIR spectra can reflect the genetic relationship between maize seeds of different genotypes.
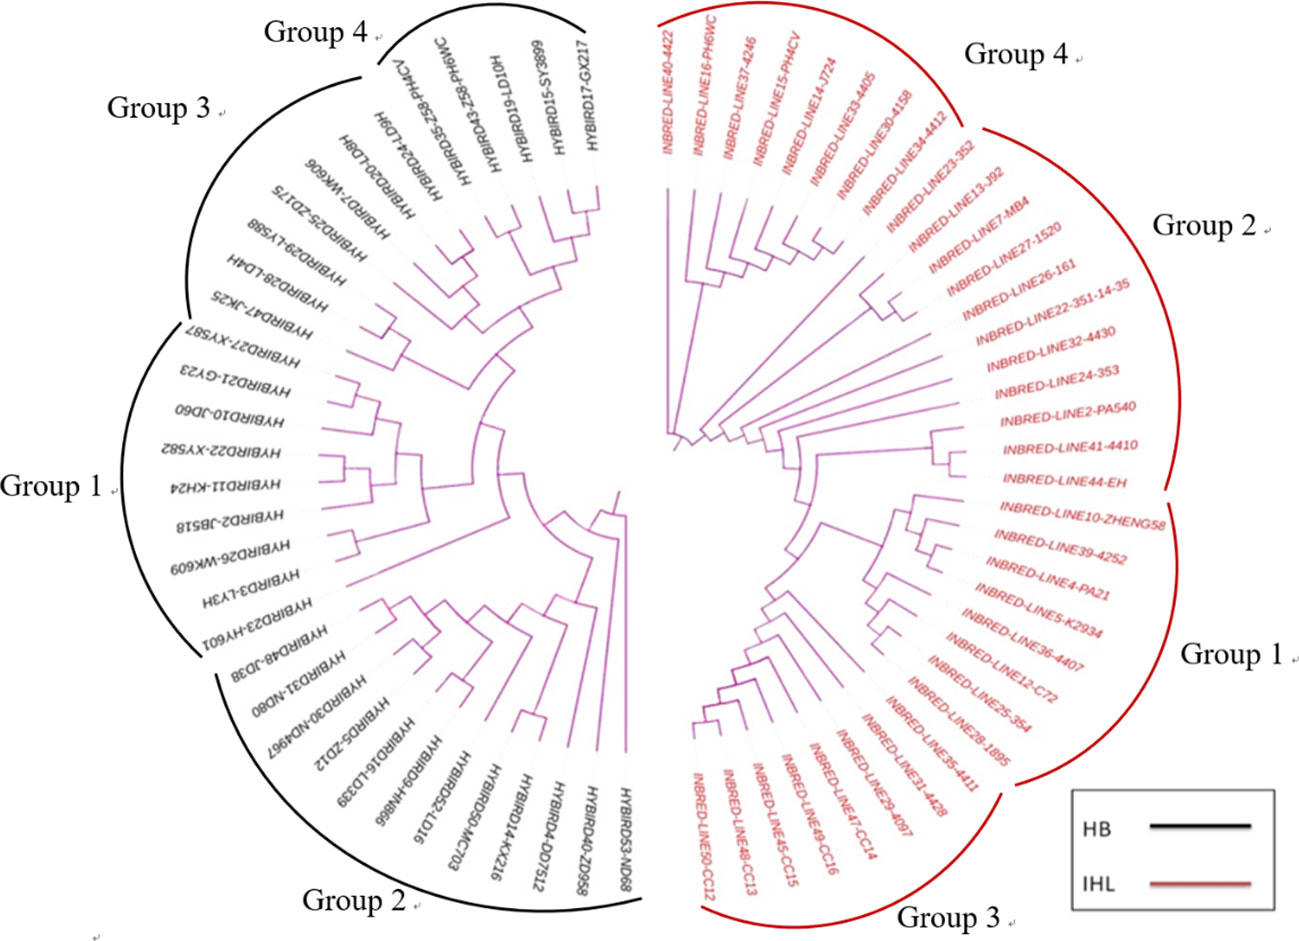
Figure 5 Spectral clustering plots between maize seed samples of different genotypes. results were based on the relative spectral distances between samples combined with the unweighted Pair-Group Method using Arithmetic averages. HB: hybrids; IHL: inbred lines.
3.4 Correlation analysis of relative spectral distances and genetic distances
The Mantel function was used to correlate the two dissimilarity matrices, relative spectral distance and genetic distance (Wynn et al., 2016). This was done specifically with the mantel function in the R language vegan package. Permutation was done with free permutation and Permutation defaulted to 999. The results of the Mantel test, as shown in Table 3, showed that the two matrices of relative spectral and genetic distances were significantly and positively correlated among the 35 inbred lines (Mantel test; r=0.177, p<0.05), and 33 hybrids showed the similar situation (Mantel test; r=0.238, p<0.05).
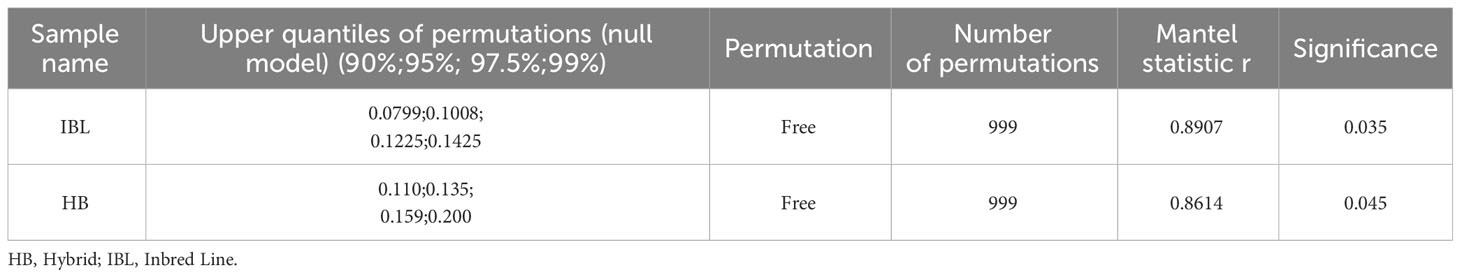
Table 3 Results of Mantel test for genetic distance and relative spectral distance among maize seed samples of different genotypes.
3.5 Establishment of authenticity identification model
Figure 6 shows the discriminative performance of the model. The average accuracy of the models was 93.6%, and the accuracy of all models was distributed between 62% and 100% for 35 maize inbred lines with 595 discriminant models. A total of 528 discriminatory models were established for 33 maize hybrids, and the average accuracy of the models was 93.7%, with the accuracy of all models ranging from 76% to 100%.
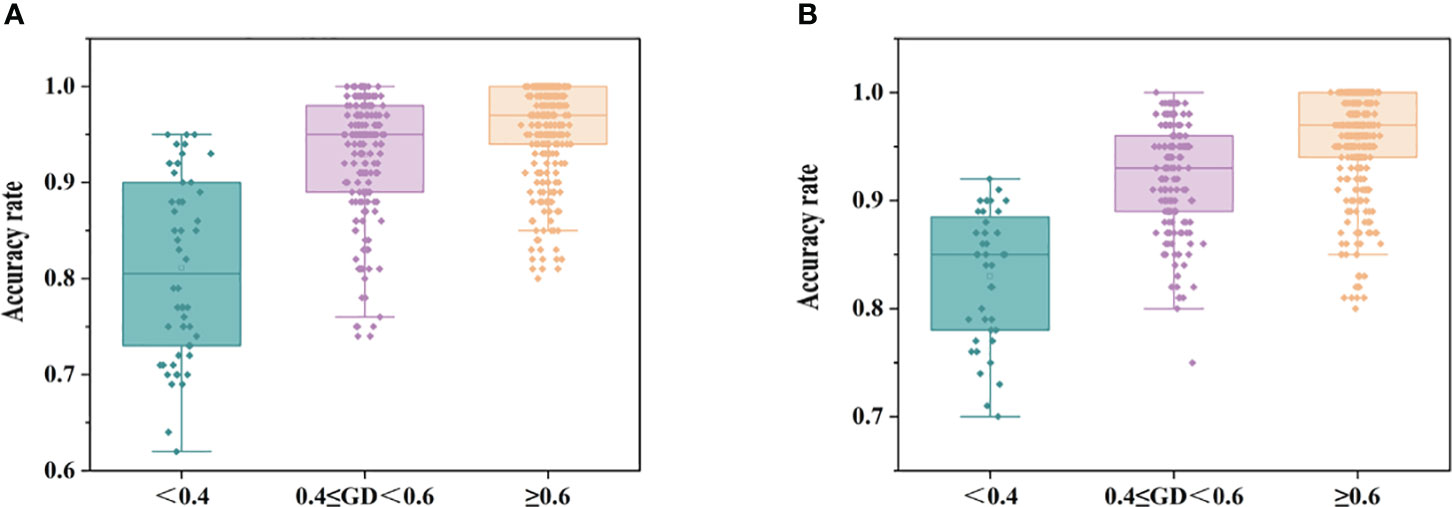
Figure 6 Acc statistics of authenticity discrimination models for maize seed samples of different genotypes (A: inbred lines, B: hybrids).
3.6 Relationship between genetic distance and model discriminatory performance
In order to resolve the effect of genetic distance on model accuracy, simple linear correlation analyses were performed on the above two sets of data, and the bivariate Pearson’s test showed positive correlation between genetic distance and model accuracy in the inbred samples (r=0.611, p<0.01), and the hybrid samples as well (r=0.6158, p<0.01), as shown in Figure 7.
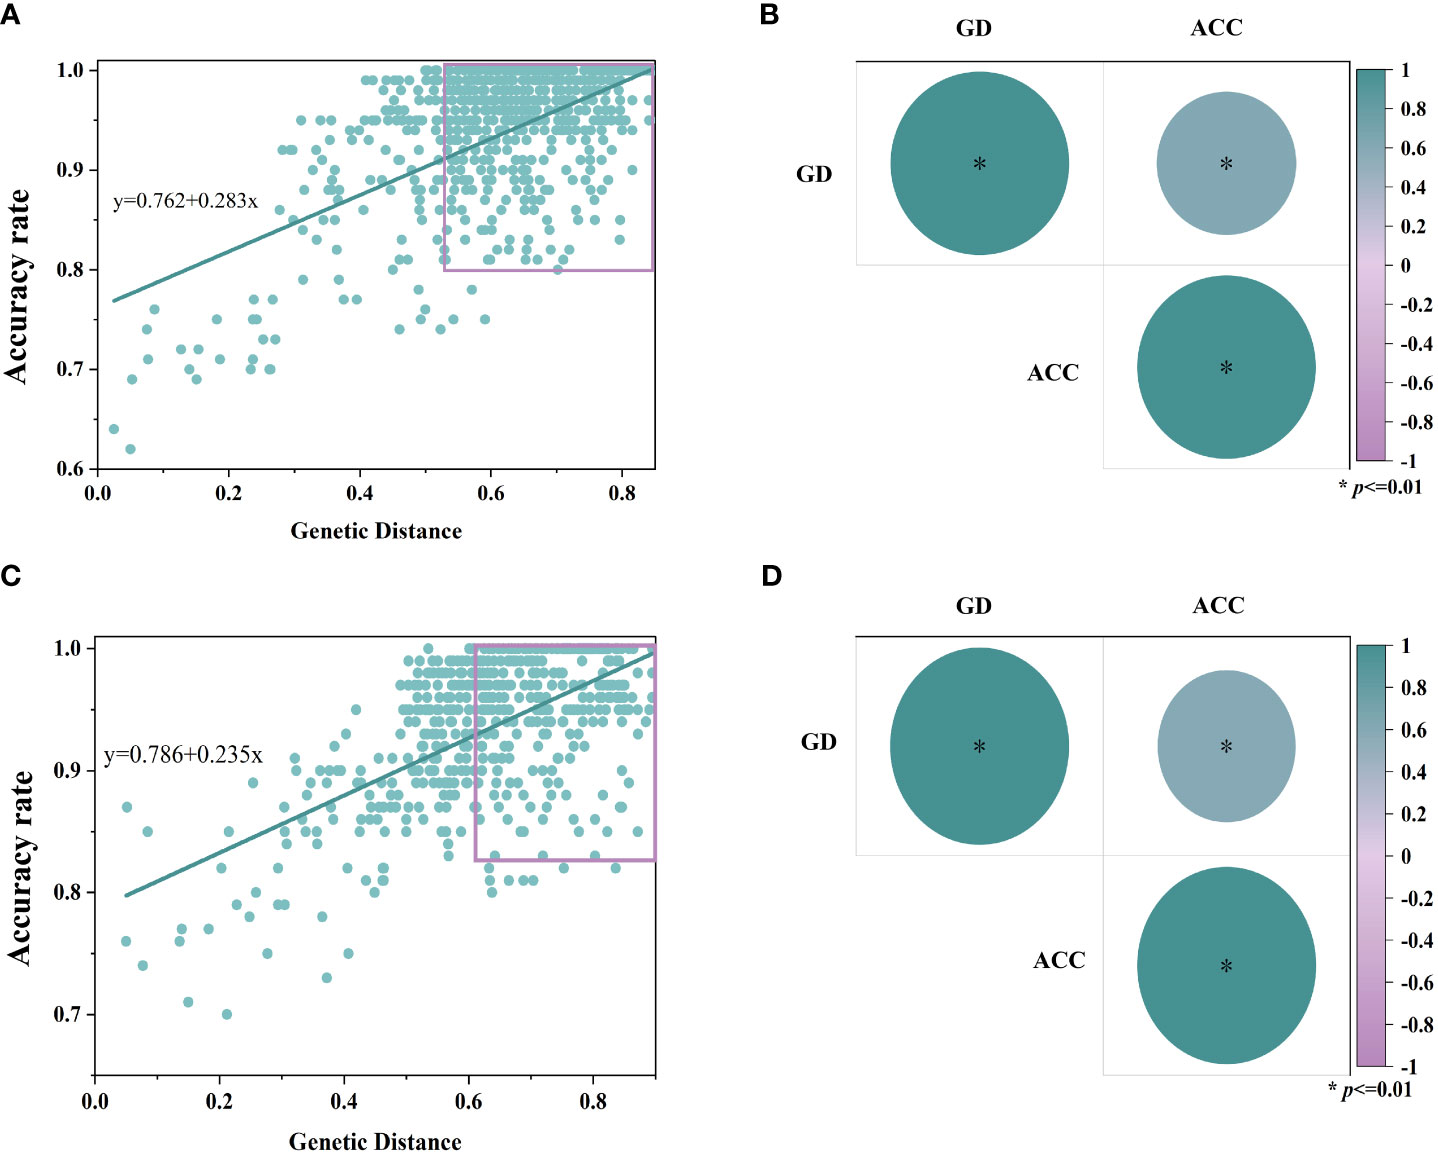
Figure 7 Results of simple linear correlation analysis of genetic distance between samples and accuracy rate of the model. Where (A, C) are linear regression fitting curves for inbred lines and hybrids, respectively, and (B, D) are bivariate Pearson test results for inbred lines and hybrids (p<0.01), respectively. (GD, genetic distance; ACC, accuracy rate).
The accuracy of the model increases gradually with the genetic distance in Figure 7. When the genetic distance is more than 0.4, the average accuracies of the inbred and hybrid discrimination models are 94.9% and 94.6%, respectively; when the genetic distance is more than 0.6, the average accuracies of the models increase to 95.9% and 95.8%, respectively. This reveals that there is positive correlation between the performance of the NIR spectral discrimination model and the genetic distance of the samples, with the nearer the genetic distance, the lower the accuracy of the model.
4 Discussion
Firstly, in this work, the spectral data of single kernel of maize samples were acquired by portable near-infrared spectrometer (900~1700nm), combined with SGD and SNV data preprocessing algorithms to establish SVM classification model, and the average accuracy of inbred and hybrid samples were 93.6% and 93.7%, respectively, which proved the feasibility of this technology in the field of seed authenticity detection (McVey et al., 2021). NIR spectroscopy has medium energy and strong transmission ability, and mainly responds to the vibrational information of atomic groups such as C-H, N-H, O-H, and so on (Bec et al., 2021). While the nutritional qualities such as crude protein, crude fat, crude starch and lysine content ranged from 8.18% to 12.64%, 3.41% to 4.77%, 71.44% to 77.67% and 0.238% to 0.42% with coefficients of variation of 0.10%, 0.08%, 0.02% and 0.12% among different samples, respectively. This variation is reflected in the NIR spectral information, which in turn leads to excellent model performance.
Secondly, the clustering analysis of the hybrid samples indicates that there are differences in the content of biological macromolecules among different groups. These differences may be caused by the genetic characteristics of the samples, because the influence of genetic characteristics on seed chemical components accounts for about 18% of the variation (Ferreira et al., 2014). We therefore analyzed the biomolecule content of the hybrids and found differences in crude protein, crude starch, crude fat and lysine content between the four groups of samples from the spectral clustering results, as shown in Figure 8. Previous studies on the identification of 25 maize materials through chemical composition and SSR markers showed that Mantel test results indicated a significant positive correlation between seed chemical composition and SSR molecular marker genetic distance (Sofy et al., 2020).
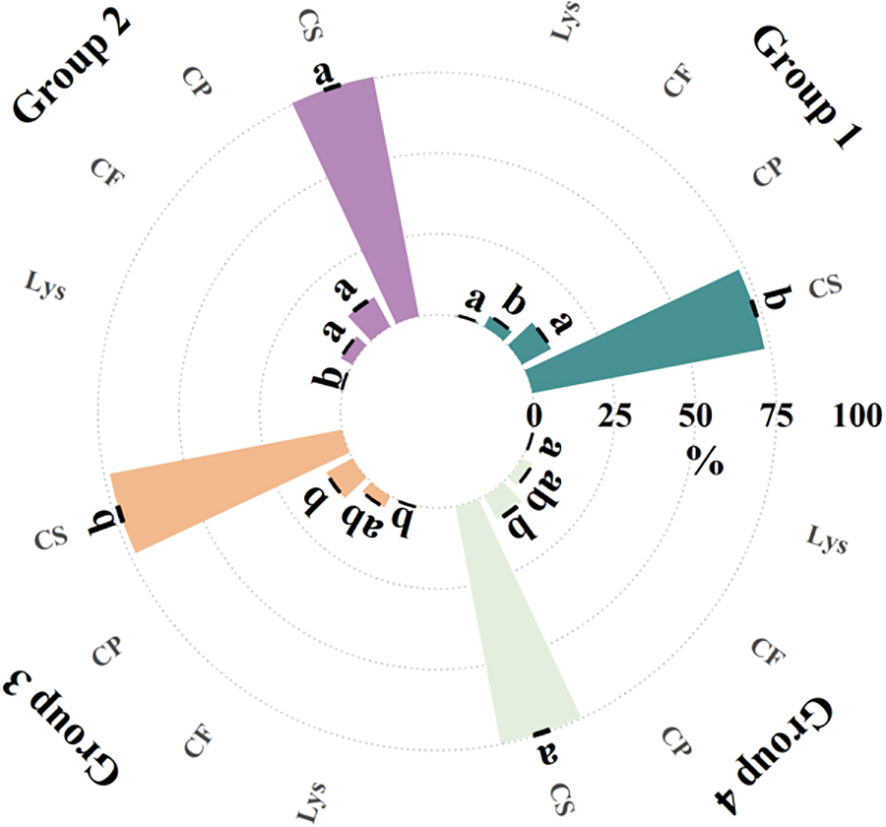
Figure 8 Biomolecule content of hybrid samples in different spectral clustering groupings. Different letters in the figure indicate significant differences in the same indicator at the p<0.05 level. (CP, crude protein; CS, crude starch; CF, crude fat; Lys, lysine).
Thirdly, this study found that as the genetic distance increased, the relative spectral distance also increased, along with the accuracy of the model. The researchers found some kind of possible connection between the genetic and relative spectral distances between the samples and the performance of the model, and suggested that the discriminatory performance of the model improved as the genetic distance increased (Liu et al., 2015). However, the above survey involved only five maize inbred materials, while 35 inbreds and 33 hybrids were selected for comparative validation in this work; moreover, portable spectrometers as well as single grain detection are more suitable for online application scenarios of massive quantities and meet the actual needs of production (Pu et al., 2021).
Finally, 5.72% and 6.06% of the two clustering outcomes in the inbreds and hybrids, respectively, differed in this study, which may be mainly due to the effect of the performance of the spectroscopic instruments themselves (Agelet and Hurburgh, 2014). Some of the characteristic bands reflecting the inclusions of the samples may be missing in the wavelength range of 900~1700 nm, i.e., in the long-wave NIR spectral region of 1700~2500 nm, 1923 nm and 2009 nm carry information on the combined frequency of the O-H group in water and starch, whereas 2125 nm and 2173 nm carry information on the diploid frequency of the N-H group in proteins (Ozaki et al., 2007).
This work assessed the applicability of portable near-infrared spectroscopy to identify the authenticity of single maize seeds. The seed samples selected covered both inbred lines and hybrids, which ensures that the technique can be used as a rapid and non-destructive tool for multiple scenarios of maize seed detection in the field, in warehouses, and online by a diverse group of people such as breeders, producers, and inspectors.
5 Conclusion
The application of NIR spectroscopy to detect the authenticity of crop seeds is not only affected by instrument parameters, preprocessing algorithms, modelling approaches, etc., but the seed genetic distance, as an indicator reflecting the genetic background among the samples, also affects the discrimination performance of the identification model. In this work, a portable near-infrared spectrometer was applied to systematically study for the first time the relationship between genetic distance, relative spectral distance and model performance. In addition, the genetic clustering results performed consistently with the spectral clustering results. NIR spectroscopy can well reflect the genetic relationship between corn seeds. The calculation of relative spectral distance is faster than molecular marker detection methods, and it has lower requirements for operators than establishing classification models. Therefore, in the future, it can be achieved to quickly identify the genetic background of single seeds using spectral information of the samples, effectively shortening the time limit of crop breeding. This discovery brings good news to breeders and seed producers. In summary, NIR spectroscopy is of great value to modern crop breeding, variety identity, and purity sorting as an assistant means of genetic breeding.
Data availability statement
The original contributions presented in the study are included in the article/supplementary material. Further inquiries can be directed to the corresponding author.
Author contributions
YQY: Data curation, Formal analysis, Software, Writing – original draft, Writing – review & editing. RH: Writing – original draft. DZ: Methodology, Writing – review & editing. BS: Formal analysis, Methodology, Writing – original draft. YLY: Funding acquisition, Writing – original draft. DK: Conceptualization, Funding acquisition, Project administration, Software, Supervision, Writing – review & editing.
Funding
The author(s) declare financial support was received for the research, authorship, and/or publication of this article. We would like to thank the Ministry of Science and Technology of the People’s Republic of China for the support of the Special Project on Near Infrared Spectroscopy Rapid Detection Technology for Quantitative Analysis of Crop Breeding and Seed Quality Inspection (No. 2014YQ470377) and on Research on Theory and Technology of Corn Seed Inspection and Testing (No. 2017YFD0102000).
Acknowledgments
We would like to acknowledge the platform support provided by MOE Key Laboratory of Crop Heterosis and Utilization and the Beijing Key Laboratory of Maize DNA Fingerprinting and Molecular Breeding of BAAFS.
Conflict of interest
The authors declare that the research was conducted in the absence of any commercial or financial relationships that could be construed as a potential conflict of interest.
Publisher’s note
All claims expressed in this article are solely those of the authors and do not necessarily represent those of their affiliated organizations, or those of the publisher, the editors and the reviewers. Any product that may be evaluated in this article, or claim that may be made by its manufacturer, is not guaranteed or endorsed by the publisher.
References
Agelet, L. E., Hurburgh, C. R. (2014). Limitations and current applications of Near Infrared Spectroscopy for single seed analysis. Talanta 121, 288–299. doi: 10.1016/j.talanta.2013.12.038
Alves, J. C. L., Poppi, R. J. (2013). Biodiesel content determination in diesel fuel blends using near infrared (NIR) spectroscopy and support vector machines (SVM). Talanta 104, 155–161. doi: 10.1016/j.talanta.2012.11.033
Bec, K. B., Grabska, J., Huck, C. W. (2021). Principles and applications of miniaturized near-infrared (NIR) spectrometers. Chemistry-a Eur. J. 27, 1514–1532. doi: 10.1002/chem.202002838
Devos, O., Ruckebusch, C., Durand, A., Duponchel, L., Huvenne, J. P. (2009). Support vector machines (SVM) in near infrared (NIR) spectroscopy: Focus on parameters optimization and model interpretation. Chemometrics Intelligent Lab. Syst. 96, 27–33. doi: 10.1016/j.chemolab.2008.11.005
ElMasry, G., Mandour, N., Wagner, M. H., Demilly, D., Verdier, J., Belin, E., et al. (2019). Utilization of computer vision and multispectral imaging techniques for classification of cowpea (Vigna unguiculata) seeds. Plant Methods 15, 1–16. doi: 10.1186/s13007-019-0411-2
Ertiro, B. T., Ogugo, V., Worku, M., Das, B., Olsen, M., Labuschagne, M., et al. (2015). Comparison of Kompetitive Allele Specific PCR (KASP) and genotyping by sequencing (GBS) for quality control analysis in maize. BMC Genomics 16, 12. doi: 10.1186/s12864-015-2180-2
Fabiyi, S. D., Vu, H., Tachtatzis, C., Murray, P., Harle, D., Dao, T. K., et al. (2019). Comparative study of PCA and LDA for rice seeds quality inspection. 2019 IEEE Africon 50 (1), 1–4. doi: 10.1109/AFRICON46755.2019.9134059
Ferreira, D. S., Galao, O. F., Pallone, J. A. L., Poppi, R. J. (2014). Comparison and application of near-infrared (NIR) and mid-infrared (MIR) spectroscopy for determination of quality parameters in soybean samples. Food Control 35, 227–232. doi: 10.1016/j.foodcont.2013.07.010
Frascaroli, E., Cane, M. A., Landi, P., Pea, G., GianFranceschi, L., Villa, M., et al. (2007). Classical genetic and quantitative trait loci analyses of heterosis in a maize hybrid between two elite inbred lines. Genetics 176, 625–644. doi: 10.1534/genetics.106.064493
Kavdir, I., Buyukcan, M. B., Lu, R. F., Kocabiyik, H., Seker, M. (2009). Prediction of olive quality using FT-NIR spectroscopy in reflectance and transmittance modes. Biosyst. Eng. 103, 304–312. doi: 10.1016/j.biosystemseng.2009.04.014
Kennett, D. J., Prufer, K. M., Culleton, B. J., George, R. J., Robinson, M., Trask, W. R., et al. (2020). Early isotopic evidence for maize as a staple grain in the Americas. Sci. Adv. 6, eaba3245. doi: 10.1126/sciadv.aba3245
Lanjewar, M. G., Morajkar, P. P., Parab, J. S. (2023). Hybrid method for accurate starch estimation in adulterated turmeric using Vis-NIR spectroscopy. Food Additives Contaminants Part a-Chemistry Anal. Control Exposure Risk Assess. 40, 1131–1146. doi: 10.1080/19440049.2023.2241557
Li, T. X., Jia, S. Q., Liu, X., Zhao, S. Y., Ran, H., Yan, Y. L., et al. (2015). Maize hybrid seed purity identification based on near infrared reflectance (NIR) and transmittance (NIT) spectra. Spectrosc. Spectral Anal. 35, 3388–3392. doi: 10.3964/j.issn.1000-0593(2015)12-3388-05
Liu, S. R., Yang, Y., Tian, H. L., Yi, H. M., Wang, Kang, D. M., et al. (2021). Genetic diversity analysis of silage corn varieties based on agronomic andquality traits and SSR markers. Acta Agronomica Sin. 47, 2362–2370. doi: 10.3724/SP.J.1006.2021.03074
Liu, X., Jia, S. Q., Wang, C. Y., Liu, Z., Gu, J. C., Zhai, W., et al. (2015). A study of the relationship among genetic distances, NIR spectra distances, and NIR-based identification model performance of the seeds of maize inbred lines. Spectrosc. Spectral Anal. 35, 2510–2515. doi: 10.3964/j.issn.1000-0593(2015)09-2510-06
McVey, C., Gordon, U., Haughey, S. A., Elliott, C. T. (2021). Assessment of the analytical performance of three near-infrared spectroscopy instruments (Benchtop, handheld and portable) through the investigation of coriander seed authenticity. Foods 10, 956. doi: 10.3390/foods10050956
Nei, M., Li, W. H. (1979). Mathematical-model for studying genetic-variation in terms of restriction endonucleases. Proc. Natl. Acad. Sci. U.S.A. 76, 5269–5273. doi: 10.1073/pnas.76.10.5269
Osborne, B. G., Fearn, T. (1986). Near infrared spectroscopy in food analysis (Harlow, Essex, EnglandNew York: Longman Scientific & Technical ;Wiley).
Ozaki, Y., McClure, W. F., Christy, A. A. (2007). Near-infrared spectroscopy in food science and technology. Ed. Hoboken, N. J. (John Wiley & Sons, Inc.).
Pu, Y., Perez-Marin, D., O'Shea, N., Garrido-Varo, A. (2021). Recent advances in portable and handheld NIR spectrometers and applications in milk, cheese and dairy powders. Foods 10, 2377. doi: 10.3390/foods10102377
Saitou, N., Nei, M. (1987). The neighbor-joining method - a new method for reconstructing phylogenetic trees. Mol. Biol. Evol. 4 (4), 406–425. doi: 10.1093/oxfordjournals.molbev.a040454
Sofy, S. O., Hamakareem, H. F., Abdulla, S. M. S., Ahmad, K. R., Abdulla, A. S., Omer, D. A., et al. (2020). Exploring chemical composition and genetic dissimilarities between maize accessions. Maydica 65, 1–9.
Teye, E., Amuah, C. L. Y., McGrath, T., Elliott, C. (2019). Innovative and rapid analysis for rice authenticity using hand-held NIR spectrometry and chemometrics. Spectrochimica Acta Part a-Molecular Biomolecular Spectrosc. 217, 147–154. doi: 10.1016/j.saa.2019.03.085
Wang, F. G., Tian, H. L., Zhao, J. R., Yi, H. M., Wang, L., Song, W. (2011). Development and characterization of a core set of SSR markers for fingerprinting analysis of Chinese maize varieties. Maydica 56, 7–17. doi: 10.1016/B978-0-12-385851-1.00015-9
Wang, F. G., Yang, Y., Yi, H. M., Zhao, J. R., Ren, J., Wang, L., et al. (2017). Construction of an SSR-based standard fingerprint database for corn variety authorized in China. Scinetia Agricultura Sin. 50, 1–14. doi: 10.3864/j.issn.0578-1752.2017.01.001
Wu, J. Z., Li, H., Zhang, H. D., Mao, W. H., Liu, C. L., Sun, X. R. (2019). Nondestructive determination of natural aging stage of wheat seeds using near infrared spectroscopy. Spectrosc. Spectral Anal. 39, 751–755. doi: 10.3964/j.issn.1000-0593(2019)03-0751-05
Wynn, M., Kidwell, K. M., Merajver, S. D. (2016). The impact of nathan mantel's "The detection of disease clustering and a generalized regression approach". Cancer Res. 76, 2495–2496. doi: 10.1158/0008-5472.Can-16-0883
Zhang, J., Mouazen, A. M. (2023). A novel non-integer order Savitzky-Golay derivative function of visible and near-infrared spectra for improving prediction accuracy of phosphorus in pig manure. Chemometrics Intelligent Lab. Syst. 240, 1701–1710. doi: 10.1016/j.chemolab.2023.104917
Zhao, J. R., Wang, R. H. (2013). Development process problem and countermeasure of maize production in China. J. Agric. Sci. Technol. 15, 1–6. doi: 10.3969/j.issn.1008-0864.2013.03.01doi: 10.3969/j.issn.1008-0864.2013.03.01
Keywords: NIR spectroscopy, maize, seed, authenticity identification, genetic distance
Citation: Yang Y, Harrison RC, Zhang D, Shen B, Yan Y and Kang D (2024) Effect of genetic distances of different genotypes of maize on the authenticity of single seeds detected by NIR spectroscopy. Front. Plant Sci. 15:1361328. doi: 10.3389/fpls.2024.1361328
Received: 25 December 2023; Accepted: 12 February 2024;
Published: 29 February 2024.
Edited by:
Vignesh Muthusamy, Indian Agricultural Research Institute (ICAR), IndiaReviewed by:
Ravi V. Mural, South Dakota State University, United StatesRama Prashat G, Indian Agricultural Research Institute (ICAR), India
Copyright © 2024 Yang, Harrison, Zhang, Shen, Yan and Kang. This is an open-access article distributed under the terms of the Creative Commons Attribution License (CC BY). The use, distribution or reproduction in other forums is permitted, provided the original author(s) and the copyright owner(s) are credited and that the original publication in this journal is cited, in accordance with accepted academic practice. No use, distribution or reproduction is permitted which does not comply with these terms.
*Correspondence: Dingming Kang, a2RtQGNhdS5lZHUuY24=