
94% of researchers rate our articles as excellent or good
Learn more about the work of our research integrity team to safeguard the quality of each article we publish.
Find out more
ORIGINAL RESEARCH article
Front. Plant Sci. , 27 September 2023
Sec. Plant Physiology
Volume 14 - 2023 | https://doi.org/10.3389/fpls.2023.1253976
This article is part of the Research Topic Genetic Manipulation and Natural Variation of Stomata-Related Traits to Improve Water Use Efficiency View all 3 articles
 Emmanuel L. Bernardo1,2
 Cristina Rodrigues Gabriel Sales1
 Lucía Arce Cubas1
 Richard L. Vath1
 Johannes Kromdijk1,3*
Introduction: C4 photosynthesis is an adaptation that has independently evolved at least 66 times in angiosperms. C4 plants, unlike their C3 ancestral, have a carbon concentrating mechanism which suppresses photorespiration, often resulting in faster photosynthetic rates, higher yields, and enhanced water use efficiency. Moreover, the presence of C4 photosynthesis greatly alters the relation between CO2 assimilation and stomatal conductance. Previous papers have suggested that the adjustment involves a decrease in stomatal density. Here, we tested if C4 species also have differing stomatal responses to environmental cues, to accommodate the modified CO2 assimilation patterns compared to C3 species.
Methods: To test this hypothesis, stomatal responses to blue and red-light were analysed in three phylogenetically linked pairs of C3 and C4 species from the Cleomaceae (Gynandropsis and Tarenaya), Flaveria, and Alloteropsis, that use either C3 or C4 photosynthesis.
Results: The results showed strongly decreased stomatal sensitivity to blue light in C4 dicots, compared to their C3 counterparts, which exhibited significant blue light responses. In contrast, in C3 and C4 subspecies of the monocot A. semialata, the blue light response was observed regardless of photosynthetic type. Further, the quantitative red-light response varied across species, but the presence or absence of a significant stomatal red-light response was not directly associated with differences in photosynthetic pathway. Interestingly, stomatal density and morphology patterns observed across the three comparisons were also not consistent with patterns commonly asserted for C3 and C4 species.
Discussion: The strongly diminished blue-light sensitivity of stomatal responses in C4 species across two of the comparisons suggests a common C4 feature that may have functional implications. Altogether, the strong prevalence of species-specific effects clearly emphasizes the importance of phylogenetic controls in comparisons between C3 and C4 photosynthetic pathways.
Efficient coordination of carbon gain versus water loss by stomata is achieved by a range of responses to environmental factors, most notably light and CO2. Light stimulates stomatal opening via at least two distinct signaling pathways with contrasting action spectra (Shimazaki et al., 2007), which are either perceived directly in the guard cells (GCs) or indirectly via signals derived from the underlying mesophyll (Mott, 2009; Lawson et al., 2014).
Blue light (BL) is a potent signal for stomatal opening, and GCs contain all the components required for the blue light signaling pathway (Shimazaki et al., 2007; Suetsugu et al., 2014). Blue light activates rapid stomatal opening via a pathway that is independent of photosynthesis and saturates at relatively low fluence rates. Blue light triggers the autophosphorylation of phototropins, PHOT1 and PHOT2 via their substrate BLUS1 (BLUE LIGHT SIGNALING 1) (Inoue et al., 2008; Takemiya et al., 2013). This sequentially triggers the activation of plasma membrane H+ ATPase pump, which hyperpolarizes the plasma membrane, leading to the uptake of K+ through inward-rectifying channels. The accumulation of K+ and other solutes drives the influx of water into the GCs and the resulting turgor change leads to stomatal opening (Shimazaki et al., 2007).
Illumination with red light (or photosynthetically active wavelengths other than blue) also triggers stomatal opening but the quantum efficiency to stimulate opening is typically lower than blue light. An indirect effect of red light that is tied to intercellular CO2 (Ci) is triggered by high (red) light through mesophyll photosynthesis, which reduces Ci, and consequently affects gs. However, this feedback loop does not appear to be the only mesophyll-derived signal perceived by stomata. A significant response to red light was still observed in experiments where Ci was kept constant (Messinger et al., 2006). In addition, epidermal peel experiments revealed that GC responses to red light are reversibly altered by the presence of the underlying mesophyll tissue. Thus, an additional link between mesophyll photosynthesis and guard cell responses may exist (Lawson et al., 2014). The identity of the mesophyll signal however remains unresolved.
Plants with C4 photosynthesis are distinct from C3 plants in anatomy and biochemistry. C4 operates a CO2-concentrating mechanism (CCM) between two morphologically different cell types, bundle sheath cells (BSC) and mesophyll (M) cells (Sage, 2004). Having a CCM alters the relationship of photosynthesis with CO2 in C4 species which confers them a photosynthetic advantage over C3 species under saturating light conditions and hot environments (Bowyer and Leegood, 1997). In these environments, C4 species typically display higher intrinsic water use efficiency and net assimilation rates (Sage, 2004) compared to C3 species (Lambers and Oliveira, 2019). It can therefore be argued that differential stomatal regulation is required to optimize photosynthetic capacity and water use efficiency between C3 and C4 species. And that the mesophyll signal argued above may be different between C3 and C4 species. However, not much is known about stomatal sensitivities with regard to photosynthetic types under various light and CO2 environments.
Comparisons between C4 and C3 species can easily be confounded by phylogenetic distance between the species, which would lead to differences not necessarily associated with the photosynthetic pathway (Monson, 1996; Taylor et al., 2010). For instance, contrasting blue light responses in C3 and C4 were observed in crop species (Zhen and Bugbee, 2020), but the findings could not be directly linked to photosynthetic type alone because the species examined were separated by considerable phylogenetic distance. Closely related species or even subspecies with differing photosynthetic pathways offer a way around this issue, allowing a comparison between photosynthetic types while controlling for evolutionary distance (Monson, 1996; Huxman and Monson, 2003).
In this study, blue and red-light stomatal responses were studied in three phylogenetically-controlled experiments, using closely related species from the Cleomaceae (Gynandropsis and Tarenaya), Flaveria, and Alloteropsis, that use either C3 or C4 photosynthesis. The results show a striking lack of sensitivity to blue light in the C4s Gynandropsis gynandra, and F. trinervia and F. bidentis, compared to their C3 counterparts Tarenaya hassleriana, and F. cronquistii and F. robusta, which exhibited significant blue light responses. In contrast, in A. semialata, the blue light response was observed regardless of photosynthetic type. The quantitative red-light response varied between species, however the presence or absence of a significant stomatal red-light response was not related to differences in photosynthetic pathway.
Stomatal responses were compared across closely related C3 and C4 species from the Cleomaceae (Cleomaceae), Asteraceae (Flaveria), and Poaceae (Alloteropsis), with considerable phylogenetic distance separating each of the controlled comparisons. From the genus Cleomaceae, Tarenaya hassleriana (C3) was compared with Gynandropsis gynandra (C4, NAD-ME subtype). Seeds of C3 T. hassleriana (Cleomaceae) were obtained from Prof. Julian Hibberd’s group (Cambridge, UK). From the genus Flaveria, F. trinervia and F. bidentis (C4-NADP-ME) were initially compared with Flaveria pringlei as the C3 representative. However, the F pringlei accession that most manuscripts have described and was used here, likely has seen some hybridization with Flaveria angustifolia in its history, which is a C3-C4 intermediate. We therefore decided to do a second set of experiments using F. cronquistii and F.robusta as ‘true’ C3 species in addition to the three aforementioned species. Seeds of F. bidentis, F. trinervia, and F. pringlei were a kind gift from Dr. Peter Westhoff (University of Dusseldorf, Germany). Clonal plants of F. cronquistii and F.robusta were a gift from Dr. Marjorie Lundgren (Lancaster University, UK) and Prof. Julian Hibberd (Cambridge University, UK), respectively. Finally, from the genus Alloteropsis, A. semialata subsp. eckloniana GMT (C3) and A. semialata subsp. semialata MDG and MAJ (both C4, mixed NADP-ME-PEPCK subtypes) were a gift from Prof. Pascal-Antoine Christin (University of Sheffield, UK).
Individual seedlings of G. gynandra and T. hassleriana were grown from seeds and transferred in 10 cm H x 9 cm L x 9 cm W plastic pots with M3 compost (Levington®, Scotts, Ipswich, UK). Seeds of C4 F. bidentis, C4 F. trinervia, and C3-like F. pringlei were also germinated on M3 compost. The seedlings and clonal plants of C3 F. cronquistii and C3 F.robusta propagated from cuttings were grown in 10 cm H x 9 cm L x 9 cm W plastic pots containing M3 compost.
The Cleomaceae and Flaveria species were grown in an environmentally-controlled growth room at the Plant Growth Facility (PGF), Department of Plant Sciences, University of Cambridge. Photoperiod was kept at 16 hours (6:00 to 22:00) of light supplied by fluorescent lamps with a photosynthetic photon flux density (PPFD) of 300 µmol m-2 s-1. The growth room was maintained at day and night temperatures of 20°C and 60% RH at ambient CO2.
The Alloteropsis accessions were grown at the Cambridge Botanic Gardens Glasshouse. Plants were vegetatively propagated to contain 2-3 tillers per 1 L pots filled with 4:1 M3 compost: coarse vermiculite and 5 g controlled-release fertilizer (Osmocote®, Scotts Miracle-Gro Company, Marysville, OH, USA). Supplemental light from sodium halide lamps (140-160 W m-2) was provided from 4:00 to 20:00. Greenhouse set point temperature was at 18°C, while nighttime temperatures were at 15°C. CO2 and RH were at ambient.
An open gas exchange system (LI-6400XT, LI-COR, Lincoln, NE, USA) with an integrated fluorometer and light source (LI-6400-40, LI-COR) was used to measure stomatal conductance (gs) and CO2 assimilation rate (A) at a range of different conditions as specified below.
All gas exchange data were collected from the youngest expanded leaf from plants with 4-5 sets of mature leaves.
To characterize stomatal responses to blue light, a series of switchover protocols were designed comprising sequential changes between 100% red (R) and 75% red + 25% blue light (RB), while keeping the total PPFD equal. Peak wavelengths for R and B lights in the LI-6400XT instruments are 635 and 465 nm, respectively. In Sequence R→RB→R, leaves were first acclimated to steady-state under 100% red light, and then switched to 75% red and 25% blue light, and then back to the original light environment of 100% red light. In some cases the complementary switchover experiment RB→R→RB was performed, and in this case, leaves were first acclimated to steady-state under 75% red and 25% blue light. 500 µmol m-2 s-1 PPFD was maintained throughout the time course for this experiment. The choice for 75% red + 25% blue was based on the fact that 125 µmol m-2 s-1 is sufficient to saturate the stomatal blue light response, and red background light is often found to enhance the blue light response. Each switchover experiment was initiated when steady state was reached (typically after 2 h). Gas exchange measurements were logged every 60 s throughout the protocol. After logging the first 5 min (in Cleomaceae and Alloteropsis) and 10 min (in Flaveria) of the steady state condition, the light composition was switched to either red or red+blue, followed finally by a switch back to the initial light composition. During each phase gas exchange parameters were logged for 60 mins (in the Cleomaceae and Alloteropsis) and 50 mins (in Flaveria). Thus, for each measurement series, 125 mins were recorded for Cleomaceae and Alloteropsis subspecies and 100 mins for Flaveria. The initial experiment in Flaveria was performed using C3-like F. pringlei, C4 F. trinervia and C4 F. bidentis. However, because C3-like F. pringlei has proto-Kranz (Sage, 2016), it is not considered a canonical C3. Therefore, a repeat experiment in Flaveria was performed to include two true C3 species, F. cronquistii and F. robusta. For this experiment, only sequence R→RB→R was repeated, since the previous experiments had shown that both sequences yielded very similar results. Reference CO2 during the experiment was controlled at 400 µmol mol-1, block temperature was kept at 25°C and average VPD was ca. 1.2 kPa. All measurements were taken between 10:00 and 16:00 h.
To characterize the red-light response of stomatal conductance, the protocol by Messinger et al. (2006) was adopted. This protocol measures the stomatal response to red light, while controlling for the potentially confounding effect of the stomatal CO2 response by maintaining a constant intercellular CO2 concentration (Ci) at each light intensity. Briefly, the Messinger protocol involved illuminating the leaf segment clamped inside the cuvette with 800 µmol m-2 s-1 red-light to steady state. Subsequently, the PPFD was lowered step-wise from 800, 600, 400, and 200 µmol m-2 s-1, each change was initiated once steady state of stomatal conductance was achieved. As A and gs changed in response to the new light environment, CO2 was manually adjusted using the mixer millivolt signal to keep Ci at the value observed at 800 µmol m-2 s-1.
Epidermal imprints from all species, except for Flaveria trinervia, were taken from adaxial and abaxial layers using clear nail varnish (Rimmel, London) using the same leaves used for gas exchange measurements. Dried nail varnish was lifted from the leaf using sticky tape (Sellotape) and affixed onto glass slides. Images were captured using a Nikon microscope (Olympus BX41, Japan) fitted with a CCD camera (U-TV0.5zc- 3/Micropublisher 3.3 RTV, Olympus, Japan) and installed with Q-Capture Pro 7 imaging software. Total magnifications of x200 and x400 (Olympus WHB 10x/20 eyepiece x Olympus PN 20x/0.40 or PCN 60x/0.80 objectives) were used for stomatal density counting and investigation of stomatal anatomical parameters, respectively, unless stated otherwise. For Flaveria trinervia the quality of nail varnish impressions was not sufficient to collect stomatal anatomical parameters, data were instead collected from epidermal peels, using the same microscopy set up with a total magnification of x400. Therefore, these data were not from the same leaf as was used for gas exchange but instead were taken from other leaves at the same developmental stage.
To assess stomatal size (SS), guard cell width (GCW) and guard cell length (GCL) were measured using FiJi software (Schindelin et al., 2012). SS was calculated using the formula for the area of an ellipse. Stomatal density (SD) was calculated as the number of stomata per unit area (mm-2). A stoma was counted if >50% was located within the field of view. Four random microscopic fields of view each from the abaxial and adaxial surfaces were collected from 3-5 biological replicates, giving >350 stomata per species, except C3 F. cronquistii and C4 F. trinervia.
For the red and red+blue light switchover experiments, pairs of C3 and C4 species were measured in parallel between 10:00 and 16:00 h to control for the effect of circadian rhythms on stomatal conductance. Each phylogenetically-controlled comparison was an independent experiment. To estimate the impact of light on stomatal conductance resulting from the shift from one light environment to the next, a linear mixed-effects model was used. Light was the within-subject factor and species was the between-subject factor. Biological replicates were treated as random variables. To carry out the analysis, gs and A at the introduction or removal of blue light (t = 5 min and t =65 min, R→BR→R) or the reverse (t = 5 and t = 65, BR→R→BR), and the final gs at t = 125 min were extracted from the gas exchange time series. Planned contrasts were used to compare independent group means. Linear mixed-effects model was also fitted to the red-light response data set. Red-light PPFD and species were assigned as within- and between-subject variables, respectively, while individual biological replicates were treated as random variables. For every genus, the density of stomata on the abaxial and adaxial surfaces was analyzed using a two-way ANOVA, and planned contrasts were used to compare group means. Data on stomatal size were also analysed using ANOVA and post-hoc comparisons were carried out using Tukey’s HSD at an α=0.05. The statistical tests were carried out using R, version 4.2.1 (R Core Team, 2023) and RStudio, version 2023.6.0.421 (Posit Team, 2023) and JMP Pro 17 (SAS Institute). Graphs were plotted using R, version 4.2.1 and RStudio, version 2022.07.1 and the ggplot2 package (Wickham, 2016). Figures were compiled using the ggpubr package (Kassambara, 2023).
To compare the sensitivity of stomatal opening to blue light relative to red light of equal intensity between C3 and C4 species, gas exchange was measured in response to a sequence of 75% red:25% blue (RB) light to 100% red (R) with a total PAR of 500 µmol photons m-2 s-1 as well as the reverse sequence. Following steady state gs of 0.49 mol H2O m-2 s-1 at R light, gs in the C3 species T. hassleriana increased gradually to 0.64 mol H2O m-2 s-1 upon shifting to RB light and the effect was rapidly reversed when the light was returned to R (Figure 1A and Table S1). Similarly, when moving from RB→R in the reverse sequence, C3 T. hassleriana rapidly declined from 0.38 to 0.20 mol H2O m-2 s-1, and gradually increased again by the switch from R→RB over the course of an hour (Figure 1B and Table S2). In contrast, no effects of the R→RB→R sequence, nor the reverse RB→R→RB sequence were observed on gs in the C4 species G. gynandra, which remained invariable at 0.19 mol H2O m-2 s-1 (Figures 1C, D; Tables S1 and S2). It is also worth noting that the strong stomatal movements in C3 T. hassleriana did not correspond to parallel responses in A (Figures S1A, B; Tables S3 and S4), which instead was not significantly impacted by the changes in light composition in either of the Cleomaceae species (Figures S1C, D; Tables S1-S4).
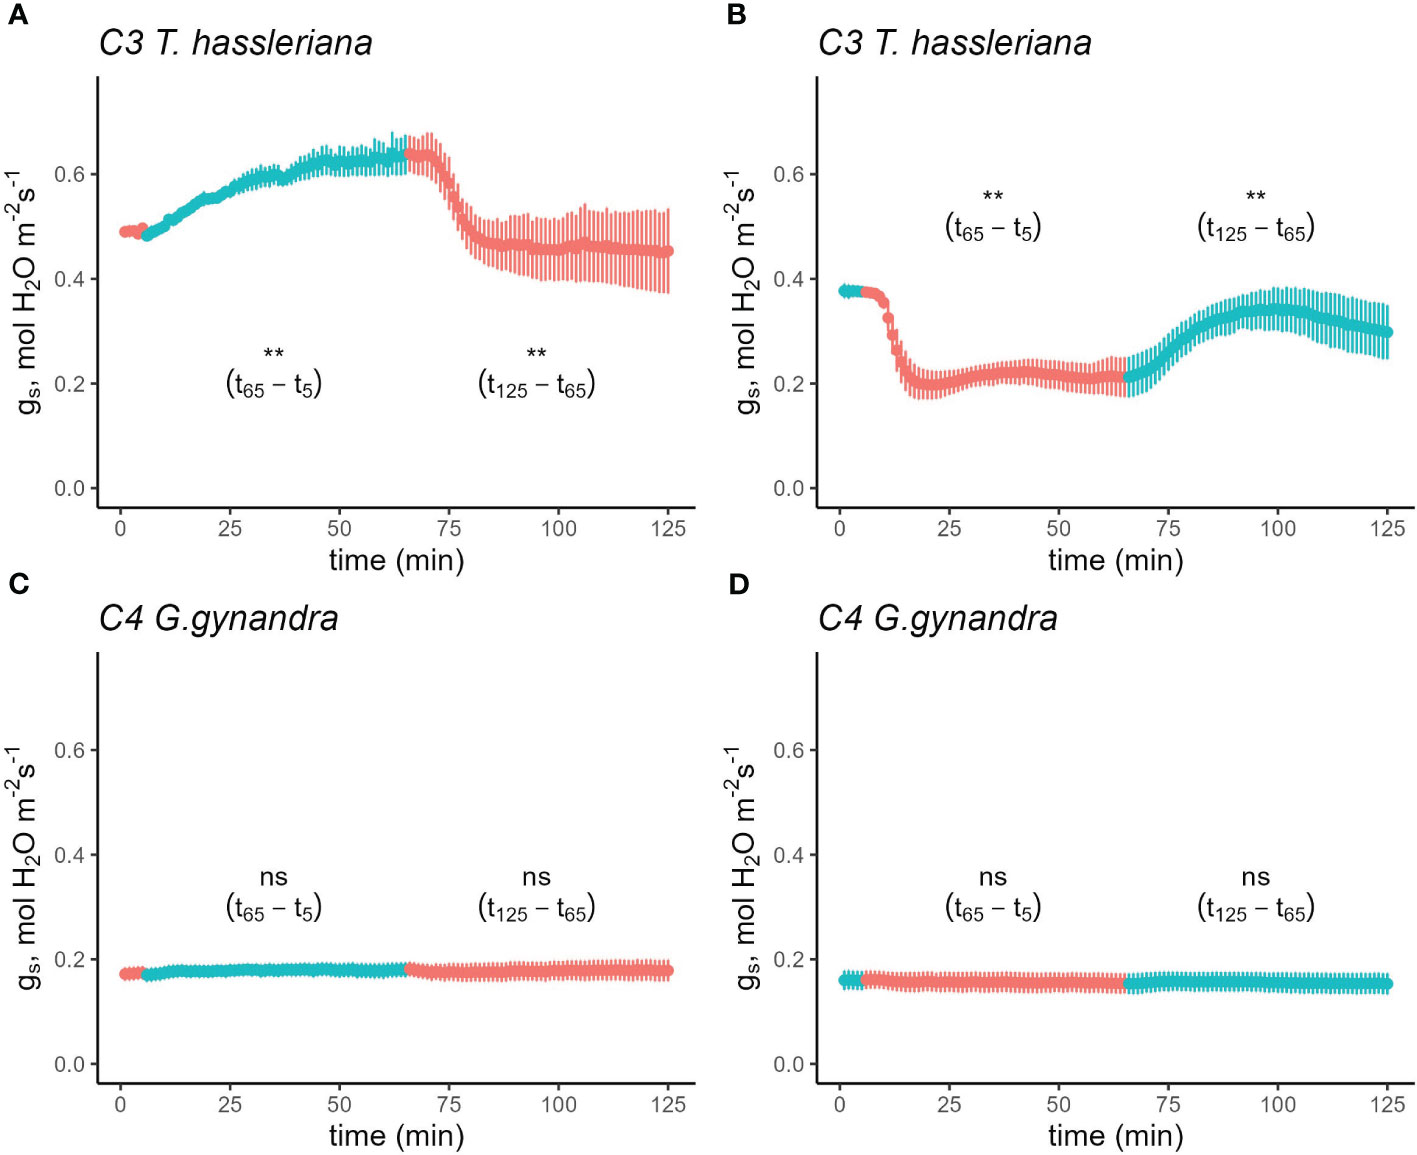
Figure 1 Time course of stomatal conductance (gs) response in C3 T. hassleriana (A, B) and C4 G. gynandra (C, D) in response to a sequence of 75% red + 25% blue light and vice versa. Leaves were initially acclimated in either 100% red (A, C) or 75% red+25% blue light (B, D) until steady-state was achieved (time = 0 in the figure). Subsequently, the light environment was switched depending on the initial light condition while maintaining a photosynthetic photon flux density of 500 µmol m-2 s-1. Subsequently, the leaves were acclimated to the new light condition for 1 h before returning it back to the original condition. Light conditions were reversed at t6 and t65. Reference CO2 was maintained at 400 µmol mol-1, block temperature was kept at 25°C and average VPD was 1.2 kPa. Data points represent mean ± se (n=4-5).
To find out if these differences between C3 and C4 Cleomaceae species were representative of general differences in stomatal responses between photosynthetic pathways, the R→RB→R sequence was also performed on Flaveria, another genus which contains C3, C3-C4, and C4 species. The differences in blue light response between C3 and C4 species were also present in Flaveria (Figure S2 and Tables S5 and S6). However, to account for the fact that the first set of Flaveria experiments used the proto-Kranz C3-like species F. pringlei as the C3 representative, the experiment was repeated to include two other C3 Flaveria species, F. robusta and F. cronquistii. Since the complementary sequence RB→R→RB yielded the same results as the R→RB→R sequence, only the latter R→RB→R sequence was repeated (Figure 2) on two C3 species, F. robusta (Figure 2A) and F. cronquistii (Figure 2B), as well as the two C4 species, F. trinervia (Figure 2C) and F. bidentis (Figure 2D) and C3-like F. pringlei (Figure 2E). After reaching steady state in R, gs increased significantly from 0.22 mol H2O m-2 s-1 to 0.28 (Figure 2A) mol H2O m-2 s-1 in F. robusta upon the switch to RB and from 0.30 mol H2O m-2 s-1 to 0.36 mol H2O m-2 s-1 in C3 F. cronquistii (Figure 2B). On the other hand, gs in C4 F. trinervia showed only a slight increase from 0.11 mol H2O m-2 s-1 to 0.13 mol H2O m-2 s-1 under RB light (Figure 2C), and similarly gs in C4 F. bidentis remained unchanged at 0.13 mol H2O m-2 s-1 (Figure 2D). Finally, in C3-like F. pringlei, from an initial gs of 0.16 mol H2O m-2 s-1 it rose to 0.19 mol H2O m-2 s-1 under BR (Figure 2E). Further, the stimulating effects on gs of the R→RB switch in the C3 and C3-like species were largely reversed by the switch back to R light, but again gs remained unaffected in the C4 species (Table S7). The light composition switches marginally, but significantly affected the rate of net CO2 assimilation among the five species with slight lower rates of A under the RB part of the experiment (Figure S3 and Table S8, p=0.0122).
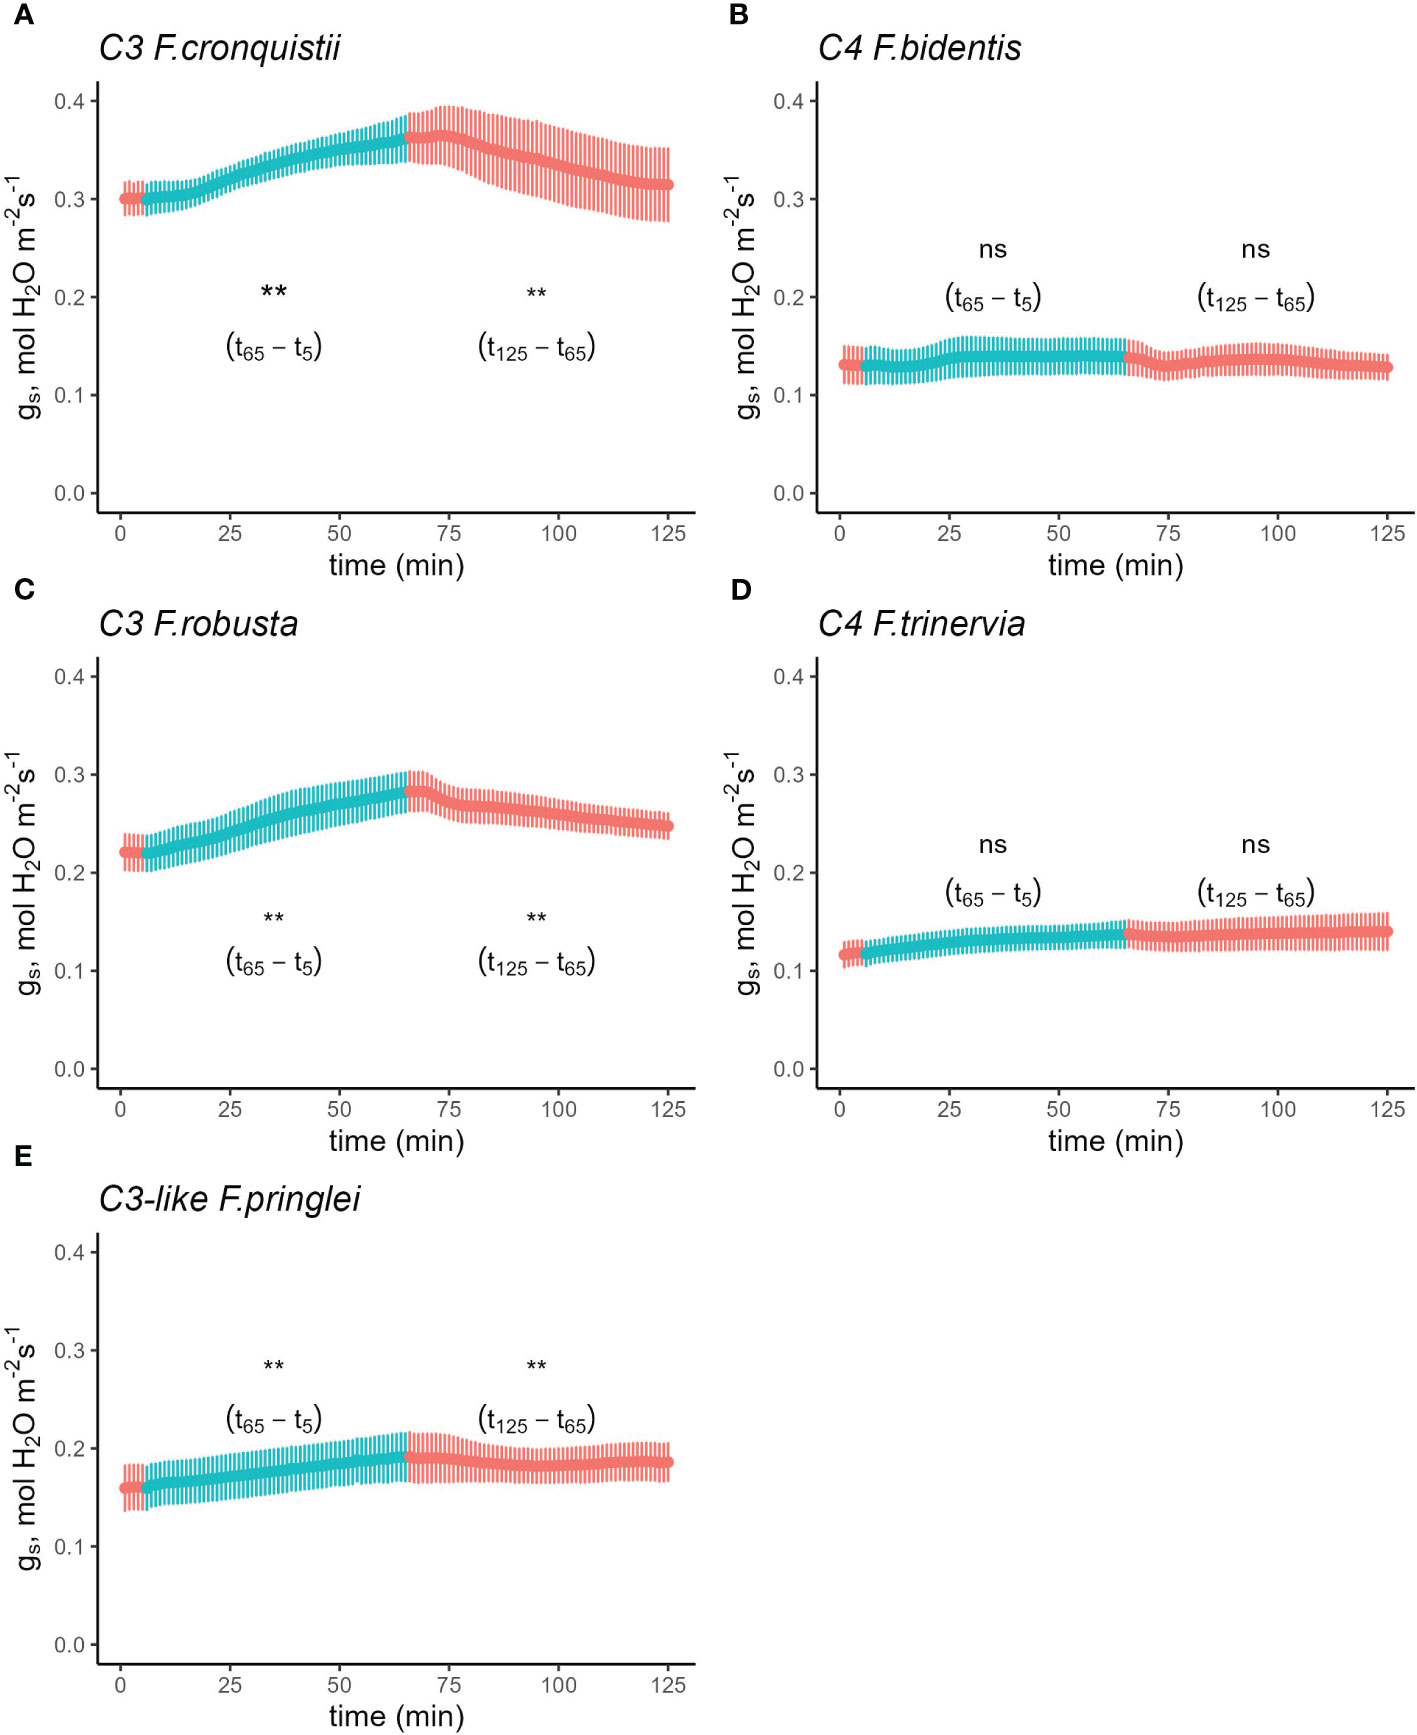
Figure 2 Time course of stomatal conductance (gs) response in C3 F.robusta (A), C3 F. cronquistii (B), C4 F. trinervia (C), C4 F. bidentis (D), and (E) C3-like F. pringlei in response to a sequence of 100% red and 75% red + 25% blue light. Leaves were initially acclimated under 100% red light until steady state was achieved (time = 0 in the figure). Subsequently, the light environment was switched to 75% red + 25% blue light while maintaining a photosynthetic photon flux density of 500 µmol m-2 s-1. The leaves were acclimated to the new light condition for 1 h before returning them back to the original condition for another hour before terminating the experiment. Light conditions were reversed at t6 and t65. Reference CO2 was maintained at 410 µmol mol-1, block temperature was kept at 25°C and average VPD was 1.2 kPa. Data points represent mean ± se (n=4-5). ** indicates significant difference at alpha = 0.05; ns, not significant.
Cleomaceae and Flaveria are both dicotyledonous species, but C4 photosynthesis is also quite prevalent in the monocots (Sage, 2004). Monocot species have stomatal features distinctly different from dicots (Bertolino et al., 2019). To determine if the stomatal responses described above also extend to congeneric C3 and C4 species in the monocots, the R→RB→R switchover experiment was also performed on C3 and C4 A. semialata subspecies (Figure 3). In this case, significant stimulation of gs in response to the R→RB switch was observed across both C3 and C4 subspecies, increasing from 0.05 to 0.07 mol H2O m-2 s-1 and returning to 0.05 mol H2O m-2 s-1 in response to the RB→R switch.
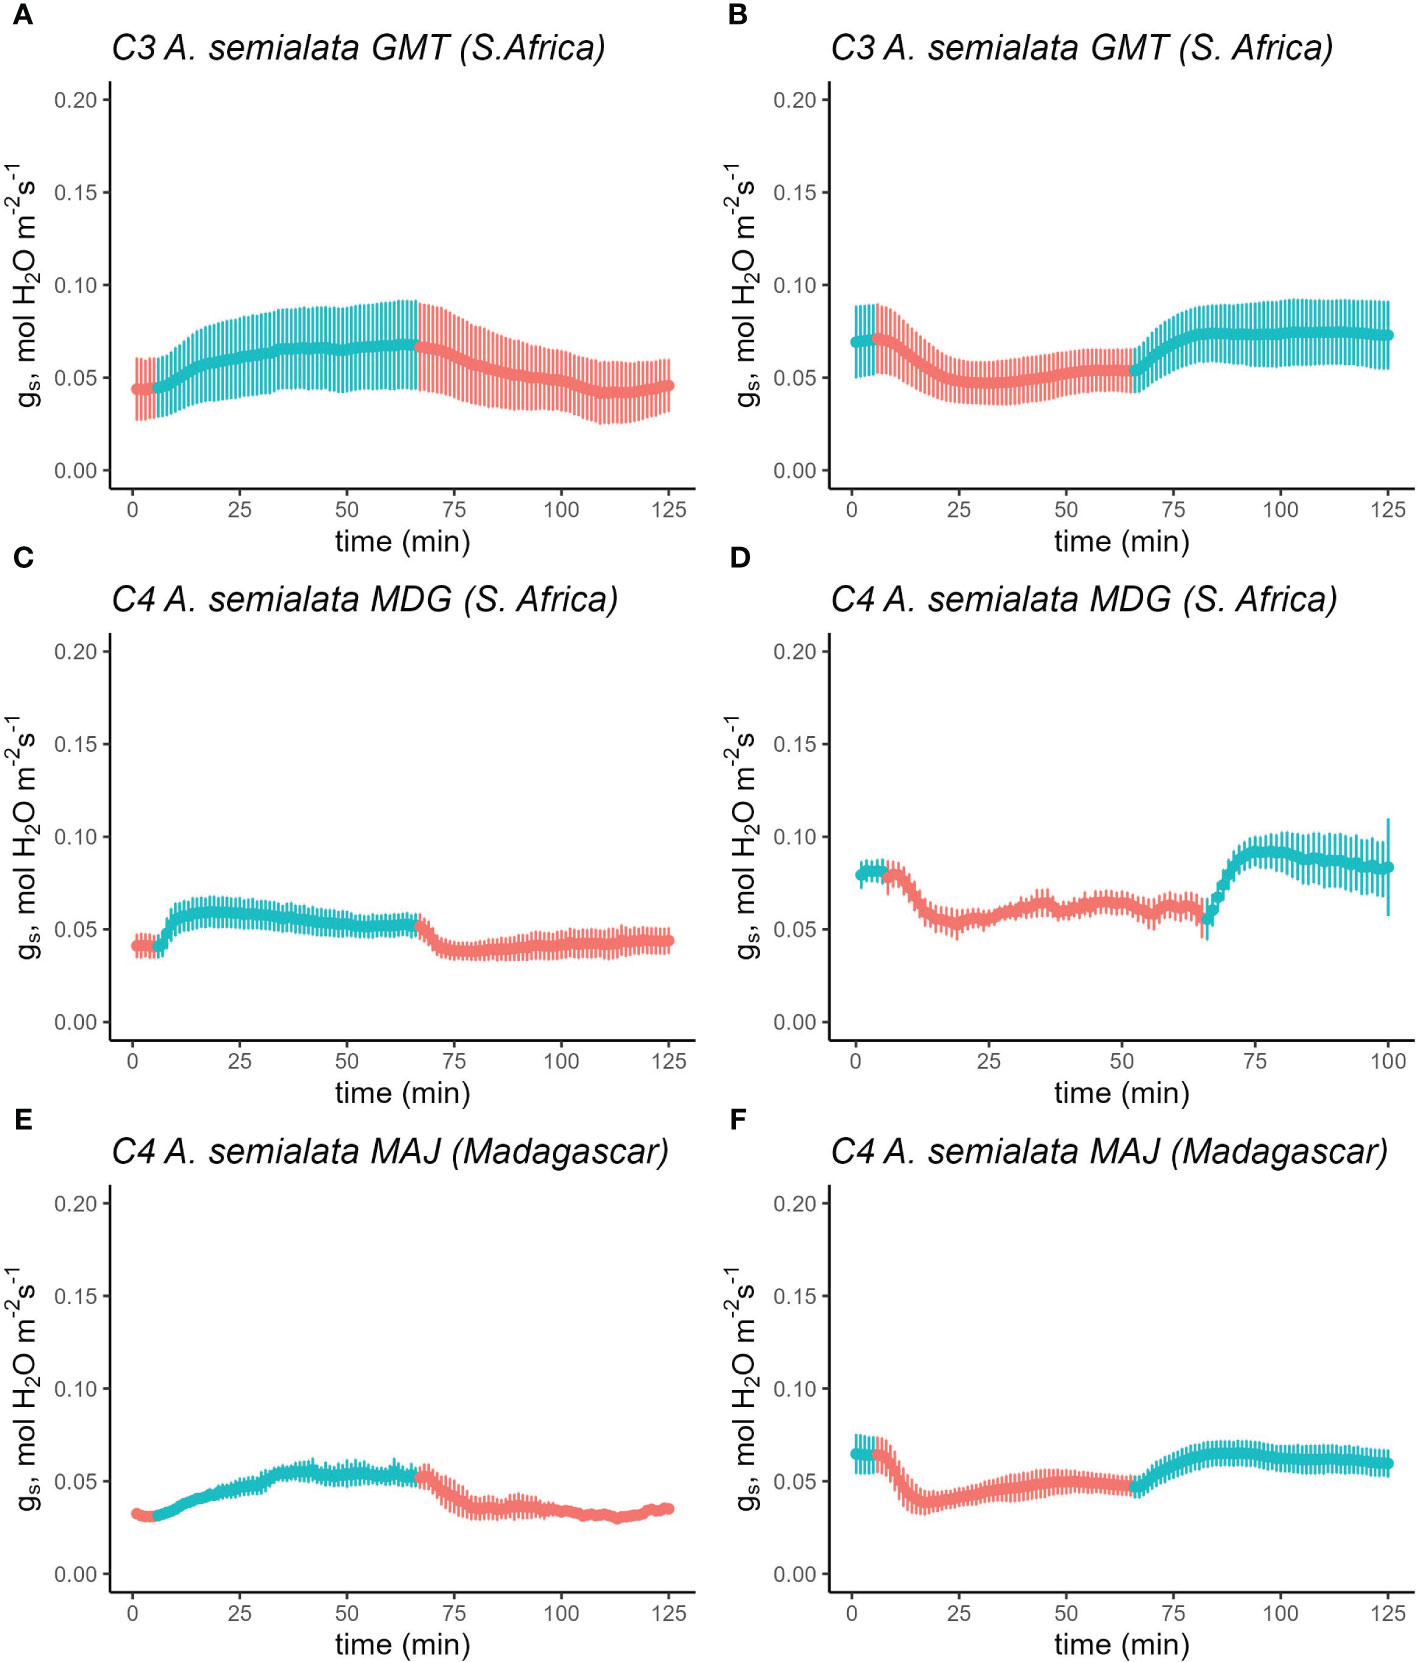
Figure 3 Time course of stomatal conductance (gs) response in C3 A. semialata subsp. eckloniana ‘GMT’ (A, B), C4 A. semialata subsp. semialata ‘MDG’ (C, D) and C4 A. semialata subsp. semialata ‘MAJ’ (E, F) in response to a sequence of 75% red + 25% blue light and vice versa. Leaves were initially acclimated in either 100% red (A, C, E) or 75% red+25% blue light (B, D, F) until steady-state was achieved (time = 0 in the figure). Subsequently, the light environment was switched depending on the initial light condition while maintaining a photosynthetic photon flux density of 500 µmol m-2 s-1. The leaves were acclimated to the new light condition for 1 h before returning it back to the original light condition. Reference CO2 was maintained at 410 µmol mol-1, block temperature was kept at 25°C and average VPD was 1.2 kPa. Data points represent mean ± se (n=3-4).
After reaching steady state in R, gs increased significantly from 0.05 mol H2O m-2 s-1 to 0.07 mol H2O m-2 s-1 in C3 A. semialata GMT upon the switch to RB, and then returned to 0.05 mol H2O m-2 s-1 when the light was shifted back to R (Figure 3A; Table S9). Both C4 A. semialata (‘MDG’ and ‘MAJ’) increased from 0.04 mol H2O m-2 s-1 to 0.05 mol H2O m-2 s-1 under RB, and back to 0.04 when the light was reversed to R (Figures 3C, D).
In the reverse sequence, gs followed a similar pattern. In C3 A. semialata ‘GMT’, gs was 0.07 mol H2O m-2 s-1 at the start of R, which then dropped to 0.05 mol H2O m-2 s-1 under R, and returned to 0.07 mol H2O m-2 s-1 when light was changed to RB (Figure 3B; Table S10). Following steady state, the initial gs in C4
A. semialata ‘MDG’ under RB was 0.08 mol H2O m-2 s-1, which rapidly declined to 0.06 mol H2O m-2 s-1, with a final gs of 0.06 mol H2O m-2 s-1 (Figure 3D). Similarly, gs in C4 A. semialata ‘MAJ’ went from 0.07 to 0.05 and back to 0.07 mol H2O m-2 s-1 throughout of the sequence (Figure 3E).
Under R→RB→R and the reverse sequence, RB→R→RB, fitting the gs data to a linear mixed-effects model (Tables S8 and S9) showed a highly significant effect of light (R-RB-R, p=0.0007;RB-R-RB, p=0.0060), but the main effect of species (R-RB-R, p=0.3455; RB-R-RB, p=0.8859) and its interaction with light (R-RB-R, p=0.2055; RB-R-RB, p=0.7486) were not significantly different.
Although neither sequence had a clear effect on A (Figure S4), linear mixed-effects model analysis of A under R→RB→R showed a significant main effect of light (p=0.0013) (Table S10), this same relationship could not be detected in the reverse sequence (Table S11, p=0.1395). Both main effects in the reverse sequence were also not significant.
To evaluate the quantitative red-light stomatal response, gas exchange was measured at different red PPFDs. The depletion of CO2 in the mesophyll can give rise to an apparent red light response (Roelfsema et al., 2002) which was not the focus of the experiments here, therefore the stomatal response to red light was evaluated under constant Ci.
In Cleomaceae, C3 T. hassleriana showed a drop in steady state gs from 0.42 mol H2O m-2 s-1 to 0.26 mol H2O m-2 s-1 when red light intensity was reduced step-wise from 800 µmol m-2 s-1 to 200 µmol red photons m-2 s-1 (Figure 4A) while Ci was maintained at 288 µmol CO2 mol-1(Figure 4B). Stomatal conductance in C4 G. gynandra remained consistent around 0.15 mol H2O m-2 s-1 at the starting light intensity of 800 µmol m-2 s-1 red light (Figure 4C), while Ci was held constant at 173 µmol CO2 mol-1 (Figure 4D) and only slightly decreased to 0.12 mol H2O m-2 s-1 when light was set to 200 µmol red photons m-2 s-1. Using a linear mixed-effects model, the interaction of photosynthetic type and red PPFD on gs was found to be significant (p=0.046) (Table S14), as a result of the significantly weaker red-light response in G. gynandra compared to T. hassleriana. In both species A significantly responded to red light PPFD (p<0.001)(Figure S5 and Table S15).
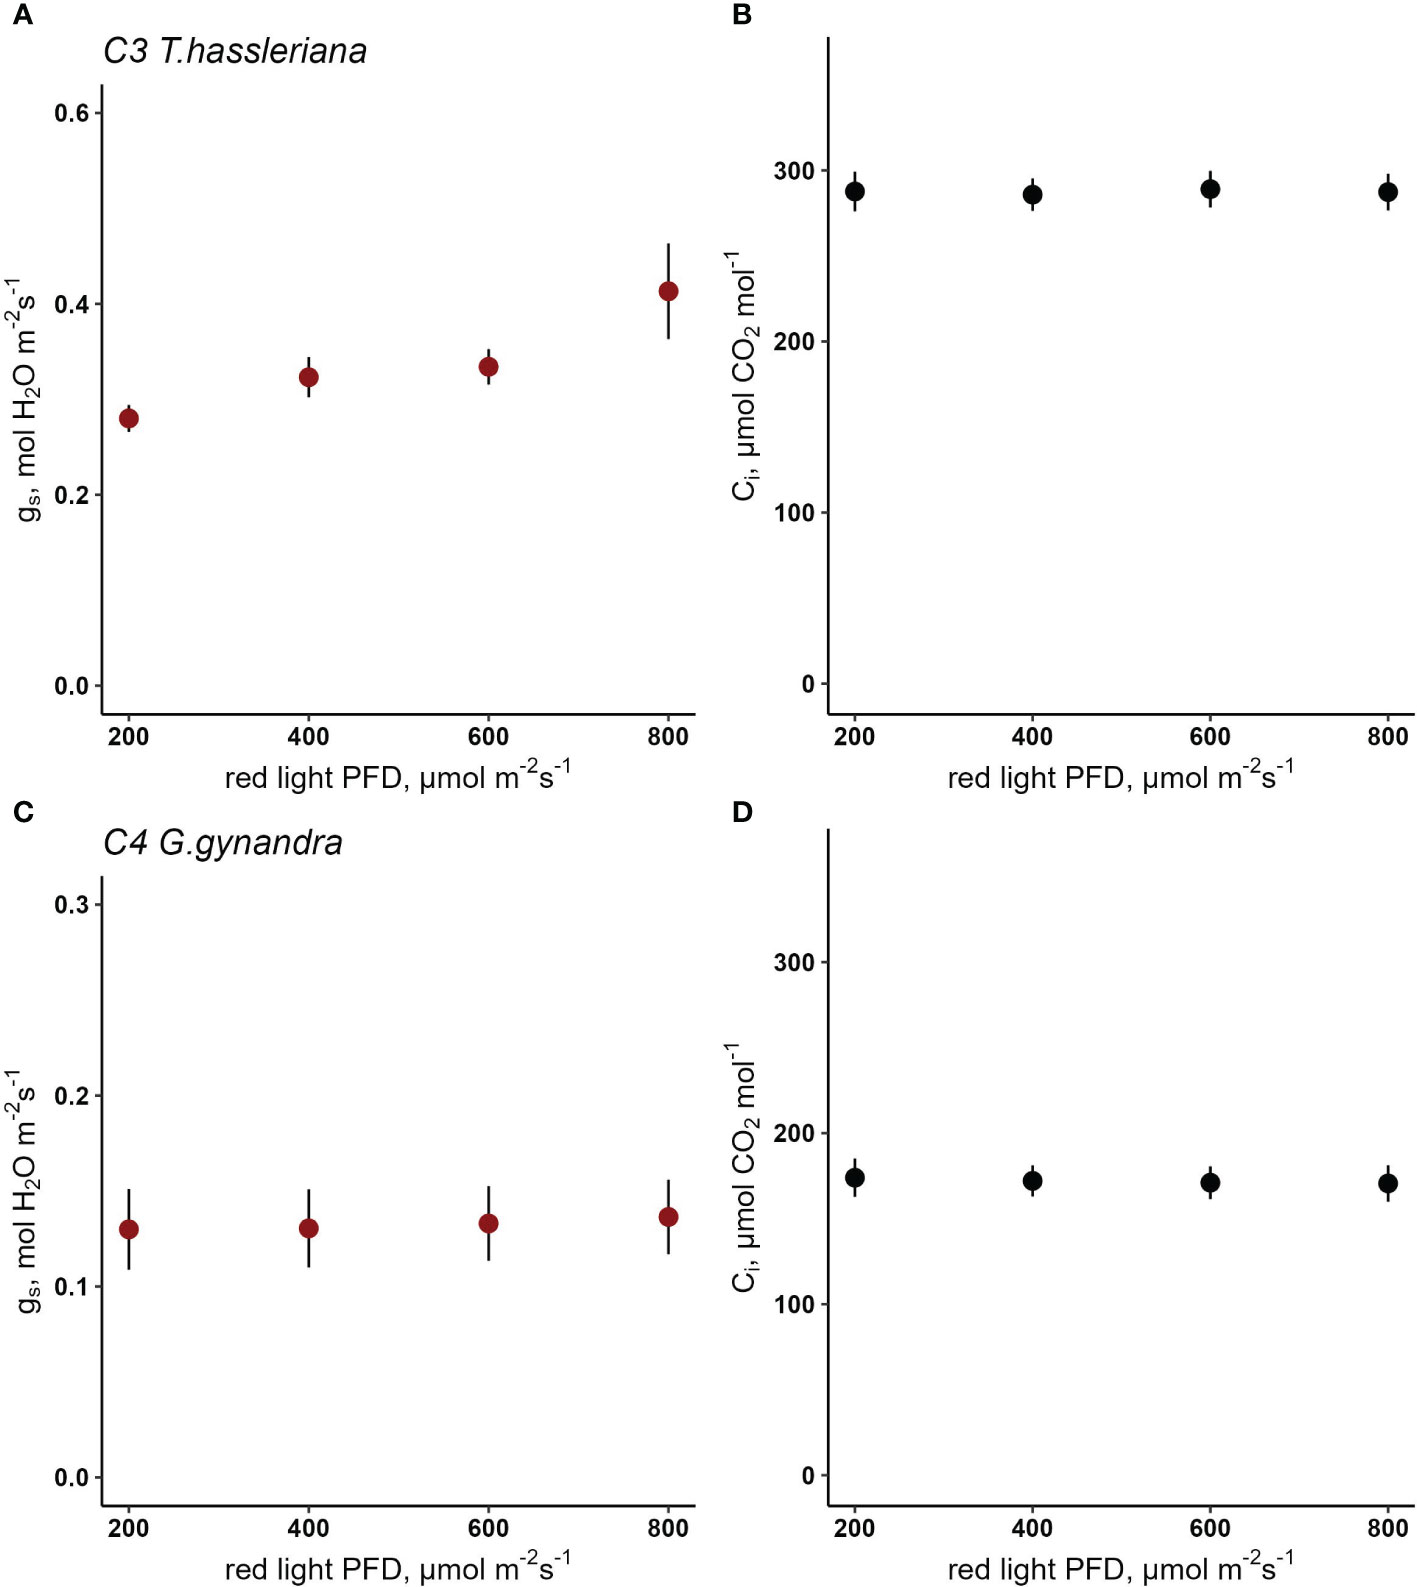
Figure 4 Response of stomatal conductance (gs) to red light photosynthetic photon flux density (PPFD) in C3 T. hassleriana (A) and C4 G. gynandra (B) at constant Ci (C, D). A linear mixed- effects model analysis was carried out to test if photosynthetic type influences the response to red light in congeneric species belonging to Cleomaceae. Data points represent mean ± se (n=3-4).
In Flaveria, C3 F. cronquistii showed an average gs of 0.36 mol H2O m-2 s-1 at 800 μmol red photons m-2 s-1 which decreased to 0.27 mol H2O m-2 s-1 at 200 μmol photons m-2 s-1 while Ci was kept constant at 296 μmol CO2 mol-1 (Figures 5A, B). C3 F. robusta had a lower overall gs, which started from 0.17 mol H2O m-2 s-1 and decreased to 0.13 mol H2O m-2 s-1 at a Ci of 247 mol CO2 mol-1 (Figures 5C, D). Meanwhile steady state gs in C4 F. bidentis under 800 μmol red photons m-2 s-1 was 0.18 mol H2O m-2 s-1 which slowly decreased to 0.13 mol H2O m-2 s-1with the decrease in light intensity (Figure 5E), but while holding Ci constant at 157 μmol CO2 mol-1 (Figure 5F). gs in C4 F. trinervia was practically unchanged in response to red light intensity ranging between 0.12 and 0.10 H2O m-2 s-1(Figures 5G, H). Finally, C3-like F. pringlei had a gs of 0.19 mol H2O m-2 s-1 to 0.15 mol H2O m-2 s-1 (Figure 5I) as light intensity was reduced while keeping Ci at 240 μmol CO2 mol-1 (Figure 5J). Fitting the gs data to a linear mixed-effects model showed a highly significant species (p<0.0001) and red-light PPFD (p<0.0001) main effects, and a non-significant interaction effect (p=0.6789) (Table S15). The significance of the red-light effect demonstrates that despite the limited range of the response, stomata did respond significantly to red-light. The strong significance of the species effect demonstrates that the absolute values of stomatal conductance differed significantly between Flaveria species in line with photosynthetic type. However, the presence of a non-significant interaction between species and red light demonstrates that the magnitude of the stomatal red-light response did not differ significantly between these species. Not surprisingly, CO2 assimilation rate responded strongly to light intensity in all five species (Figure S4 and Table S16), suggesting that the significant stomatal red-light response in these species may serve to fine-tune coordination between stomatal conductance and photosynthesis, in concert with the stomatal CO2 response.
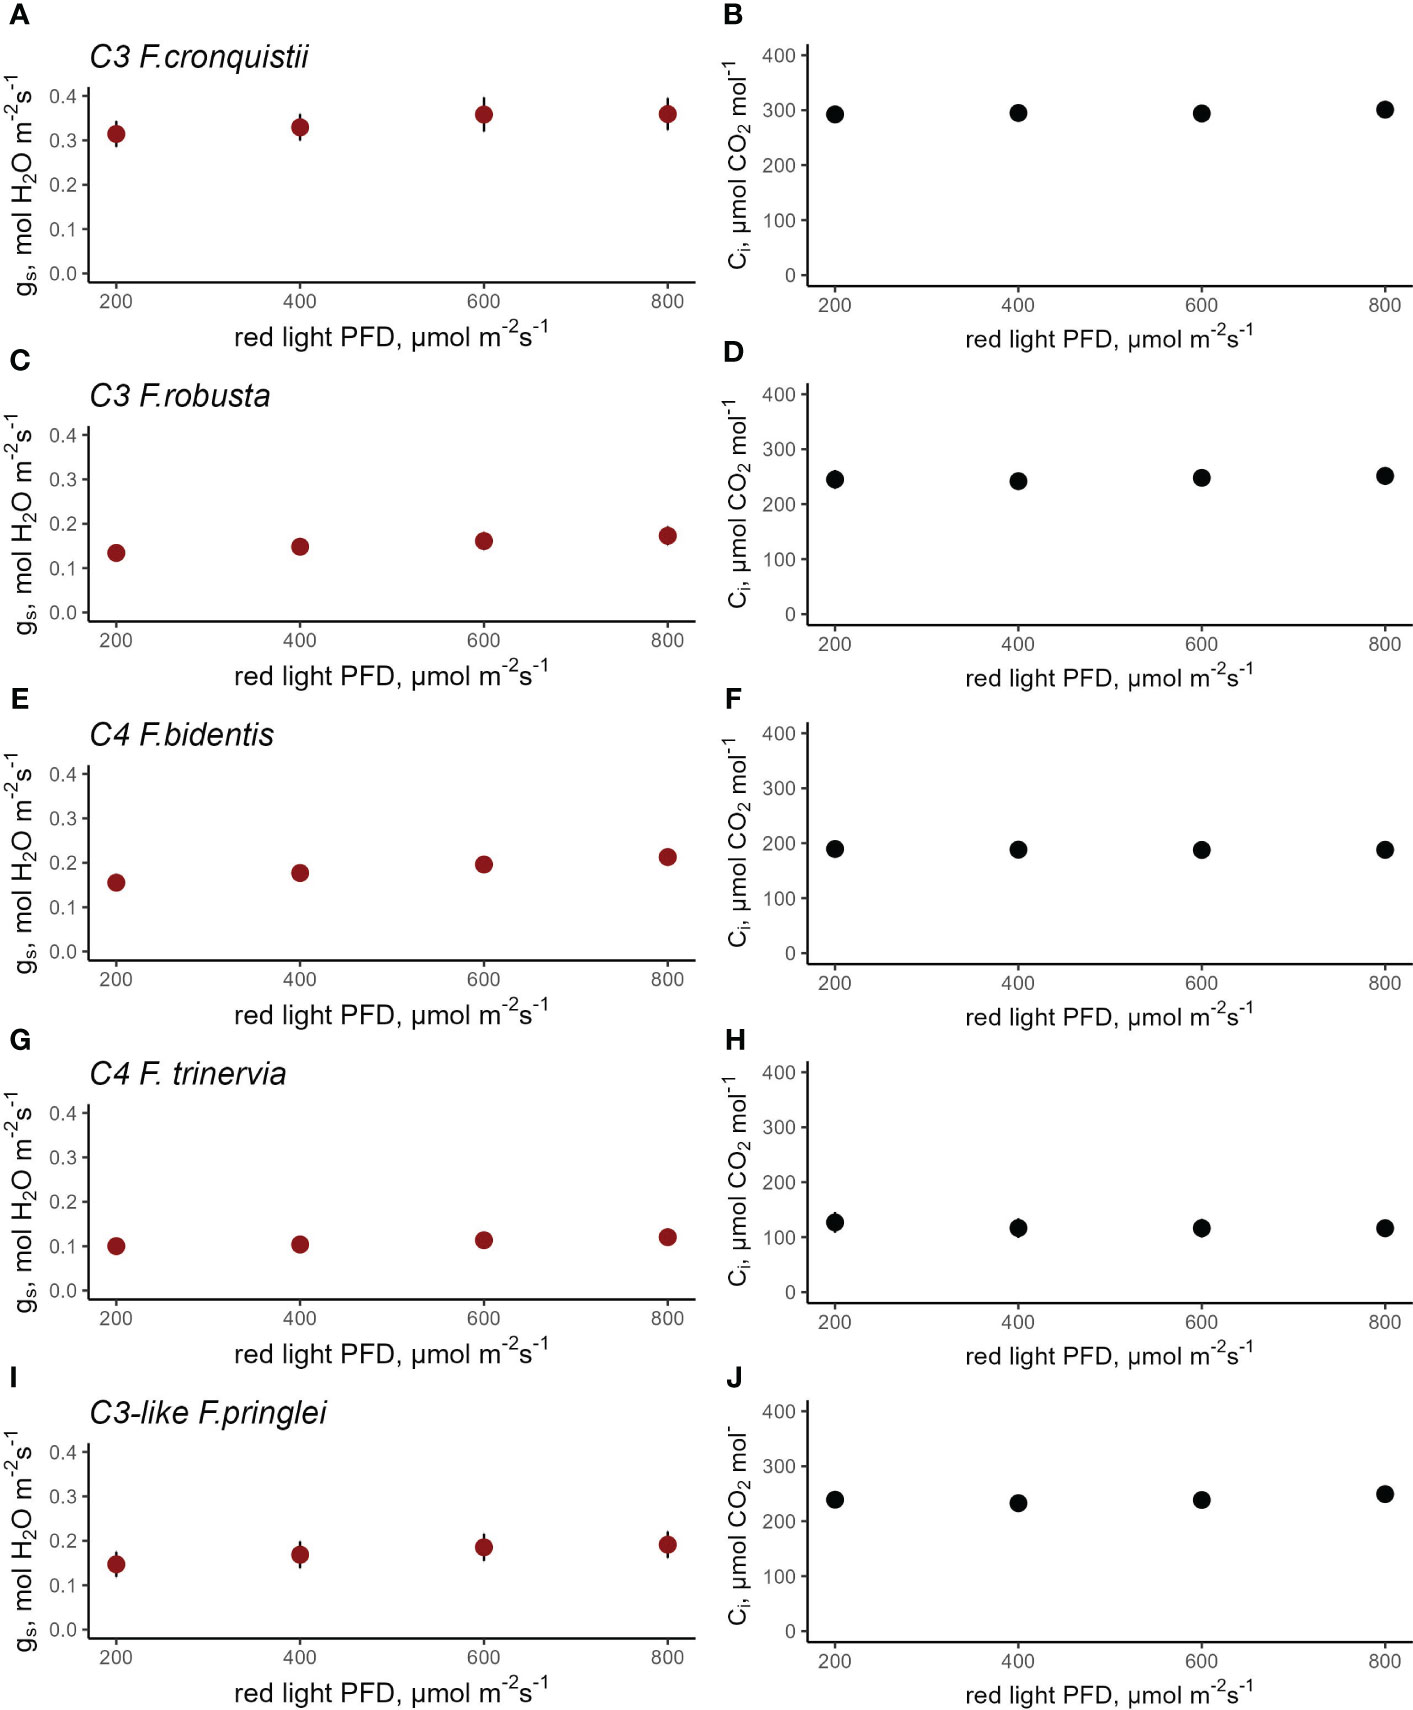
Figure 5 Response of stomatal conductance (gs) to red light photosynthetic photon flux density (PPFD) at constant intercellular CO2 concentration (Ci) in C3 F. cronquistii (A, B, n=4) and C3 F. robusta (C, D, n=5), C4 F. bidentis (E, F, n=8), C4 F. trinervia (G, H, n=5), and C3-like F. pringlei (I, J, n=5). A linear mixed- effects model analysis was carried out to test if photosynthetic type influences the response to red light in congeneric species belonging to Flaveria. Data points represent the mean ± se.
The stomatal red-light response was also characterized for C3 A. semialata subsp. eckloniana and C4 A. semialata subsp. semialata (Figures 6A, C). When PPFD was reduced from 800 to 200 µmol red photons m-2 s-1 for C3 A. semialata subsp. eckloniana, gs changed very little from 0.07 to 0.05 mol H2O m-2 s-1 (Figures 6A, B). Similarly, the C4 A. semialata subsp. semialata kept gs at approximately 0.07 mol H2O m-2 s-1 despite the decrease in red PPFD (Figures 6C, D). Curiously the C4 subspecies (Figure 6D) had a higher Ci than the C3 subspecies at 800 µmol red photons m-2 s-1 (Figure 6C; 153 vs 193 µmol CO2 mol-1). A mixed-effects model detected a marginal effect of red PPFD p=0.0525) but there was no evidence of the effect of subspecies (p=0.3884) and its interaction with red PPFD (Table S17, p=0.1979). Similar to Cleomaceae and Flaveria, assimilation rate also responded strongly to red-light PPFD (Figure S7 and Table S18).
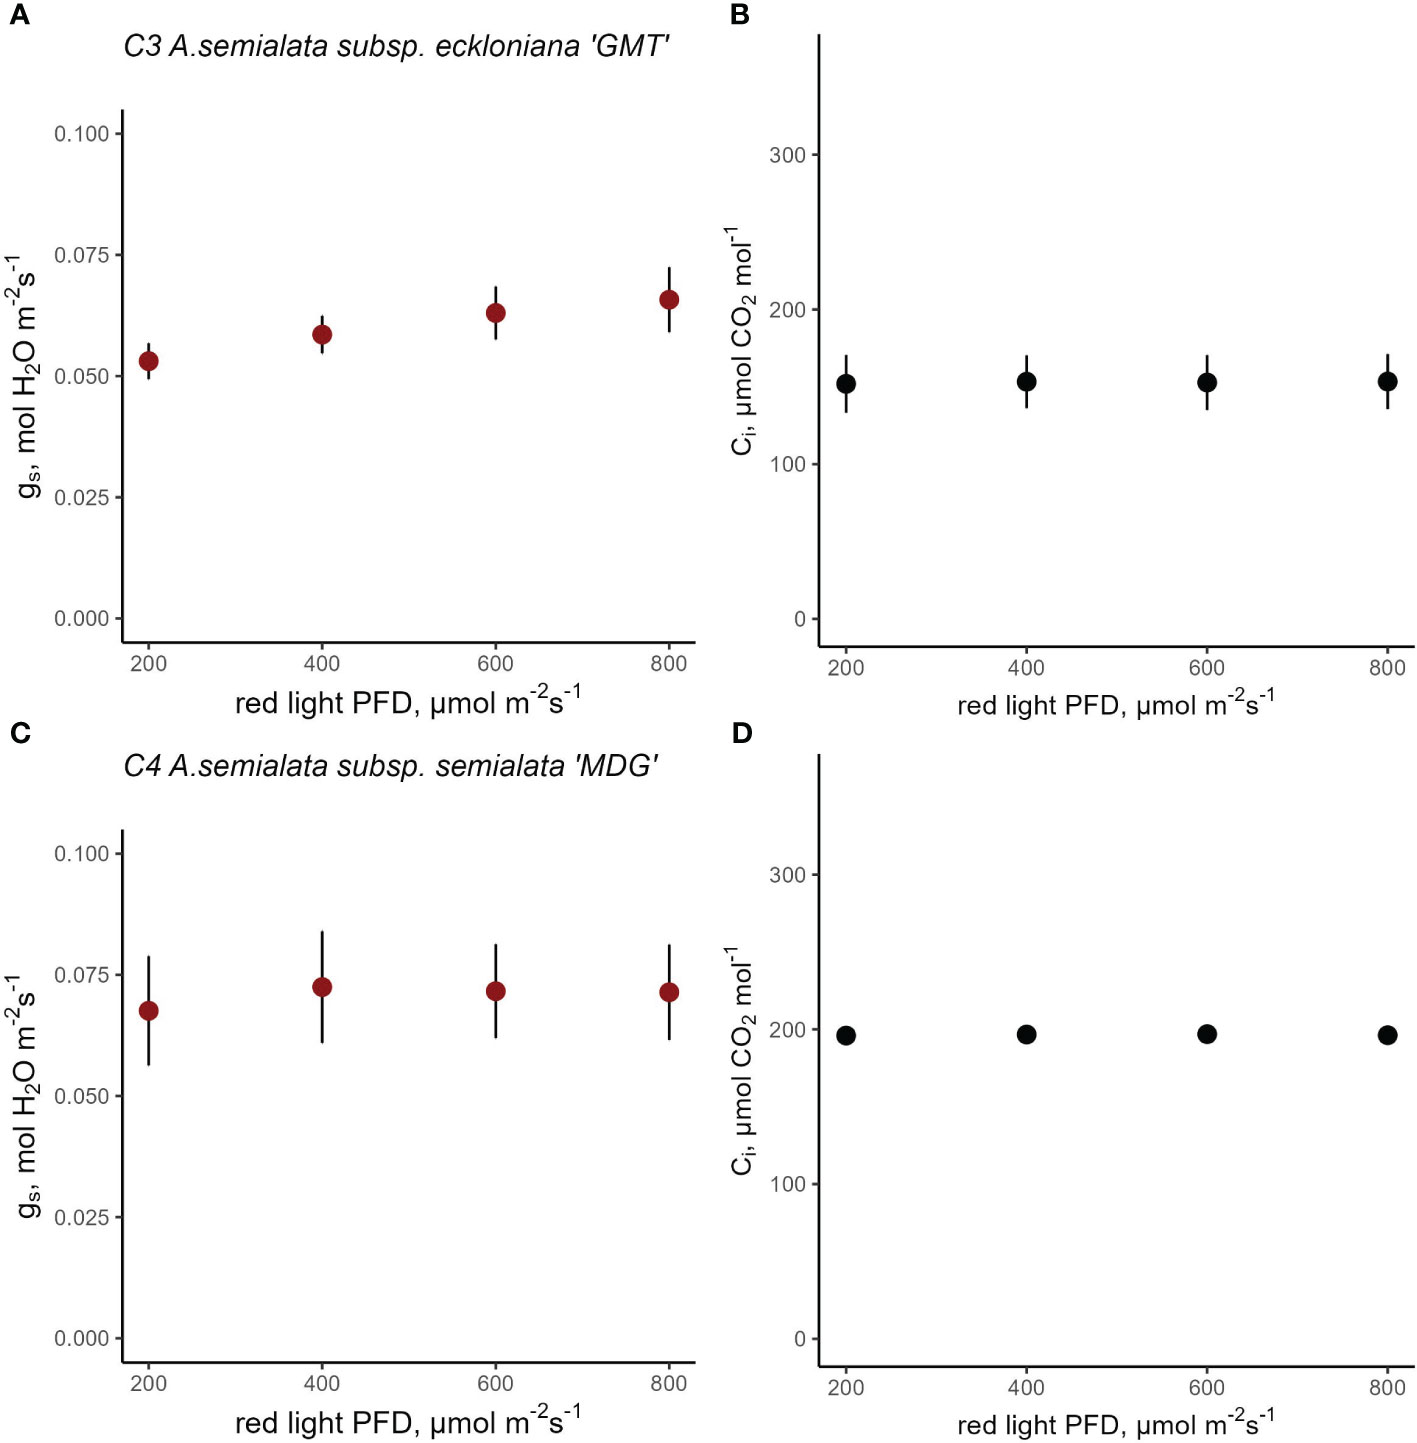
Figure 6 Response of stomatal conductance (gs) at constant intercellular CO2 concentration (Ci) in C3 A. semialata subsp. eckloniana ‘GMT’ (A, B, n=4) and C4 A. semialata subsp.semialata ‘MDG’ (C, D, n=5). Linear mixed-effects model analysis was carried out to test if photosynthetic type influences the response to red light in C3 and C4 subspecies belonging to Alloteropsis. Each data point represents the mean ± se.
Altogether, these data established a significant stomatal red light opening response to red-xlight, independent of Ci in Cleomaceae and most Flaveria species, but not in Alloteropsis. Although the observed reduced stomatal sensitivity to red light in C4 G. gynandra compared to C3 T. hassleriana is consistent with the hypothesized differences between C3 and C4 photosynthetic types, the differences observed between Flaveria species and the lack of these in Alloteropsis seem to suggest that these are more likely to be species-specific responses, rather than generic differences between photosynthetic pathways.
Stomatal density and size were determined in conjunction with the gas exchange measurements described in the previous sections. In Cleomaceae, the overall stomatal density was significantly higher in C3 T. hassleriana (590 stomata mm-2) than in C4 G.gynandra (200 stomata mm-2) (p<0.0001). The distribution of stomata on both leaf surfaces was also found to be significantly different, but in a species-dependent manner (Figure 7A, p=<0.0001). The SD on the adaxial surface was almost two times higher than the abaxial surface in C3 T. hassleriana (Figures S8A, B). In contrast, in C4 G.gynandra, SD was 25% higher on the adaxial compared to the abaxial surface (Figures S8C, D).
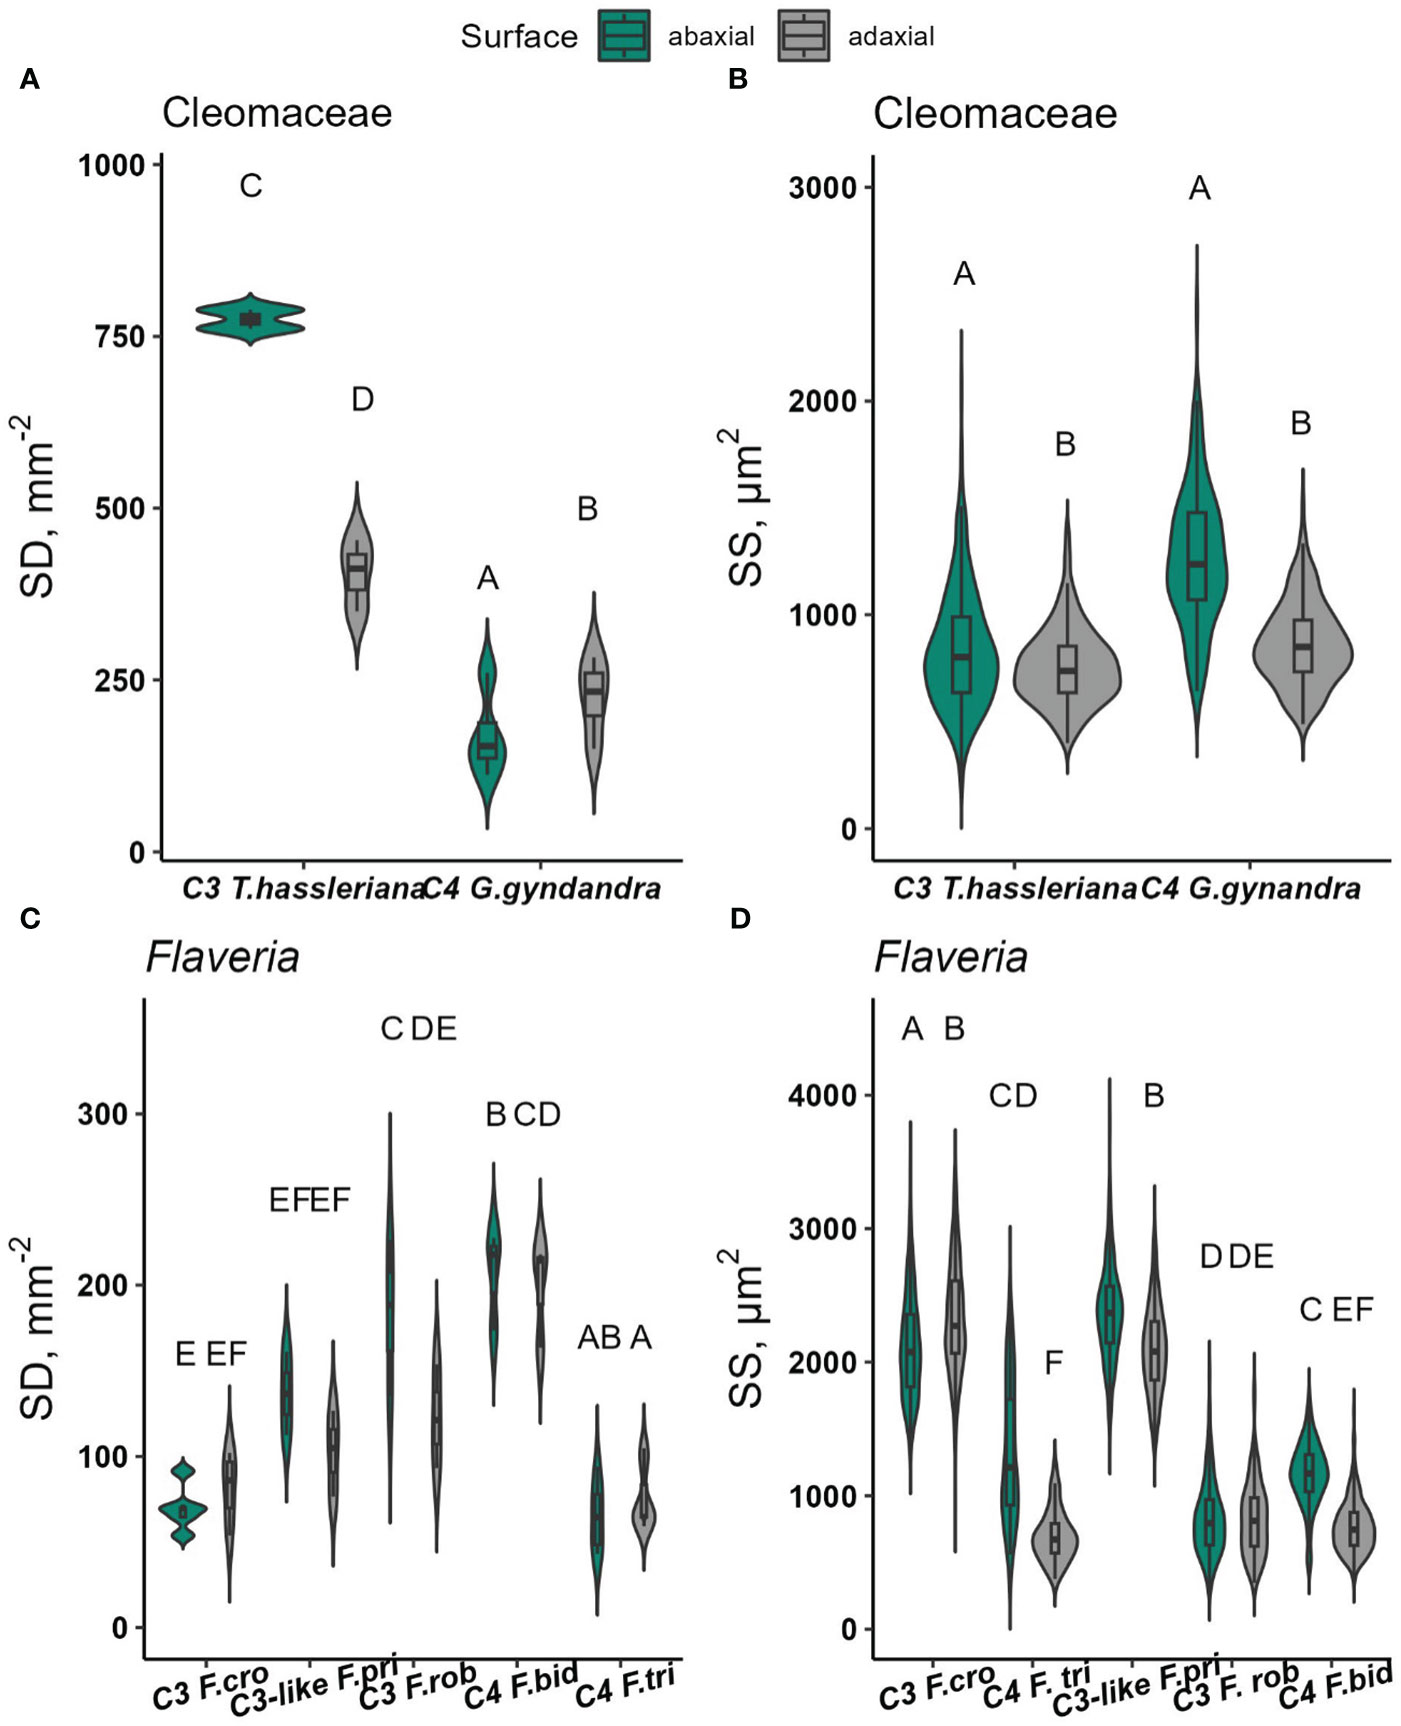
Figure 7 Stomatal density (SD, stomata mm-2) and stomatal size (SS, µm2) on the abaxial and adaxial leaf surfaces of Cleomaceae (A, B), Flaveria (C, D). Data were collected from 1-4 random microscopic fields of view from abaxial and adaxial surfaces from 3-5 biological replicates. In each species, at least 350 stomata per surface were measured for SS, with the exception of C3. F. cronquistii and C4 F. trinervia, for which at least 141 and 170 stomata per surface were measured, respectively. Violin plots with embedded box plots in the same panel, with the same letters are not significantly different at α = 0.05 using Tukey’s HSD test.
While density varied depending on leaf surface in Cleomaceae, stomatal size was significantly larger on the abaxial than the adaxial surface (Leaf surface, p <0.0001) (Figure S9A). This SS difference was similar in both Cleomaceae species.
SD among Flaveria species (Figures 7C and S9A-J) were significantly different (p<0.0001), but the trend in SD was not consistent with the proposed progression of larger and fewer stomata in C4 Flaveria than in C3 Flaveria (Zhao et al., 2022). Instead, F. cronquistii, one of the two C3 species, had the lowest SD and the highest SD was found for F. bidentis, one of the C4 species. Thus, these differences do appear to be species-dependent, but not determined by photosynthetic pathway. SD was similar between both leaf surfaces in both C4 Flaveria species (Figure S9C) as well as in the C3 F. cronquistii, whereas the abaxial surface had higher SD in the C3-like F. pringlei and the C3 F. robusta (significant for the latter, p<0.05). SS was higher on the abaxial side for all Flaveria species except for C3 F. cronquistii resulting in an interaction effect of species x leaf surface which was highly significant (p<0.0001, Figure S7D).
Meanwhile, there was no statistically significant difference in SD detected between the Alloteropsis subspecies (p = 0.338) (Figures 7 and S10), while SS was larger on the abaxial surface (p <0.05, Figure 7F). Altogether, stomatal density, distribution and anatomical traits appeared to be largely determined by species effect, rather than photosynthetic pathway, although notably, all C4 species had at least equal SD on the adaxial and abaxial surfaces, whereas the more commonly found bias of SD towards the abaxial surface was only found in some of the C3 species.
Leaf-level gs responses to red light quantity or red/blue spectral composition were compared between C3 and C4 species from Cleomaceae, Flaveria, and Alloteropsis genera. All three groups are well-studied models in the quest to understand evolution of C4 photosynthesis. Combining experimental comparisons within all three genera allowed for a global comparison of stomatal light responses between C3 and C4 photosynthetic types while controlling for the effects of phylogenetic distance within each genus.
BL promotes diverse physiological plant responses ranging from phototropism, chloroplast photorelocation movement, leaf flattening, leaf positioning, and stomatal opening (Christie, 2007; Inoue et al., 2008; Goh, 2009). Blue-light induced stomatal opening is probably the most well-characterized among these responses. However, the stomatal opening response to BL is not universal. Studies in model and non-model species provide strong evidence of the species-specificity of the BL stomatal opening response (Vialet-Chabrand et al., 2021). Differences in BL-dependent stomatal opening may exist. A recent study reported that C4 crop species (Zhen and Bugbee, 2020) displayed diminished stomatal opening to BL compared to C3 crops. Indeed, in this study, C4 dicots were found to be less sensitive to blue light-induced stomatal opening than close relatives operating the C3 pathway. This observation demonstrates a clear difference between C3 and C4 opening response, as hypothesized. In contrast, both the C3 and C4 accessions from the monocot A. semialata displayed blue light-dependent stomatal opening, which meant that the C4 photosynthetic pathway per se does not determine this reduced blue light sensitivity.
The decreased sensitivity of C4 dicots to blue light may be a result of decreased guard cell expression of phototropins, the major blue light photoreceptor in plants. Analysis of transcript abundance in different cell types of C4 G. gynandra showed that the transcript abundance of PHOT1and PHOT2, as well as another blue light photoreceptor, CRY2, were lower in mesophyll and guard cells of C4 G. gynandra, than in C3
T. hassleriana Aubry et al. (2016). In Arabidopsis, phototropins are expressed in almost every plant part Sakamoto and Briggs (2002), however the strongest expression in the epidermis is detected in guard cells, where phots are associated with the plasma membrane ((Sakamoto and Briggs, 2002)). PHOT1 and 2 have partially overlapping roles. PHOT1 has been suggested to respond to lower PPFD (0.1-50 µmol m-2 s-1), while PHOT2 responds to PPFD up to 250 µmol m-2 s-1 in Arabidopsis [15]. Several hypotheses exist with regards to the function of the stomatal blue light response. One putative role is to stimulate photosynthesis via enhanced stomatal opening in the morning hours when blue light is more prevalent. In the results presented here, PPFD was kept equal during the spectral changes, and CO2 assimilation rate was invariable, despite significant changes in stomatal conductance in C3 T. hassleriana, C3-like F. pringlei, C3 F. robusta, C3 F. cronquistii and both A. semialata subspecies. These observations do not seem consistent with an important role for blue light induced stomatal opening for photosynthetic carbon gain.
Could there be other benefits to blue sensitivity of stomatal movements? An alternative hypothesis to explain the differential sensitivity to blue light could be related to leaf thermoregulation. Stomatal opening in response to blue light has been suggested to work as a proxy for high-intensity sunlight (Zhao et al., 2022) and function primarily to cool the leaf via transpiration (Taylor et al., 2012). Furthermore, photorespiration increases with temperature in C3 species but does not change in C4 species due to CCM (Lawson et al., 2008; Arrivault et al., 2017). Hence, net CO2 assimilation rate in C4 species has a higher optimum temperature than in C3 species (Xu et al., 2016), and a slight elevation of leaf temperature can substantially increase the photosynthesis rate in C4, whereas the temperature response between 20°C and 30°C in C3 species is almost negligible. Based on these differences, the presence of stomatal blue light response may help to cool the leaves of the C3 dicot species studied here, and thus keep photorespiration lower, while the lack of the stomatal blue light response in the C4 dicots may help elevate leaf temperature and thereby stimulate CO2 assimilation rate.
Interestingly, this would also be consistent with the putative involvement of diminished PHOT expression, since PHOTs also perform thermosensory roles Fujii et al. (2017) and promote evapotranspiration and leaf cooling at high temperatures in Arabidopsis (Kostaki et al., 2020).
The mechanism underlying the red-light response remains unresolved. Unlike the blue light response, red light-induced stomatal opening does not seem to involve direct signal transduction from red light photoreceptors in the guard cells but rather relies on the decrease in Ci through the consumption of CO2 via mesophyll photosynthesis (Mott, 1988; Roelfsema et al., 2002; Lawson et al., 2008). However, gs was also observed to increase with light despite constant or high Ci or after achieving steady-state photosynthesis (Matrosova et al., 2015), which implies other signals than Ci could also be involved (Lawson et al., 2014; Flu¨tsch and Santelia, 2021).
C4 photosynthesis operates in a two-cell compartment system, such that a strong metabolite gradient is essential to run it efficiently (Leegood and von Caemmerer, 1988; Arrivault et al., 2017). Precise coordination between the C3 and C4 cycles is crucial under varying irradiances and Ci to avoid excessive CO2 leakage from the bundle sheath (Kromdijk et al., 2014). C3 photosynthesis, on the other hand, is less complex. We therefore hypothesized that species with these contrasting mesophyll photosynthesis characteristics may also be expected to show a different stomatal response to red light.
However, the comparison between the red-light response in C3 and C4 dicot species showed that although significant variation in the stomatal red-light response was found between species, no structural differences between C3 and C4 species were found across the three phylogenetically controlled comparisons. Instead, a distinct red-light response was found in C3 T. hassleriana, and a weaker, but significant red-light effect was also found across all Flaveria species, suggesting that these species support the coordination between stomatal conductance and photosynthesis via stomatal responses to both Ci and red light. In contrast, C4 G. gynandra as well as both A. semialata subspecies appear to rely solely on the Ci response.
One aspect of the red-light response debate is whether stomatal guard cells can independently respond to red light. Indeed, a recent metabolomics study reported a direct guard cell response to red light (Zhu et al., 2020). This finding could be consistent with a putative mechanism involving the phosphorylation of the guard cell plasma membrane H+ATPase leading to stomatal opening in intact leaves (Ando and Kinoshita, 2018). Consistent with this mechanism, it was demonstrated that H+ATPase activation by red light was dependent on fluence rate (Ando and Kinoshita, 2019). If this mechanism can be shown to play a significant role, it may offer an alternative explanation for the observed species differences in the red light response, not necessarily dependent on a mesophyll-derived signal.
Stomatal density and morphology are well-known to impact responses to light (Harrison et al., 2020). These traits varied significantly between species studied here (Figures 7, 8). For most dicots, such as Cleomaceae and Flaveria, stomata are defined by a pair of kidney-shaped guard cells (Figures S8 and S9). In contrast, stomata in the monocot A. semialata subspecies are dumbbell-shaped with additional subsidiary cells flanking the guard cells (Figure S10). The morphology and size of stomata in the grasses are often suggested to facilitate more rapid responses to short-term environmental perturbations (Chen et al., 2017), such as fluctuating light or acute changes to temperature or VPD (Bauer et al., 2013). However, there was no evidence in this study linking stomatal morphology nor size to blue light-induced opening or quantitative red-light responses.
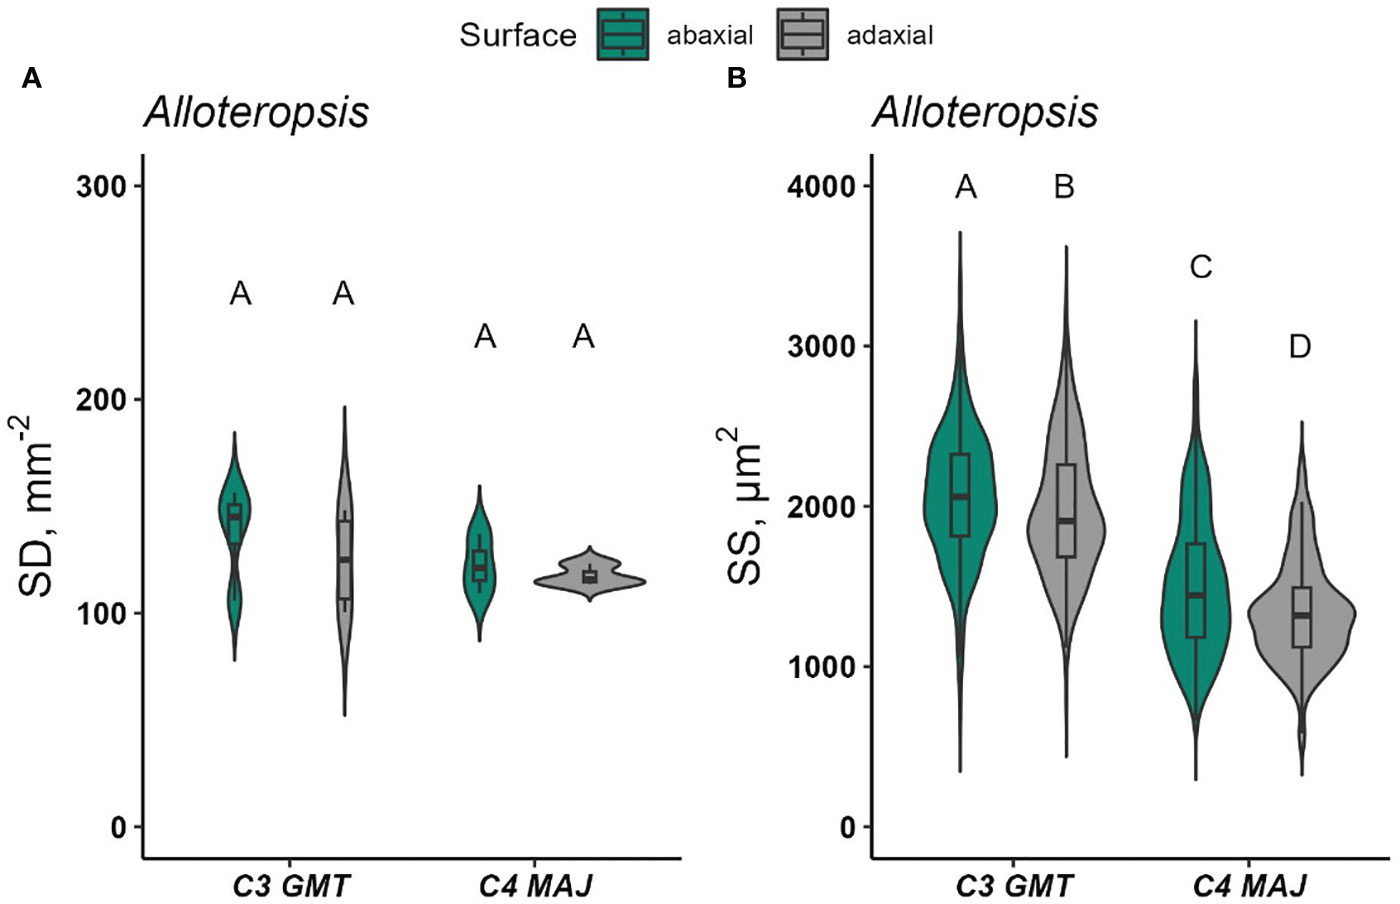
Figure 8 Stomatal density (SD, stomata mm-2) and stomatal size (SS, µm2) on the abaxial and adaxial leaf surfaces of Alloteropsis (A, B). Data were collected from 1-4 random microscopic fields of view from abaxial and adaxial surfaces from 3-5 biological replicates. In each species, at least 350 stomata per surface were measured for SS. Violin plots with embedded box plots in the same panel, with the same letters are not significantly different at α = 0.05 using Tukey’s HSD test.
Within the dicots, C3 T. hassleriana (Cleomaceae) had denser and smaller stomata than the C4 species G. gynandra, which was consistent with earlier observations Aubry et al. (2016). The higher SD on the adaxial surface could be responsible for the pronounced red-light response, independent of Ci in C3 T. hassleriana. However, measurements on intact leaves do not make it possible to derive whether these responses rely on signal perception in the guard cell, or in the underlying mesophyll.
Furthermore, in Flaveria, SD and SS varied between species. Unlike in the Cleomaceae species, SD or SS had no evident relationship to the red-light response in Flaveria. Additionally, the observed between-species variability in SD and SS in Flaveria was inconsistent with the proposed trajectory of stomatal density and guard cell length (and therefore, size) changes during C4 evolution, where C3 Flaveria species tended to have smaller but more stomata, while C4 Flaveria show increased stomatal size and decreased density (Zhao et al., 2022). In fact, C3-like F. pringlei and C3 F. cronquistii, were found to have larger stomata (Figure 7D), whereas both C4 Flaveria had smaller stomatal sizes. The discrepancy between this study and Zhao et al. (2022) might have stemmed from very low sample sizes used by the latter. Stomatal parameters in Zhao et al. (2022) were measured from a minimum of 5 individual stoma, to at most 10 stomata per species, which, as shown in Figure 7D, is insufficient to capture size differences among Flaveria species.
Another possible reason for these discrepancies is the potential impact of ecological adaptation in some of the Flaveria species. C3 F. cronquistii had equal stomatal distribution on both leaf surfaces like the C4 Flaveria species, but with twice larger stomatal size on either leaf surface. In terms of leaf shape, C3 F. cronquistii has linear, elongated leaves, whereas the other Flaveria representatives display elliptic or ovate leaf shapes. At an ecological standpoint, narrower leaves such as those in C3 F. cronquistii perhaps reflect an adaptation in minimizing excessive heat load (Leigh et al., 2017) whilst maximizing net carbon gain (Michaletz et al., 2016) and together with a uniform stomatal distribution and a larger proportion of large stomata allow it to sustain higher gs rates to effect cooling.
Here we used three phylogenetically-controlled comparisons to assess differences between stomatal anatomy and stomatal responses to red and blue light. The C4 species from the genus Cleomaceae and Flaveria in this study did not have a detectable blue light stomatal response, unlike their C3 counterparts. However, perhaps surprisingly, the results demonstrate that the impact of photosynthetic pathway and stomatal morphology and distribution were not as strong as initially hypothesized, but instead varied between genera. Similarly, the quantitative red-light response showed significant species variation but no association with photosynthetic pathway. Altogether, the findings suggest that the evolution of C4 photosynthesis in the dicots may have led to a change in light-regulated stomatal movements, challenge the general nature of previously observed stomatal morphological differences between C3 and C4 species (Zhao et al., 2022) and demonstrate the importance of controlling for evolutionary distance.
The original contributions presented in the study are included in the article/Supplementary Material. Further inquiries can be directed to the corresponding author.
EB: Writing – original draft; Experimentation and analysis. CS: Writing – review & editing. LC: Writing – review & editing. RV: Writing – review & editing. JK: Conceptualization, Writing – review & editing.
EB was funded by the Department of Science and Technology - Science Education Institute (DOST-SEI) under their Foreigh Graduate Scholarships in Specialized and Priority Fields in Science and Technology. EB also acknowledges further financial support from the University of the Philippines Los Baños, the Department of Plant Sciences, University of Cambridge, Emmanuel College, and the University of Cambridge.
EB is grateful to the Institute of Crop Science, College of Agriculture and Food Science, University of the Philippines Los Ban˜os for supporting his PhD endeavor. For the purpose of open access, the author has applied a Creative Commons Attribution (CC BY) license to any Author Accepted Manuscript version arising from this submission.
The authors declare that the research was conducted in the absence of any commercial or financial relationships that could be construed as a potential conflict of interest.
All claims expressed in this article are solely those of the authors and do not necessarily represent those of their affiliated organizations, or those of the publisher, the editors and the reviewers. Any product that may be evaluated in this article, or claim that may be made by its manufacturer, is not guaranteed or endorsed by the publisher.
The Supplementary Material for this article can be found online at: https://www.frontiersin.org/articles/10.3389/fpls.2023.1253976/full#supplementary-material
Ando, E., Kinoshita, T. (2018). Red light-induced phosphorylation of plasma membrane h+-atpase in stomatal guard cells. Plant Physiol. 178, 838–849. doi: 10.1104/pp.18.00544
Ando, E., Kinoshita, T. (2019). Fluence rate dependence of red light-induced phosphorylation of plasma membrane h+-atpase in stomatal guard cells. Plant Signaling Behav. 14, 1561107. doi: 10.1080/15592324.2018.1561107
Arrivault, S., Obata, T., Szeco´wka, M., Mengin, V., Guenther, M., Hoehne, M., et al. (2017). Metabolite pools and carbon flow during c4 photosynthesis in maize: 13co2 labeling kinetics and cell type fractionation. J. Exp. Bot. 68, 283–298. doi: 10.1093/jxb/erw414
Aubry, S., Aresheva, O., Reyna-Llorens, I., Smith-Unna, R. D., Hibberd, J. M., Genty, B. (2016). A specific transcriptome signature for guard cells from the c4 plant Gynandropsis gynandra. Plant Physiol. 170, 1345–1357. doi: 10.1104/pp.15.01203
Bauer, H., Ache, P., Wohlfart, F., Al-Rasheid, K. A., Sonnewald, S., Sonnewald, U., et al. (2013). How do stomata sense reductions in atmospheric relative humidity? Mol. Plant 6, 1703–1706. doi: 10.1093/mp/sst055
Bertolino, L. T., Caine, R. S., Gray, J. E. (2019). Impact of stomatal density and morphology on water-use efficiency in a changing world. Front. Plant Sci. 10, 225. doi: 10.3389/fpls.2019.00225
Bowyer, J., Leegood, R. (1997). “2 - photosynthesis,” in Plant Biochemistry. Eds. Dey, P., Harborne, J. (London: Academic Press), 49–p4. doi: 10.1016/B978-012214674-9/50003-5
Chen, Z.-H., Chen, G., Dai, F., Wang, Y., Hills, A., Ruan, Y.-L., et al. (2017). Molecular evolution of grass stomata. Trends Plant Sci. 22, 124–139. doi: 10.1016/j.tplants.2016.09.005
Christie, J. M. (2007). Phototropin blue-light receptors. Annu. Rev. Plant Biol. 58, 21–45. doi: 10.1146/annurev.arplant.58.032806.103951
Flu¨tsch, S., Santelia, D. (2021). Mesophyll-derived sugars are positive regulators of light-driven stomatal opening. New Phytol. 230, 1754–1760. doi: 10.1111/nph.17322
Fujii, Y., Tanaka, H., Konno, N., Ogasawara, Y., Hamashima, N., Tamura, S., et al. (2017). Phototropin perceives temperature based on the lifetime of its photoactivated state. Proc. Natl. Acad. Sci. 114, 9206–9211. doi: 10.1073/pnas.1704462114
Goh, C.-H. (2009). Phototropins and chloroplast activity in plant blue light signaling. Plant Signaling Behav. 4, 693–695. doi: 10.4161/psb.4.8.8981
Harrison, E. L., Arce Cubas, L., Gray, J. E., Hepworth, C. (2020). The influence of stomatal morphology and distribution on photosynthetic gas exchange. Plant J. 101, 768–779. doi: 10.1111/tpj.14560
Huxman, T. E., Monson, R. (2003). Stomatal responses of C3, C3-C4 and C4Flaveria species to light and intercellular CO2 concentration: implications for the evolution of stomatal behaviour. Plant Cell Environ. 26, 313–322. doi: 10.1046/j.1365-3040.2003.00964.x
Inoue, S.-i., Kinoshita, T., Matsumoto, M., Nakayama, K. I., Doi, M., Shimazaki, K.-I. (2008). Blue light-induced autophosphorylation of phototropin is a primary step for signaling. Proc. Natl. Acad. Sci. 105, 5626–5631. doi: 10.1073/pnas.0709189105
Kostaki, K.-I., Coupel-Ledru, A., Bonnell, V. C., Gustavsson, M., Sun, P., McLaughlin, F. J., et al. (2020). Guard cells integrate light and temperature signals to control stomatal aperture. Plant Physiol. 182, 1404–1419. doi: 10.1104/pp.19.01528
Kromdijk, J., Ubierna, N., Cousins, A. B., Griffiths, H. (2014). Bundle-sheath leakiness in C4 photosynthesis: a careful balancing act between co2 concentration and assimilation. J. Exp. Bot. 65, 3443–3457. doi: 10.1093/jxb/eru157
Lambers, H., Oliveira, R. (Eds.) (2019). Plant Physiological Ecology (Switzerland: Springer Nature). doi: 10.1007/978-3-030-29639-1
Lawson, T., Lefebvre, S., Baker, N. R., Morison, J. I., Raines, C. A. (2008). Reductions in mesophyll and guard cell photosynthesis impact on the control of stomatal responses to light and CO2. J. Exp. Bot. 59, 3609–3619. doi: 10.1093/jxb/ern211
Lawson, T., Simkin, A. J., Kelly, G., Granot, D. (2014). Mesophyll photosynthesis and guard cell metabolism impacts on stomatal behaviour. New Phytol. 203, 1064–1081. doi: 10.1111/nph.12945
Leegood, R. C., von Caemmerer, S. (1988). The relationship between contents of photosynthetic metabolites and the rate of photosynthetic carbon assimilation in leaves of Amaranthus edulis l. Planta 174, 253–262. doi: 10.1007/BF00394779
Leigh, A., Sevanto, S., Close, J., Nicotra, A. (2017). The influence of leaf size and shape on leaf thermal dynamics: does theory hold up under natural conditions? Plant Cell Environ. 40, 237–248. doi: 10.1111/pce.12857
Matrosova, A., Bogireddi, H., Mateo-Pen˜as, A., Hashimoto-Sugimoto, M., Iba, K., Schroeder, J. I., et al. (2015). The ht1 protein kinase is essential for red light-induced stomatal opening and genetically interacts with ost1 in red light and co2-induced stomatal movement responses. New Phytol. 208, 1126–1137. doi: 10.1111/nph.13566
Messinger, S. M., Buckley, T. N., Mott, K. A. (2006). Evidence for involvement of photosynthetic processes in the stomatal response to co2. Plant Physiol. 140, 771–778. doi: 10.1104/pp.105.073676
Michaletz, S. T., Weiser, M. D., McDowell, N. G., Zhou, J., Kaspari, M., Helliker, B. R., et al. (2016). The energetic and carbon economic origins of leaf thermoregulation. Nat. Plants 2, 1–9. doi: 10.1038/nplants.2016.129
Monson, R. K. (1996). The use of phylogenetic perspective in comparative plant physiology and development biology. Ann. Missouri Botanical Garden 86, 3–16. doi: 10.2307/2399963
Mott, K. A. (1988). Do stomata respond to co2 concentrations other than intercellular? Plant Physiol. 86, 200–203. doi: 10.1104/pp.86.1.200
Mott, K. A. (2009). Opinion: stomatal responses to light and CO2 depend on the mesophyll. Plant Cell Environ. 32, 1479–1486. doi: 10.1111/j.1365-3040.2009.02022.x
Posit Team (2023). RStudio: Integrated Development Environment for R (Boston, MA: Posit Software, PBC). Available at: http://www.posit.co/.
R Core Team (2023). R: A language and environment for statistical computing (Vienna, Austria: R Foundation for Statistical Computing). Available at: https://www.R-project.org/.
Roelfsema, M. R. G., Hanstein, S., Felle, H. H., Hedrich, R. (2002). Co2 provides an intermediate link in the red light response of guard cells. Plant J. 32, 65–75. doi: 10.1046/j.1365-313X.2002.01403.x
Sage, R. F. (2004). The evolution of C4 photosynthesis. New Phytol. 161, 341–370. doi: 10.1111/j.1469-8137.2004.00974.x
Sage, R. F. (2016). Tracking the evolutionary rise of C4 metbolism. J. Exp. Bot. 67, 2919–2922. doi: 10.1093/jxb/erw137
Sakamoto, K., Briggs, W. R. (2002). Cellular and subcellular localization of phototropin 1. Plant Cell 14, 1723–1735. doi: 10.1105/tpc.003293
Schindelin, J., Arganda-Carreras, I., Frise, E., Kaynig, V., Longair, M., Pietzsch, T., et al. (2012). Fiji: an open-source platform for biological-image analysis. Nat. Methods 9, 676–682. doi: 10.1038/nmeth.2019
Shimazaki, K.-i., Doi, M., Assmann, S. M., Kinoshita, T. (2007). Light regulation of stomatal movement. Annu. Rev. Plant Biol. 58, 219–247. doi: 10.1146/annurev.arplant.57.032905.105434
Suetsugu, N., Takami, T., Ebisu, Y., Watanabe, H., Iiboshi, C., Doi, M., et al. (2014). Guard cell chloroplasts are essential for blue light-dependent stomatal opening in Arabidopsis. PloS One 9, e108374. doi: 10.1371/journal.pone.0108374
Takemiya, A., Sugiyama, N., Fujimoto, H., Tsutsumi, T., Yamauchi, S., Hiyama, A., et al. (2013). Phosphorylation of blus1 kinase by phototropins is a primary step in stomatal opening. Nat. Commun. 4, 1–8. doi: 10.1038/ncomms3094
Taylor, S., Franks, P., Hulme, S., Spriggs, E., Christin, P., Edwards, E., et al. (2012). Photosynthetic pathway and ecological adaptation explain stomatal trait diversity amongst grasses. New Phytol. 193, 387–396. doi: 10.1111/j.1469-8137.2011.03935.x
Taylor, S. H., Hulme, S. P., Rees, M., Ripley, B. S., Ian Woodward, F., Osborne, C. P. (2010). Ecophysiological traits in c3 and c4 grasses: a phylogenetically controlled screening experiment. New Phytol. 185, 780–791. doi: 10.1111/j.1469-8137.2009.03102.x
Vialet-Chabrand, S., Matthews, J. S., Lawson, T. (2021). Light, power, action! interaction of respiratory energy-and blue light-induced stomatal movements. New Phytol. 231, 2231–2246. doi: 10.1111/nph.17538
Wickham, H. (2016). enGgplot2: Elegant graphics for data analysis. Use R!. 2 edn (Cham, Switzerland: Springer International Publishing).
Wickham, H. (2016). ggplot2: Elegant Graphics for Data Analysis. (Verlag New York: Springer). Available at: https://ggplot2.tidyverse.org.
Xu, Z., Jiang, Y., Jia, B., Zhou, G. (2016). Elevated-co2 response of stomata and its dependence on environmental factors. Front. Plant Sci. 7, 657. doi: 10.3389/fpls.2016.00657
Zhao, Y.-Y., Lyu, M. A., Miao, F., Chen, G., Zhu, X.-G. (2022). The evolution of stomatal traits along the trajectory toward c4 photosynthesis. Plant Physiol. 190, 441–458. doi: 10.1093/plphys/kiac252
Zhen, S., Bugbee, B. (2020). Steady-state stomatal responses of c3 and c4 species to blue light fraction: Interactions with CO2 concentration. Plant Cell Environ. 43, 3020–3032. doi: 10.1111/pce.13888
Keywords: photosynthesis, blue light, red light, stomata, stomatal conductance, Cleomaceae, Flaveria, Alloteropsis
Citation: Bernardo EL, Sales CRG, Cubas LA, Vath RL and Kromdijk J (2023) A comparison of stomatal conductance responses to blue and red light between C3 and C4 photosynthetic species in three phylogenetically-controlled experiments. Front. Plant Sci. 14:1253976. doi: 10.3389/fpls.2023.1253976
Received: 06 July 2023; Accepted: 11 September 2023;
Published: 27 September 2023.
Edited by:
Davide Guerra, Council for Agricultural and Economics Research (CREA), ItalyReviewed by:
Zi-Shan Zhang, Shandong Agricultural University, ChinaCopyright © 2023 Bernardo, Sales, Cubas, Vath and Kromdijk. This is an open-access article distributed under the terms of the Creative Commons Attribution License (CC BY). The use, distribution or reproduction in other forums is permitted, provided the original author(s) and the copyright owner(s) are credited and that the original publication in this journal is cited, in accordance with accepted academic practice. No use, distribution or reproduction is permitted which does not comply with these terms.
*Correspondence: Johannes Kromdijk, ams0MTdAY2FtLmFjLnVr
Disclaimer: All claims expressed in this article are solely those of the authors and do not necessarily represent those of their affiliated organizations, or those of the publisher, the editors and the reviewers. Any product that may be evaluated in this article or claim that may be made by its manufacturer is not guaranteed or endorsed by the publisher.
Research integrity at Frontiers
Learn more about the work of our research integrity team to safeguard the quality of each article we publish.