 Yamama Naciri1,2*†Zeynep Toprak1,2,3†Honor C. Prentice4Laetitia Hugot5Angelo Troia6Concetta Burgarella7Josep Lluis Gradaille8Daniel Jeanmonod1,2
- 1Unité Systématique et Médiation, Conservatoire et Jardin botaniques de Genève, Geneva, Switzerland
- 2Plant Systematics and Biodiversity Laboratory, Department of Botany and Plant Biology, University of Geneva, Geneva, Switzerland
- 3Department of Molecular Biology and Genetic, Faculty of Sciences, University of Dicle, Diyarbakir, Turkey
- 4Department of Biology, Lund University, Lund, Sweden
- 5Conservatoire botanique national de Corse, Office de l’Environment de la Corse, Corte, France
- 6Dipartimento di Scienze e Tecnologie Biologiche, Chimiche e Farmaceutiche, Università degli Studi di Palermo, Palermo, Italy
- 7Department of Organismal Biology, Uppsala University, Uppsala, Sweden
- 8Jardí Botànic de Sóller, Palma, Spain
Recent divergence can obscure species boundaries among closely related taxa. Silene section Italicae (Caryophyllaceae) has been taxonomically controversial, with about 30 species described. We investigate species delimitation within this section using 500 specimens sequenced for one nuclear and two plastid markers. Despite the use of a small number of genes, the large number of sequenced samples allowed confident delimitation of 50% of the species. The delimitation of other species (e.g., Silene nemoralis, S. nodulosa and S. andryalifolia) was more challenging. We confirmed that seven of the ten chasmophyte species in the section are not related to each other but are, instead, genetically closer to geographically nearby species belonging to Italicae yet growing in open habitats. Adaptation to chasmophytic habitats therefore appears to have occurred independently, as a result of convergent evolution within the group. Species from the Western Mediterranean Basin showed more conflicting species boundaries than species from the Eastern Mediterranean Basin, where there are fewer but better-delimited species. Significant positive correlations were found between an estimation of the effective population size of the taxa and their extent of occurrence (EOO) or area of occupancy (AOO), and negative but non-significant correlations between the former and the posterior probability (PP) of the corresponding clades. These correlations might suggest a lower impact of incomplete lineage sorting in species with low effective population sizes and small distributional ranges compared with that in species inhabiting large areas. Finally, we confirmed that S. italica and S. nemoralis are distinct species, that S. nemoralis might furthermore include two different species and that S. velutina from Corsica and S. hicesiae from the Lipari Islands are sister species.
Introduction
Silene L. is the largest genus in the family Caryophyllaceae (Greuter, 1995; Melzheimer, 1988; Bittrich, 1993) with about 870 species described around the world (Jafari et al., 2020). The genus is native to all continents apart from Australia and Antarctica, and has two main hotspots of diversity. The first, hosting more than half of the known species, is located in the Mediterranean area and the second is found in South-West Asia (Zohary, 1973; Polunin, 1980; Greuter, 1995). There are also two main centers of endemism in the Mediterranean area: Turkey and Greece, with 45 and 38% of endemic species, respectively (Coode and Cullen, 1967; Davis, 1971; Greuter, 1997; Trigas et al., 2007; Yıldız et al., 2009; Yıldız and Çırpıcı, 2013).
According to the latest revisions, the genus Silene is divided into three subgenera; S. subg. Silene, S. subg. Behenantha (Otth) Endl. and S. subg. Lychnis (L.) Greuter (Greuter, 1995; Jafari et al., 2020). The delimitation of the first two subgenera is supported by several earlier phylogenetic studies (e.g., Oxelman et al., 2001; Petri and Oxelman, 2011; Aydin et al., 2014a). Uncertainties, however, exist at lower taxonomic levels and the many co-existing sectional, subsectional, group and series rankings illustrate the taxonomic complexity of the genus. Silene section Siphonomorpha Otth is an example of this complexity within subg. Silene. The section has had a range of different taxonomic circumscriptions, and Naciri et al. (2017) showed that section Siphonomorpha, as defined by Coode and Cullen (1967) and Yıldız and Çırpıcı (2013), is not supported phylogenetically. Naciri et al. (2017) therefore suggested extending Siphonomorpha to include members of 13 previously defined sections (Saxifragoideae, Coronatae, Tataricae, Chloranthae, Barbeyanae, Nanosilene, Otites, Koreanae, Brachypodae, Graminiformes, Longitubulosae, Dianthoidea, Holopetalae). Within the “extended Siphonomorpha” group of Naciri et al. (2017), three sections were found to be monophyletic, with high support: Paradoxae Greuter with four species (possibly five with S. schwarzenbergerii), Italicae (Rohrb.) Schischk., with 31 species (including, for example, S. italica (L.) Pers. and S. nemoralis Waldst. and Kit.), and Siphonomorpha sensu Greuter (1995) with nine species, including S. nutans (Table 1). A fourth clade, Giganteae, comprising a unique species [S. gigantea (L) L.], still awaits a formal sectional description (Du Pasquier, 2016; Du Pasquier et al., 2017). Italicae, Paradoxae, Siphonomorpha and Giganteae are genetically close to each other but their exact phylogenetic relationships are still not well-resolved (Naciri et al., 2017; Jafari et al., 2020). Although the analysis by Jafari et al. (2020) covers a high number of Silene species and specimens, and further extended the definition of the Siphonomorpha section, the study only included around half of the species from Italicae, Paradoxae, Siphonomorpha and Giganteae. In the present study, we use the classification of Naciri et al. (2017), because the focus of the study is put on interspecific relationships within the section Italicae, rather than on the relationships between Italicae and other sections. Italicae, Giganteae, Siphonomorpha s.s and Paradoxae therefore refer to the sections defined in Naciri et al. (2017). Our study includes 73% of all species from Italicae, Paradoxae, Siphonomorpha and Giganteae (84, 80, 22, and 100%, respectively).
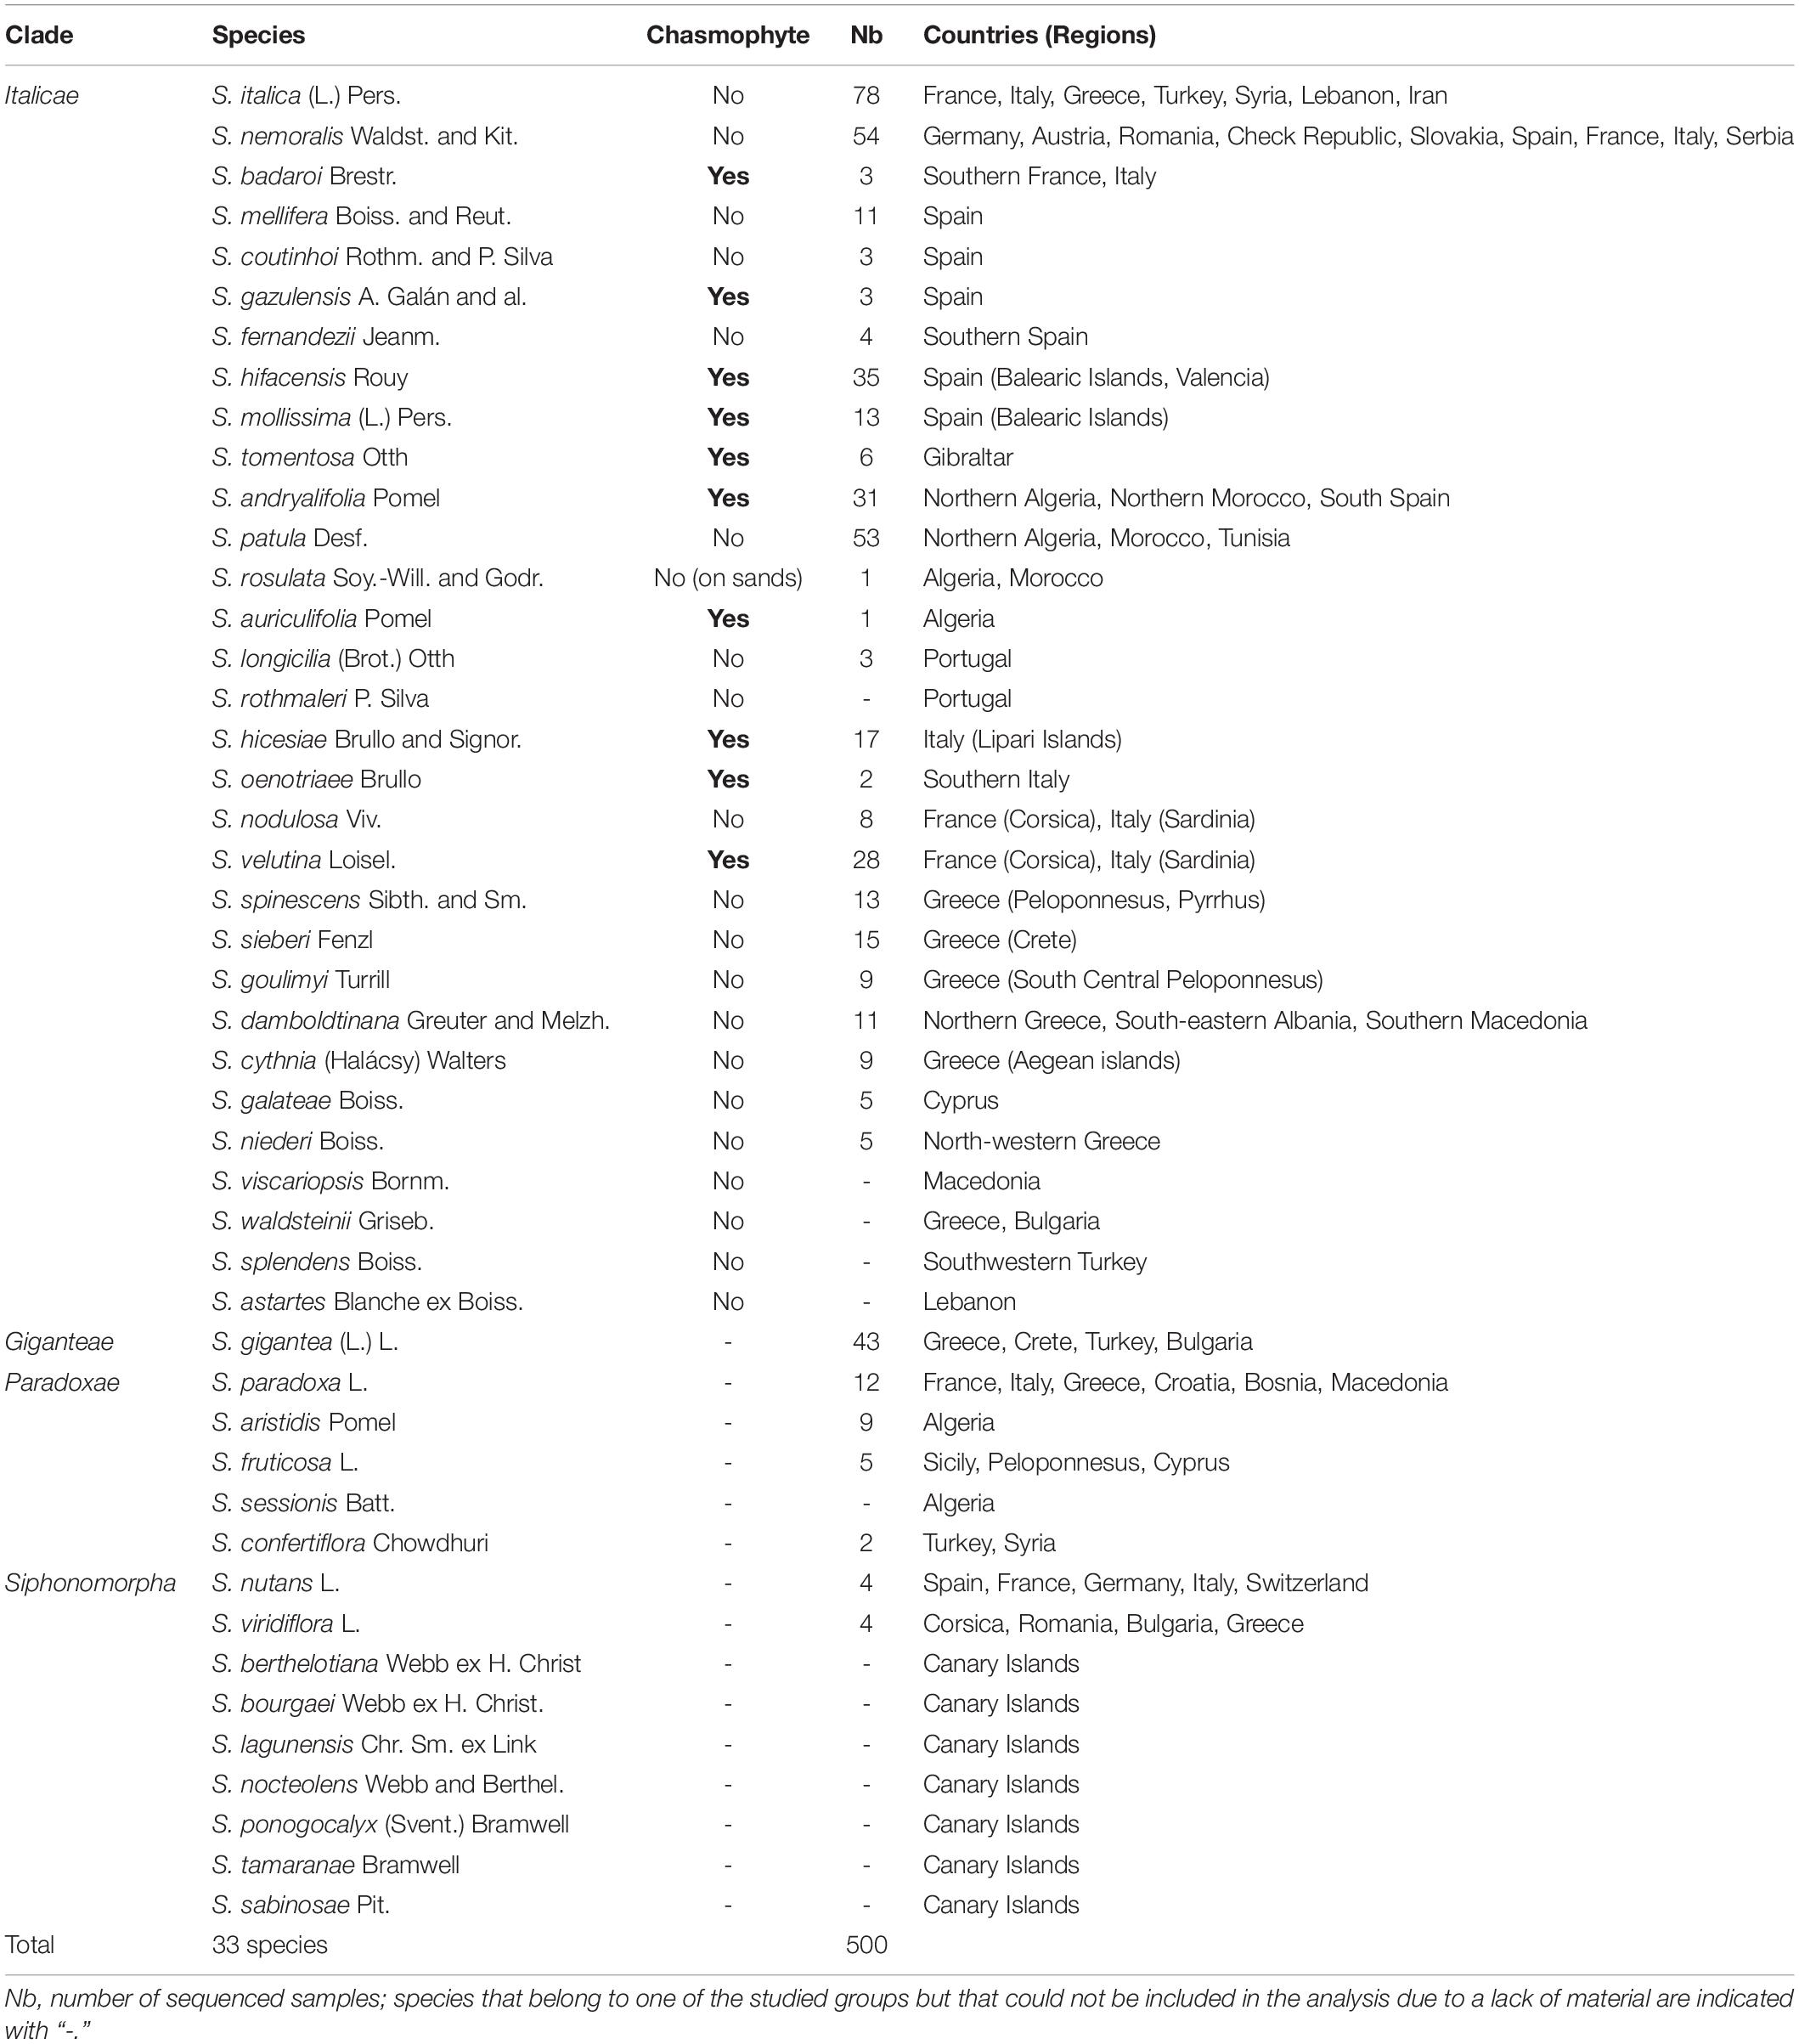
Table 1. List of the sampled species, their chasmophytic status, their distribution area and the number of specimens sequenced for each.
The species within Italicae are distributed around the Mediterranean area. All the species studied so far are diploids, with a chromosome number of 2n = 24 (Jeanmonod, 1984a,b, 1985a; Chater et al., 1993; Yıldız and Çırpıcı, 2013) and they are hermaphrodite to gynodioecious. The western species of the section are distributed from Morocco to Tunisia in North Africa and from Portugal to Italy in Europe (Jeanmonod, 1984a,b, 1985a,1985b). The eastern species grow from the Balkan Peninsula, Greece, Western Turkey and Cyprus to Syria and, possibly, Lebanon (Du Pasquier et al., 2017). Despite several recent studies (Yıldız and Çırpıcı, 2013; Du Pasquier et al., 2017; Naciri et al., 2017) the speciation and diversification patterns of the western species of Italicae are still under discussion. Moreover, the evolution of the chasmophyte species within the group is poorly understood. Jeanmonod (1984a; 1984b) suggested that the seven chasmophytic species of the Western Mediterranean Basin [S. mollissima (L.) Pers., S. velutina Loisel., S. tomentosa Otth, S. hicesiae Brullo and Signor., S. hifacensis Rouy, S. andryalifolia Pomel and S. auriculifolia Pomel] were all derived from a chasmophytic ancestor that diverged from the ancestor of the remaining Italicae species during, or shortly after, the Messinian Crisis, around 5 million years ago (MYA; Gautier et al., 1994). These taxa are all characterized, among other traits, by woody and long-lived roots, numerous sterile basal rosettes (that are present at anthesis), and condensed inflorescences in a verticillaster with many flowers and short internodes. Jeanmonod (1984a; 1984b) referred to these seven western chasmophytes as the Mollissima group. Three additional chasmophytic species were subsequently added to this group: S. badaroi Brestr. (= S. tyrrhenia Jeanm. and Boquet; Jeanmonod and Bocquet, 1983) in South France and Italy, S. oenotriae Brullo in South Italy (Brullo, 1998) and S. gazulensis A. Galán et al. in Spain (Galán de Mera et al., 1999). Du Pasquier et al. (2017) reported that S. gigantea, the sole member of Giganteae, which is a sister group to Italicae, started to diversify as recently as 1.2 MYA. The results of Naciri et al. (2017) revealed that the diversification of Italicae was somewhat older than that of Giganteae—but less than 5 MYA which contradicts Jeanmonod (1984a,b) hypothesis about the divergence time of the Mollissima group.
Another explanation for the morphological similarity of the Mollissima species is that selection within harsh, rocky habitats has led to convergent evolution, with selection for similar morphologies within different lineages. Du Pasquier et al. (2017) showed that the chasmophytic characters associated with S. gigantea ssp. gigantea (i.e., flowers condensed in verticillasters and rosette leaves remaining green throughout the flowering period), appeared several times in the course of evolution. Đurović et al. (2017) showed within the Silene saxifraga alliance that similar morphologies were found in different, geographically shaped lineages that did not coincide with taxonomic identities. Among other processes, they highlighted the role of convergent morphological evolution to explain this pattern. Consequently, the similarities among the species of the Mollissima group may be explained either by a common ancestry or by convergent evolution, and resolution of the phylogenetic relationships among all the species of the section Italicae is required to be able to understand the evolution of the chasmophytic taxa.
An additional interesting feature of the species of Italicae is related to their population sizes and distributional ranges. Naciri et al. (2017) showed, on the basis of a relatively small sample size, that the species-boundaries within the western group of taxa appear to be less distinct than within the eastern group of species. The western species have, on average, wider distributional ranges than the eastern ones and it may be assumed that this correlates with higher average population effective sizes. The larger population sizes within species the more incomplete lineage sorting may be expected—blurring species boundaries (Naciri and Linder, 2015) and providing a possible explanation for the apparently fuzzier delimitation of the western species.
The present study is based on 500 specimens from Italicae, Paradoxae, Siphonomorpha and Giganteae, as defined in Naciri et al. (2017), sequenced for two plastid intergenic spacers and one nuclear ribosomal marker. The sequence data were analyzed in a Bayesian framework using the Multi-Species Coalescent (MSC) approach and we characterized each species’ distributional range using known occurrences from herbarium specimens. The study had three central aims: (1) Which relationships do the species of the Mollissima group have within Italicae—do they cluster into a single group, or do they represent unrelated species whose morphological resemblance is due to convergent evolution in rocky habitats? (2) Are species boundaries indeed less distinct in the Western Mediterranean Basin (WMB) than in the Eastern Basin (EMB) using a large sample of species and individuals? (3) Does incomplete lineage sorting (ILS) explain the observed pattern of phylogenetic variation?
Materials and Methods
Plant Material and Molecular Data
A total of 500 samples providing a general coverage of the distributional areas of the studied groups was used. The main sampling effort focused on Italicae species with 421 specimens over 500 (84.2%). The remaining specimens belong to Giganteae (43; 8.6%), Paradoxae (28; 5.6%) and Siphonomorpha s.s. (8; 1.6%) as outgroups. The DNA samples included in the study were extracted from the Geneva herbarium (G) specimens, except for S. hicesiae, S. hifacensis, S. velutina and S. mollissima for which leaf samples preserved in silica gel were used. Table 1 provides a list of the species included in the study and the number of individuals that were sequenced for each of them. For widespread species, individuals were selected from different populations so as to represent the taxon’s geographic range. When available, existing information obtained in the laboratory of the Conservatoire et Jardin botaniques de Genève (CJBG) on intraspecific genetic variation was used. We selected individuals that represent the range of variation within the species of Silene patula (Naciri et al., 2010) and S. paradoxa, S. aristidis and S. fruticosa (Leuzinger et al., 2015). The results of Prentice et al. (2003) were used to select the individuals that would be subsequently sequenced in S. hifacensis. Additional information about voucher specimens preserved in G, is presented in Supplementary Table 1 together with Genbank numbers.
DNA sequencing was carried out as described in Naciri et al. (2010) and Naciri et al. (2017). The plastid DNA intergenic regions trnH-psbA and trnS-trnG, and the nuclear ribosomal Internal Transcribed Spacer (ITS) were sequenced for all individuals in the CJBG laboratory and the resulting sequence data set included no missing data (Supplementary Table 1). The locus trnH-psbA was selected as it is one of the most diverse plastid ones in Angiosperms and was accordingly suggested as a suitable barcode for plants in addition to matK and rbcL that are less diverse within species (Hollingsworth et al., 2011). The plastid trnS-trnG was also shown to be informative and polymorphic in many species of Silene and was used extensively in our laboratory (Naciri et al., 2010; Leuzinger et al., 2015; Du Pasquier et al., 2017 among others). The sequences produced and used for the first time (522) represented 34.8% of the total included in this study (trnH-psbA: 43.8%; trnS-trnG: 46.0%; ITS: 14.6%).
Sequence Alignments
Multiple alignments were performed using MUSCLE implemented in Geneious version 6.1.8. (available from https://www.geneious.com) with the default options. For the three loci, we first performed the alignment on a small subset of sequences (100), then the remaining sequences were added to the existing alignment using MAFFT version 7 (Katoh et al., 2002; Katoh and Standley, 2013). Each set of the alignment was visually checked to make sure that nucleotides were consistently aligned, and alignments were manually adjusted if necessary. The two plastid loci trnS-trnG and trnH-psbA were concatenated in Geneious. Indels were coded using the approach of Simmons and Ochoterena (2000), applying the principle of “simple gap coding,” that consists in accounting for indels by replacing them in the alignment and imposing transversions instead (see Naciri et al., 2017). Substitution models were chosen on the basis of the AICc model selection criterion (Akaike’s information criterion) by running the software jModelTest2 0.1 0.10 v20160303 (Darriba et al., 2012) for both ITS and the concatenated plastid dataset. For the latter dataset jModeltest was used before and after indel coding to check for its impact on substitution model.
Phylogenetic Analyses Under the Multi-Species Coalescent
We used the program STACEY implemented in BEAST2 (Jones et al., 2015; Jones, 2017) to estimate the species tree under the multispecies coalescent model, with no a priori assignment of sequences to the putative species (Drummond and Rambaut, 2007; Drummond et al., 2012; Bouckaert et al., 20141).
Two input files were prepared using the STACEY template (Jones et al., 2015; Jones, 2017) implemented in BEAUTi2 (Bouckaert et al., 2014) including all the genes but with different priors. In order to minimize possible convergence problems, a starting tree obtained from the ITS data matrix by running the analyses for 50 million iterations in BEAST2, was manually added into both input xml files. For the first one, we set a general time reversible model with a gamma distribution prior and invariable sites (GTR + I + G) as the substitution model for the ITS region. For the concatenated plastid loci, we set a three-parameter model with a gamma distribution, and invariable sites (TPM1uf + I + G), with 4.0 as the “gamma category count” and 1.0 as the “shape.” We used an uncorrelated lognormal relaxed clock for both regions (mean 1.0; standard deviation 1.25) and a gamma distribution with default options on their standard deviations. The mean substitution rate of ITS was fixed to 1.0. For the plastid loci, the ploidy level was set to half (1.0) that of ITS (2.0). We set the species tree prior with the default settings. A log normal prior (mean 4.6, standard deviation 2.0) was selected for the species tree growth rate (bdcGrowthRate.t:Species). The collapse weight parameter that controls the number of possible clusters in the data set (ω; see Jones et al., 2015; Jones, 2017) was set to a Beta distribution (alpha and beta = 1.0) and a lognormal prior (mean = −7.0; standard deviation = 2.0) was set on the “popPriorScale” for population sizes. Substitution parameters for the plastid and nuclear markers were specified with an exponential distribution using the default options. A Beta prior with alpha = 1.0 and beta = 8.0 was set for the relative death parameter “relativeDeathRate.t:Species”. The second input file differed from the first one by the mean and standard deviation (1.0; 1.25, respectively) of the lognormal prior set on the “popPriorScale” for population sizes and gamma distributions specified with the default values for the substitution parameters.
The two input files were analyzed on several personal computers due to restrictions for long runs on the University cluster. For both input files, three independent chains were run for lengths of 2.1 billion generations each, by logging every 50,000 tracelog, and 2,000,000 trees. For each of the two input files the resulting tree files and log files were combined using LogCombiner after discarding the first 10% of the iterations as burn-in. We used the program Tracer version v1.6.0 (Rambaut and Drummond, 2007; Rambaut et al., 2013) to evaluate the convergence of each parameter in each run. The combined tree files were processed with Tree Annotator version 2.4.4 (Bouckaert et al., 2014). The species tree as well as the individual gene trees were visualized using the FigTree version 1.4.3 (Rambaut, 20092).
Species Delimitation
After the STACEY analyses, the species tree file was processed with the Species Delimitation Analyzer tool (SDA, see Jones et al., 2015; Jones, 2017) to estimate the content of the minimal SDA-clusters, using the following parameters: no burn-in as it was already taken into account when combining the three independent runs, 1.10–4 collapse height, and 1.0 similarity cut off. SDA generates a two dimensional similarity matrix, where posterior probabilities of sequence pairs belonging to the same minimal cluster are estimated. To visualize the similarity matrix and the associated SDA-clusters, we used the R code provided by Jones et al. (2015) and Jones (2017) modified by Simon Crameri. This code allows for automated pairwise similarity matrix sorting, labeling, and line drawing. We used an automatic threshold of PP = 0.01 to delineate adjacent SDA-clusters considered as putative species. SDA-clusters therefore generally contain all individuals that fall within the same clade and that have pairwise PP-values higher than 0.01 to belong to the same cluster. We then adjusted the number of final clusters (called Groups hereafter) to take into account the fact that SDA-clusters may represent genetic structure within species as well as interspecific differentiation [see Sukumaran and Knowles (2017)]. As recommended by Jones et al. (2015), we used a combination of clade supports in the species tree and of the pairwise similarity matrix to aid further considerations about species memberships. The program was run in R version 3.3.1 (R Development Core Team, 2014) and the code is available on GitHub repository3.
Estimation of Distributional Ranges
Species or Group distributional ranges were estimated using the extent of occurrence (EOO) and area of occupancy (AOO). EOO is defined as the area covered by the minimum convex polygon encompassing all the known sites of occurrence of a given taxon. It might include large areas of obviously unsuitable habitats. The AOO of a taxon is defined as the area within its EOO for which its presence is certified by a record of occurrence according to a given grid. The measure reflects the fact that a taxon will not usually occur throughout its EOO but is, however, highly dependent on the sampling effort. EOO and AOO for each Group were estimated using the program GeoCat (Bachman et al., 2011), using a square mesh of 2 km2. We used curated georeferenced specimens taken from the GBIF repository4 as input data in GeoCat (see Supplementary Files). When the Groups contained two or more species, the areas of the species were calculated for all species together. In order to consider only terrestrial surfaces and avoid biases among continental species and those with a very fragmented insular distribution, the EOO of the concerned species was corrected to remove marine areas within the distributional range as follows: the polygon containing all the occurrences (EOO) produced in GeoCAT was superimposed on the official European administrative boundaries data from Eurostat (statistical office of the European Union5). The percentage of marine areas was then accurately estimated and the corrected EOO was reduced accordingly. The correction was necessary for two thirds of the groups and are given in Table 2. The correlation between the log of distributional ranges (either EOO or AOO) and posterior probabilities (PP) of the clades that best corresponded to each Group was then tested using Pearson’s product-moment as well as Spearman and Kendall rank correlation tests (Sokal and Rohlf, 1995) in R (R Development Core Team, 2014).
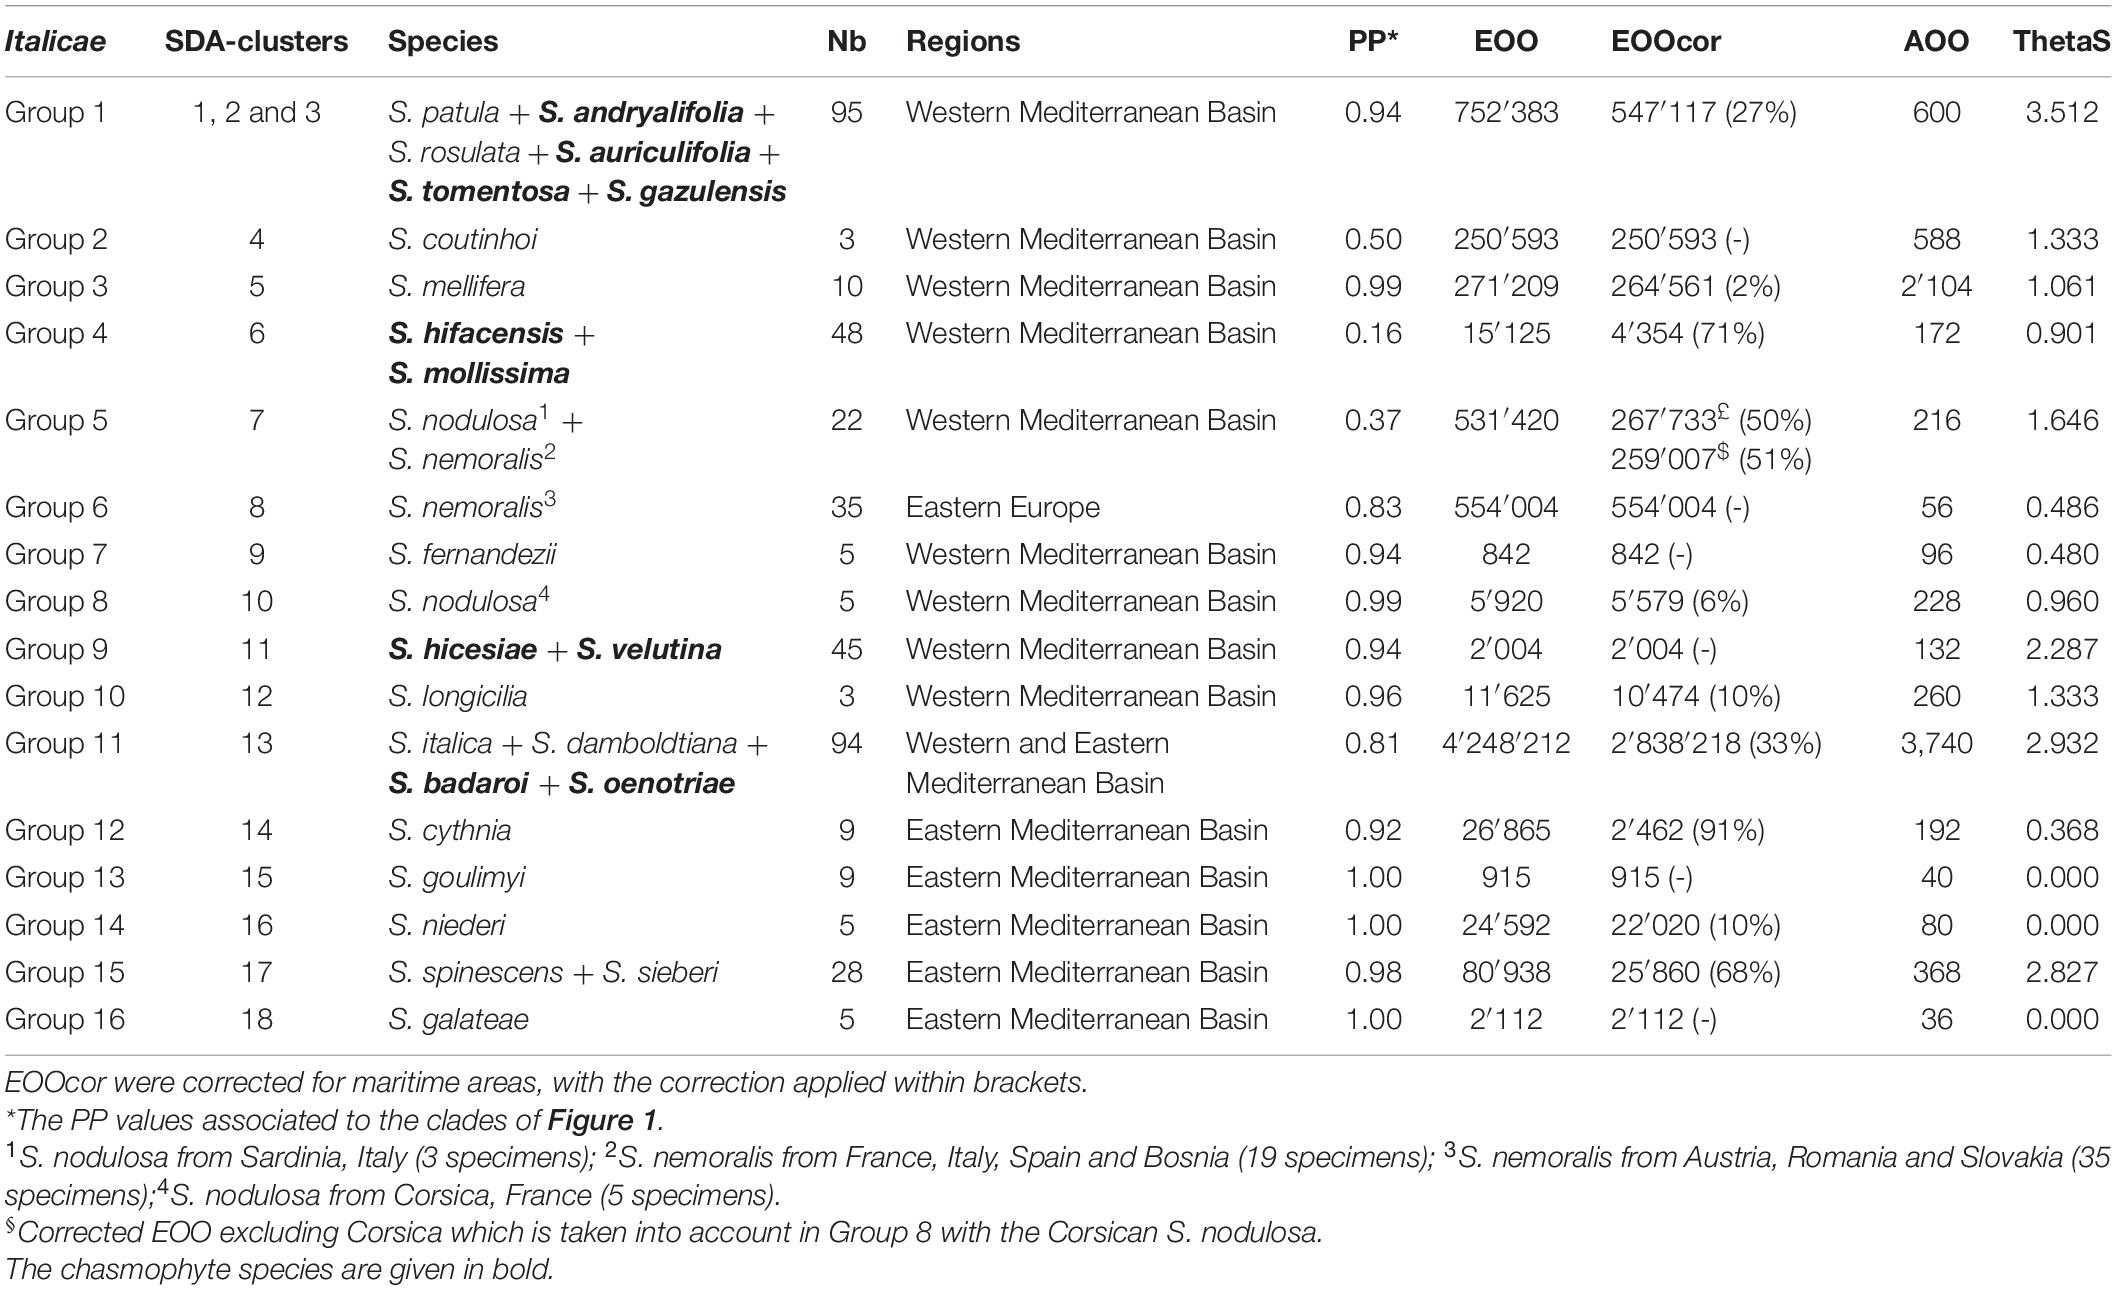
Table 2. Composition of the 16 final groups within Italicae, ranked from top to down in Figure 1 and SDA-clusters in Figure 2, with their associated ThetaS as an estimation of θ, extend of occurrence (EOO) and area of occupancy (AOO) in km2 as computed in GeoCAT.
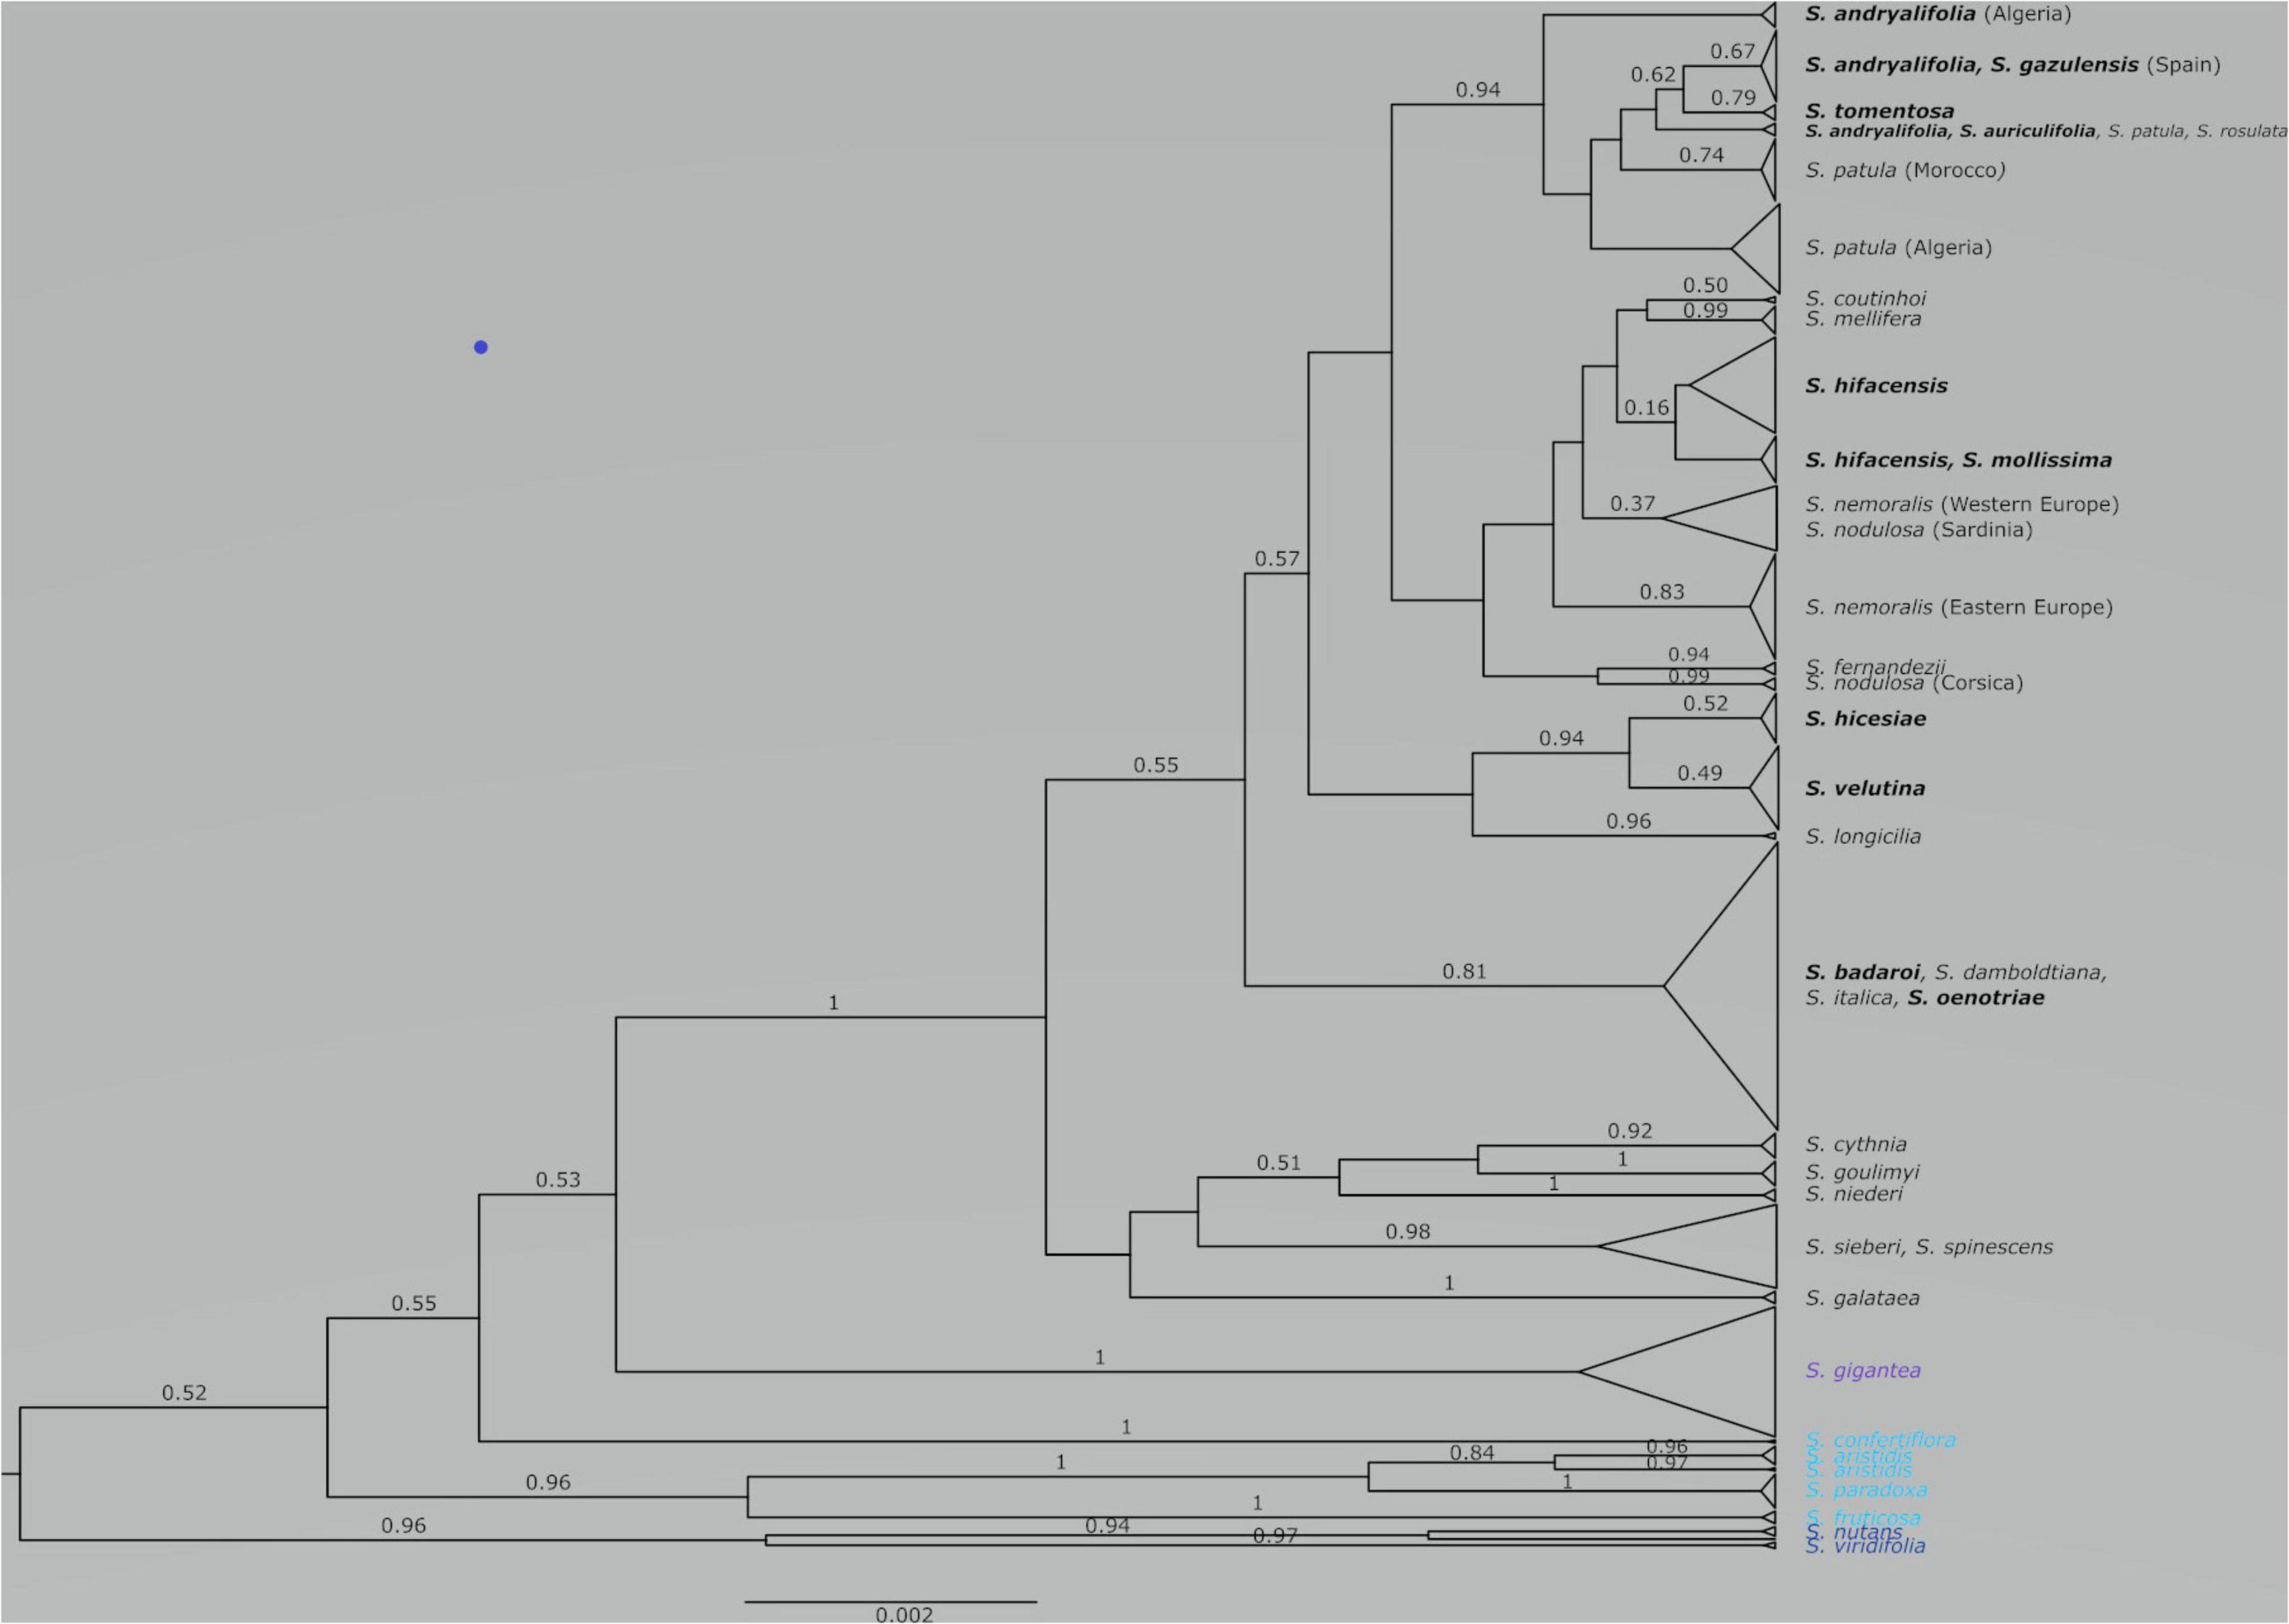
Figure 1. Species tree obtained from the combination of three runs using STACEY on two linked plastid regions (trnH-psbA and trnS-trnG) and one nuclear marker (ITS). With some exceptions, posterior probabilities that are equal or higher than 0.50 are given above the corresponding branches. The scale at bottom is given in substitutions/site. The chasmophytic species are indicated in bold. The species belonging to Italicae are shown in black whereas the species included in Giganteae, Paradoxae and Siphonomorpha s.s. are shown in violet, blue and dark blue, respectively.
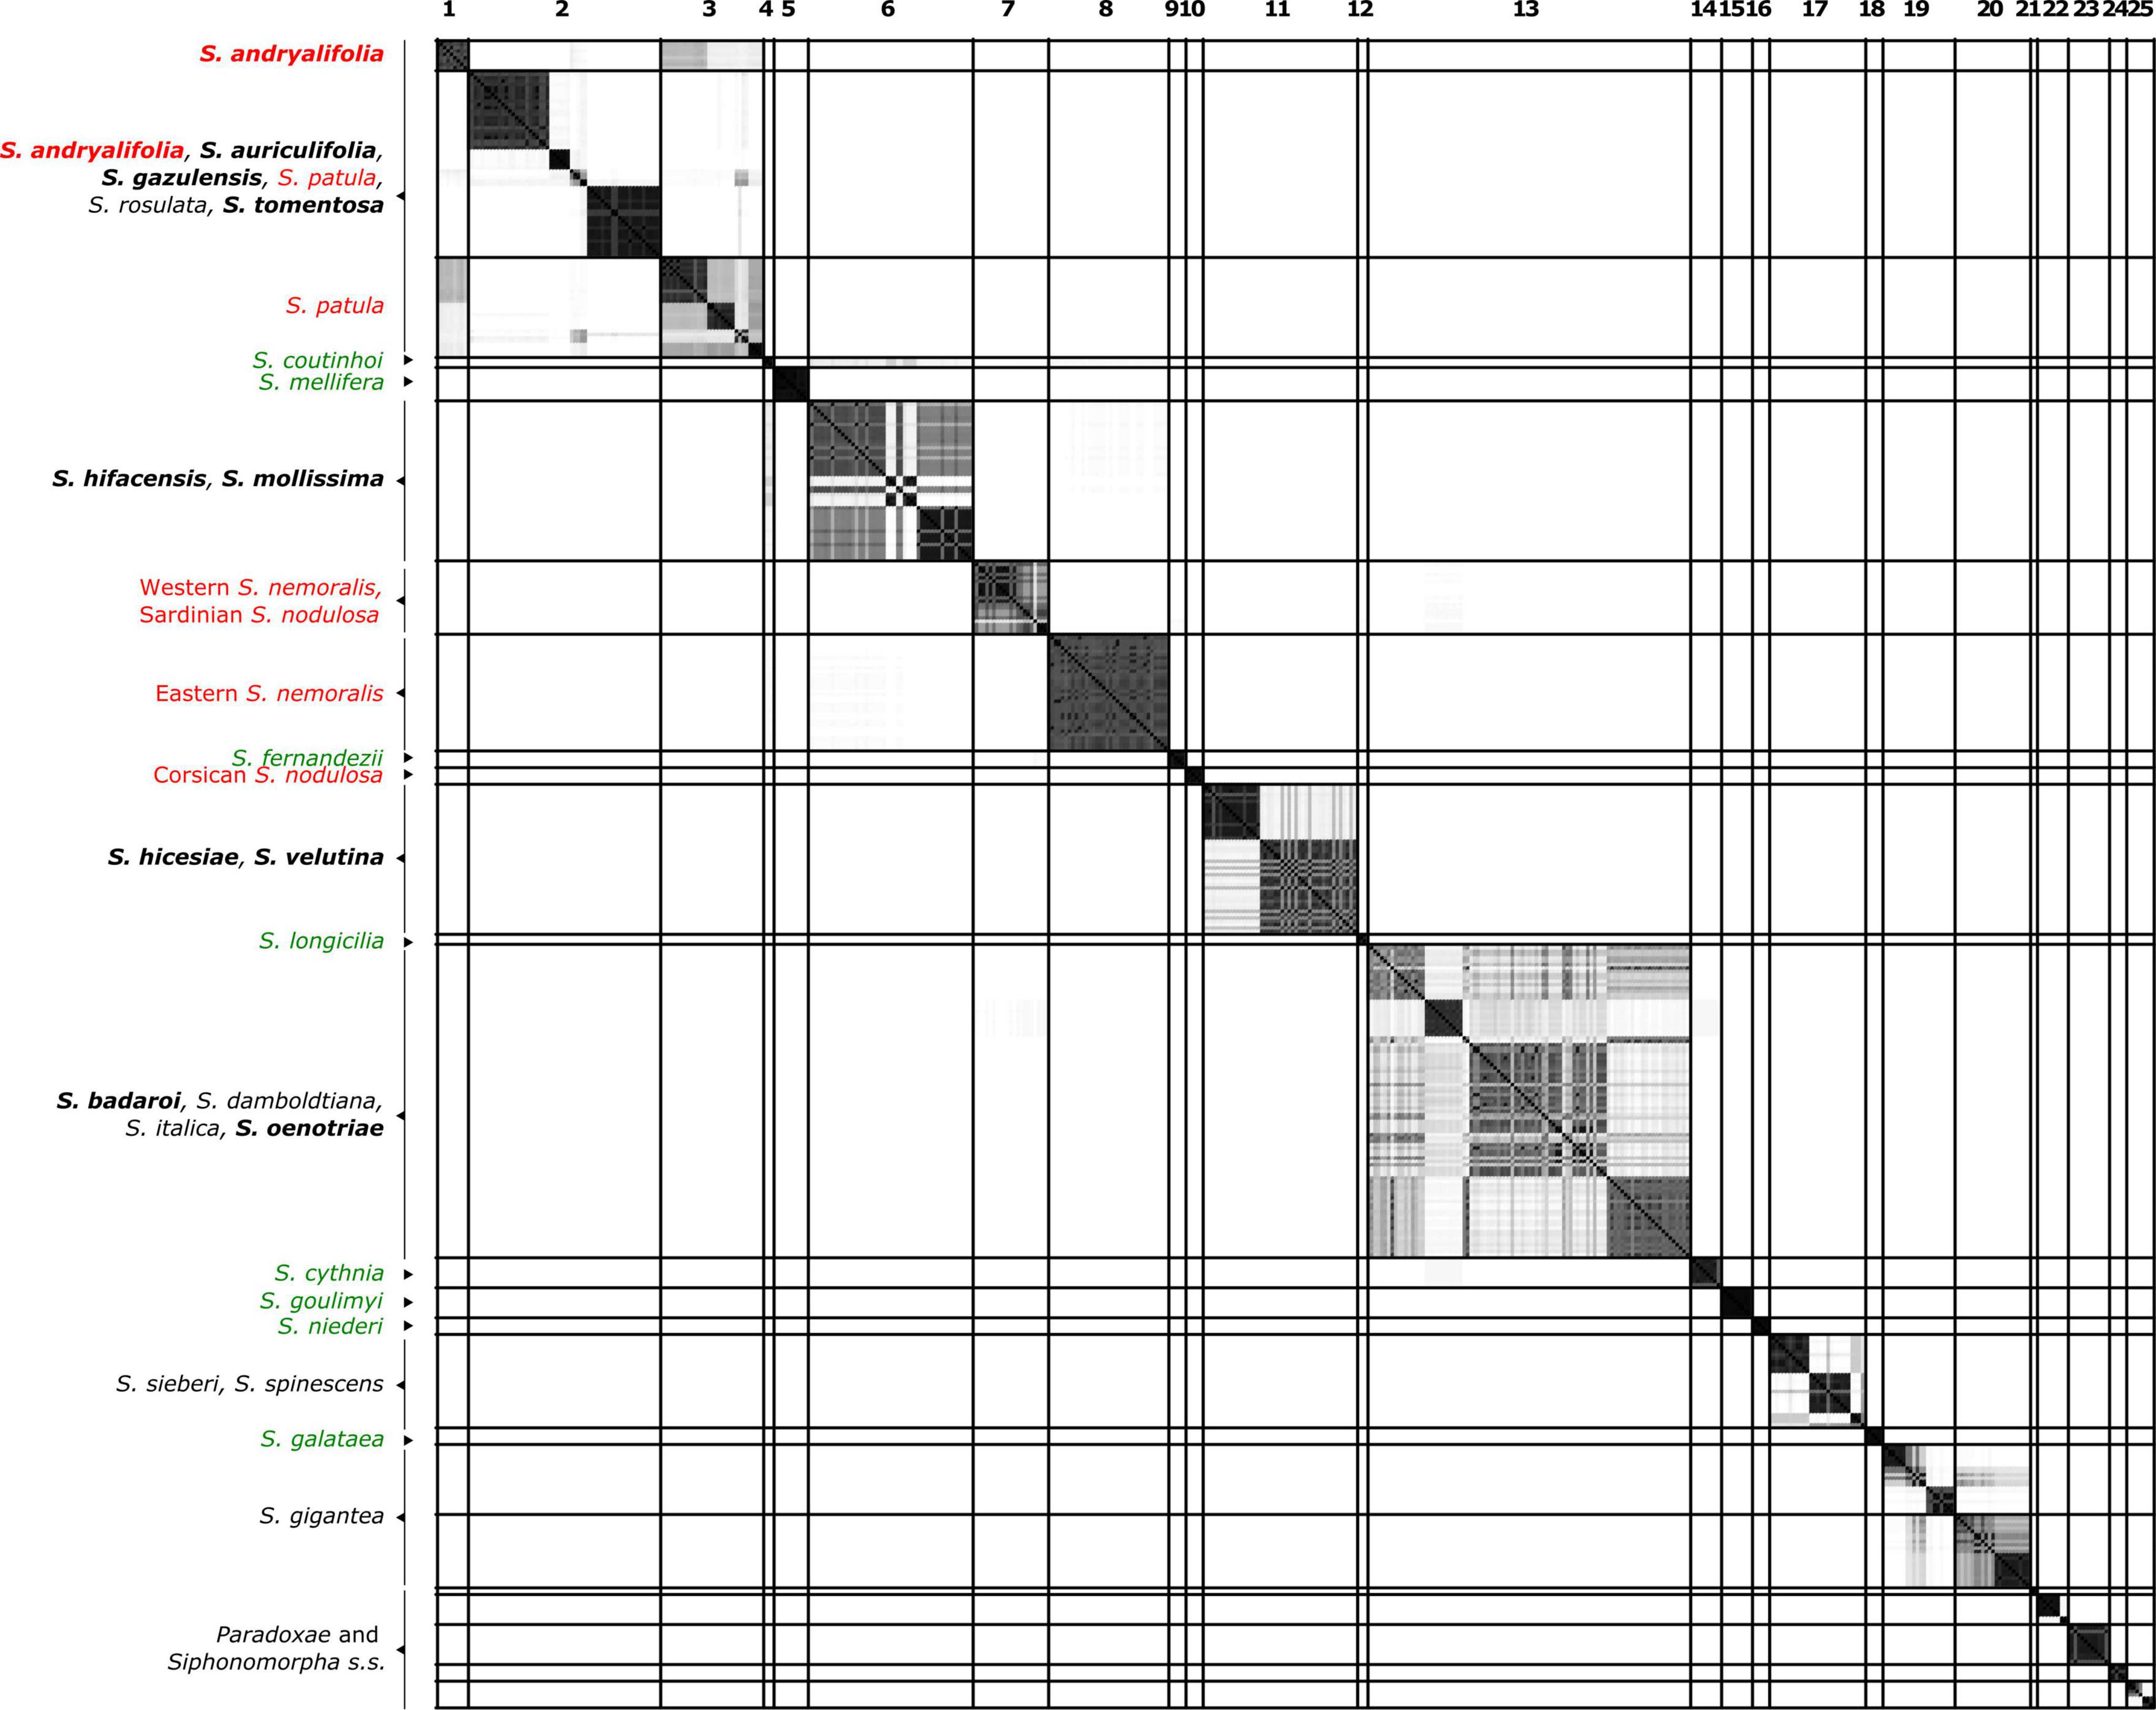
Figure 2. Similarity matrix showing the posterior probability that two individuals belong to the same Multi-Species Coalescent cluster (MSCC) according to the species tree of Figure 1. A black square indicates a posterior probability of 1, while no color indicates a posterior probability of 0. Specimens are given in the same order as in Figure 1. The lines delimit 26 clusters that are comprised of individuals with pairwise posterior probabilities higher than 0.01. Species found in different clusters are indicated in red, while well-delimited species are colored in green. Species in black are those found with at least one additional species in the same clade. The chasmophytic species are indicated in bold. Here, Sect. Paradoxae includes S. paradoxa, S. confertiflora, S. fruticosa and S. aristidis and Sect. Syphonomorpha s.s. includes S. nutans and S. viridiflora.
Estimations of Effective Sizes
Species or Group effective population sizes (Ne) were estimated using the metrics θ, a measure of genetic diversity, which equals 2Neμ for haploid markers, where μ is the mutation rate (Watterson, 1975). The calculation of θ assuming a constant mutation rate across taxa therefore gives access to an estimation of Ne. Using the software Arlequin version 3.5 (Excoffier and Lischer, 2010), we computed θ for each Group using the chloroplast data and the Kimura-2 distance to exclude indels. We used ThetaS as an estimation of θ as it is suitable for non-recombining DNA obtained from the observed number of segregating sites among chloroplast haplotypes.
Results
Sequence Data and Phylogenetic Analyses
The alignment for the 500 ITS rDNA sequences was comprised of 756 nucleotide characters. For the plastid spacers, trnH-psbA and trnS-trnG, the alignments represented totals of 210 and 473 nucleotides, respectively. For each of the two input files, the three separate STACEY runs did not converge adequately for all parameters but when combined, the resulting file converged with ESS values higher than 200 for all parameters for the first input file, and higher than 300 for all parameters for the second input file (see Supplementary Table 2). Therefore, the combined runs obtained for the second input file were used in the following.
Gene Trees
Apart from a few clades, the ITS and the pooled plastid gene trees showed congruent results at high taxonomic levels in the combined STACEY analyses. The ITS and the pooled plastid gene trees indeed revealed clades that largely correspond with Italicae, Giganteae, Siphonomorpha and Paradoxae. However, the plastid gene tree showed a much better agreement with the species tree topology than the ITS tree, and had much higher supports for most of the internal branches (Supplementary Figures 1, 2). In the ITS gene tree, the only species within Italicae that are recovered as highly supported clades are S. goulimyi, S. niederi, S. cythnia and S. galataea. In the chloroplast gene tree, S. patula forms a highly supported clade with the four chasmophytic species from North Africa and Spain S. andryalifolia, S. auriculifolia, S. tomentosa and S. gazulensis as well as with S. rosulata. Similarly S. hifacensis and S. mollissima are clustered with S. nemoralis from Eastern Europe with a high support (PP = 0.96).
Species Tree for Italicae, Giganteae, Paradoxae and Siphonomorpha
The combined species tree obtained from the second input file in STACEY is illustrated in Figure 1. Italicae (PP = 1), Giganteae (PP = 1) and Siphonomorpha (PP = 0.96) are recovered as highly supported clades. Within Paradoxae, S. aristidis (PP = 0.84), S. fruticosa (PP = 1), and S. paradoxa (PP = 1) are clustered together with a high support (PP = 0.96) but S. confertiflora (PP = 1) was external to the cluster. There was poor support for the branches giving rise to Italicae, Giganteae, Siphonomorpha and Paradoxae (PP ranging between 0.52 and 0.55).
Species Tree and Species Delimitation Within Italicae
Figure 2 presents the result of the species delimitation analyzer based on the species tree in Figure 1. The darker the squares, the higher the pairwise posterior probability (PP) that two individuals belong to the same SDA-cluster. The vertical and horizontal lines delineate sets of individuals that have a non-null probability of belonging to the same SDA-cluster. Within this analysis (Figure 2), 25 SDA-clusters were recovered in total, of which 18 belong to Italicae. Overall, twelve SDA-clusters (4, 5, 9, 12, 14, 15, 16, 18, 21, 22, 23, 24) corresponded, each, to a single species (36% of all analyzed species). Five species (15% of all species) were split into more than one group (nine SDA-clusters) whereas seven SDA-clusters (2, 6, 7, 11, 13, 17, 25) were composed of two to six species (60% of all species). For subsequent analyses we adjusted the number of clusters using the results of Figures 1, 2, keeping in mind that SDA-clusters might reflect genetic differentiation within species. Within Italicae, SDA-clusters 1 to 3 were merged into Group 1 (Table 2). Indeed S. andryalifolia and S. patula both fall into SDA-clusters 1–2 and 2–3, respectively. It is also clear from Figure 2 that SDA-clusters 1 and 2 share genetic affinities with SDA-cluster 3 with non-null pairwise posterior probabilities (PP) values. Outside Italicae, SDA-clusters 19 and 20 both contain S. gigantea specimens and should be considered as a single Group. For Italicae, the 18 SDA-clusters therefore correspond to 16 Groups (see Table 2).
Group 1 (PP = 0.94) contains all the North African species in addition to S. tomentosa from Gibraltar (PP = 0.79) and S. andryalifolia from both North Africa and southern Spain. Group 4 (PP = 0.16) includes S. hifacensis from the Balearic Islands and Alicante and S. mollissima which is restricted to the Balearic Islands. Group 5 (PP = 0.37) contains the Sardinian specimens of S. nodulosa in addition to the Western specimens of S. nemoralis from France, Italy and Spain. The Eastern S. nemoralis constitute a single group (Group 6; PP = 0.83), whereas the Corsican S. nodulosa are clustered in Group 8 with high support (PP = 0.99). Group 9 contains S. hicesiae from the Lipari Islands and S. velutina from Corsica (PP = 0.94) and Group 11 is comprised of S. italica, S. damboldtiana, S. badaroi (= S. tyrrhenia) and S. oenotriae (PP = 0.81). All the other groups represent single species (Table 2).
Within Italicae, the relationships between species and/or Groups remain unresolved.
Chasmophytic Species
Within the 10 chasmophytic species of Italicae, those from mainland sites are typically grouped with species of open habitats within the same area. For example, S. oenotriae, found on inland cliffs in South Italy and S. badaroi (= S. tyrrhenia) in southern France and northwestern Italy on coastal cliffs and rocks, both cluster with S. italica which is widely distributed from Spain to Iran and with S. damboldtiana from Greece, Albania and Macedonia (Group 11, PP = 0.81; Table 2). Similarly, S. auriculifolia from Algeria, S. tomentosa from Gibraltar, S. andryalifolia from North Africa and Southern Spain and S. gazulensis from Spain cluster with S. patula growing inland in Morocco and Algeria (Group 1, PP = 0.94; Table 2). The former group also includes S. rosulata which grows on coastal sands in North Africa.
The situation is, however, different for chasmophytic species that grow on islands. S. velutina from Corsica and S. hicesiae from the Lipari Islands cluster well together (PP = 0.94; Table 2) but display no clear relationship to other species inhabiting open habitats, such as S. nodulosa the unique other species of Italicae present in Corsica. The two species S. mollissima (Minorca and Majorca in the Balearic Islands) and S. hifacensis (Ibiza in the Balearic Islands and Alicante County in Spain) are grouped in a poorly supported cluster (Group 4, PP = 0.16; Table 2) and their relationships to other mainland species are unclear (Figure 1 and Supplementary Figures 1, 2).
Species Distributions and Effective Sizes
The correlation between the PP values and the log of the areas of occupancy and that of the corrected range extent of occurrence [log(AOO)/log(EOOCor), respectively] were computed for the 16 Groups as defined above and listed in Table 2. The maps for the 16 Groups are given in Supplementary Figure 3 and the corresponding csv files as Supplementary Files 1–5. The correction for maritime areas reduced the EOO by 2% (S. mellifera) to 91% (S. cythnia; Table 2). For AOO, the Pearson’s product-moment correlation and the two rank tests were negative and non-significant (cor = −0.111, P = 0.682; Kendall’s rank correlation tau = −0.233, P = 0.228; Spearman’s rank correlation rho = −0.350, P = 0.184). For EOOCor, even more negative but still non-significant correlation coefficients were obtained (cor = −0.222, P = 0.408; tau = −0.300, P = 0.116; rho = −0.406, P = 0.120). The PP values were also negatively correlated with θ estimates (cor = −0.064, P = 0.813; tau = −0.350, P = 0.064; rho = −0.456, P = 0.078). AOO and EOOCor were positively and significantly correlated with θ estimates (Table 3).
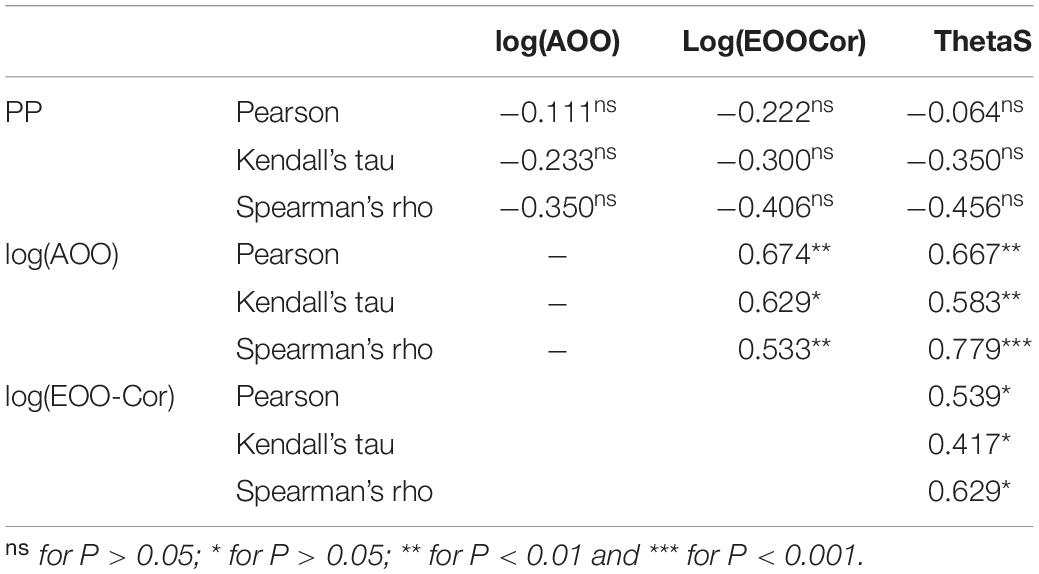
Table 3. Pairwise correlations between the area of occupancy (AOO), the extent of occurrence (EOOCor), the posterior probabilities (PP) and ThetaS as an estimation of θ for the Groups of Table 2.
Discussion
Well Defined Sections but Unclear Relationships Among Them
Clear morphological characterizations of Italicae, Paradoxae, Giganteae and Siphonomorpha s.s. have been given by Chowdhuri (1957), Jeanmonod and Mascherpa (1982), Greuter (1995) and Du Pasquier (2016), among others. Eleven species belonging to these four groups (S. italica, S. nemoralis, S. tomentosa, S. andryalifolia, S. gazulensis, S. rothmaleri, S. waldsteinii, S. paradoxa, S. fruticosa, S. gigantea and S. nutans) were included in one of the most complete published phylogenies of the Caryophyllaceae based on ITS and five plastid loci (Greenberg and Donoghue, 2011). However, the genetic relationships among these species, as well as the relationships among the different sections remained unresolved in that study. In the latest phylogeny of the genus Silene, based on ITS and the plastid loci rps16, Jafari et al. (2020) increased the number of species analyzed for the same groups to 22, i.e., ten for Italicae (S. italica, S. nemoralis from Austria, S. nodulosa from Corsica, S. longicilia, S. andryalifolia, S. hifacensis, S. damboldtiana, S. cythnia, S. viscariopsis, S. waldsteinii), three for Paradoxae (S. paradoxa, S. aristidis, S. fruticosa), and eight for Siphonomorpha s.s. in addition to S. gigantea with a similar conclusion—no clear relationships emerged among the groups. The present study, however, confirms the consistency of Italicae, Giganteae and Siphonomorpha and, to a lesser extent, Paradoxae, as defined by Naciri et al. (2017). Silene confertiflora is always recovered as a highly supported clade in our analysis (Figure 1). Nevertheless the relationships of this species with sections Italicae or Giganteae is poorly understood and its placement remains unresolved in our study.
Despite the fact that a much greater number of specimens and species were analyzed in the present study compared to Naciri et al. (2017), the relationships among the four sections remain poorly understood. The low resolution among these sections may reflect a rapid diversification that occurred within a short period of time. In our study, the unclear relationships among sections cannot be attributed to a low analysis convergence because all the parameters gave ESS values above 300 (Supplementary Table 2). The parameters that displayed the lowest ESS values and were the latest to converge are the prior (ESS = 302), the birth-death-collapse model (ESS = 310) and the number of clusters (ESS = 345). These parameters are among the ones known to converge sometimes barely with STACEY (Jones, 2017). The birth-death-collapse prior, and the number of clusters are related to populations and species dynamics, which are difficult to estimate, but should not impact the support of deep branches. Jones (2017) pointed out that the birth-death-collapse prior depends strongly on the number of clusters, which might explain that they both exhibit among the lowest ESS values. In our analyses, the number of clusters was not constrained in the priors but the recovered SDA-clusters nevertheless mostly agreed with already described species. Another explanation for the ESS of the prior remaining among the lowest ones could be due to the dataset lacking enough information, i.e., with a too low number of substitutions. Disentangling the two explanations is difficult, however, and including data from more genes, using NGS techniques for instance (Toprak et al., unpublished results) might improve the observed pattern.
A Wide Range of Support for Species Boundaries Within Italicae
In STACEY, gene trees and species trees are estimated simultaneously. This is not the case for other methods that require a fixed guide tree and then estimate the fit of that particular tree with the proposed gene trees (Aydin et al., 2014b). Under STACEY, any change to the species tree, or to the different gene trees during the MCMC move, may improve or decrease the concordance between the gene trees and the species tree. The way STACEY produces the species tree, however, minimizes the influence of the prior settings on the outcomes of the analyses. In contrast to programs such as *BEAST, STACEY uses no prior knowledge about samples’ assignment to species—reducing the impact of any prior knowledge (or any assignment error) on the results. Our analyses ended up with a variety of results—from genetically well-delimited species to species that present fuzzy genetic boundaries, or species that are divided into different lineages. Generally speaking, our analyses led to a better overall resolution than other studies such as Greenberg and Donoghue (2011) for instance, who used more genes than we did (ITS, matK, ndhF, trnL-trnF, trnQ-rps16, and trnS-trnfM). This might be due to several factors: first trnH-psbA is one of the most diverse chloroplast gene among angiosperms but was seldom used in other Silene studies. We furthermore coded the indels which increases the informativeness of the locus. Second, the MSC approach takes into account that genes might be incongruent among them because they have their own independent histories and signal, which might not reflect organismal phylogeny. This means that part of the incongruence among genes is considered as “normal” under the MSC and STACEY deals with that when estimating the species tree. Third, in this paper, the support is given for putative species not for individual genes. Finally, the fact that we take into account the intraspecific diversity might also explain why we obtained a better resolution.
Within the Italicae section, AOO and EOO as well as ThetaS were used as proxies for estimating effective population sizes (Ne). Significant positive correlations were found among those three parameters suggesting that species with low effective sizes indeed inhabit smaller ranges overall. However, we could not confirm that these lower effective sizes translate into higher PP-values as all correlations with PP were negative, as expected, but still non-significant. This lack of significance despite high correlations (as the one between PP and ThetaS found to be −0.456) might have different origins: first, a low test power as only 16 pairs of observations were taken into account; second, the fact that EOO and AOO are imperfect estimates of the species range and occupancy as they depend of the species knowledge and the collection records that can be found in public repositories such as GBIF; and third, the fact that ThetaS is also an imperfect estimation of the species effective size as it assumes a constant mutation rate across Groups and was designed for populations rather than for species or group of species. It would be interesting to test for similar correlations on a higher number of species to confirm on Silene the theoretical prediction that small effective population sizes lead to more rapid and complete lineage sorting (Naciri and Linder, 2015).
The Widely Distributed Species S. italica, S. patula and S. nemoralis
Within Italicae, three species are widely distributed: S. italica (EOO = 3,025,801 km2), S. patula (EOO = 443,117 km2) and S. nemoralis (EOO = 418,617 km2). Silene nemoralis is placed into two different groups that agree well with geography (Group 5 from France, Italy, Spain and Bosnia including S. nodulosa from Sardinia and Group 6 from Austria, Romania and Slovakia) that both have moderate to low supports (PP = 0.37 and 0.83, and ThetaS = 1.646 and 0.486, respectively). The relationships between Groups 5 and 6 and other taxa are not well assessed, but the split of S. nemoralis into two genetic entities suggests either a high level of incomplete lineage sorting within a single species or the existence of two putative species that diverged recently, one in the Western Mediterranean Basin and the other in Eastern Europe. The assignment of S. nemoralis to two different clusters is consistent with the fact that the species has previously been subdivided, on the basis of morphological characters, into three different taxa: two western (S. crassicaulis Willk. and Costa in the Pyrenees and S. nemoralis var pedemontana Burnat and Barbey in the French Maritime Alps and Northern Italy) and one (S. nemoralis s.str.) restricted to Eastern Europe (Jeanmonod, 1985b). Therefore we could consider that S. nemoralis is the species actually found in Eastern Europe whereas S. crassicaulis is that of the Western Mediterranean Basin.
Unlike S. nemoralis, S. italica and S. patula each fall within a single group that includes several species, with moderate to high clade supports (PP = 0.81 and PP = 0.94, respectively). For S. patula, Group 1 includes 5 other species (S. andryalifolia, S. auriculifolia, S. tomentosa, S. gazulensis and S. rosulata), whereas for S. italica, Group 11 also includes S. damboldtiana, S. oenotriae and S. badaroi. These two groups include chasmophytic and non-chasmophytic species and their ThetaS estimations are the two highest (3.512 and 2.932, respectively).
Du Pasquier et al. (2017) reported that S. gigantea started to diversify around 1.2 MYA. According to Figure 1, similar or even younger ages may be inferred for the diversification of Groups 1 and 11. Therefore, if high effective population sizes can be assumed in taxa that, in addition, have had a recent history of diversification, it can be hypothesized that the diffuse species-boundaries within those groups are unlikely to be resolved by simply analyzing a higher number of genes.
The Chasmophytic Species of the Mollissima Group: A Case of Morphological Convergence
The Mollissima group as defined by Jeanmonod (1984b) is clearly polyphyletic and a common ancestor exclusively for all its species is not found. The switch between open rocky and chasmophytic habitats appears to have occurred several times within Italicae: all the chasmophytic species of Southern Spain (S. andryalifolia, S. gazulensis, S. tomentosa) and Northern Africa (S. auriculifolia and S. andryalfolia) share a common ancestor with S. patula, assessed by the high support found for the clade comprising all five species (Group 1; PP = 0.94). This is the first time that such a relationship between chasmophytic species and non-chasmophytic species has been confirmed with molecular data within Italicae. Our results also show for the first time that S. velutina and S. hicesiae diverged from the same ancestor, as assessed by the strong support of the clade including both species (Group 9; PP = 0.94). For that species pair, it is unclear which non-chasmophytic taxon is their closest relative. Similarly, the two species S. mollissima and S. hifacensis also share a clear genetic similarity according to Figure 2, although their group displays no support (Group 4, PP = 0.16). As for the preceding case, it is difficult to link them clearly with any other species although they show some genetic affinities with S. coutinhoi (Figure 2). The remaining two chasmophytic species (S. oenotriae and S. badaroi) that were not formally included in the Mollissima group of Jeanmonod (1984b) are clearly related to S. italica (Group 11, PP = 0.81). The Mollissima group has therefore no evolutionary significance in terms of shared ancestry but rather comprises species that seems to have independently adapted to chasmophytic conditions. Cultivation experiments are needed to assess the extent to which, at least in some cases, the morphological differentiation in chasmophytic species may partly reflect phenotypic plasticity. For example, S. oenotriae and S. badaroi have similar inflorescence characteristics to S. italica. When cultivated, S. badaroi (= S. tyrrhenia) displayed only attenuated characteristics of a chasmophytic plant (Jeanmonod and Bocquet, 1983), suggesting that a degree of plasticity may be involved in the morphological differentiation between the chasmophyte and the non-chasmophyte S. italica.
Overall, our results suggest that chasmophytic species, or at least some of them, have derived from geographically neighboring species that occur in open habitats. Chasmophytic species are usually found in restricted rocky places or cliffs and as small populations that are highly susceptible to genetic drift. In the case of S. oenotriae and S. badaroi, the process of speciation appears to be ongoing and the fact that their distributional ranges overlap with that of S. italica suggests that gene flow might remain between the chasmophytes and the non-chasmophyte. Both chasmophytes share the same single plastid haplotype (A1B1) and almost identical ITS sequences to that of S. italica. Depending on the species concept used, the two chasmophytic species could be regarded as ecotypes of S. italica rather than species. Our results suggest that the ecological divergence may have predated the reproductive isolation of the taxa (Coyne and Orr, 2004; Schemske, 2010). This conclusion would match that of Karrenberg et al. (2018) who demonstrated that in the speciation process between S. latifolia and S. dioica, extrinsic barriers associated with adaptive ecological divergence had more importance than intrinsic postzygotic barriers in building effective reproductive isolation.
The case of S. patula, and its associated chasmophyte taxa is more complex. Within Group 1, the relationships among the different clades are not resolved. From Figure 2, it is however noticeable that S. patula from Algeria has some genetic affinities with S. andryalifolia and S. auriculifolia from the same country, whereas S. andryalifolia from Spain is clustered with S. tomentosa and S. gazulensis from Spain. Naciri et al. (2010) showed that Eastern Algeria hosts most of the genetic diversity within S. patula, while the Moroccan populations are homogeneous. Genetic homogeneity within Morocco was attributed to a rapid and recent colonization of the country from Algeria, with associated plastid haplotype surfing (Klopfstein et al., 2006). According to this scenario, S. andryalifolia from North Africa would have diverged in situ before crossing the Straits of Gibraltar, and subsequently giving rise to other chasmophytic species in the Iberian Peninsula. The case of the restricted endemic from Oran, S. auriculifolia, is difficult to resolve, as only one accession could be included in the analyses. The species exhibits a single plastid haplotype (A15B16) that is also found in two North Moroccan specimens of S. patula with which it clusters, together with one specimen of S. rosulata from Alger and one specimen of S. andryalifolia from Tizi Ouzou.
Although the whole group of North-African and Iberian species is well supported (PP = 0.94; Group 1), unresolved relationships with the remaining species make it difficult to establish the relationships between this group and other species of Italicae. The unresolved relationships for the remaining chasmophytic species (S. velutina, S. hicesiae, S. hifacensis, S. mollissima) do not allow suggestions about divergence scenarios. However, the two examples detailed above (S. italica and S. patula and their allied species), suggest that the chasmophytic form corresponds to a morphological convergence driven by independent adaptation to cliffs or rocky habitats. A similar morphological convergence is also found in Paradoxae where S. aristidis and S. sessionis display chasmophytic characteristics while S. paradoxa does not (Leuzinger et al., 2015). Confirming convergent evolution among species from different areas will require the identification of the genes associated with the chasmophytic form and their comparison among species.
Plasticity and morphological convergence are common in Silene, perhaps explaining the difficulty encountered when trying to find infra-generic classifications (Naciri et al., 2017; Jafari et al., 2020). For instance, Du Pasquier et al. (2017) highlighted a strong morphological convergence leading to the chasmophytic form in different genetic lineages all described under S. gigantea subsp. gigantea. Similarly, Đurović et al. (2017) showed that morphological convergence partly explains why taxonomic delineation based on morphology does not match with genetics in the Silene saxifraga alliance. As in S. andryalifolia or S. nemoralis the genetic differentiation is rather geographically than morphologically structured in that group.
Silene italica and S. nemoralis Are Two Different Species
Silene nemoralis is one of the few species within Italicae (with S. damboldtiana) that is biennial. This character discriminates it from S. italica with which it has been often lumped. The Flora of Italy (Pignatti, 1982) used to consider S. nemoralis as a subspecies of S. italica however, in the recent second edition of the Flora (Pignatti et al., 2017), the two taxa are now treated as separate species. Our results clearly confirm that S. nemoralis and S. italica can be regarded as different species. Their distributional ranges do not overlap, and the species occupy different habitats. Silene nemoralis grows in the forest understory and in cool sites whereas S. italica is found in open and drier habitats. Because the relationships within Italicae are unresolved, it is difficult to say whether the ancestor of Italicae was perennial or biennial. A better resolved phylogeny based on more data would be needed to conclude on the ancestral state of perennials versus biennials within Italicae.
A High Level of Incomplete Lineage Sorting
This study highlights the impact of incomplete lineage sorting in recently diverging lineages (Naciri and Linder, 2020). For both gene trees (and in the resulting species tree) Italicae, Giganteae, Paradoxae and Siphonomorpha s.s. are recovered as highly supported clades but the resolution within the clades is much higher with the chloroplast genes than with ITS. This can be related to the respective effective sizes of the two types of genes—which is twice as high for ITS compared to the chloroplast (a diploid nuclear gene versus haploid chloroplast genes). Therefore, as observed here, more incomplete lineage sorting is expected for ITS than for the chloroplast genes (Naciri and Linder, 2015). Another explanation for conflicting results between ITS and the plastid markers might be the possible incomplete ITS concerted evolution mode after recent hybridization events (Nieto Feliner and Rosselló, 2007) leading to unresolved topologies. In our case, ITS gave almost no resolution at the species level, except for three species of the Eastern Mediterranean basin that have PP values of 1, restricted distribution ranges and no within-species diversity as captured by ThetaS. This is in contradiction with previous finding in Silene (Rautenberg et al., 2010) and with the general expectation that nuclear genes will provide better assignment to species than chloroplast genes (Naciri et al., 2012)—one of the reasons why ITS has been considered for species assignment in addition to the chloroplast barcoding genes (China Plant BOL Group et al., 2011; Hollingsworth et al., 2011). In the case of Italicae, it is anticipated that a completely resolved phylogeny might be difficult to obtain, even with a large number of genes, as a result of the confounding effects of large effective population sizes for some species and a recent and fast diversification history, both resulting in a high level of incomplete lineage sorting that blurs species delimitation and relationships (Naciri and Linder, 2015). The relationships among species might be difficult to recover because of the recent radiation of Italicae in the Mediterranean region. This hypothesis will, however, have to be tested using a higher number of genes using NGS technologies.
Data Availability Statement
The datasets presented in this study can be found in online repositories. The names of the repository/repositories and accession number(s) can be found in the article/Supplementary Material.
Author Contributions
DJ and YN designed the project. YN produced the data. YN and ZT analyzed the data and wrote the manuscript. HP, DJ, CB, and AT revised the different versions of the manuscript. HP, LH, CB, AT, and JG provided samples for the study. All authors contributed to the article and approved the submitted version.
Funding
This work has been supported by the Claraz Foundation to YN. ZT was supported by a grant from the Scientific and Technological Research Council of Turkey (TUBITAK BIDEB ID: 667895). Open access funding was provided by the University of Geneva.
Conflict of Interest
The authors declare that the research was conducted in the absence of any commercial or financial relationships that could be construed as a potential conflict of interest.
Publisher’s Note
All claims expressed in this article are solely those of the authors and do not necessarily represent those of their affiliated organizations, or those of the publisher, the editors and the reviewers. Any product that may be evaluated in this article, or claim that may be made by its manufacturer, is not guaranteed or endorsed by the publisher.
Acknowledgments
We would like to thank Mats Töpel for allowing us to use the Cluster Albiorix for a previous version of this manuscript and for maintaining it; Laurent Gautier for allowing us to sample from herbarium specimens at G; Nicolas Fumeaux for his help in the G herbarium; Bengt Oxelman and Graham Jones for their theoretical advice; Simon Crameri for the help with the visualization of similarity matrix and making his program available in R; John Cortes for providing samples of S. tomentosa; Régine Niba for her help with lab work. We are very grateful to Pascal Martin for his help with the EOO corrections and the maps and to Charles Pouchon for the help with the figures.
Supplementary Material
The Supplementary Material for this article can be found online at: https://www.frontiersin.org/articles/10.3389/fpls.2022.695958/full#supplementary-material
Supplementary Figure 1 | Gene tree obtained from the combination of three runs using STACEY on two linked plastid regions (trnH-psbA and trnS-trnG). Posterior probabilities that are equal or higher than 0.50 are given above the corresponding branches. The scale at bottom is given in substitutions/site. The chasmophytic species are indicated in bold. For some species, the geographic origin is indicated between brackets. The species belonging to Italicae are shown in black whereas the species included in Giganteae, Paradoxae and Siphonomorpha s.s. are shown in violet, blue and dark blue, respectively.
Supplementary Figure 2 | Gene tree obtained from the combination of three runs using STACEY on and one nuclear marker (ITS). Posterior probabilities that are equal or higher than 0.50 are given above the corresponding branches. The scale at bottom is given in substitutions/site. The chasmophytic species are indicated by bold. The species belonging to Italicae are shown in black whereas the species included in Giganteae, Paradoxae and Siphonomorpha s.s. are shown in violet, blue and dark blue, respectively.
Supplementary Figure 3 | Distribution maps with the estimations of extents of occurrence (EOO) delimited by a blue line and the occurrences given as red dots according to GeoCAT for the 16 Groups of Table 2 and the files given as Supplementary data.
Supplementary Table 1 | List of the specimens used in this study together with their collection and lab numbers, the collector name, country of origin and Genbank number accessions for the plastid trnH-psbA, trnS-trnG and the nuclear ribosomal Internal Transcribed Spacer (ITS).
Supplementary Table 2 | ESS values for the different parameters in the combined STACEY analysis.
Supplementary File 1 | Coordinates obtained from GBIF for Groups 1, 2, and 3.
Supplementary File 2 | Coordinates obtained from GBIF for Groups 4, 5, 6, and 7.
Supplementary File 3 | Coordinates obtained from GBIF for Groups 8, 9, and 10.
Supplementary File 4 | Coordinates obtained from GBIF for Group 11.
Supplementary File 5 | Coordinates obtained from GBIF for Groups 12, 13, 14, 15, and 16.
Footnotes
- ^ https://www.beast2.org/
- ^ http://beast.bio.ed.ac.uk
- ^ https://github.com/scrameri/smtools/tree/master/SpeciesDelimitation
- ^ https://www.gbif.org/
- ^ https://ec.europa.eu/eurostat/web/gisco/geodata/reference-data/administrative-units-statistical-units/countries
References
Aydin, Z., Ertekin, A. S., Långström, E., and Oxelman, B. (2014a). A new section of Silene (Caryophyllaceae) including a new species from South Anatolia, Turkey. Phytotaxa 178, 98–112.
Aydin, Z., Marcussen, T., Ertekin, A. S., and Oxelman, B. (2014b). Marginal likelihood estimate comparisons to obtain optimal species delimitations in Silene sect. Cryptoneurae (Caryophyllaceae). PLoS One 9:e116266. doi: 10.1371/journal.pone.0106990
Bachman, S., Moat, J., Hill, A. W., de la Torre, J., and Scott, B. (2011). Supporting red List threat assessments with GeoCAT: geospatial conservation assessment tool. ZooKeys 150, 117–126.
Bittrich, V. (1993). “Caryophyllaceae,” in The Families and Genera of Vascular Plants, Vol. 2, ed. K. Kubitzki (Berlin: Springer-Verlag), 206–236.
Bouckaert, R., Heled, J., Kühnert, D., Vaughan, T., Wu, C.-H., Xie, D., et al. (2014). BEAST 2: a software platform for Bayesian evolutionary analysis. PLoS Comp. Biol. 10:4. doi: 10.1371/journal.pcbi.1003537
Brullo, S. (1998). Silene oenotriae (Caryophyllaceae): a new species from S Italy. Nordic J. Bot. 17, 649–652.
Chater, A. O., Walters, S. M., and Akeyrod, J. R. (1993). “Silene L,” in Flora Europaea, 2nd Edn, Vol. 1, eds T. G. Tutin, N. A. Burges, A. O. Chater, J. R. Edmonson, V. H. Heywood, D. M. Moore, et al. (Cambridge: Cambridge University Press), 191–218.
China Plant BOL Group, Li, D.-Z., Gao, L.-M., Li, H.-T., Wang, H., Ge, X.-J., et al. (2011). Comparative analysis of a large dataset indicates that internal transcribed spacer (ITS) should be incorporated into the core barcode for seed plants. Proc. Natl. Acad. Sci. U.S.A. 108, 19641–19646. doi: 10.1073/pnas.1104551108
Coode, M. J. E., and Cullen, J. (1967). “Silene L,” in Flora of Turkey and the East Aegean Islands, ed. P. H. Davis (Edinburgh: Edinburgh University Press), 179–242.
Darriba, D., Taboada, G. L., Doallo, R., and Posada, D. (2012). jModelTest 2: more models, new heuristics and parallel computing. Nat. Methods 9, 772–772. doi: 10.1038/nmeth.2109
Davis, P. H. (1971). “Distribution patterns in Turkey with particular reference to Anatolia,” in Plant Life of South West Asia, eds P. H. Davis, P. C. Harper, and J. C. Hedge (Edinburgh: The Botanical Society of Edinburgh), 15–27.
Drummond, A. J., Suchard, M. A., Xie, D., and Rambaut, A. (2012). Bayesian phylogenetics with BEAUti and the BEAST 1.7. Mol. Biol. Evol. 29, 1969–1973. doi: 10.1093/molbev/mss075
Drummond, A. J., and Rambaut, A. (2007). BEAST: Bayesian evolutionary analysis by sampling trees. BMC Evol. Biol. 7:214. doi: 10.1186/1471-2148-7-214
Du Pasquier, P.-E. (2016). Etude Taxonomique et Phylogéographique du Groupe du Silene italica (Caryophyllaceae) en Méditerranée Orientale. Ph.D. thesis. Geneva: University of Geneva.
Du Pasquier, P.-E., Jeanmonod, D., and Naciri, Y. (2017). Morphological convergence in the recently diversified Silene gigantea complex (Caryophyllaceae) in the Balkan Peninsula and South-Western Turkey, with the description of a new subspecies. Bot. J. Linn. Soc. 183, 474–493.
Đurović, S., Schönswetter, P., Marjan, N., Tomoviæ, G., and Frajman, B. (2017). Disentangling relationships among the members of the Silene saxifraga alliance (Caryophyllaceae): phylogenetic structure is geographically rather taxonomically segregated. Taxon 66, 343–364.
Excoffier, L., and Lischer, H. E. L. (2010). Arlequin suite ver 3.5: a new series of programs to perform population genetics analyses under Linux and Windows. Mol. Ecol. Res. 10, 564–567. doi: 10.1111/j.1755-0998.2010.02847.x
Galán de Mera, A., Cortés, J. E., Vicente Orellana, J. A., and Morales Alonso, R. (1999). Silene gazulensis sp. nov. (Caryophyllaceae): un nuevo endemismo delentorno delestrecho de Gibraltar. Acta Bot. Malacitana 24, 237–241.
Gautier, F., Clauzon, G., Suc, J. P., Cravatte, J., and Violanti, D. (1994). Age and duration of the Messinian salinity crisis. C.R. Acad. Sci. Paris (IIA) 318, 1103–1109.
Greenberg, A. K., and Donoghue, M. J. (2011). Molecular systematics and character evolution in Caryophyllaceae. Taxon 60, 1637–1652.
Greuter, W. (1995). Studies in Greek Caryophylloideae: Agrostemma, Silene, and Vaccaria. Willdenowia 25, 105–142.
Greuter, W. (1997). “Silene L.,” in Flora Hellenica, eds A. Strid and K. Tan (Königstein: Koeltz Scientific Books), 239–323.
Hollingsworth, P. M., Graham, S. W., and Little, D. P. (2011). Choosing and using a plant DNA barcode. PLoS One 6:e19254. doi: 10.1371/journal.pone.0019254
Jafari, F., Zarre, S., Gholipour, A., Eggens, F., Rabeler, R. K., and Oxelman, B. (2020). A new taxonomic backbone for the infrageneric classification of the species-rich genus Silene (caryophyllaceae). Taxon 69, 337–368.
Jeanmonod, D. (1984a). Révision de la section Siphonomorpha Otth du genre Silene L. (Caryophyllaceae) en Méditerranée occidentale. III: aggrégatitalica et espèces affines. Candollea 39, 549–639.
Jeanmonod, D. (1984b). Révision de la section Siphonomorpha Otth du genre Silene L. (Caryophyllaceae) en Méditerranée occidentale. II: le groupe du S. mollissima. Candollea 39, 195–259.
Jeanmonod, D. (1985a). Révision de la section Siphonomorpha Otth du genre Silene L. (Caryophyllaceae) en Méditerranée occidentale. V: synthèse. Candollea 40, 35–56.
Jeanmonod, D. (1985b). Révision de la section Siphonomorpha Otth du genre Silene L. (Caryophyllaceae) en Méditerranée occidentale. IV: speciescaeterae. Candollea 40, 5–34.
Jeanmonod, D., and Bocquet, G. (1983). Silene tyrrhenia Jeanmonod & Bocquet sp. nova (Caryophyllaceae) – une nouvelle espèce bien connue. Candollea 38, 297–308.
Jeanmonod, D., and Mascherpa, J.-M. (1982). Révision de la section Siphonomorpha Otth du genre Silene L. (Caryophyllaceae) en Méditerranée occidentale. Candollea 37, 497–523.
Jones, G. (2017). STACEY: algorithmic improvements to species delimitation and phylogeny estimation under the multispecies coalescent. J. Math. Biol. 74, 447–467. doi: 10.1007/s00285-016-1034-0
Jones, G., Aydin, Z., and Oxelman, B. (2015). DISSECT: an assignment-free Bayesian discovery method for species delimitation under the multispecies coalescent. Bioinformatics. 31, 991–998. doi: 10.1093/bioinformatics/btu770
Karrenberg, S., Liu, X., Hallander, E., Favre, A., Herforth-Rahme, J., and Widmer, A. (2018). Ecological divergence plays an important role in strong but complex reproductive isolation in campions (Silene). Evolution 73, 245–261. doi: 10.1111/evo.13652
Katoh, K., Misawa, K., Kuma, K., and Miyata, T. (2002). MAFFT: a novel method for rapid multiple sequence alignment based on fast Fourier transformation. Nucl. Acids Res. 30, 3059–3066. doi: 10.1093/nar/gkf436
Katoh, K., and Standley, D. M. (2013). MAFFT multiple sequence alignment software version 7: improvements in performance and usability. Mol. Biol. Evol. 30, 772–780. doi: 10.1093/molbev/mst010
Klopfstein, S., Currat, M., and Excoffier, L. (2006). The fate of mutations surfing on the wave of a range expansion. Mol. Biol. Evol. 23, 482–490. doi: 10.1093/molbev/msj057
Leuzinger, M., Naciri, Y., Du Pasquier, P.-E., and Jeanmonod, D. (2015). Molecular diversity, phylogeography and relationships of the Sileneparadoxa group of section Siphonomorpha (Caryophyllaceae). Plant Syst. Evol. 301, 265–278.
Melzheimer, V. (1988). “Silene L.,” in Flora Iranica, ed. K. H. Rechinger Academische (Graz: Verlagsanatalt).
Naciri, Y., and Linder, P. (2015). Species identification and delimitation: the dance of the seven veils. Taxon 64, 3–16.
Naciri, Y., and Linder, H. P. (2020). The genetics of evolutionary radiations. Biol. Rev. 95, 1055–1072.
Naciri, Y., Cavat, F., and Jeanmonod, D. (2010). Silene patula (Siphonomorpha, Caryophyllaceae) in North Africa: a test of colonisation using chloroplast markers. Mol. Phylogenet. Evol. 54, 922–932. doi: 10.1016/j.ympev.2009.11.015
Naciri, Y., Caetano, S., and Salamin, N. (2012). Plant DNA Barcodes and the influence of gene flow. Mol. Ecol. Res. 12, 575–580. doi: 10.1111/j.1755-0998.2012.03130.x
Naciri, Y., Du Pasquier, P.-E., Lundberg, M., Jeanmonod, D., and Oxelman, B. (2017). A phylogenetic circumscription of Silene sect. Siphonomorpha (Caryophyllaceae) in the Mediterranean basin. Taxon 66, 91–108.
Nieto Feliner, G., and Rosselló, J. A. (2007). Better the devil you know? Guidelines for insightful utilization of nrDNA ITS in species-level evolutionary studies in plants. Mol. Phylogenet. Evol. 44, 911–919. doi: 10.1016/j.ympev.2007.01.013
Oxelman, B., Lidén, M., Rabeler, R. K., and Popp, M. (2001). A revised generic classification of the tribe Sileneae (Caryophyllaceae). Nordic J. Bot. 20, 743–748. doi: 10.1111/j.1756-1051.2000.tb00760.x
Petri, A., and Oxelman, B. (2011). Phylogenetic relationships within Silene (Caryophyllaceae) section Physolychnis. Taxon 60, 953–968.
Pignatti, S., Guarino, R., and La Rosa, M. (2017). Flora d’Italia, 2nd Edn, Vol. 2. Milan: Edagricole–New Business Media.
Polunin, O. (1980). Flowers of Greece and the Balkans. A Field Guide. Oxford: Oxford University Press.
Prentice, H. C., Malm, J. U., Mateu-Andrés, I., and Segarra-Moragues, J. G. (2003). Allozyme and chloroplast DNA variation in island and mainland populations of the rare Spanish endemic, Silene hifacensis (Caryophyllaceae). Conserv. Genet. 4, 543–555.
Rambaut, A. (2009). FigTree v.1.4. Available online at: http://evomics.org/resources/software/molecular-evolution-software/figtree/ (accessed June 15, 2021).
Rambaut, A., and Drummond, A. J. (2007). Tracer v1.5. Available online at: http://beast.bio.ed.ac.uk/Tracer/ (accessed June 15, 2021).
Rambaut, A., Suchard, M. A., Xie, W., and Drummond, A. J. (2013). Tracer v1.6. Available online at: http://beast.bio.ed.ac.uk/ (accessed June 15, 2021).
Rautenberg, A., Hathaway, L., Oxelman, B., and Prentice, H. C. (2010). Geographic and phylogenetic patterns in Silene section Melandrium (Caryophyllaceae) as inferred from chloroplast andnuclear DNA sequences. Mol. Phylogenet. Evol. 57, 978–991. doi: 10.1016/j.ympev.2010.08.003
R Development Core Team (2014). R: A Language and Environment for Statistical Computing. Vienna: R Foundation for Statistical Computing.
Simmons, M. P., and Ochoterena, H. (2000). Gaps as characters in sequence-based phylogenetic analyses. Syst. Biol. 49, 369–381.
Sokal, R. R., and Rohlf, F. J. (1995). Biometry: The principles and Practice of Statistics in Biological Research, 3rd Edn. New York, NY: W. H. Freeman.
Sukumaran, J., and Knowles, L. L. (2017). Multispecies coalescent delimits structure, not species. Proc. Natl. Acad. Sci. U.S.A. 114, 1607–1612. doi: 10.1073/pnas.1607921114
Trigas, P., Iatrou, G., and Karetsos, G. (2007). Species diversity, endemism and conservation of the family Caryophyllaceae in Greece. Biodivers. Conserv. 16, 357–376.
Watterson, G. A. (1975). On the number of segregating sites in genetical models without recombination. Theor. Popul. Biol. 7, 256–276. doi: 10.1016/0040-5809(75)90020-9
Yıldız, K., and Çırpıcı, A. H. (2013). Taxonomic revision of Silene (Caryophyllaceae) sections Siphonomorpha, Lasiostemones, Sclerocalycinae, Chloranthae, Tataricae and Otites in Turkey. Turkish J. of Bot. 37, 191–218.
Yıldız, K., Mınarecı, E., and Çırpıcı, A. H. (2009). Karyotypic study on Silene, section Lasiostemones species from Turkey. Caryologia 62, 134–141.
Keywords: species tree, species delimitation, ITS, trnH-psbA, trnS-trnG, chasmophyte, adaptation, coalescence
Citation: Naciri Y, Toprak Z, Prentice HC, Hugot L, Troia A, Burgarella C, Gradaille JL and Jeanmonod D (2022) Convergent Morphological Evolution in Silene Sect. Italicae (Caryophyllaceae) in the Mediterranean Basin. Front. Plant Sci. 13:695958. doi: 10.3389/fpls.2022.695958
Received: 15 April 2021; Accepted: 06 June 2022;
Published: 12 July 2022.
Edited by:
Gonzalo Nieto Feliner, Real Jardín Botánico (RJB, CSIC), SpainReviewed by:
Andrea Sánchez Meseguer, Royal Botanical Garden (CSIC), SpainFarzaneh Jafari, University of Tehran, Iran
Mario Mairal, Stellenbosch University, South Africa
Copyright © 2022 Naciri, Toprak, Prentice, Hugot, Troia, Burgarella, Gradaille and Jeanmonod. This is an open-access article distributed under the terms of the Creative Commons Attribution License (CC BY). The use, distribution or reproduction in other forums is permitted, provided the original author(s) and the copyright owner(s) are credited and that the original publication in this journal is cited, in accordance with accepted academic practice. No use, distribution or reproduction is permitted which does not comply with these terms.
*Correspondence: Yamama Naciri, Yamama.Naciri@ville-ge.ch
†These authors have contributed equally to this work and share first authorship