- 1School of Information Science and Engineering, Shandong University, Qingdao, China
- 2Bidding Office, The Second Hospital of Shandong University, Jinan, China
- 3Institute of Research and Clinical Innovations, Neusoft Medical Systems Co., Ltd., Beijing, China
- 4Institute of Research and Clinical Innovations, Neusoft Medical Systems Co., Ltd., Shanghai, China
- 5Center for Optics Research and Engineering, Shandong University, Qingdao, China
The most common manifestation of neurological disorders in children is the occurrence of epileptic seizures. In this study, we propose a multi-branch graph convolutional network (MGCNA) framework with a multi-head attention mechanism for detecting seizures in children. The MGCNA framework extracts effective and reliable features from high-dimensional data, particularly by exploring the relationships between EEG features and electrodes and considering the spatial and temporal dependencies in epileptic brains. This method incorporates three graph learning approaches to systematically assess the connectivity and synchronization of multi-channel EEG signals. The multi-branch graph convolutional network is employed to dynamically learn temporal correlations and spatial topological structures. Utilizing the multi-head attention mechanism to process multi-branch graph features further enhances the capability to handle local features. Experimental results demonstrate that the MGCNA exhibits superior performance on patient-specific and patient-independent experiments. Our end-to-end model for automatic detection of epileptic seizures could be employed to assist in clinical decision-making.
1 Introduction
Epilepsy is a neurological disorder characterized by abnormal synchronous discharges of neurons. Childhood seizures carry a risk for the presence of cognitive impairment and behavioral disorders (Rennie et al., 2004). Therefore, accurate detection of seizures in children is of paramount importance for determining the best treatment plans and preventing adverse conditions. The diagnosis of epilepsy typically relies on the analysis of electroencephalogram (EEG), which is abnormal in the majority of patients. However, this task requires highly experienced experts who must invest a significant amount of time and effort in inspecting lengthy EEG recordings (Kannathal et al., 2005). This process is also susceptible to the subjective influence of epilepsy experts.The occurrence of epileptic seizures significantly impacts the physical development of children, emphasizing the necessity for early detection and intervention in pediatric epilepsy to mitigate its effects. Therefore, designing a reliable childhood seizure detection model can facilitate the automation of epilepsy diagnosis, holding significant importance in enhancing the quality of life for children.
There is a significant need to expand the utilization of machine learning, particularly within the emerging realm of deep learning, for automating the detection of epilepsy through EEG signal classification. Among the extensively explored techniques for EEG seizure detection, feature extraction rooted in machine learning stands as one of the most prominent approachs. For instance, multiscale entropy were extracted using extreme learning machines (Cui et al., 2017), nonlinear features were extracted using Gradient Boosting Decision Trees (GBDT) (Xu et al., 2022), various features were extracted using Empirical Mode Decomposition (EMD) (Singh et al., 2019), multi-scale features were extracted using wavelet transformation (Zhang et al., 2010), and the Comprehensive Representation of K Nearest Neighbors (CRMKNN) (Na et al., 2021) approach is proposed for epilepsy diagnosis. The traditional machine learning algorithms often struggle to achieve automatic detection of epilepsy, and experimental results are influenced by empirical parameters, making it difficult to stabilize the algorithm’s performance. In essence, time series data is nonlinear and dynamic, making it challenging for traditional machine learning algorithms to effectively capture these complex signal characteristics. Moreover, there are large variations between different patients. Therefore, traditional machine learning faces challenges in learning the hidden features of EEG signals and lacks generalization.
Compared to traditional machine learning, neural networks, as a more promising algorithm with greater capacity for learning from complex data, have been applied to various research fields (Zhao P. et al., 2022; Sun and Yang, 2023; Chen J. et al., 2024; Abu and Diamant, 2023). There have been numerous advancements in the detection of epilepsy EEG signals as well (Wang et al., 2023a; Zhao et al., 2023b; He et al., 2022; Xiao et al., 2024). A novel deep network called Two-Stream 3-D Attention Module (TSA3-D) (Cao et al., 2022) was introduced to leverage the multichannel time-frequency and frequency-space features of interictal EEGs for epilepsy classification. In (Feng et al., 2022) a 3D deep network combined with residual attention modules was proposed to explore the spatial and time-frequency features of multi-channel EEG. In (Cui et al., 2022b), a fusion model based on transfer learning and time-frequency features was proposed for the effective detection of childhood epilepsy syndrome. In (Cui et al., 2022a), an analysis of the correlation between time-frequency features and EEG signals was conducted, and a childhood epilepsy syndrome classification model based on transfer networks was proposed.
Attention mechanisms have gained widespread applications in the field of signal recognition (Zhao et al., 2023b; Lian and Xu, 2023; Peh et al., 2023; Qiu et al., 2023; Wang Z. et al., 2023; Liu et al., 2023), emerging as a pivotal technology attracting significant attention and in-depth exploration within the realm of deep learning. Many researchers have integrated attention mechanisms with neural network models, resulting in the creation of a series of innovative models. The emergence of these models has introduced new possibilities for enhancing the accuracy and efficiency of EEG signal recognition, thus steering the direction of development in this field. Ding et al. (2023) proposed a novel seizure prediction model that utilizes a CNN to automatically capture features from EEG signals. This model combines multiple head attention mechanisms to identify relevant information within these features for the recognition of EEG signal segments. Deng et al. (2023) introduced a novel hybrid vision transformer (HViT) model that could enhance the multi-head attention mechanism by augmenting the capability of convolution to process local features, thereby achieving data uncertainty learning. Zhao et al. (Zhao X. et al., 2022) proposed a recommendation detector based on multi-head attention mechanism, utilized for detecting pathological high-frequency oscillations (HFOs) associated with epilepsy to locate the epileptogenic zones. The attention mechanism aids the network in capturing dependencies among features and enhancing the model’s sensitivity to local information. In the field of seizure detection, the potential of attention mechanism remains to be further explored.
In the epilepsy detection process using deep learning, EEG signals are represented as two-dimensional signals, considering only channel-based features and disregarding information about the physical distribution of channels. The electrode distribution in EEG exhibits a non-Euclidean topological structure, which can lead to the loss of connectivity information between brain functional regions, neglecting the long-term interdependencies among EEG signals from different channels. The graph convolutional network (GCN) algorithms can effectively leverage the implicit graph representation information within EEG signals. GCN algorithms utilize graph structures and update graph representations through node aggregation. GCN has been widely applied in numerous EEG signals, which have demonstrated excellent performance, such as emotion recognition (Song et al., 2021; Liu et al., 2022; Chen Y. et al., 2024; Li Y. et al., 2022), Alzheimer’s disease (Lopez et al., 2023), automatic seizure detection (Wagh and Varatharajah, 2020; Meng et al., 2022; Ho and Armanfard, 2023), driver state monitoring (Kalaganis et al., 2020), motor imagery (Cai et al., 2022), and sleep stage classification (Li M. et al., 2022; Jia et al., 2020; Lee et al., 2024; Ji et al., 2022; Jia et al., 2021). Wang et al. (2022) proposed a spatiotemporal graph attention network (STGAT) based on phase locking value (PLV) to extract spatial and functional connectivity information. Raeisi et al. (2022) constructed graph representations using three different types of spatial information and assessed the performance of neonatal seizure detection. He et al. (2022) utilized the graph attention network (GAT) to extract spatial features and employed a bi-directional long short-term memory network (BiLSTM) to capture temporal relationships before and after the current time frame for epilepsy detection.
The integration of attention mechanisms with GCN has proven effective in enhancing model performance on graph-structured data (Wu et al., 2024; Li et al., 2023; Cheng et al., 2023; Dong et al., 2022; Wang Y. et al., 2023; 2020; Grattarola et al., 2022). Attention helps highlight important nodes or features, improving the ability of GCN to capture both global and local relationships, which is crucial for EEG classification. The dynamic temporal graph convolutional network (DTGCN) (Wu et al., 2024) is proposed for seizure detection and classification, incorporating a seizure attention layer to capture the distribution patterns of epilepsy and a graph structure learning layer to represent the dynamically evolving graph structure in the data. A spatiotemporal hypergraph convolutional network (STHGCN) (Li et al., 2023) is designed to capture higher-order relationships in EEG recordings, construct feature hypergraphs across the spectral, spatial, and temporal domains to focus on EEG channel correlations and dynamic temporal relationships, and integrate self-attention mechanisms to initialize and update relationships within EEG sequences. A hybrid network (Cheng et al., 2023) is proposed, consisting of a Dynamic Graph Convolution (DGC) module and a Temporal Self-Attention Representation (TSAR) module. This network simultaneously integrates representative knowledge of spatial topology and temporal context into the EEG emotion recognition task. In summary, the integration of attention mechanisms with GCN allows for more effective feature representation by dynamically weighting the importance of spatial and temporal relationships, thereby enhancing the ability of model to capture complex dependencies in EEG data for emotion recognition tasks.
During the training process, traditional GCN describes the dynamic process of epileptic seizures using a single graph representation. During seizures, various complex interactions of neural activities occur, including different types of brainwave changes and alterations in connectivity patterns between brain regions. Therefore, the dynamic process of epileptic seizures cannot be exhaustively represented by a single static graph. To comprehend and describe seizures, it is necessary to consider the changes in the temporal dimension, and the interactions between different brain regions in the spatial dimension. Therefore, this study introduces a multi-branch graph convolutional model with multi-head attention (MGCNA) for childhood seizure detection. Specifically, the MGCNA employs three graph representation approaches to characterize the feature representation of EEG data from multiple dimensions. By incorporating a multi-head attention mechanism, it combines spatial topological information from multi-channel electrodes with dynamic temporal information, enhancing the global contextual awareness and recognition capabilities of model. The major contributions of MGCNA can be summarized as follows:
• A multi-branch GCN model is proposed. It utilizes Euclidean distance to capture spatial information between channels, employs Pearson correlation coefficient to gather functional connectivity information among channels, and supplements latent spatiotemporal correlations through a trainable adjacency matrix. The multi-channel EEG signals are modeled as graph signals, enabling the extraction of synchrony relationships within EEG signals.
• By integrating graph signals with a multi-head attention mechanism, attention weights for graph features are obtained, and the hidden vector representation of graph signals is derived through the summation of weighted values.
• We conduct patient-specific and patient-independent experiments to assist doctors in rapidly identifying the onset period in complex scenarios. The outcomes from these two experiments showcase the effectiveness of our method. Through comparison with other methods, the sensitivity, which is of utmost clinical concern, is the highest in two experiments.
The organization of the rest of this article is as follows. In Section 2, the proposed seizure detection model is introduced in terms of the overall MGCNA structure, extraction of intrachannels features, multi-branch GCN, multi-head attention mechanism, and classifier module. Section 3 presents the implementation details, performance evaluation metrics and experimental results of the CHB-MIT dataset. Section 4 interprets the results and emphasizes the limitations of the current study, and the conclusion is provided in Section 5.
2 Methods
In this section, we introduce our proposed MGCNA model for epilepsy classification using multi-channel EEG signal.
2.1 General structure
Figure 1 provides an overview of the overall process for classifying epileptic EEG signals using the MGCNA proposed in this article. First, intrachannels features are extracted from the raw EEG signals to create graph signals. Second, three different time-series-to-graph representation are employed and graph features are extracted through GCN. Third, a multi-head attention is utilized to learn dependencies of different graph features. Finally, the combined graph features are processed to output classification results.
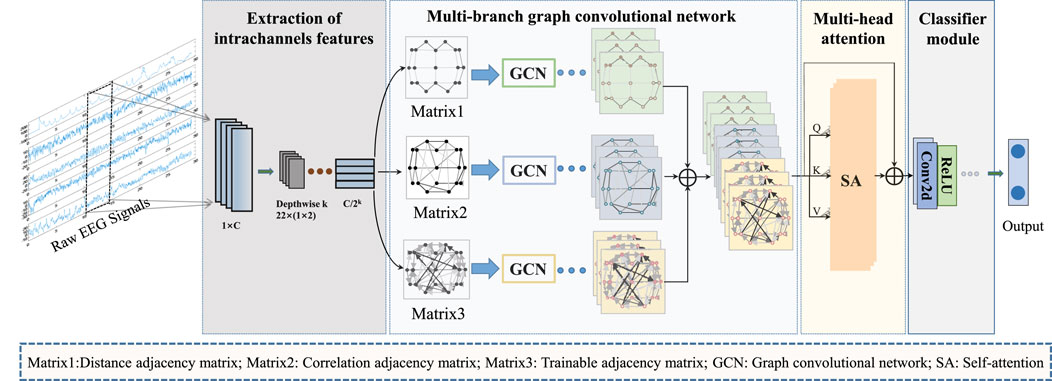
Figure 1. The overall architecture of MGCNA. There are mainly four steps including extraction of intrachannels features module; Multi-branch GCN; Multi-head attention module and Classifier module.
2.2 Extraction of intrachannels features
Convolution has been proven to be highly effective in capturing features of EEG signals. Inspired by the EEGWaveNet (Thuwajit et al., 2021) model, this module utilizes depthwise convolution to compress the input signals’ resolution in a channel-wise manner and capture features. Depthwise convolution does not cross information between channels and extracts features independently. This module comprises
In this module, the input data
The module of extraction of intrachannels features can be represented as:
where
2.3 Multi-branch graph convolutional network
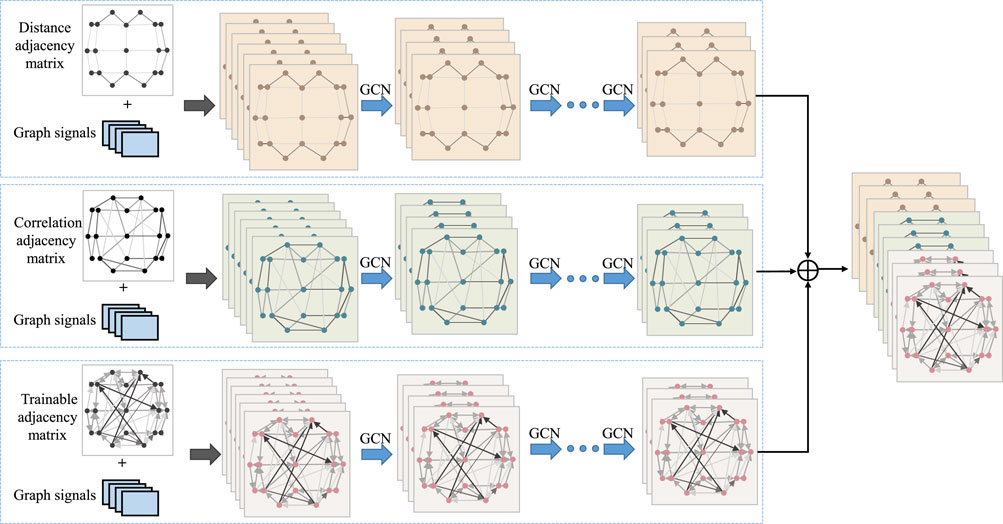
To design an appropriate graph representation for EEG signals, it is necessary to construct a graph based on the physical distribution of channels and the spectral-temporal domain characteristics of the signals. Each channel was considered as a node and the connection of each node is characterized in terms of spatial position information, EEG signal similarity features, and a learnable graph representation to dynamically capture the topological relationship between EEG signal channels. These three types of graph signals are input into GCN, allowing us to leverage the structural characteristics of EEG signals to capture spatial dependencies between nodes. Figure 3 illustrates the overall process of multi-branch GCN. The graph convolution processes at the top, middle, and bottom are based on spatial distance graph representation, functional connectivity graph representation, and adaptive graph representation, respectively.
2.3.1 Graph generator
Graph representation consists of graph signal and graph. Graph signals are extracted from extraction of intrachannels features module. A graph is denoted as
2.3.1.1 Spatial distance graph learning
Seizures are produced by abnormal nerve discharges in different areas of the cerebral cortex and cause significant changes in the EEG. And this abnormal discharge spreads and affects neighboring brain regions, making strong correlation between adjacent areas. So the spatial distance between nodes of EEG signals is used for graph representation in EEG signal analysis.
In this approach, we consider the electrode positions of the EEG as a three-dimensional grid model. To represent the spatial distance of EEG electrodes, we compute adjacency matrix
where
where
2.3.1.2 Functional connectivity graph learning
The strength of association between channels varies during seizures. and the synchronization between brain regions can be assessed by calculating the connectivity between channels. Therefore, we investigate the relationship of information interaction between channels during seizures.
The functional connectivity between nodes of EEG signals is used for graph representation in EEG signal analysis. To represent the functional connectivity of EEG electrodes, we compute adjacency matrix
where
where
2.3.1.3 Adaptive graph learning
The human brain possesses extremely complex structure and functionality, and analyzing it merely through spatial distance and functional connectivity graph structures does not fully capture its functions and behavioral manifestations. The neural network model aims to simulate the interconnection and information transfer between neurons in the human brain, enabling learning and reasoning of complex tasks. Therefore, we incorporate graph structures as part of the parameters in neural networks, training them to capture the coupling relationships with EEG signals.
The adaptive graph learning method can learn the intrinsic connections between EEG signals. In the adaptive graph learning method we employed, the adjacency matrix
where
2.3.2 Graph convolution
A general GCN model (Kipf and Welling, 2016; Defferrard et al., 2016) takes graph signals
where
Notably, the structures of the three GCN branches are identical, but their parameters are not shared. After each GCN, Batch Normalization
where
where
2.4 Multi-head attention mechanism
The attention mechanism, which is a deep learning model, emulates the pivotal information and critical elements that individuals concentrate on during observations. The multi-head attention mechanism makes the output of attention to incorporate encoding from different spatial locations, thereby enhancing the expressive power of the model. In standard multi-head attention with input matrix
where
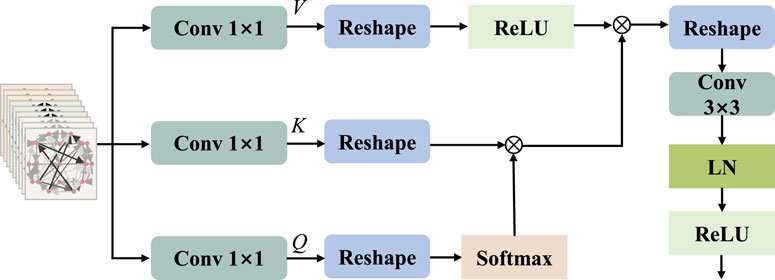
Inspired by MobileViT v2 (Mehta and Rastegari, 2022) and HViT-DUL (Deng et al., 2023), the multi-head design is incorporated into the separable self-attention mechanism, which is applied to the proposed model for the reduction of computational overhead. The separable multi-head attention mechanism employed in this paper has a linear complexity of
where
To calculate self attention scores, we apply the
where
where
2.5 Classifier module
A classifier module is placed after the multi-head attention mechanism for the final class inference. Initially, it involves two layers of 2D convolution, with a
where
where
2.6 Training procedure
In order to achieve optimal network parameters during the training process, we employ the backpropagation (BP) algorithm, which iteratively updates the network parameters until an optimal or suboptimal solution is reached. In this context, we introduce a loss function based on binary cross entropy, defined as follows:
where
For adaptive graph learning, the adjacency matrix A3 is a trainable parameter within the network that optimizes with model optimization. The partial derivatives of the loss function with respect to the optimal adjacency matrix A3 and the loss are expressed as follows:
2.7 Dataset
The CHB-MIT dataset (Shoeb, 2009) was collected by Boston Children’s Hospital and is currently the most widely used public dataset. The multichannel scalp EEG signals consists of EEG signal recordings from 23 children with epilepsy at a sampling rate of 256 Hz. The EEG signals are collected using EEG electrodes placed according to the International 10–20 system. The dataset comprises approximately 983 h of EEG recordings, including 198 seizure onset events, with a total duration of 3 h 15 min.
2.8 Implementation details
In the CHB-MIT dataset, most records have 23 channels, while some records have missing or duplicated channels. In this study, 22 channels are selected in this study to maintain consistency of channels among all patients. The selected 22 channels are FP1-F7, F7-T7, T7-P7, P7-O1, FP1-F3, F3-C3, C3-P3, P3-O1, FP2-F4, F4-C4, C4-P4, P4-O2, FP2-F8, F8-T8, T8-P8, P8-O2, FZ-CZ, CZ-PZ, P7-T7, T7-FT9, FT9-FT10, FT10-T8. This dataset is classed into two categories, including interictal and ictal. To reduce the effect of noise, a fifth-order Butterworth band-pass filter ranging from 0.5 Hz to 70 Hz was used. The filtered EEG signals are segmented into 3-s windows. Due to the scarcity of ictal EEG data compared to interictal EEG data, the windows overlap by 50
For a comprehensive evaluation of the MGCNA, we train both a patient-independent model and a patient-specific model. In a patient-specific approach, the model is trained, validated, and tested using data from an individual subject. Interictal signals are randomly discarded for each subject, and the ratio of interictal signals to ictal signals is maintained at 5:1. As the number of ictal signals is significantly lower than that of interictal signals, which is detrimental to model training, we employ re-sampling to create a balanced training dataset. In each epoch of training, a random selection of an equal number of interictal signals is made to match the ictal signals in the training set, followed by random shuffling. Consequently, we obtain a balanced training subset for each epoch. We employ a 5-fold cross-validation approach and report the average performance. In a patient-independent approach, the model was trained and validated using data from multiple subjects, and then tested on data from individual subject. We utilized the leave-one-subject-out cross-validation as evaluation method. The data in both categories are kept balanced. The patient-specific approach emphasizes individual differences and personalization, and the patient-independent approach focuses more on overall trends and general patterns.
We employ the Adam optimizer with a learning rate of 3e-4, a weight decay of 1e-3.The dropout rate is experimentally set to 0.5.
2.9 Performance evaluation metrics
We use eight different performance metrics to evaluate the performance of MGCNA including Accuracy (Acc), Sensitivity (Sen), Specificity (Spe),
Accuracy represents the proportion of samples correctly classified by the model out of the total sample count. Sensitivity and Specificity measure the model’s ability to classify positive and negative samples. F1 Score combines precision and recall to provide a comprehensive performance measure. AUC is based on the area under the ROC curve and provides a comprehensive performance metric for unbalanced category distributions.
3 Experimental results
3.1 Patient-specific experiments
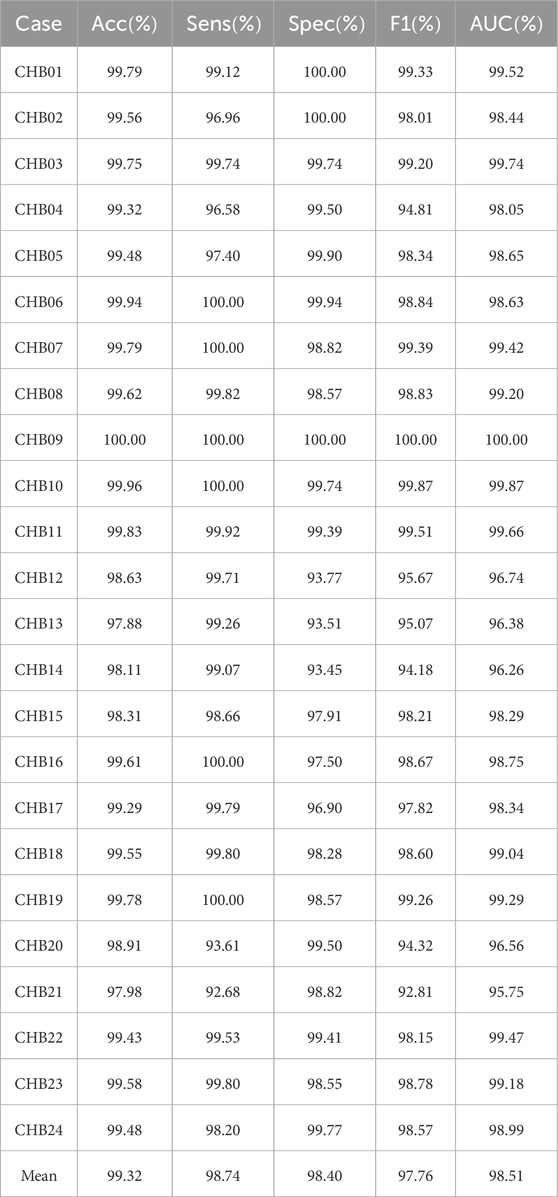
Patient-specific experimental results on CHB-MIT dataset using the MGCNA are shown in Table 1. According to the table, the model demonstrates an average accuracy of 99.32
3.2 Patient-independent experiments
In contrast to the patient-specific experiments, patient-independent experiments involve training a general model for all patients. The experiment employed the leave-one-out method. Patient-independent experiments separate one patient’s signal as a test set, using the EEG data of other patients as the training set and Validation set. This allows the model to detect epileptic activity in the test set by learning common seizure characteristics from the training set. This experiment is more clinically meaningful but requires to address differences in EEG signals among different patients, which may result from physiological variations, equipment noise, etc. Compared to patient-specific experiments, patient-independent experiments make it more challenging for the algorithm to identify epileptic seizures and lead to poorer detection results.
Patient-independent experimental results on CHB-MIT dataset using the MGCNA are shown in Table 2. As seen in the table, the average values for Accuracy, Sensitivity, Specificity, and F1 are all above 80
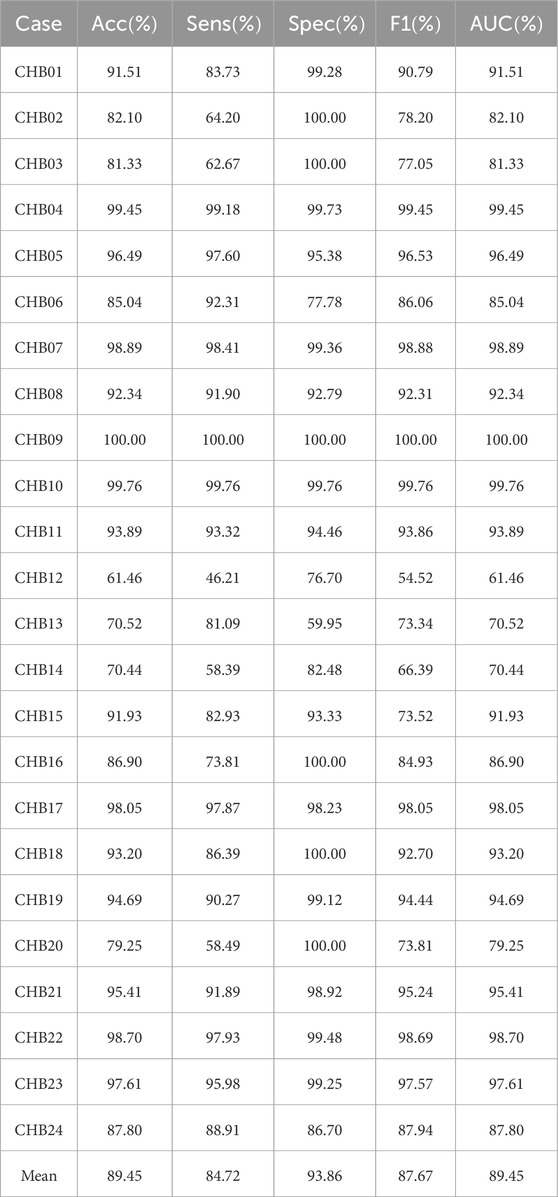
Table 2. Patient-independent experimental results on CHB-MIT dataset using the proposed architecture.
3.3 Ablation study
To assess the contributions of different components in our model to classification performance, we conduct comparative experiments using model based only on similarity graph representation, model based only on distance graph representation, model based only on trainable graph representation, and model without multi-head attention. To ensure the fairness of the experiments, the model settings are kept consistent. The results are shown in Figures 6, 7.

Figure 6. Ablation study for epilepsy recognition CHB-MIT dataset of different graph learning.∗h1 represents the use of spatial distance graph learning only. ∗h2 indicates the use of functional connectivity graph learning only. ∗h3 denotes the use of adaptive graph learning only.
Graph convolutional network uses only spatial distance graph learning, denoted as ∗h1. Graph convolutional network uses only functional connectivity graph learning, denoted as ∗h2. Graph convolutional network uses adaptive graph learning, denoted as ∗h3. Non-attention graph representation models refers to the model that does not employ self-attention mechanisms to obtain self-attention scores for the three graph representations. We directly concatenate the representations of three graphs into a graph feature, denoted as ∗self-attention.
From the Figures 6, 7, it is evident that MGCNA outperforms the other four ablation experiments. Compared to our model in this paper, the accuracy of the four ablation experiment models is lower by 5.22
The effect of the self-attention mechanism on epilepsy detection approximates that of the model using only distance graph representation. Figure 7 illustrates that allocating different attention weights to graph features through self-attention mechanism helps to capture dependencies between graph features and enhances the model’s ability to model relationships between graph features, which can achieve good performance in epilepsy detection. The model can effectively utilize the spatiotemporal relationships among EEG signals, supplement information through learnable graph representations, and obtain attention scores through self-attention mechanisms, and therefore the model’s learning capability has been significantly enhanced.
To further validate the superiority of MGCNA, t-SNE is applied to visualize and analyze the features extracted from the ablation study. As depicted in Figure 8, the t-SNE visualization in two-dimensional embedding space illustrates the interictal and ictal features for both patient-specific and patient-independent experiments. We can see that in both patient-specific and patient-independent experiments, our approach exhibits superior recognition capabilities compared to the ablated models. Particularly, models utilizing only one graph construction method tend to confuse some interictal and ictal features. In contrast, better discriminative features were obtained using MGCNA, mainly in terms of significant inter-ictal distances and dense intra-ictal distributions. These observations indicate that combining multi-branch GCN with self-attention mechanisms can yield the optimal performance for epileptic seizure classification.
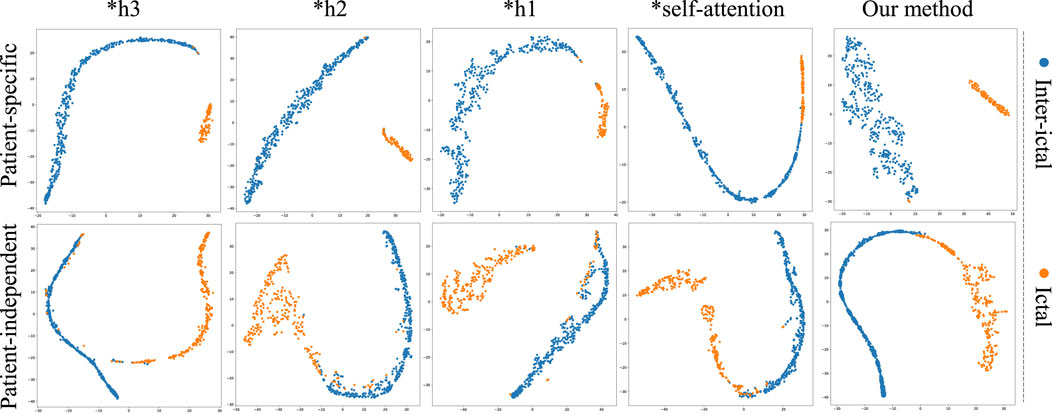
Figure 8. The t-SNE visualization in 2D embedding space of interictal and ictal features by comparing the models from ablation study.
4 Discussion
4.1 The influence of thresholds on graph representations
In both functional connectivity graph learning and spatial distance graph learning methods, it is necessary to set a threshold for constructing an adjacency matrix. The constructed adjacency matrix must not only ensure the sparsity of the graph but also be capable of distinguishing temporal and spatial characteristics of different types of EEG data to enhance the accuracy of the model in identifying epileptic seizures.
Figure 9A depicts the average epileptic seizure detection results of the CHB-MIT dataset in patient-specific and patient-independent experiments, under varying thresholds
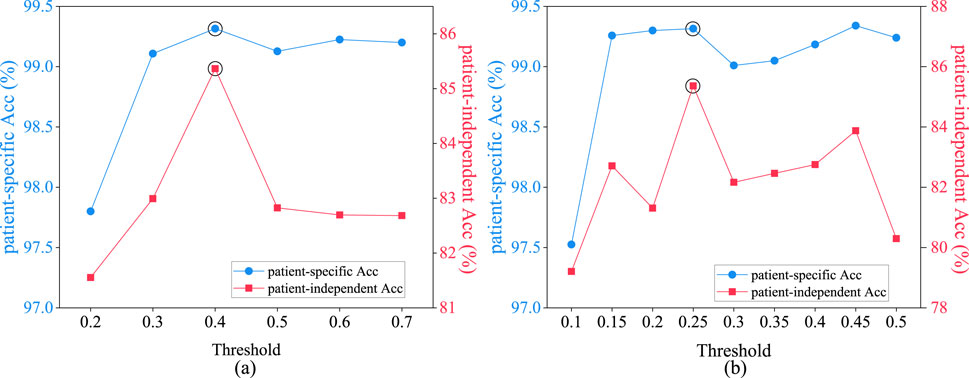
Figure 9. Performance comparison of patient-specific and patient-independent experiments with different thresholds. (A) spatial distance graph; (B) functional connectivity graph.
Figure 9B illustrates the average epileptic seizure detection results in both patient-specific and patient-independent experiments under various threshold values
The spatial distance graph learning based on Equation 3 with the threshold
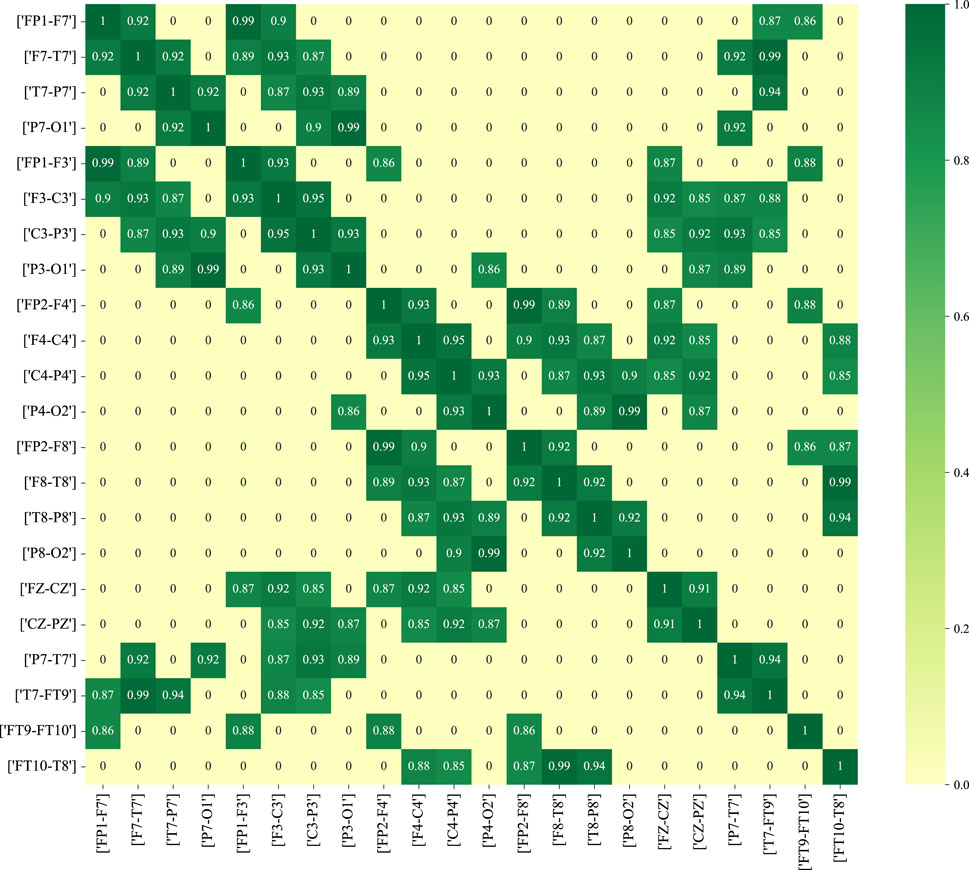
Figure 11 depicts the functional connectivity graph learning of interictal and ictal signals under thresholds set at 0.25. In the figure, we have selected and described the functional connectivity graph learning that represents interictal and ictal signals with the highest degree of similarity. The values in the graph are calculated as the Pearson correlation coefficients, which are then normalized into a similarity adjacency matrix ranging from 0 to 1. From Figure 11, it can be observed that functional connectivity graph learning for interictal signals exhibits a strong degree of similarity, while the ictal signal displays weaker inter-correlations across many bipolar derivations. Graph representations based on functional connectivity can depict the functional connections between brain regions as interdependencies among EEG signals.
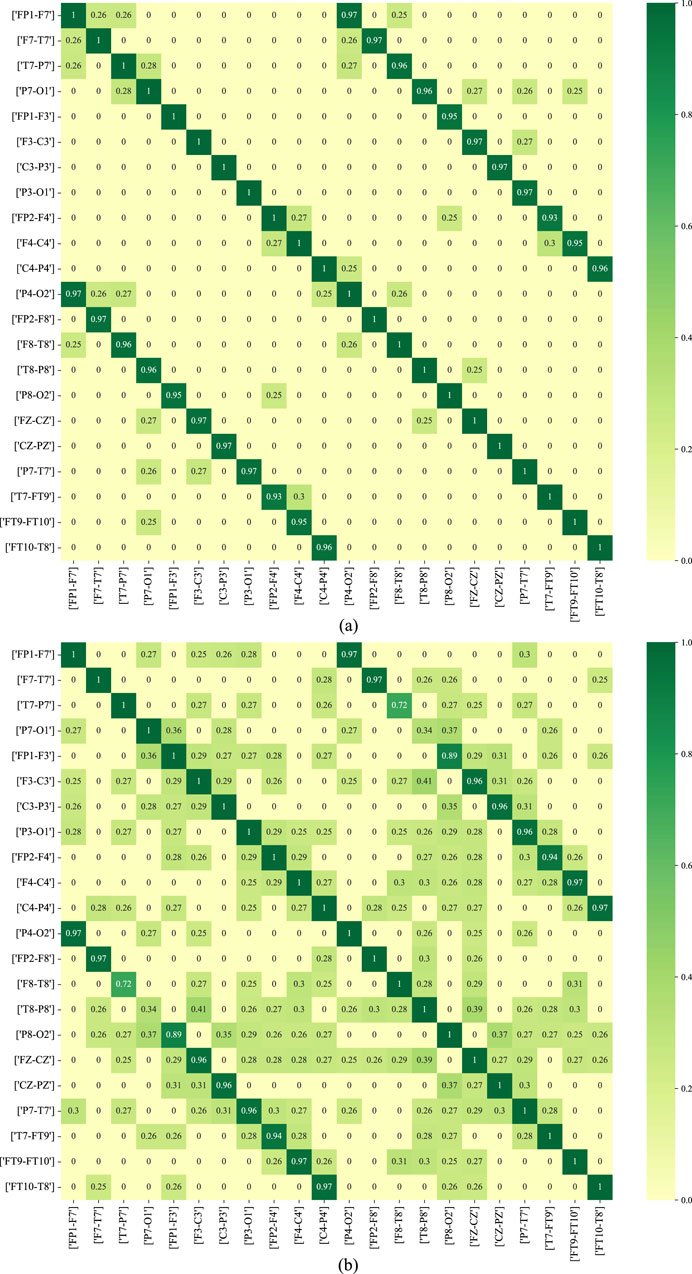
Figure 11. The functional connectivity graph learning of interictal and ictal signals under thresholds
4.2 Comparisons with state-of-the-art methods
Table 3 presents a performance comparison between the proposed MGCNA and state-of-the-art epilepsy detection algorithms in the patient-specific experimental setting. Most of these methods involve feature extraction and deep learning algorithms for epilepsy detection. It is evident that the advancement of deep learning methods holds significant importance for signal recognition and detection.
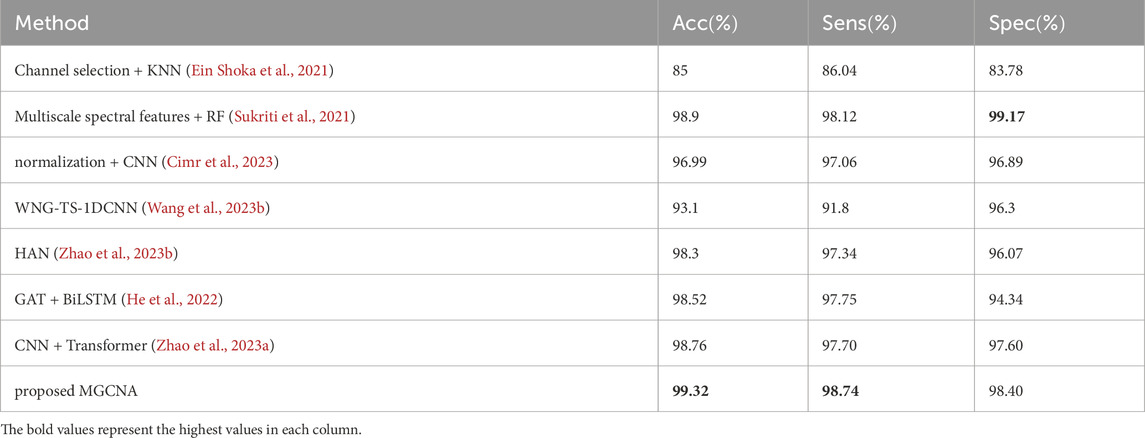
Table 3. Comparisons of performance between proposed method and recent works (patient-specific experimental setting).
Machine learning methods are classical approaches for epilepsy detection. Ein Shoka et al. (2021) conducted feature extraction after channel selection and evaluated the performance of different classifiers for epilepsy detection, with KNN exhibiting the best classification performance. Sukriti et al. (Sukriti et al., 2021) extracted multiscale spectral features (MSSFs) and employed a random forest classifier for epilepsy classification exhibits a higher specificity compared to MGCNA (99.17
GCN can analyze signals by considering the three-dimensional spatial positions of EEG electrodes, thereby compensating for potential spatial information loss in deep learning methods such as CNN. The introduction of GCN can be utilized to analyze the spatiotemporal correlations among channels. Methods based on GCN have already demonstrated excellent performance for the detection of epileptic signals. Wang et al. (2023b) introduced a two-stream graph-based framework for learning the Weighted Neighbour Graph (WNG) representation in both the frequency and time domains. However, this approach achieved inferior accuracy, sensitivity, and specificity, with values of 93.1
Table 4 presents comparisons of performance between the proposed method and state-of-the-art epilepsy detection algorithms in the patient-independent experimental setting. Due to the substantial variations in signals among different patients, the overall performance of the patient-independent experiment is lower than that of the patient-specific experiment. The accuracy of the patient-independent experiment based on SVM (Shoeb, 2009) only reaches 58.32
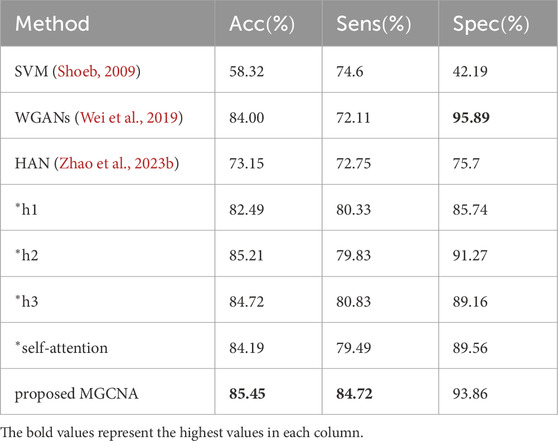
Table 4. Comparisons of performance between proposed method and recent works (patient-independent experimental setting).
Through the above analysis, the MGCNA framework offers several key advantages. First, it employs a multi-branch graph convolutional network structure that dynamically learns temporal correlations and spatial topological information, enhancing the ability to process complex EEG signals, particularly in capturing spatial and temporal dependencies in epileptic brains. Second, the use of three graph learning approaches allows for a comprehensive evaluation of connectivity and synchronization across multiple channels, improving adaptability in different patient scenarios. Additionally, the multi-head attention mechanism further strengthens the framework’s ability to handle local features and complex EEG patterns. Experimental results demonstrate that MGCNA outperforms other methods in both patient-specific and patient-independent tasks, highlighting its strong generalization capabilities. Lastly, as an end-to-end automatic seizure detection model, MGCNA can be applied in clinical decision-making, helping clinicians diagnose childhood epileptic seizures more quickly and accurately, providing significant practical value.
4.3 Limitations and future work
While the MGCNA achieved satisfactory results in both patient-specific and patient-independent experiments, the MGCNA has several limitations. Firstly, spatial distance graph learning requires the prior determination of channel locations and is not robust to variations in EEG channel count. If channels are missing or if channel locations change, it can adversely affect recognition performance. Secondly, our model has a relatively long computation time because it involves calculating Pearson correlation coefficients for each sample to extract features for constructing EEG graph representations. Finally, the performance of model may depend on the quality and diversity of the data it has been trained on, and it is crucial to validate it on larger, more diverse datasets to ensure its generalizability. Specifically, both functional connectivity graph learning and spatial distance graph learning employ thresholds.
In future work, it is essential to explore graph representation methods that are more suitable for epileptic signals. While many scholars have already employed various graph representations (Raeisi et al., 2022), these often involve manual feature engineering and have long computation times. In the future, it’s possible to explore alternative composition methods or utilize clustering algorithms to identify the most suitable adjacency matrix. In the future, we will explore alternative graph generation techniques, such as imposing appropriate constraints on trainable adjacency matrix or using clustering algorithms to identify the most suitable graph generator. Identifying the most suitable graph representation method for epileptic signal recognition is of paramount importance. In this study, patient-independent experiments hold more clinical relevance, and there is significant room for improvement in accuracy. To capture common seizure characteristics among different patients, techniques such as transfer learning will be considered to enhance the accuracy of patient-independent experiments. In current research, considerable attention has been devoted to the occurrence of seizures, yet there exist variations in seizure types among individuals. Consequently, in future investigations, emphasis will be placed on the analysis of seizure types in epilepsy research.
5 Conclusion
This study proposes a children epilepsy detection model named as MGCNA that combines a multi-branch GCN with multi-head attention. The MGCNA leverages three graph structures to learn spatiotemporal features among channels. It uses spatial graph representations to capture spatial distances between channels, functional connections between channels to learn spatial dependencies in the signals, and employs learnable graph representations to complement spatiotemporal features. The model employs a multi-head attention to assign importance weights to graph signals, learning relationships between graph representations. The model’s performance in classifying epileptic EEG signals is validated on the CHB-MIT dataset through patient-specific and patient-independent experiments. The experimental results indicate that the MGCNA shows excellent performance of childhood seizure detection surpassing other existing methods. This method can be used to assist in the childhood seizure detection and effectively reduce the workload of physicians. The EEG classification algorithm introduced in this research provides the potential to establish an EEG monitoring system for children with epilepsy.
Data availability statement
The original contributions presented in the study are included in the article/supplementary material, further inquiries can be directed to the corresponding authors.
Author contributions
YL: Data curation, Investigation, Methodology, Writing–original draft, Writing–review and editing, Validation. YY: Funding acquisition, Methodology, Resources, Writing–original draft. SS: Investigation, Resources, Supervision, Writing–review and editing. HW: Funding acquisition, Methodology, Writing–review and editing. MS: Investigation, Methodology, Writing–review and editing, Validation. XL: Investigation, Methodology, Writing–review and editing. PZ: Methodology, Writing–review and editing. BW: Methodology, Writing–review and editing. NW: Methodology, Writing–review and editing. QS: Methodology, Writing–review and editing. ZH: Methodology, Writing–review and editing.
Funding
The author(s) declare that financial support was received for the research, authorship, and/or publication of this article. This study was supported by the Shandong Provincial Natural Science Foundation of China, grant numbers ZR2019ZD01, ZR2020MF027, and ZR2020MF143.
Conflict of interest
Authors MS and XL were employed by Neusoft Medical Systems Co., Ltd.
The remaining authors declare that the research was conducted in the absence of any commercial or financial relationships that could be construed as a potential conflict of interest.
Publisher’s note
All claims expressed in this article are solely those of the authors and do not necessarily represent those of their affiliated organizations, or those of the publisher, the editors and the reviewers. Any product that may be evaluated in this article, or claim that may be made by its manufacturer, is not guaranteed or endorsed by the publisher.
References
Abbas A. K., Azemi G., Ravanshadi S., Omidvarnia A. (2021). An eeg-based methodology for the estimation of functional brain connectivity networks: application to the analysis of newborn eeg seizure. Biomed. Signal Process. Control 63, 102229. doi:10.1016/j.bspc.2020.102229
Abu A., Diamant R. (2023). Underwater object classification combining sas and transferred optical-to-sas imagery. arXiv Prepr. arXiv:2304.11875 144, 109868. doi:10.1016/j.patcog.2023.109868
Cai S., Li H., Wu Q., Liu J., Zhang Y. (2022). Motor imagery decoding in the presence of distraction using graph sequence neural networks. IEEE Trans. Neural Syst. Rehabilitation Eng. 30, 1716–1726. doi:10.1109/TNSRE.2022.3183023
Cao J., Feng Y., Zheng R., Cui X., Zhao W., Jiang T., et al. (2022). Two-stream attention 3-d deep network-based childhood epilepsy syndrome classification. IEEE Trans. Instrum. Meas. 72, 1–12. doi:10.1109/tim.2022.3220287
Chen J., Chen C., Huang W., Zhang J., Debattista K., Han J. (2024a). Dynamic contrastive learning guided by class confidence and confusion degree for medical image segmentation. Pattern Recognit. 145, 109881. doi:10.1016/j.patcog.2023.109881
Chen Y., Xu X., Bian X., Qin X. (2024b). Eeg emotion recognition based on ordinary differential equation graph convolutional networks and dynamic time wrapping. Appl. Soft Comput. 152, 111181. doi:10.1016/j.asoc.2023.111181
Cheng C., Yu Z., Zhang Y., Feng L. (2023). Hybrid network using dynamic graph convolution and temporal self-attention for eeg-based emotion recognition. IEEE Trans. Neural Netw. Learn. Syst., 1–11. doi:10.1109/tnnls.2023.3319315
Cimr D., Fujita H., Tomaskova H., Cimler R., Selamat A. (2023). Automatic seizure detection by convolutional neural networks with computational complexity analysis. Comput. Methods Programs Biomed. 229, 107277. doi:10.1016/j.cmpb.2022.107277
Cui G., Xia L., Tu M., Liang J. (2017). Automatic classification of epileptic electroencephalogram based on multiscale entropy and extreme learning machine. J. Med. Imaging Health Inf. 7, 949–955. doi:10.1166/jmihi.2017.2121
Cui X., Cao J., Hu D., Wang T., Jiang T., Gao F. (2022a). Regional scalp eegs analysis and classification on typical childhood epilepsy syndromes. IEEE Trans. Cognitive Dev. Syst. 15, 662–674. doi:10.1109/tcds.2022.3175636
Cui X., Hu D., Lin P., Cao J., Lai X., Wang T., et al. (2022b). Deep feature fusion based childhood epilepsy syndrome classification from electroencephalogram. Neural Netw. 150, 313–325. doi:10.1016/j.neunet.2022.03.014
Defferrard M., Bresson X., Vandergheynst P. (2016). Convolutional neural networks on graphs with fast localized spectral filtering. Adv. neural Inf. Process. Syst. 29.
Deng Z., Li C., Song R., Liu X., Qian R., Chen X. (2023). Eeg-based seizure prediction via hybrid vision transformer and data uncertainty learning. Eng. Appl. Artif. Intell. 123, 106401. doi:10.1016/j.engappai.2023.106401
Ding X., Nie W., Liu X., Wang X., Yuan Q. (2023). Compact convolutional neural network with multi-headed attention mechanism for seizure prediction. Int. J. Neural Syst. 33, 2350014. doi:10.1142/S0129065723500144
Dong C., Zhao Y., Zhang G., Xue M., Chu D., He J., et al. (2022). Attention-based graph resnet with focal loss for epileptic seizure detection. J. Ambient Intell. Smart Environ. 14, 61–73. doi:10.3233/ais-210086
Ein Shoka A. A., Alkinani M. H., El-Sherbeny A., El-Sayed A., Dessouky M. M. (2021). Automated seizure diagnosis system based on feature extraction and channel selection using eeg signals. Brain Inf. 8, 1–16. doi:10.1186/s40708-021-00123-7
Feng Y., Zheng R., Cui X., Wang T., Jiang T., Gao F., et al. (2022). 3d residual-attention-deep-network-based childhood epilepsy syndrome classification. Knowledge-Based Syst. 248, 108856. doi:10.1016/j.knosys.2022.108856
Grattarola D., Livi L., Alippi C., Wennberg R., Valiante T. A. (2022). Seizure localisation with attention-based graph neural networks. Expert Syst. Appl. 203, 117330. doi:10.1016/j.eswa.2022.117330
He J., Cui J., Zhang G., Xue M., Chu D., Zhao Y. (2022). Spatial–temporal seizure detection with graph attention network and bi-directional lsm architecture. Biomed. Signal Process. Control 78, 103908. doi:10.1016/j.bspc.2022.103908
Ho T. K. K., Armanfard N. (2023). Self-supervised learning for anomalous channel detection in eeg graphs: application to seizure analysis. Proc. AAAI Conf. Artif. Intell. 37, 7866–7874. doi:10.1609/aaai.v37i7.25952
Ji X., Li Y., Wen P. (2022). Jumping knowledge based spatial-temporal graph convolutional networks for automatic sleep stage classification. IEEE Trans. Neural Syst. Rehabilitation Eng. 30, 1464–1472. doi:10.1109/tnsre.2022.3176004
Jia Z., Lin Y., Wang J., Ning X., He Y., Zhou R., et al. (2021). Multi-view spatial-temporal graph convolutional networks with domain generalization for sleep stage classification. IEEE Trans. Neural Syst. Rehabilitation Eng. 29, 1977–1986. doi:10.1109/TNSRE.2021.3110665
Jia Z., Lin Y., Wang J., Zhou R., Ning X., He Y., et al. (2020). Graphsleepnet: adaptive spatial-temporal graph convolutional networks for sleep stage classification. IJCAI 2021, 1324–1330. doi:10.24963/ijcai.2020/184
Kalaganis F. P., Laskaris N. A., Chatzilari E., Nikolopoulos S., Kompatsiaris I. (2020). A data augmentation scheme for geometric deep learning in personalized brain–computer interfaces. IEEE access 8, 162218–162229. doi:10.1109/access.2020.3021580
Kannathal N., Choo M. L., Acharya U. R., Sadasivan P. (2005). Entropies for detection of epilepsy in eeg. Comput. methods programs Biomed. 80, 187–194. doi:10.1016/j.cmpb.2005.06.012
Lee S., Yu Y., Back S., Seo H., Lee K. (2024). Sleepy: automatic sleep scoring with feature pyramid and contrastive learning. Expert Syst. Appl. 240, 122551. doi:10.1016/j.eswa.2023.122551
Li M., Chen H., Cheng Z. (2022a). An attention-guided spatiotemporal graph convolutional network for sleep stage classification. Life 12, 622. doi:10.3390/life12050622
Li M., Qiu M., Zhu L., Kong W. (2023). Feature hypergraph representation learning on spatial-temporal correlations for eeg emotion recognition. Cogn. Neurodynamics 17, 1271–1281. doi:10.1007/s11571-022-09890-3
Li Y., Chen J., Li F., Fu B., Wu H., Ji Y., et al. (2022b). Gmss: graph-based multi-task self-supervised learning for eeg emotion recognition. IEEE Trans. Affect. Comput. 14, 2512–2525. doi:10.1109/taffc.2022.3170428
Lian J., Xu F. (2023). Epileptic eeg classification via graph transformer network. Int. J. neural Syst. 33, 2350042. doi:10.1142/S0129065723500429
Liu D., Dong X., Bian D., Zhou W. (2023). Epileptic seizure prediction using attention augmented convolutional network. Int. J. Neural Syst. 33, 2350054. doi:10.1142/S0129065723500545
Liu H., Zhang J., Liu Q., Cao J. (2022). Minimum spanning tree based graph neural network for emotion classification using eeg. Neural Netw. 145, 308–318. doi:10.1016/j.neunet.2021.10.023
Lopez S., Del Percio C., Lizio R., Noce G., Padovani A., Nobili F., et al. (2023). Patients with alzheimer’s disease dementia show partially preserved parietal ‘hubs’ modeled from resting-state alpha electroencephalographic rhythms. Front. Aging Neurosci. 15, 780014. doi:10.3389/fnagi.2023.780014
Mehta S., Rastegari M. (2022). Separable self-attention for mobile vision transformers. arXiv Prepr. arXiv:2206.02680. doi:10.48550/arXiv.2206.02680
Meng L., Hu J., Deng Y., Hu Y. (2022). Electrical status epilepticus during sleep electroencephalogram waveform identification and analysis based on a graph convolutional neural network. Biomed. Signal Process. Control 77, 103788. doi:10.1016/j.bspc.2022.103788
Na J., Wang Z., Lv S., Xu Z. (2021). An extended k nearest neighbors-based classifier for epilepsy diagnosis. IEEE Access 9, 73910–73923. doi:10.1109/access.2021.3081767
Peh W. Y., Thangavel P., Yao Y., Thomas J., Tan Y.-L., Dauwels J. (2023). Six-center assessment of conn-transformer with belief matching loss for patient-independent seizure detection in eeg. Int. J. Neural Syst. 33, 2350012. doi:10.1142/S0129065723500120
Qiu X., Yan F., Liu H. (2023). A difference attention resnet-lstm network for epileptic seizure detection using eeg signal. Biomed. Signal Process. Control 83, 104652. doi:10.1016/j.bspc.2023.104652
Raeisi K., Khazaei M., Croce P., Tamburro G., Comani S., Zappasodi F. (2022). A graph convolutional neural network for the automated detection of seizures in the neonatal eeg. Comput. Methods Programs Biomed. 222, 106950. doi:10.1016/j.cmpb.2022.106950
Rennie J., Chorley G., Boylan G., Pressler R., Nguyen Y., Hooper R. (2004). Non-expert use of the cerebral function monitor for neonatal seizure detection. Archives Dis. Childhood-Fetal Neonatal Ed. 89, 37–40. doi:10.1136/fn.89.1.f37
Shoeb A. H. (2009). Application of machine learning to epileptic seizure onset detection and treatment. Ph.D. thesis, Mass. Inst. Technol.
Singh G., Singh B., Kaur M. (2019). Grasshopper optimization algorithm–based approach for the optimization of ensemble classifier and feature selection to classify epileptic eeg signals. Med. and Biol. Eng. and Comput. 57, 1323–1339. doi:10.1007/s11517-019-01951-w
Song T., Liu S., Zheng W., Zong Y., Cui Z., Li Y., et al. (2021). Variational instance-adaptive graph for eeg emotion recognition. IEEE Trans. Affect. Comput. 14, 343–356. doi:10.1109/taffc.2021.3064940
Song T., Zheng W., Song P., Cui Z. (2018). Eeg emotion recognition using dynamical graph convolutional neural networks. IEEE Trans. Affect. Comput. 11, 532–541. doi:10.1109/taffc.2018.2817622
Sukriti , Chakraborty M., Mitra D. (2021). A computationally efficient automated seizure detection method based on the novel idea of multiscale spectral features. Biomed. Signal Process. Control 70, 102990. doi:10.1016/j.bspc.2021.102990
Sun Q., Yang Y. (2023). Unsupervised video anomaly detection based on multi-timescale trajectory prediction. Comput. Vis. Image Underst. 227, 103615. doi:10.1016/j.cviu.2022.103615
Thuwajit P., Rangpong P., Sawangjai P., Autthasan P., Chaisaen R., Banluesombatkul N., et al. (2021). Eegwavenet: multiscale conn-based spatiotemporal feature extraction for eeg seizure detection. IEEE Trans. Industrial Inf. 18, 5547–5557. doi:10.1109/tii.2021.3133307
Wagh N., Varatharajah Y. (2020). “Eeg-gcnn: augmenting electroencephalogram-based neurological disease diagnosis using a domain-guided graph convolutional neural network,” in Machine Learning for health (PMLR), 367–378.
Wang H., Xu L., Bezerianos A., Chen C., Zhang Z. (2020). Linking attention-based multiscale conn with dynamical gcn for driving fatigue detection. IEEE Trans. Instrum. Meas. 70, 1–11. doi:10.1109/tim.2020.3047502
Wang J., Gao R., Zheng H., Zhu H., Shi C.-J. R. (2023a). Ssgcnet: a sparse spectra graph convolutional network for epileptic eeg signal classification. IEEE Trans. Neural Netw. Learn. Syst. 35, 12157–12171. doi:10.1109/tnnls.2023.3252569
Wang J., Liang S., Zhang J., Wu Y., Zhang L., Gao R., et al. (2023b). EEG signal epilepsy detection with a weighted neighbor graph representation and two-stream graph-based framework. IEEE Trans. Neural Syst. Rehabilitation Eng. 31, 3176–3187. doi:10.1109/tnsre.2023.3299839
Wang Y., Cui W., Yu T., Li X., Liao X., Li Y. (2023c). Dynamic multi-graph convolution based channel-weighted transformer feature fusion network for epileptic seizure prediction. IEEE Trans. Neural Syst. Rehabilitation Eng. 31, 4266–4277. doi:10.1109/tnsre.2023.3321414
Wang Y., Shi Y., Cheng Y., He Z., Wei X., Chen Z., et al. (2022). A spatiotemporal graph attention network based on synchronization for epileptic seizure prediction. IEEE J. Biomed. Health Inf. 27, 900–911. doi:10.1109/JBHI.2022.3221211
Wang Z., Hou S., Xiao T., Zhang Y., Lv H., Li J., et al. (2023d). Lightweight seizure detection based on multi-scale channel attention. Int. J. Neural Syst. 33, 2350061. doi:10.1142/S0129065723500612
Wei Z., Zou J., Zhang J., Xu J. (2019). Automatic epileptic eeg detection using convolutional neural network with improvements in time-domain. Biomed. Signal Process. Control 53, 101551. doi:10.1016/j.bspc.2019.04.028
Wu G., Yu K., Zhou H., Wu X., Su S. (2024). Time-series anomaly detection based on dynamic temporal graph convolutional network for epilepsy diagnosis. Bioengineering 11, 53. doi:10.3390/bioengineering11010053
Xiao T., Wang Z., Zhang Y., Wang S., Feng H., Zhao Y., et al. (2024). Self-supervised learning with attention mechanism for eeg-based seizure detection. Biomed. Signal Process. Control 87, 105464. doi:10.1016/j.bspc.2023.105464
Xu X., Lin M., Xu T. (2022). Epilepsy seizures prediction based on nonlinear features of eeg signal and gradient boosting decision tree. Int. J. Environ. Res. Public Health 19, 11326. doi:10.3390/ijerph191811326
Zhang M., Zhang B., Wang F., Chen Y., Jiang N. (2010). Multi-scale phase average waveform of electroencephalogram signals in childhood absence epilepsy using wavelet transformation. NEURAL Regen. Res. 5, 774–780. doi:10.3969/j.issn.1673-5374.2010.10.010
Zhao P., Zheng Q., Ding Z., Zhang Y., Wang H., Yang Y. (2022a). A high-dimensional and small-sample submersible fault detection method based on feature selection and data augmentation. Sensors 22, 204. doi:10.3390/s22010204
Zhao X., Peng X., Niu K., Li H., He L., Yang F., et al. (2022b). A multi-head self-attention deep learning approach for detection and recommendation of neuromagnetic high frequency oscillations in epilepsy. Front. Neuroinformatics 16, 771965. doi:10.3389/fninf.2022.771965
Zhao Y., Chu D., He J., Xue M., Jia W., Xu F., et al. (2023a). Interactive local and global feature coupling for eeg-based epileptic seizure detection. Biomed. Signal Process. Control 81, 104441. doi:10.1016/j.bspc.2022.104441
Keywords: childhood seizure detection, graph convolutional network, adjacency matrix, EEG, multi-head attention
Citation: Li Y, Yang Y, Song S, Wang H, Sun M, Liang X, Zhao P, Wang B, Wang N, Sun Q and Han Z (2024) Multi-branch fusion graph neural network based on multi-head attention for childhood seizure detection. Front. Physiol. 15:1439607. doi: 10.3389/fphys.2024.1439607
Received: 28 May 2024; Accepted: 07 October 2024;
Published: 31 October 2024.
Edited by:
Ahsan H. Khandoker, Khalifa University, United Arab EmiratesReviewed by:
Qingyun Wang, Beihang University, ChinaXu Huang, Nanjing University of Science and Technology, China
Omar Farooq, Aligarh Muslim University, India
Copyright © 2024 Li, Yang, Song, Wang, Sun, Liang, Zhao, Wang, Wang, Sun and Han. This is an open-access article distributed under the terms of the Creative Commons Attribution License (CC BY). The use, distribution or reproduction in other forums is permitted, provided the original author(s) and the copyright owner(s) are credited and that the original publication in this journal is cited, in accordance with accepted academic practice. No use, distribution or reproduction is permitted which does not comply with these terms.
*Correspondence: Yang Yang, eXlhbmdAc2R1LmVkdS5jbg==; Shangling Song, NjkwNDk2MDEzQHFxLmNvbQ==
 Yang Li
 Yang Yang1*
 Xiaoyun Liang
 Baiyang Wang
