
94% of researchers rate our articles as excellent or good
Learn more about the work of our research integrity team to safeguard the quality of each article we publish.
Find out more
ORIGINAL RESEARCH article
Front. Physiol., 25 July 2024
Sec. Computational Physiology and Medicine
Volume 15 - 2024 | https://doi.org/10.3389/fphys.2024.1425582
This article is part of the Research TopicArtificial Intelligence for Smart Health: Learning, Simulation, and OptimizationView all 11 articles
 Yujie Wang1
 Cheng-Bang Chen1*
 Toshihiro Imamura2,3
 Ignacio E. Tapia4
 Virend K. Somers5
 Phyllis C. Zee6
 Diane C. Lim7,8
Objective: Recognizing emotions from electroencephalography (EEG) signals is a challenging task due to the complex, nonlinear, and nonstationary characteristics of brain activity. Traditional methods often fail to capture these subtle dynamics, while deep learning approaches lack explainability. In this research, we introduce a novel three-phase methodology integrating manifold embedding, multilevel heterogeneous recurrence analysis (MHRA), and ensemble learning to address these limitations in EEG-based emotion recognition.
Approach: The proposed methodology was evaluated using the SJTU-SEED IV database. We first applied uniform manifold approximation and projection (UMAP) for manifold embedding of the 62-lead EEG signals into a lower-dimensional space. We then developed MHRA to characterize the complex recurrence dynamics of brain activity across multiple transition levels. Finally, we employed tree-based ensemble learning methods to classify four emotions (neutral, sad, fear, happy) based on the extracted MHRA features.
Main results: Our approach achieved high performance, with an accuracy of 0.7885 and an AUC of 0.7552, outperforming existing methods on the same dataset. Additionally, our methodology provided the most consistent recognition performance across different emotions. Sensitivity analysis revealed specific MHRA metrics that were strongly associated with each emotion, offering valuable insights into the underlying neural dynamics.
Significance: This study presents a novel framework for EEG-based emotion recognition that effectively captures the complex nonlinear and nonstationary dynamics of brain activity while maintaining explainability. The proposed methodology offers significant potential for advancing our understanding of emotional processing and developing more reliable emotion recognition systems with broad applications in healthcare and beyond.
The brain, one of the most intricate systems of the body, has been a subject of great interest for researchers aiming to unravel its complexities (Wolpaw and Birbaumer, 2006). The complexity of underlying nature (genetics) and the effect of nurture (life choices and experiences) creates an infinite number of possible stimuli and interactions, resulting in an evolving dynamic system within the brain. Understanding this dynamic system is crucial due to its pivotal role in various domains, including cognition, behavior, sleep, neurological disorders, and emotion (Lindquist et al., 2012; Akhand et al., 2023). To thoroughly explore this dynamic system, advanced technologies like functional magnetic resonance imaging (fMRI) and electroencephalography (EEG) have been employed to measure brain activity and study interactions with the environment (Jellinger, 2003; Haynes and Rees, 2006; Tong and Pratte, 2012). Recently, EEG has become available as a wearable technology, making it an ideal choice for continuous monitoring of neural processes and brain activity.
Emotions are complex psychophysiological processes, yet universally, they are experienced similarly by all people. Thus, the study of emotion recognition has garnered significant attention in various fields, such as neurology, computer science, cognitive science, and psychology (Lindquist et al., 2012; Akhand et al., 2023). Prior research has leveraged the time-domain, (Liu et al., 2021; Chen D. et al., 2023), frequency-domain, (Gao et al., 2019; Houssein et al., 2022; Akhand et al., 2023), or time-frequency domain methods (Yuvaraj et al., 2023) to extract the features within EEG signals to identify emotions. Recent research (Chang et al., 2022; Yang et al., 2022) has focused on leveraging artificial intelligence and neural network models to enhance the accuracy and efficiency of emotion classification based on EEG data (Li J. et al., 2021; Tian et al., 2021). Dan et al. introduced a clustering-promoting semi-supervised method to enhance the performance of emotion recognition (Dan et al., 2021). Wang et al. established a convolutional neural network (CNN) framework for emotion recognition (Wang et al., 2020). These advancements not only contributed to the field of neuroscience but also have practical applications in human-computer interaction and mental health diagnoses (Chai et al., 2018). Thus, EEG has become an important technology for objective emotion recognition (Peng et al., 2023).
Recent developments in EEG-based emotion recognition have focused on improving classification accuracy and robustness through various techniques such as feature fusion, dynamic functional connectivity analysis, and deep learning architectures. Fusing frequency-domain features and brain connectivity features has shown promising results in cross-subject emotion recognition (Chen et al., 2022a). Dynamic functional connectivity analysis has also been employed to capture the time-varying characteristics of brain networks during emotional states (Liu et al., 2019). Novel deep learning architectures, such as deep CNNs (Chen J. et al., 2019), multi-scale masked autoencoders (Pang et al., 2024), transformer- and attention-based CNNs (Li C. et al., 2021; Si et al., 2023) have been proposed to enhance emotion recognition performance. Domain adaptation techniques have also been explored to facilitate the transfer of emotion recognition models across different subjects (Chen et al., 2022b). In addition to emotion recognition, EEG-based approaches have been applied to related fields, such as P300 wave detection, driving fatigue detection, and biometric authentication, where self-attentive channel-connectivity capsule networks (Chen C. et al., 2023; Wang et al., 2023) and attention-based multiscale CNN with dynamical graph convolutional network (GCN) (Wang et al., 2021) have demonstrated improved performance. Systems like E-Key (Xu et al., 2023a) combine biometric authentication with driving fatigue detection. EEG studies have also examined the effects of aging, task difficulty, and training on working memory capacities, highlighting EEG’s diverse applications in cognitive research (Xu et al., 2023b).
Despite the progress made in EEG-based emotion recognition, several challenges remain. First, the nonlinear and nonstationary characteristics of EEG signals pose significant difficulties (Bazgir et al., 2018). Most machine learning based methodologies, such as linear discriminant analysis (Chen DW. et al., 2019), generalized linear regression (Li et al., 2019a), or Fast Fourier Transform (FFT) (Murugappan and Murugappan, 2013), often rely on linear assumptions, which fail to capture the nuanced nonlinear and nonstationary characteristics of EEG. Second, the complexity of multiple EEG electrodes capturing the interaction of brain activity and large volumes of data is another challenge. Deep learning models can address this complexity; however, they suffer from the “black box” problem while requiring substantial computational resources. Third, EEG signals present challenges in both temporal and spatial domains. While many studies focus on the temporal aspects of emotions (Liu et al., 2010; Zheng et al., 2019a), spatial information is equally important when adapting these methodologies in the future to neurological, sleep, or psychological disorders. Lastly, emotions are interconnected over time, with current emotional states being influenced by past emotions and potentially impacting future experiences (Thornton and Tamir, 2017). These transitions, between past, present, and future, have not been well studied using EEG signals.
To tackle these challenges, this paper presents an innovative three-phase methodology that characterizes and quantifies complex dynamic transitions of brain activities in multiple granularities while retaining high resolution to detect emotions from multi-channel EEG. In the first phase, manifold learning techniques are utilized to embed the dimensionality of high-dimensional 62-lead EEG signals into a more manageable lower-dimensional space. This embedding preserves the complex spatiotemporal characteristics of the signals, offering rich insights into brain activity while enhancing computational efficiency. In the second phase, we propose a novel multilevel heterogeneous recurrence analysis to characterize the nuanced, nonlinear, and nonstationary dynamic characteristics of the EEG signals at different granularities within the state-space domain. Our approach results in a quantification of dynamic patterns characterizing underlying brain activity, which cannot be achieved by other methods. The final phase employs ensemble supervised learning models that utilize metrics that quantify dynamic features and patterns within the EEG to classify each emotion. Ensemble learning not only improves overall performance but also provides a robust framework to prevent potential overfitting and account for variability in EEG data. This phase explains the decision-making processes underlying emotion classification. Experimental results show that our proposed methodology achieved accuracy and area under the receiver operating characteristic (ROC) curve (AUC) values of 0.7885 and 0.7552, respectively. These results surpass state-of-the-art studies using the same dataset. Moreover, our methodology provides the most consistent performance across different emotions compared to other models. Lastly, our method provides subtle quantifications and rich insights into the dynamic features of brain activity related to emotions.
In summary, this research introduces a novel recurrence analysis-based methodology for EEG-based emotion recognition that effectively captures the complex nonlinear and nonstationary dynamics of brain activity while maintaining explainability. The rest of this paper is organized as follows: Section 2 is a brief background relevant to our methodology; Section 3 describes the dataset employed to formulate our approach; Section 4 outlines the proposed methodology, structured in three distinct phases; Section 5 details the outcomes of our study; and Section 6 offers an in-depth discussion of the insights gained and conclusions drawn from our investigation.
In this section, we introduce the foundational concepts and background of our novel methodology, multilevel heterogeneous recurrence analysis (MHRA). We begin by discussing the basic principles of recurrence analysis (RA) and its evolution into heterogeneous recurrence analysis (HRA). Then, we review the development and application of HRA to complex transitions, which is further developed and refined into MHRA.
Recurrence, defined as a situation where the state of a system at a certain time is very similar to its state at one or more previous times, is a fundamental feature of complex systems (Hatami et al., 2019). From Poincaré's initial descriptions of recurrence in the 1890s and the subsequent introduction of Recurrence Analysis (RA) by Webber and Zbilut in the 1980s (Khoo et al., 1996), the development of this analytical method has continuously evolved. In the early 2000s, Norbert Marwan and his colleagues made significant contributions to refining and applying RA, thereby enhancing its use across a variety of scientific fields, including geophysics (Eroglu et al., 2014; Lucarini et al., 2016), physiology (Khoo et al., 1996; Webber and Zbilut, 2005), meteorology (Bouabdelli et al., 2020), economics (Mosavi et al., 2020), and engineering (Shu et al., 2021). Consequently, RA has become one of the most widely used tools for analyzing dynamic complex systems. Note that the recurrence can be mathematically defined as
where
Traditional RA, including RP and RN, treats recurrence homogeneously, which presents limitations when characterizing nuanced dynamic features. To improve RA, Yang et al. developed HRA, which addresses the heterogeneity of recurrence and dramatically enhances the analytical capabilities (Yang and Chen, 2014; Chen and Yang, 2015; Chen and Yang, 2016). HRA differentiates recurrences based on the properties of system states, categorizing each state
where
We utilized the Shanghai Jiao Tong University (SJTU) Emotion EEG Dataset for Four Emotions (SEED-IV), a specific subset of the broader SJTU Emotion EEG Dataset (available at https://bcmi.sjtu.edu.cn/∼seed/), to develop our methodology for emotion recognition (Zheng et al., 2019b). The SEED-IV dataset includes both EEG and eye movement signals associated with four distinct emotions, neutral, sadness, fear, and happiness, collected from 15 college-aged participants (seven males and eight females, aged 20–24, all right-handed). Each participant was outfitted with a 62-channel EEG cap (Compumedics Neuroscan, Australia) and eye-tracking glasses (SensoMotoric Instruments, Germany). The data were gathered while participants watched 72 carefully selected film clips, each designed to elicit one of the target emotions. Each clip had a duration of approximately 2 minutes and was shown only once to avoid the effects of repetition. Participants attended three separate sessions on different days, each comprising 24 trials with six trials per emotion. Each trial began with a 5-s introductory hint, followed by a 45-s period for self-assessment, during which participants rated their emotional experience. Data from participants who either did not experience the intended emotion or exhibited weak emotional arousal were excluded from the analysis. The primary objective of this research is to identify these four emotions using dynamic features extracted from multi-channel EEG signals. For the purposes of this study, we focused exclusively on the raw EEG data from 62 channels, capturing the complex brain dynamics associated with each emotional state, while the eye movement data were not utilized in the analysis.
This study aims to identify four emotions by analyzing the complex spatiotemporal dynamics within high-dimensional EEG signals. We developed a novel three-phase methodology, named MHRA methodology, summarized in Figure 1, to accomplish this goal. The methodology comprises the following phases: Phase 1. Manifold Embedding: To preserve the intricate nonlinear spatiotemporal characteristics of raw EEG data while minimizing computational demands, we employed a manifold learning technique. This method projects the high-dimensional EEG data into a lower-dimensional space, thereby simplifying the dataset while retaining its essential features. Phase 2. MHRA: To capture the complex dynamic brain activity reflected in EEG signals, we developed a novel MHRA. This approach systematically portrays the multilevel dynamic characteristics of EEG data using fractal structures and quantifies the geometric features of these fractals to extract dynamic features for emotion recognition. Phase 3, Supervised Ensemble Learning: To differentiate emotions based on the dynamic properties extracted from EEG signals, we utilized various advanced ensemble learning techniques, including Random Forest, XGBoost, and Adaboost. The high accuracy achieved by our proposed model highlights the crucial role these dynamic properties play in effectively recognizing emotions. Further details of each phase are discussed in the remainder of this section.
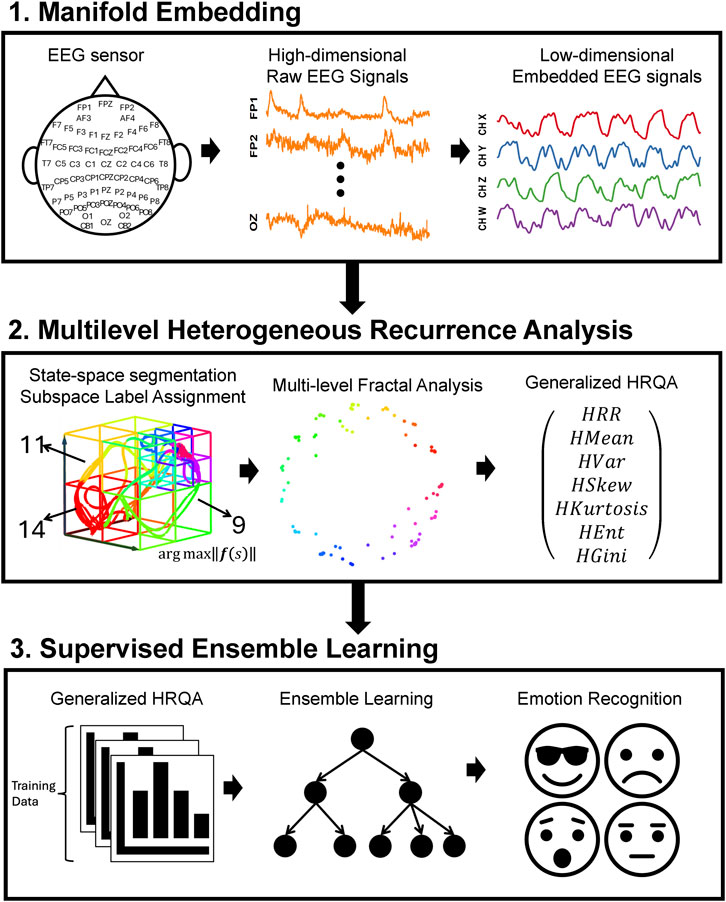
Figure 1. Overview of three-phase methodology, MHRA methodology, applied to EEG for emotion recognition. Phase 1. Manifold Embedding: A manifold learning method is applied to high-dimension EEG data to embed subtle nonlinear spatiotemporal characteristics into lower dimensions, reducing computational demands. Phase 2. MHRA: We developed the MHRA to quantify dynamic transitions using fractal representation at multiple levels. Phase 3. Supervised Ensemble Learning: Advanced ensemble learning methods are leveraged to analyze MHRA metrics for emotion recognition.
Massive data sizes and high dimensionality are two notorious obstacles in the field of data analytics. Effectively retaining data properties while efficiently processing data is crucial. This study analyzes data from 62-lead EEG signals, which presents significant challenges due to their massive data size and high dimensionality. Although these high-dimensional data offer superior spatiotemporal resolution, the inherent complexities of these EEG signals significantly increase the difficulties of data processing and analysis. Particularly in terms of the highly computational demands they impose. Therefore, reducing analytical and computational efforts to a manageable level while retaining the original data’s spatiotemporal characteristics is essential. Traditional dimensionality reduction techniques, such as principal component analysis and singular value decomposition, often fall short with large, complex datasets. They tend to overlook the nonstationary, nonlinear features of the data, leading to extended computation times and ineffective dimension reduction outcomes that do not accurately reflect the original data’s information (Roweis and Saul, 1979; Elgamal and Hefeeda, 2015; Pouyet et al., 2018).
To address these challenges, we have utilized manifold embedding, a technique within manifold learning that is particularly effective at uncovering the low-dimensional manifold structure embedded in high-dimensional spaces. It allows us to map high-dimensional data onto a lower-dimensional space efficiently, retaining the data’s intrinsic and nonlinear properties. This simplification of the dataset preserves essential spatiotemporal information, facilitating further analysis (Turchetti and Falaschetti, 2019). Notably, manifold embedding encompasses various techniques collectively known as Nonlinear Dimensionality Reduction (NLDR). Common methods within NLDR include Uniform Manifold Approximation and Projection (UMAP), which constructs a high-dimensional graph representation of the data and then optimizes a low-dimensional graph to be as structurally similar as possible; Locally Linear Embedding (LLE), which preserves local properties of the data; Spectral Embedding, which uses the eigenvalues of the graph Laplacian to perform dimensionality reduction; Isomap, which preserves geodesic distances between data points; and t-distributed Stochastic Neighbor Embedding (t-SNE), which minimizes the divergence between two distributions: a distribution that measures pairwise similarities of the input objects and a distribution that measures pairwise similarities of the corresponding low-dimensional points in the embedding (Meilă and Zhang, 2024).
To select the most appropriate NLDR method, we consider both the quality of dimensional reduction and computational efficiency. For assessing reduction quality, we utilize cross-entropy to compare the differences between the original and reduced signals. Cross-entropy is expressed as Eq. 3:
where
We evaluated each NLDR technique by analyzing a 10% random sample of SEED-IV data across ten replications. The performance of these manifold embeddings is presented in Figure 2. Panel A displays the average running time, while Panel B shows the average cross-entropy. Note that a lower running time indicates better efficiency, and a lower cross-entropy signifies higher information retention. For our 62-lead EEG data, UMAP not only achieved the lowest cross-entropy but also the best performance in terms of running time (Mcinnes et al., 2020), as indicated by a red asterisk. We used the same criteria, running time and cross-entropy, to determine the optimal number of embedding dimensions, referring to the number of dimensions in the lower-dimensional space. Our findings reveal that as embedding dimensions increase, the running time grows exponentially, while the improvement in cross-entropy diminishes. Figure C demonstrates these trends in UMAP, and it shows that the optimal performance, both in terms of running time and cross-entropy, occurs at four embedding dimensions. Notably, we also fine-tuned hyperparameters for all the manifold learning methods to optimize embedding performance. For our final selected method, UMAP, these hyperparameters included the number of neighbors (set to 5), the minimum distance between points in the low-dimensional space (set to 0.1), and the spread of the data points (set to 1.0). These settings were chosen to balance the retention of the data’s intrinsic structure and computational efficiency. Consequently, UMAP was selected to embed the 62-lead EEG signals into four dimensions, effectively balancing critical spatiotemporal feature retention with computational efficiency.
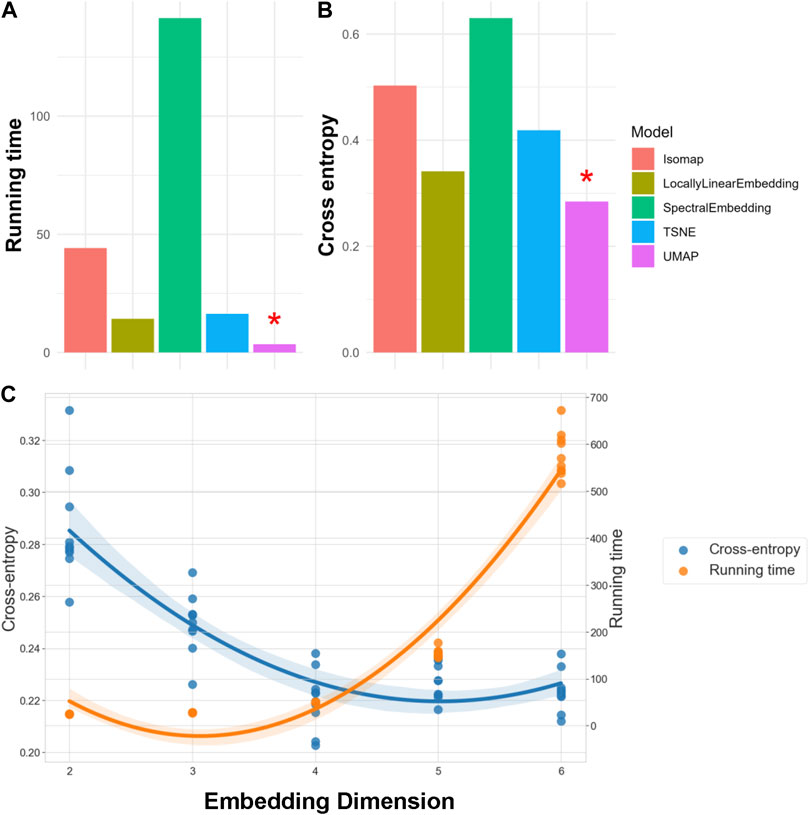
Figure 2. Evaluation of NLDR Methods and selecting the optimal number of Embedding Dimension. Panels (A, B) compare five manifold embedding candidates by running time and cross-entropy, respectively, indicating that UMAP is the best method for our specific dataset. Panel (C) illustrates how running time and cross-entropy were used to identify four as the optimal number of embedding dimensions to preserve critical spatiotemporal features within the dataset.
After embedding the 62-lead EEG signals into a low-dimensional space, we deployed the proposed MHRA to characterize the dynamic spatiotemporal characteristics of brain activity. The MHRA is a state-space domain method comprising three major steps: 1. Heterogeneous state-space representation, 2. Fractal representation, and 3. Generalized HRQA. These steps outline a systematic and comprehensive approach to characterizing complex dynamic systems.
To capture and delineate the recurrence dynamics of a system, we first transform time series data into a trajectory within a state space,
Subsequently, to achieve a higher resolution of the recurrence properties, we constructed a heterogeneous state-space by dividing the original state-space,
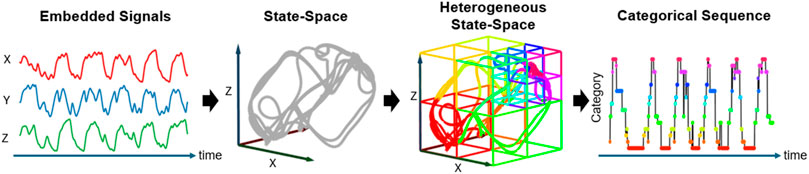
Figure 3. Heterogeneous State-Space Representation. This flowchart illustrates how EEG signals are transformed into a trajectory within the heterogeneous state space, and how these transitions are categorized into a dynamic sequence. The EEG signals are first transformed into a trajectory within the state space, followed by the application of Voronoi tessellation to segment the space into distinct subspaces. Each subspace, represented as a Voronoi cell, is assigned a specific category, illustrating the formation of a categorical sequence that captures the dynamic evolution of brain activity.
Notably, Voronoi tessellation, typically a semi-supervised method, requires specifying the number of subspaces in advance. Selecting an inappropriate number of subspaces can significantly impact the effectiveness of information extraction. Determining the optimal number of subspaces is thus crucial for accurately representing the heterogeneous state-space. This research utilized the Davies-Bouldin Index, a measure of clustering quality, to find the optimal number of subspaces. Initially, as illustrated in Figure 4, we divided the original state-space into 10 subspaces and incrementally evaluated up to 100 subspaces. The black line represents the Davies-Bouldin Index, the smooth blue line indicates a fitted curve of the index values, and the grey shading denotes the confidence interval. A lower Davies-Bouldin Index indicates more effective clustering, with clear separation between subspaces. The index stabilized after 45 subspaces, identifying this number as optimal for our dataset. Accordingly, we segmented the state-space into 45 distinct subspaces to enhance the resolution of dynamic characteristics.
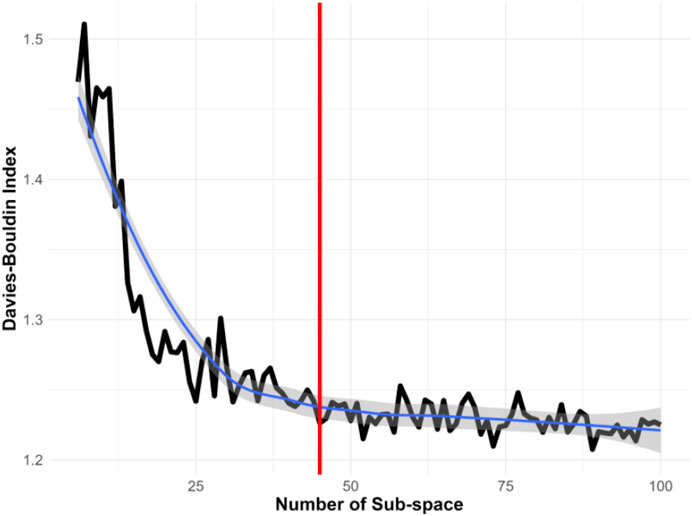
Figure 4. Determining the Optimal Number of Subspaces Using the Davies-Bouldin Index. This index assesses the effectiveness of different subspace configurations, with a lower score indicating better clustering quality. The analysis suggests that 45 subspaces provide the most informative clustering in this study.
To characterize the dynamic characteristics of state transition patterns, this study leverages the fractal topological structure to capture the nuanced features. Fractals are mathematical structures portrayed by self-similarity, meaning each part of the fractal replicates the whole on a smaller scale. This intrinsic property makes fractals particularly suited for modeling heterogeneous recurrences, as their recursive nature can effectively mirror the irregular and complex patterns observed in such phenomena. By employing fractals, one can capture the nuanced nonlinear and nonstationary variations inherent in heterogeneous recurrences, providing a more accurate and comprehensive understanding of their dynamics (Yang and Chen, 2014; Cheng et al., 2016; Kan et al., 2016; Yang et al., 2020).
Therefore, after the embedded EEG signals are converted into a trajectory in the heterogeneous state space, revealing the system’s evolution, the trajectory is then projected into a fractal space using Iterated Function System (IFS). Notably, this IFS projection is a one-to-one mapping where each trajectory forms its own fractal structure that reveals the nuanced recurrence dynamics (as shown in Figure 5). Each transformed point strategically captures its transition order prior to its corresponding point in the state sequence.
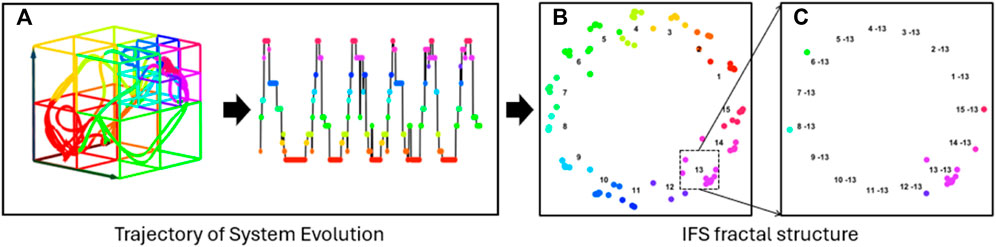
Figure 5. Fractal Structure Construction. Panel (A) displays the trajectory of system evolution as a categorical sequence, and (B) illustrates the projection of this trajectory into a unique fractal structure using an Iterated Function System (IFS). The self-similar nature of the fractal enables the investigation of dynamic patterns across multiple scales. (C) Depicts a second-level fractal derived from (B), revealing dynamic characteristics on a different scale.
The IFS iteratively maps each element of categorical sequence,
where
This IFS is designed to provide a self-similar fractal structure that embeds the information from all previous states, thereby enabling the formation of fractal patterns of spatial transitions at multiple scales. Note that this fractal structure allows us to investigate dynamic characteristics of transitions at multiple levels. For instance, as shown in Figure 5B, the distribution of 15 individual subspaces,
Notably, different trajectory patterns form various fractal structures that reveal diverse dynamic characteristics of the corresponding systems. As demonstrated in Figure 6, trajectories of three different dynamic systems, including random, Lorenz, and Rossler attractors, along with their corresponding fractal structures in the first- and second-level transitions are quite different. It is noteworthy that systems with more randomness typically yield a less informative fractal structure, whereas systems with specific patterns yield a more distinctive fractal structure that is characteristically unique. Thus, analyzing the topological structure of multilevel fractals increases the resolution of dynamic system properties.
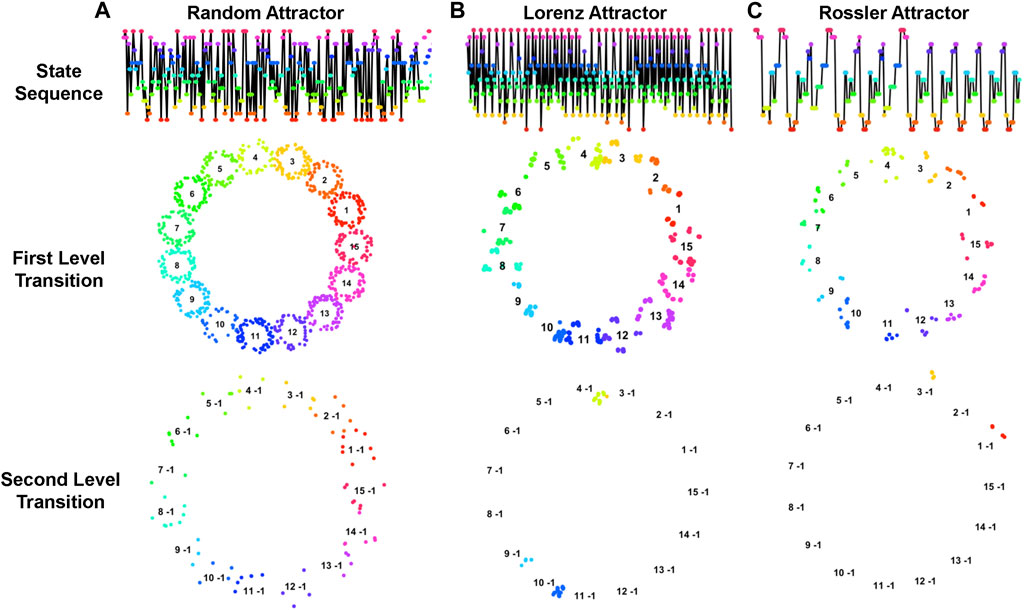
Figure 6. Trajectories of Dynamic Systems with Corresponding Fractal Structures. This figure illustrates the trajectories and fractal patterns of three dynamic systems: (A) random attractor, (B) Lorenz attractor, and (C) Rossler attractor. The top layer figures indicate the trajectories of the systems, the second- and third-layer figures illustrate the corresponding fractal structures of first- and second-level transitions. The topological structures of fractals characterize the dynamic properties of the systems.
However, fractal representation is sensitive to the categorical labels, which are presented as a sequence of consecutive positive integers from 1 to
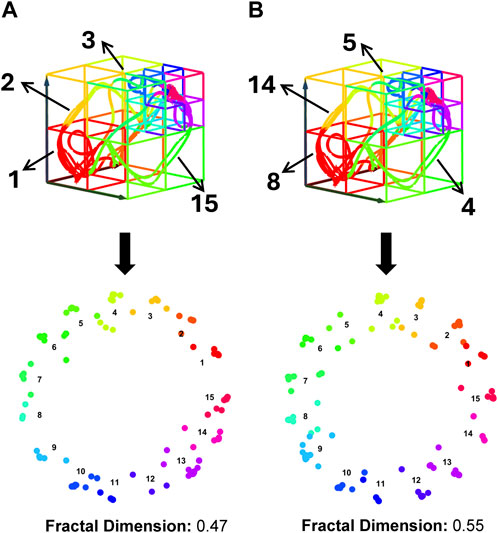
Figure 7. Impact of Subspace Label Assignment on Dynamic Feature Characterization. Both panels (A, B) display identical trajectories within the same heterogeneous state-space structure, yet they have different subspace label assignments. These differences lead to the distinct fractal structures shown in the lower layers of each panel, with varying fractal dimension values. Fractal dimension is used here to quantify the complexity of fractal structures, where higher values indicate increased complexity and greater detail retention across scales.
However, determining the optimal subspace label assignment is a challenging task. For example, to evaluate all possible 45 subspace assignments would be
Algorithm 1.Genetic Algorithm for Optimizing Label Arrangements.
INPUT:
1 BEGIN:
2 //Initialize GA parameters
3
4 //Generate initial population
5
6 //Genetic algorithm main loop
7 FOR
8 //Evaluate fractal dimension of each instance in the sample pool
9 FOR EACH
10
11 END FOR
12 //Select top individuals for reproduction
13
14 //Update sampling pool through reproduction and mutation
15
16 //Optional: Convergence check to break loop early
17 IF
18 BREAK
19 END IF
20 END FOR
21 //Determine the best solution
22
23 RETURN
*Fitness function returns the fractal dimension of the fractal structure generated by the input instance.
In this study, we modified the GA as follows:
• Initial Population: Started with 50,000 random subspace label assignments, each offering a unique labeling approach within the EEG state-space.
• Evaluation: Each assignment is assessed for fractal complexity to gauge effectiveness in describing the underlying trajectory structure.
• Selection and Generation: Post-evaluation, another 50,000 assignments are generated using genetic crossover and mutation techniques to explore new solutions.
• Optimization: Assignments with the highest fractal complexity, indicative of effective system dynamics capture, are selected.
• Iteration: This cycle of generation, evaluation, and optimization continues until a fractal complexity threshold is reached or no further improvements are observed.
Note that fractal complexity in this study is measured using the Minkowski fractal dimension, which involves covering the fractal with boxes of a specific size and counting the number needed to completely cover the fractal. This process is repeated with progressively smaller boxes (Hunt et al., 1939). The Minkowski fractal dimension for a fractal
where
The fractal representation clusters the system’s trajectory at multiple scales with fractal structures, which demonstrate the heterogeneous recurrence dynamics of a system on the two-dimensional coordinates. To effectively capture this heterogeneity in system recurrences, a new measurement approach has been developed that employs the fractal structure for quantifying these heterogeneous recurrences (Yang and Chen, 2014; Chen and Yang, 2015; Chen and Yang, 2016). Rather than treating all recurrences uniformly, this method, known as HRQA, specifically characterizes recurrent patterns based on the diverse states or transitions that are mapped onto the fractal structure, thereby enhancing the analytical capabilities of recurrence quantifiers. Chen and Yang derived a series of HRQA methodologies based on this fractal representation (Yang et al., 2020). However, traditional HRQA methods encounter scalability issues when attempting to quantify transitions at different levels. In response to this challenge, this research introduces a generalized HRQA system that addresses scalability issues to assess system recurrences. This advanced system allows for a more nuanced analysis of the dynamics inherent within different level transitions.
To quantify the fractal representation, the first step is to identify the sets of states falling into different level transitions in the fractal representation. Since the IFS assigns unique addresses in the circles to clusters of state sets, we define these heterogeneous recurrence sets
Here, the subscript
HRR quantifies the proportion of a specific
To scale the HRQA for different
Note that the calculation of
We deployed the proposed generalized HRQA to quantify the fractal representations derived from the embedded EEG. In this research, we addressed different resolutions of dynamic to the second-level transitions. A total
The final phase of our methodology is to develop a supervised machine learning model that classifies the outcome using HRQA metrics as the input. We chose ensemble learning for its ability to handle complex, nonlinear patterns and relationships within the data while achieving high accuracy in classifying the outcome. We evaluated three decision-tree-based ensemble machine learning algorithms, the adaptive boosting method (Adaboost), random forest classification (Random Forest), and extreme gradient boosting (XGBoost), for accurately identifying the four emotions.
Decision-tree-based ensemble machine learning methods effectively handle complex nonlinear relationships by integrating multiple decision trees. These methods continuously refine the model by adding new trees specifically designed to correct errors identified in existing trees. The methods evaluated in our methodology differ primarily in their training approaches: XGboost and Adaboost use boosting to focus on correcting mispredictions by adjusting data weights, while Random Forest employs bagging, sampling equally across data points. These ensemble strategies surpass single tree models by leveraging a majority vote from various trees, thus expanding the solution space and reducing overfitting through averaged outcomes.
Although tree-based models are effective at capturing complex relationships in data, their efficiency and performance can be significantly influenced by the number of predictors. These models are particularly sensitive to the inclusion of irrelevant or noisy predictors, which can increase model complexity and lead to a higher risk of overfitting, where the model learns the noise in the training data rather than the underlying patterns (Hu and Li, 2022). To overcome this issue, we employed the Least Absolute Shrinkage and Selection Operator (LASSO) for variable selection to reduce the number of HRQA metrics used in developing our emotion recognition models.
LASSO is particularly effective for models burdened by high-dimensional data, as it helps in reducing the risk of overfitting by imposing a constraint on the sum of the absolute values of the model parameters. This regularization process not only shrinks less important feature coefficients to zero but also simplifies the model by retaining only those variables that significantly contribute to the predictive power (Roth, 2004).
We executed the LASSO algorithm 30 times and selected metrics that consistently had non-zero coefficients across these runs. Table 1 illustrates the final number of HRQA metrics selected for each emotion. Our results indicate that the emotions ‘Neutral’ and ‘Sad’ are associated with a broader range of dynamic characteristics of brain activity, while ‘Fear’ and ‘Happy’ are linked to relatively fewer features.
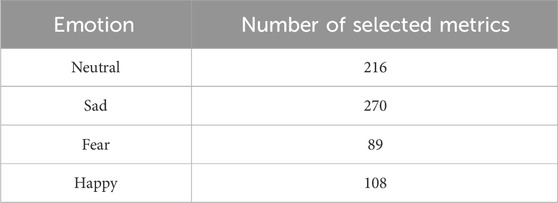
Table 1. Number of LASSO selected HRQA metrics for each emotion.
To identify the four emotions based on their dynamic characteristics extracted from LASSO selected HRQA metrics, we tailored a classification model for each specific emotion. We evaluated three supervised ensemble learning methods, AdaBoost, XGBoost, and Random Forest, for emotion recognition. For each method we used the One-vs-All (OvA) strategy, where each emotion was classified independently as the positive class against all others grouped as the negative class. To ensure the robustness and reliability of our models, we adopted a rigorous testing protocol. The data was randomly split into a training dataset (90% of the total dataset) and a testing dataset (remaining 10% of the total dataset) to prevent any potential bias in model training. Then the training dataset was used to develop three different models (AdaBoost, XGBoost, and Random Forest) for each emotion (neutral, sad, fear, happy); this process was repeated 30 times with each model to ensure stability and consistency in the results. After training the model, the testing dataset was used to validate the performance of each model. Performance was quantitatively assessed by comparing the predicted labels against the actual labels from the testing set, calculating both the average and the standard deviation. In addition, we conducted sensitivity analyses on the emotion recognition models to investigate which dynamic characteristics are strongly associated with specific emotions. This analysis helped identify key features that significantly influence the models’ ability to accurately classify different emotional states.
We assessed the effectiveness of ensemble learning models for emotion recognition using two performance metrics: accuracy and AUC. Accuracy is defined as
To achieve optimal performance, we applied grid search combined with 10-fold cross-validation to fine-tune the hyperparameter settings for the supervised ensemble learning methods, including Adaboost, Random Forest, and XGBoost. The hyperparameters yielding the highest F1 score (calculated as 2⋅TP/(2⋅TP + FP + FN)) on the validation dataset were selected. This comprehensive tuning process involved exhaustively searching through a predefined set of hyperparameters to find the optimal combination, ensuring that each model was finely adjusted to achieve the best possible performance. For Adaboost, we created an ensemble of 500 weak learners without resampling with replacement and used the Breiman method for adjusting weights. For Random Forest, we built 800 trees, each considering 30 features at each split, and used a 0.5 threshold for classification. For XGBoost, we trained 500 deep trees to solve a binary classification problem using logistic regression.
We developed a comprehensive methodology consisting of three phases to identify four emotions by analyzing the corresponding complex dynamic characteristics in EEG. In this section, we discussed the performance of the proposed methodology in three perspectives. We initially compared the performance of three ensemble learning models: AdaBoost, Random Forest, and XGBoost. Then, we discussed the performance of each individual emotion identification model under XGBoost. Finally, an overall performance comparison with other models using the same dataset was conducted.
To evaluate which ensemble learning model had the best performance for emotion recognition, accuracy and AUC was calculated for each specific emotion then averaged for each model. Table 2 demonstrates that XGBoost and Random Forest consistently achieved high accuracy and AUC, signifying excellent stability across multiple trials, whereas AdaBoost did not. Since both Random Forest and XGBoost achieved at least 0.75 in both accuracy and AUC, this suggests that dynamic transition properties of brain activity extracted from high-dimensional EEG signals using the MHRA methodology, can effectively recognize emotions. Given that accuracy was our primary performance criterion, XGBoost with an average accuracy of 0.7885 and an AUC of 0.7552 was selected as the best model for emotion recognition.
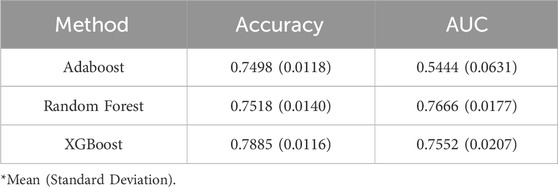
Table 2. Performance of each ensemble model of all four emotions.
Figure 8 demonstrates the AUC curves for the XGBoost model’s performance in recognizing four distinct emotions. The curves reflect the varying levels of the model’s discriminatory ability for each emotion. The AUC for ‘Sad’ shows the highest value at 0.7931, indicating that the model is most effective at distinguishing ‘Sad’ from non-sad emotional states. ‘Neutral’ also demonstrates a robust performance with an AUC of 0.7814. However, the AUCs for ‘Fear’ and ‘Happy’ are lower, at 0.7165 and 0.7299 respectively, suggesting challenges in the model’s ability to consistently differentiate these emotions from others. The lower AUC for ‘Fear’ indicates a particular difficulty in discrimination, which could be due to the nuanced nature of fear as an emotion. Conversely, despite ‘Happy’ having the highest accuracy, its AUC indicates less consistency in distinguishing happiness, likely due to overlapping features with other emotions.
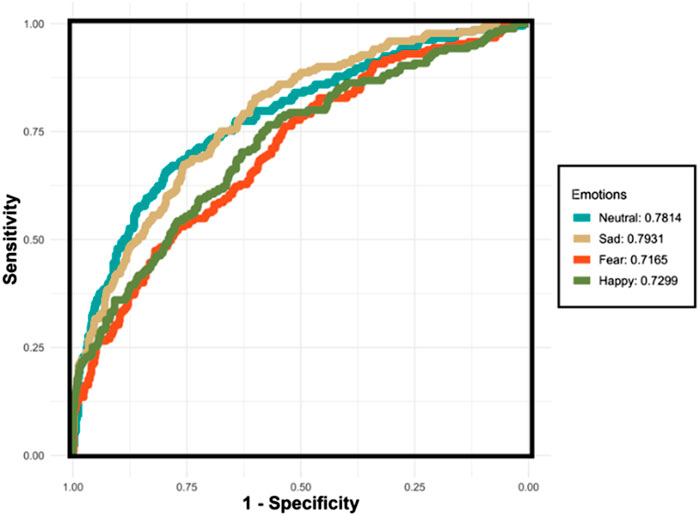
Figure 8. The ROC curves for the XGBoost classifier applied to the testing set using the One-vs-All (OvA) strategy for four separate emotions. The emotions “Neutral” and “Sad” exhibit relatively higher AUC values, indicating more reliable performance in distinguishing these emotions. Conversely, “Fear” and “Happy” demonstrate lower AUC values, reflecting the model’s reduced consistency in differentiating these emotions from others.
In this section, we demonstrated the performance of XGBoost into each emotion model, as shown in Table 3. The results indicate that all the emotion models can achieve at least 0.77 for accuracy and at least 0.71 for the AUC. The model excels in recognizing ‘Happy’ emotions, achieving the highest accuracy of 0.8127. The accuracies and AUCs for ‘Neutral’ and ‘Sad’ are relatively higher and more consistent, suggesting more reliable performance for these emotions. Conversely, the AUCs for ‘Fear’ and ‘Happy’ are lower and show greater variability, reflecting differences in the model’s ability to consistently distinguish these emotions from others. The small standard deviations associated with these metrics across all emotions underscore the model’s stability and reliability in performance across multiple iterations or subsets of the dataset.
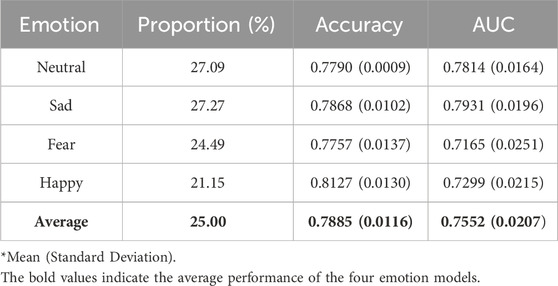
Table 3. Performance of XGBoost method for each emotion.
To evaluate the performance of our methodology relative to other methodologies, Table 4 compares our performance to other methodologies using the same dataset: EmotionMeter, (Zheng et al., 2019b), BiHDM, (Li et al., 2019b), RGNN, (Zhong et al., 2019), Fractal-SNN, (Li et al., 2024), Saliency-based CNN, (Delvigne et al., 2022), MetaEmotionNet, (Ning et al., 2024), ST-SCGNN, (Pan et al., 2024), and MISNet (Gong et al., 2024). Our methodology not only outperformed all of these models in overall accuracy (0.7885) but also demonstrated the most stable performance among the repeated experiments, as indicated by the lowest standard deviation (0.0207).
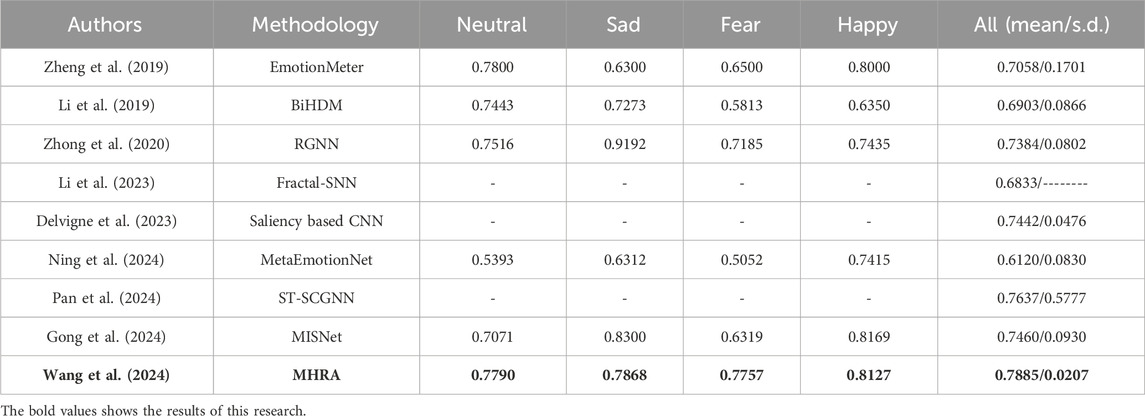
Table 4. Accuracy of MHRA in emotion recognition (individual and overall) vs. other methods.
Notably, our methodology provided the most consistent recognition performance across different emotions, with average accuracies ranging from 0.7757 to 0.8127. This consistency highlights the robustness and effectiveness of our approach in capturing the subtle dynamics of brain activity. In contrast, other methods showed varying strengths across specific emotions. For example, EmotionMeter is more effective in identifying ‘Happy’ and ‘Neutral’, BiHDM is more accurate in recognizing ‘Neutral’ and ‘Sad’, RGNN and MetaEmotionNet are specifically sensitive to ‘Sad’ and ‘Happy’, respectively, and MISNet performs better in ‘Sad’ and ‘Happy’. This implies that previous models struggle to grasp the nuanced activities in the brain, likely due to their inability to fully capture the complex characteristics of EEG signals. Collectively, this indicates that complex brain activity can be effectively characterized using dynamic recurrence properties with our novel MHRA methodology.
These results highlight the robustness and effectiveness of our approach in handling the complex, nonlinear, and nonstationary characteristics of EEG signals. Our methodology’s ability to maintain high accuracy across all emotions and its stable performance in repeated experiments underscore its reliability and potential for real-world applications. By comparing our findings with the relevant literature, it is evident that MHRA not only advances the state of the art in emotion recognition but also provides a versatile method for analyzing complex brain dynamics. This comprehensive analysis reinforces the value of our contributions to the field and demonstrates the superiority of our approach over existing methods.
In addition to achieving the highest accuracy in emotion recognition, our methodology offers profound insights into the specific dynamic features that drive emotional responses, thereby enhancing our understanding of complex brain activity. We demonstrate that variations in the distribution of MHRA metrics are key indicators for emotion recognition, providing robust evidence of our model’s superiority over traditional ‘black box’ methods. For example, Figure 9 presents a sensitivity analysis of how specific HRQA metrics vary in value across each emotion. Specifically, each panel is one unique HRQA that corresponds to a dynamic property that characterizes a specific transition between different subspaces within the constructed heterogeneous state-space.
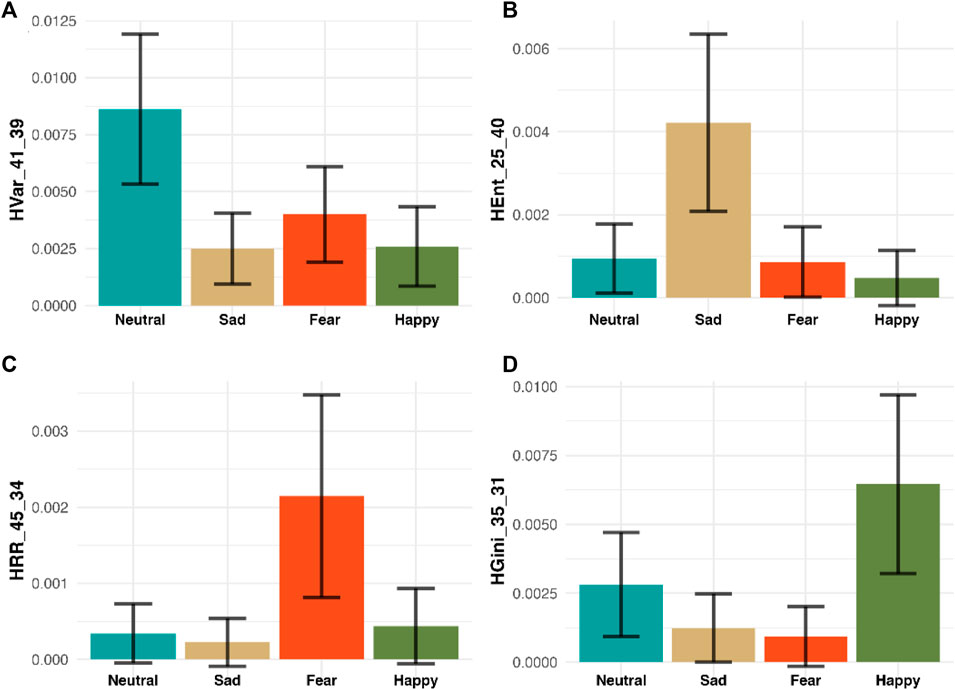
Figure 9. Sensitivity Analysis of Four selected HRQA Metrics. The four panels (A–D) display four selected HRA metrics for four emotions, respectively. Specifically, Panel A shows HVar_41_39 has the highest value in “Neutral,” Panel B demonstrates HEnt_25_40 has the highest value in “Sad,” Panel C illustrates HRR_45_34 has the highest value in “Fear,” and Panel D presents HGini_35_31 has the highest value in “Happy.” Each panel highlights a metric where one emotion scores significantly higher on average than the others, demonstrating the metric’s potential to distinctly identify that emotion from the rest.
Panel A displays the HVar in the transition from subspace #21 to subspace #39. Here, the ‘Neutral’ emotion exhibits the highest average, suggesting significant variability during these transitions. Panel illustrates the HEnt during transitions from subspace #25 to subspace #40, with ‘Sad’ recording the highest average, indicating pronounced entropy in these transitions. Panel C depicts the HRR between subspaces #45 and #34. Here, ‘Fear’ stands out with the highest average, reflecting a notable recurrence rate. Finally, Panel D tracks inequality HGini in the transitions from subspace #35 to subspace #31, where ‘Happy’ demonstrates the highest average, highlighting significant inequality in these transitions. Each bar chart is accompanied by a 95% confidence interval, providing a clear visual representation of how distinct MHRA metrics correlate with each emotional state.
These findings not only confirm the efficacy of our model in identifying and interpreting emotions but also provide a methodology for investigating the subtle spatiotemporal dynamics underlying brain activity related to various emotions. By analyzing these HRQA metrics, we may infer the neural mechanisms involved in emotion recognition. For instance, the high value of entropy (HEnt), referring to a high level of uncertainty, in ‘Sad’ could signify chaotic neural activity patterns associated with emotional distress or cognitive load. The high value of recurrence rate (HRR), referring to a high tendency to revisit similar patterns, in ‘Fear’ suggests a specific pattern of repetitive neural activations, possibly related to the brain’s heightened state of alertness and threat detection.
By correlating these dynamic features with known neural processes, our approach offers deeper insights into how different emotional states manifest in the brain’s activity. This enhanced understanding can contribute to developing more effective interventions and therapeutic strategies for emotional and mental health disorders. Thus, our methodology not only advances the field of emotion recognition but also provides a valuable tool for exploring the neural underpinnings of emotions.
Understanding how emotions are processed and represented in the brain enhances our basic scientific knowledge of neurological functions. By studying EEG patterns associated with different emotions, researchers can uncover the underlying neural mechanisms that govern emotional responses and how these might differ among individuals or across different contexts. However, the complex, nonlinear, and nonstationary characteristics of EEG signals pose significant challenges for many traditional methods in this field. Numerous studies on EEG-based emotion recognition rely on deep learning techniques, as these state-of-the-art neural network-based methods are adept at detecting subtle patterns within complex EEG signals (Jafari et al., 2023). Nonetheless, the lack of transparency in deep learning algorithms represents a substantial barrier, as physicians tend to be cautious by nature, and patients are hesitant to entrust their health to a ‘black box’ algorithm. In this study, we introduced a three-phase methodology, including manifold embedding, MHRA, and supervised ensemble learning, designed to address these concerns by characterizing the dynamic features of brain activity for emotion recognition while also preserving a degree of explainability.
We employed the proposed MHRA methodology to the SJTU-SEED IV database, in Phase 1, we utilized UMAP for data embedding to address the challenge of high dimensional data. The 62-lead EEG signals were transformed into four-dimensional embedded signals that retain dynamic spatiotemporal characteristics but significantly reduced computational demands to a manageable level for further analyses. In Phase 2, the embedded EEG data underwent our novel MHRA to capture the recurrence dynamics of brain activity at high resolution. This approach not only provides a more nuanced understanding of the complex nonlinear and nonstationary EEG patterns, but also extracts robust dynamic features for emotion recognition. Importantly, our generalized HRQA metrics systematically quantify recurrences across different transition levels, offering a scalable framework for analyzing dynamic EEG properties. Finally, in Phase 3 we employed advanced ensemble learning methods and demonstrated their effectiveness in classifying emotions using LASSO selected HRQA metrics. The superior performance of our models, especially XGBoost, suggests that dynamic transition characteristics are powerful predictors for emotion recognition. Our models achieved accuracy and AUC values of 0.7885 and 0.7552, respectively, both outperforming previous studies using the same dataset. Additionally, our sensitivity analysis identified specific HRQA metrics strongly associated with each emotion, providing valuable insights into the neural dynamics underlying emotional processing that cannot be obtained using “black box” algorithms alone.
The major contribution of this research is the development of MHRA, a novel technique leveraging the recurrence theorem to characterize dynamic brain activity across multiple granularities. Unlike traditional methods, MHRA captures the complex, nonlinear, and nonstationary properties of EEG signals, providing a detailed framework for analyzing intricate brain activity patterns. By utilizing HRQA metrics, MHRA offers an interpretable analysis of EEG data, aiding researchers in understanding the neural mechanisms of emotions. This transparency is crucial for building trust and facilitating the adoption of our methodology in clinical and research settings. The insights from our MHRA approach have significant implications for advancing studies in cognitive neuroscience, affective computing, neurofeedback therapy, human-computer interaction, and educational neuroscience. Traditional approaches often struggle with the nonlinear and nonstationary nature of EEG signals, while deep learning models lack explainability. Our methodology overcomes these challenges, offering both high performance and interpretability, thus advancing the field of emotion recognition and providing an effective solution for analyzing complex brain dynamics. Our methodology offers several key advantages. First, it effectively addresses the limitations of traditional linear methods by analyzing complex nonlinear nonstationary EEG signals. Second, MHRA offers interpretability by using HRQA metrics to explain features of complex systems. This transparency is crucial for building trust and facilitating adoption in clinical settings. Third, the tree-based ensemble learning methods not only achieve high accuracy to recognize emotions but also exhibit robustness in capturing nonlinear relationships of dynamic properties.
Despite these strengths, our study has some limitations that will be explored in future research. The SJTU-SEED IV database, while comprehensive, does not fully capture the diversity or unique emotional experiences across different populations. Investigating the generalizability of our methodology to other EEG datasets and real-world scenarios is an important next step. Additionally, integrating our approach with other modalities, such as facial expressions or other physiological signals such as eye movements, could further enhance the accuracy and robustness of emotion recognition. Furthermore, our research can facilitate a deeper understanding and characterization of brain activities, with potential applications in pediatric sleep studies, the development of objective metrics for PTSD, and non-invasive early detection of neurodegenerative diseases. Future research could benefit from incorporating more advanced techniques to retain the spatiotemporal characteristics of 62-lead EEG signals, such as integrating attention mechanisms with MHRA to provide more effective characterization of neural dynamics. By pursuing these directions, we aim to refine the existing methodology and broaden its applicability, thus advancing the field of emotion recognition and its practical applications in neuroscience and healthcare.
In conclusion, this study presents a novel three-phase methodology that includes manifold embedding, MHRA, and ensemble learning for EEG-based emotion recognition. Our approach not only achieves high performance but also offers interpretable insights into the dynamic properties underlying four emotions. This methodology has significant impact on the field to advance our ability to analyze nonlinear nonstationary, dynamic data of complex systems with potential applications in healthcare, human-computer interaction, and beyond.
The data analyzed in this study was obtained from the Shanghai Jiao Tong University (SJTU) Emotion EEG Dataset for Four Emotions (SEED-IV), which is a specific subset of the broader SJTU Emotion EEG Dataset (available at https://bcmi.sjtu.edu.cn/∼seed/). The following licenses/restrictions apply: the dataset is restricted to academic research use only and cannot be used for any commercial purposes. Distribution of the dataset or portions thereof is prohibited, except for small portions used to clarify academic publications or presentations. Access to the dataset is granted only after filling out, signing, and uploading the license agreement to the SEED website, followed by a review of the application. No warranty is provided with the dataset, and users must cite the relevant publications when using the dataset in their research. Requests to access these datasets should be directed to SEED Dataset (https://bcmi.sjtu.edu.cn/home/seed/index.html).
Ethical approval was not required for the studies involving humans because this research uses data from Shanghai Jiao Tong University. Data is publicly available. The studies were conducted in accordance with the local legislation and institutional requirements. The participants provided their written informed consent to participate in this study.
YW: Conceptualization, Data curation, Formal Analysis, Investigation, Methodology, Software, Validation, Visualization, Writing–original draft, Writing–review and editing. C-BC: Conceptualization, Data curation, Formal Analysis, Funding acquisition, Investigation, Methodology, Project administration, Resources, Software, Supervision, Validation, Visualization, Writing–original draft, Writing–review and editing. TI: Conceptualization, Investigation, Visualization, Writing–review and editing. IT: Conceptualization, Investigation, Visualization, Writing–review and editing. VS: Conceptualization, Investigation, Visualization, Writing–review and editing. PZ: Conceptualization, Visualization, Writing–review and editing. DL: Conceptualization, Formal Analysis, Investigation, Methodology, Project administration, Resources, Supervision, Validation, Visualization, Writing–review and editing.
The author(s) declare that financial support was received for the research, authorship, and/or publication of this article. We acknowledge funding by University of Miami Start-up funding PG013380 (to C-BC), the National Institutes of Health (NIH)R33HL162839, R33HL151253, R01HL151254 (to IT); (NIH)R01HL160619 (to VS); (NIH)R01HL140580, (NIH)P01AG011412, (NIH)R01HD097786, and (NIH)R01AG068579 (to PZ); (NIH)1R01HL142981-01A1 and VA BLRD 1I01BX004872-01 (to DL).
The authors declare that the research was conducted in the absence of any commercial or financial relationships that could be construed as a potential conflict of interest.
All claims expressed in this article are solely those of the authors and do not necessarily represent those of their affiliated organizations, or those of the publisher, the editors and the reviewers. Any product that may be evaluated in this article, or claim that may be made by its manufacturer, is not guaranteed or endorsed by the publisher.
Akhand M. A. H., Maria M. A., Kamal M. A. S., Murase K. (2023). Improved EEG-based emotion recognition through information enhancement in connectivity feature map. Sci. Rep. 13 (13), 13804–13817. doi:10.1038/s41598-023-40786-2
Amiri A., Samet H., Ghanbari T. (2022). Recurrence plots based method for detecting series arc faults in photovoltaic systems. IEEE Trans. Industrial Electron. 69, 6308–6315. doi:10.1109/tie.2021.3095819
Asghar Q., Jalil A., Zaman M. (2020). Self-organization analysed in architecture using Voronoi tessellation and particle systems. Tech. J. 25, 1–10.
Avdan G., Chen C., Onal S. (2024). An alternative EMG normalization method: heterogeneous recurrence quantification analysis of isometric maximum voluntary contraction movements. Biomed. Signal Process Control 93, 106219. doi:10.1016/j.bspc.2024.106219
Avdan G., Chen C. B., Onal S. (2023). “Investigation of an alternative EMG normalization technique: recurrence quantification analysis of maximum voluntary contractions,” in IISE annual conference and expo 2023 (IISE). doi:10.21872/2023IISE_1909
Bazgir O., Mohammadi Z., Habibi S. A. H. (2018). “Emotion recognition with machine learning using EEG signals,” in 2018 25th Iranian conference on biomedical engineering and 2018 3rd international Iranian conference on biomedical engineering (ICBME), 1–5. IEEE.
Bouabdelli S., Meddi M., Zeroual A., Alkama R. (2020). Hydrological drought risk recurrence under climate change in the karst area of Northwestern Algeria. J. Water Clim. Change 11, 164–188. doi:10.2166/wcc.2020.207
Chai X., Wang Q., Zhao Y.-P., Liu X., Liu D., Bai O. (2018). Multi-subject subspace alignment for non-stationary EEG-based emotion recognition. Technol. Health Care 26, 327–335. doi:10.3233/thc-174739
Chang H., Zong Y., Zheng W., Tang C., Zhu J., Li X. (2022). Depression assessment method: an EEG emotion recognition framework based on spatiotemporal neural network. Front. Psychiatry 12, 837149. doi:10.3389/fpsyt.2021.837149
Chen C., Ji Z., Sun Y., Bezerianos A., Thakor N., Wang H. (2023b). self-attentive channelchannel-connectivity capsule network for EEG-based driving fatigue detection. IEEE Trans. Neural Syst. Rehabilitation Eng. 31, 3152–3162. doi:10.1109/TNSRE.2023.3299156
Chen C., Li Z., Wan F., Xu L., Bezerianos A., Wang H. (2022a). Fusing frequency-domain features and brain connectivity features for cross-subject emotion recognition. IEEE Trans. Instrum. Meas. 71, 1–15. doi:10.1109/TIM.2022.3168927
Chen C., Vong C. M., Wang S., Wang H., Pang M. (2022b). Easy Domain Adaptation for cross-subject multi-view emotion recognition. Knowl. Based Syst. 239, 107982. doi:10.1016/j.knosys.2021.107982
Chen C.-B. (2019). Recurrence analysis of high-dimensional complex systems with applications in healthcare and manufacturing.
Chen C. B., Wang Y., Fu X., Yang H. (2023c). Recurrence network analysis of histopathological images for the detection of invasive ductal carcinoma in breast cancer. IEEE/ACM Trans. Comput. Biol. Bioinform 20, 3234–3244. doi:10.1109/TCBB.2023.3282798
Chen C. B., Yang H., Kumara S. (2018). Recurrence network modeling and analysis of spatial data. Chaos 28, 085714. doi:10.1063/1.5024917
Chen C.-B., Yang H., Kumara S. (2019d). A novel pattern-frequency tree for multisensor signal fusion and transition analysis of nonlinear dynamics. IEEE Sens. Lett. 3, 1–4. doi:10.1109/lsens.2018.2884241
Chen C.-B., Yang H., Kumara S. (2017). “A novel pattern-frequency tree approach for transition analysis and anomaly detection in nonlinear and nonstationary systems,” in IIE annual conference. Proceedings, 1264–1269.
Chen D., Huang H., Bao X., Pan J., Li Y. (2023a). An EEG-based attention recognition method: fusion of time domain, frequency domain, and non-linear dynamics features. Front. Neurosci. 17, 1194554. doi:10.3389/fnins.2023.1194554
Chen D. W., Miao R., Yang W. Q., Liang Y., Chen H. H., Huang L., et al. (2019b). A feature extraction method based on differential entropy and linear discriminant analysis for emotion recognition. Sensors 19, 1631. doi:10.3390/s19071631
Chen J., zhang peize, Mao Z., Huang Y., Jiang D., Zhang Y. N. (2019a). Accurate EEG-based emotion recognition on combined features using deep convolutional neural networks. Ieee Access 7, 44317–44328. doi:10.1109/access.2019.2908285
Chen R., Imani F., Yang H. (2020). Heterogeneous recurrence analysis of disease-altered spatiotemporal patterns in multi-channel cardiac signals. IEEE J. Biomed. Health Inf. 24, 1619–1631. doi:10.1109/JBHI.2019.2952285
Chen R., Rao P., Lu Y., Reutzel E., Yang H. (2019c). Recurrence network analysis of design-quality interactions in additive manufacturing. Sci. Total Environ., 135907. doi:10.1016/j.addma.2021.101861
Chen Y., Yang H. (2015). “Heterogeneous recurrence T-squared charts for monitoring and control of nonlinear dynamic processes,” in 2015 IEEE international conference on automation science and engineering (CASE), 1066–1071.
Chen Y., Yang H. (2016). Heterogeneous recurrence representation and quantification of dynamic transitions in continuous nonlinear processes. Eur. Phys. J. B 89, 155. doi:10.1140/epjb/e2016-60850-y
Cheng C., Kan C., Yang H. (2016). Heterogeneous recurrence analysis of heartbeat dynamics for the identification of sleep apnea events. Comput. Biol. Med. 75, 10–18. doi:10.1016/j.compbiomed.2016.05.006
Dan Y., Tao J., Fu J., Zhou D. (2021). Possibilistic clustering-promoting semi-supervised learning for EEG-based emotion recognition. Front. Neurosci. 15, 690044. doi:10.3389/fnins.2021.690044
Delvigne V., Facchini A., Wannous H., Dutoit T., Ris L., Vandeborre J.-P. (2022). A saliency based feature fusion model for EEG emotion estimation, 3170–3174.
Donner R. V., Small M., Donges J. F., Marwan N., Zou Y., Xiang R., et al. (2011). Recurrence-based time series analysis by means of complex network methods. Int. J. Bifurcation Chaos 21, 1019–1046. doi:10.1142/s0218127411029021
Donner R. V., Zou Y., Donges J. F., Marwan N., Kurths J. (2010). Recurrence networks-a novel paradigm for nonlinear time series analysis. New J. Phys. 12, 033025. doi:10.1088/1367-2630/12/3/033025
Eckmann J.-P., Oliffson Kamphorst S., Ruelle D. (1987). Recurrence plots of dynamical systems. Europhys. Lett. (EPL) 4, 973–977. doi:10.1209/0295-5075/4/9/004
Elgamal T., Hefeeda M. (2015). Analysis of PCA algorithms in distributed environments. Available at: https://arxiv.org/abs/1503.05214v2 (Accessed April 23, 2024).
Eroglu D., Marwan N., Prasad S., Kurths J. (2014). Finding recurrence networks’ threshold adaptively for a specific time series. Nonlinear Process Geophys 21, 1085–1092. doi:10.5194/npg-21-1085-2014
Gao Z., Cui X., Wan W., Gu Z. (2019). Recognition of emotional states using multiscale information analysis of high frequency EEG oscillations. Entropy 21, 609. doi:10.3390/E21060609
Gong M., Zhong W., Ye L., Zhang Q. (2024). MISNet: multi-source information-shared EEG emotion recognition network with two-stream structure. Front. Neurosci. 18, 1293962. doi:10.3389/fnins.2024.1293962
Hatami N., Gavet Y., Debayle J. (2019). Bag of recurrence patterns representation for time-series classification. Pattern Analysis Appl. 22, 877–887. doi:10.1007/s10044-018-0703-6
Haynes J. D., Rees G. (2006). Decoding mental states from brain activity in humans. Nat. Rev. Neurosci. 7, 523–534. doi:10.1038/nrn1931
Holland J. H. (1992). Genetic algorithms. Sci. Am. 267, 66–72. doi:10.1038/scientificamerican0792-66
Houssein E. H., Hammad A., Ali A. A. (2022). Human emotion recognition from EEG-based brain–computer interface using machine learning: a comprehensive review. Neural Comput. Appl. 34 (34), 12527–12557. doi:10.1007/s00521-022-07292-4
Hu L., Li L. (2022). Using tree-based machine learning for health studies: literature review and case series. Int. J. Environ. Res. Public Health 19, 16080. doi:10.3390/ijerph192316080
Hunt F. V., Beranek L. L., Maa D. Y. (1939). Analysis of sound decay in rectangular rooms. J. Acoust. Soc. Am. 11, 80–94. doi:10.1121/1.1916010
Jafari M., Shoeibi A., Khodatars M., Bagherzadeh S., Shalbaf A., García D. L., et al. (2023). Emotion recognition in EEG signals using deep learning methods: a review. Comput. Biol. Med. 165, 107450. doi:10.1016/j.compbiomed.2023.107450
Jellinger K. A. (2003). Functional magnetic resonance imaging: an introduction to methods. Eur. J. Neurol. 10, 751–752. doi:10.1046/j.1468-1331.2003.00657.x
Kan C., Cheng C., Yang H. (2016). Heterogeneous recurrence monitoring of dynamic transients in ultraprecision machining processes. J. Manuf. Syst. 41, 178–187. doi:10.1016/j.jmsy.2016.08.007
Khoo M. C. K., Webber C. L., Zbilut J. P. (1996). Assessing deterministic structures in physiological systems using recurrence plot strategies. Bioeng. approaches Pulm. physiology Med., 137–148. doi:10.1007/978-0-585-34964-0_8
Li C., Chen B., Zhao Z., Cummins N., Schuller B. W. (2021b). Hierarchical attention-based temporal convolutional networks for eeg-based emotion recognition. doi:10.1109/icassp39728.2021.9413635
Li J., Li S., Pan J., Wang F. (2021a). Cross-subject EEG emotion recognition with self-organized graph neural network. Front. Neurosci. 15, 611653. doi:10.3389/fnins.2021.611653
Li W., Fang C., Zhu Z., Chen C., Song A. (2024). Fractal spiking neural network scheme for EEG-based emotion recognition. IEEE J. Transl. Eng. Health Med. 12, 106–118. doi:10.1109/JTEHM.2023.3320132
Li Y., Zheng W., Cui Z., Zong Y., Ge S. (2019a). EEG emotion recognition based on graph regularized sparse linear regression. Neural Process Lett. 49, 555–571. doi:10.1007/s11063-018-9829-1
Li Y., Zheng W., Wang L., Zong Y., Qi L., Cui Z., et al. (2019b). A novel Bi-hemispheric discrepancy model for EEG emotion recognition. Available at: http://arxiv.org/abs/1906.01704.
Lindquist K. A., Wager T. D., Kober H., Bliss-Moreau E., Barrett L. F. (2012). The brain basis of emotion: a meta-analytic review. Behav. Brain Sci. 35, 121–143. doi:10.1017/s0140525x11000446
Liu H., Zhang Y., Li Y., Kong X. (2021). Review on emotion recognition based on electroencephalography. Front. Comput. Neurosci. 15, 758212–758215. doi:10.3389/fncom.2021.758212
Liu X., Li T., Tang C., Xu T., Chen P., Bezerianos A., et al. (2019). Emotion recognition and dynamic functional connectivity analysis based on EEG. IEEE Access 7, 143293–143302. doi:10.1109/access.2019.2945059
Liu Y., Sourina O., Nguyen M. K. (2010). “Real-time EEG-based human emotion recognition and visualization,” in Proceedings - 2010 international conference on cyberworlds, CW 2010, 262–269.
Lucarini V., Faranda D., de Freitas J. M. M., Holland M., Kuna T., Nicol M., et al. (2016). Extremes and recurrence in dynamical systems. John Wiley \and Sons.
Marwan N. (2008). A historical review of recurrence plots. Eur. Phys. J. Special Top. 164, 3–12. doi:10.1140/epjst/e2008-00829-1
Marwan N., Carmen R. M., Thiel M., Kurths J. (2007a). Recurrence plots for the analysis of complex systems. Phys. Rep. 438, 237–329. doi:10.1016/j.physrep.2006.11.001
Marwan N., Kurths J., Saparin P. (2007b). Generalised recurrence plot analysis for spatial data. Phys. Lett. Sect. A General, Atomic Solid State Phys. 360, 545–551. doi:10.1016/j.physleta.2006.08.058
Mcinnes L., Healy J., Melville J. (2020). UMAP: uniform manifold approximation and projection for dimension reduction.
Meilă M., Zhang H. (2024). Manifold learning: what, how, and why. Annu. Rev. Stat. Appl. 11, 393–417. doi:10.1146/annurev-statistics-040522-115238
Mosavi A., Faghan Y., Ghamisi P., Duan P., Ardabili S. F., Salwana E., et al. (2020). Comprehensive review of deep reinforcement learning methods and applications in economics. Mathematics 8, 1640. doi:10.3390/MATH8101640
Murugappan M., Murugappan S. (2013) “Human emotion recognition through short time Electroencephalogram (EEG) signals using Fast Fourier Transform (FFT),” in Proceedings - 2013 IEEE 9th international colloquium on signal processing and its applications. IEEE, 289–294. doi:10.1109/CSPA.2013.6530058
Nahm F. S. (2022). Receiver operating characteristic curve: overview and practical use for clinicians. Korean J. Anesthesiol. 75, 25–36. doi:10.4097/kja.21209
Ning X., Wang J., Lin Y., Cai X., Chen H., Gou H., et al. (2024). MetaEmotionNet: spatial–spectral–temporal-based attention 3-D dense network with meta-learning for EEG emotion recognition. IEEE Trans. Instrum. Meas. 73, 1–13. doi:10.1109/tim.2023.3338676
Pan J., Liang R., He Z., Li J., Liang Y., Zhou X., et al. (2024). ST-SCGNN: a spatio-temporal self-constructing graph neural network for cross-subject EEG-based emotion recognition and consciousness detection. IEEE J. Biomed. Health Inf. 28, 777–788. doi:10.1109/JBHI.2023.3335854
Pang M., Wang H., Huang J., Vong C. M., Zeng Z., Chen C. (2024). Multi-scale masked autoencoders for cross-session emotion recognition. IEEE Trans. Neural Syst. Rehabilitation Eng. 32, 1637–1646. doi:10.1109/TNSRE.2024.3389037
Peng B., Chen C.-B. (2023). “Multiscale dynamic transition analysis of solar radiation prediction,” in IISE annual conference and expo 2023. doi:10.21872/2023IISE_1787
Peng Y., Liu H., Li J., Huang J., Lu B.-L., Kong W. (2023). Cross-session emotion recognition by joint label-common and label-specific EEG features exploration. Ieee Trans. Neural Syst. Rehabilitation Eng. 31, 759–768. doi:10.1109/tnsre.2022.3233109
Pouyet E., Rohani N., Katsaggelos A. K., Cossairt O., Walton M. (2018). Innovative data reduction and visualization strategy for hyperspectral imaging datasets using t-SNE approach. Pure Appl. Chem. 90, 493–506. doi:10.1515/pac-2017-0907
Roth V. (2004). The generalized LASSO. IEEE Trans. Neural Netw. 15, 16–28. doi:10.1109/TNN.2003.809398
Roweis S. T., Saul L. K. (1979). Nonlinear dimensionality reduction by locally linear embedding. Science 290, 2323–2326. doi:10.1126/science.290.5500.2323
Shu Z. R., Chan P. W., Li Q. S., He Y. C., Yan B. W. (2021). Investigation of chaotic features of surface wind speeds using recurrence analysis. J. Wind Eng. Industrial Aerodynamics 210, 104550. doi:10.1016/j.jweia.2021.104550
Si X., Huang D., Sun Y., Huang S. W., He H., Ming D. (2023). Transformer-based ensemble deep learning model for EEG-based emotion recognition. Brain Sci. Adv. 9, 210–223. doi:10.26599/bsa.2023.9050016
Thornton M. A., Tamir D. I. (2017). Mental models accurately predict emotion transitions. Proc. Natl. Acad. Sci. U. S. A. 114, 5982–5987. doi:10.1073/pnas.1616056114
Tian Z., Huang D., Zhou S., Zhao Z.-D., Jiang D. (2021). Personality first in emotion: a deep neural network based on electroencephalogram channel attention for cross-subject emotion recognition. R. Soc. Open Sci. 8, 201976. doi:10.1098/rsos.201976
Tong F., Pratte M. S. (2012). Decoding patterns of human brain activity. Annu. Rev. Psychol. 63, 483–509. doi:10.1146/annurev-psych-120710-100412
Turchetti C., Falaschetti L. (2019). A manifold learning approach to dimensionality reduction for modeling data. Inf. Sci. (N Y) 491, 16–29. doi:10.1016/j.ins.2019.04.005
Van Booven D. J., Chen C., Malpani S., Mirzabeigi Y., Mohammadi M., Wang Y., et al. (2024b). Synthetic genitourinary image synthesis via generative adversarial networks: enhancing AI diagnostic precision. doi:10.3390/jpm14070703
Van Booven D. J., Chen C.-B., Kryvenko O., Punnen S., Sandoval V., Malpani S., et al. (2024a). Synthetic histology images for training ai models: a novel approach to improve prostate cancer diagnosis. bioRxiv, 2001–2024. doi:10.1101/2024.01.25.577225
Wang F., Wu S., Zhang W., Xu Z., Zhang Y., Wu C., et al. (2020). Emotion recognition with convolutional neural network and EEG-based EFDMs. Neuropsychologia 146, 107506. doi:10.1016/j.neuropsychologia.2020.107506
Wang H., Xu L., Bezerianos A., Chen C., Zhang Z. (2021). Linking attention-based multiscale CNN with dynamical GCN for driving fatigue detection. IEEE Trans. Instrum. Meas. 70, 1–11. doi:10.1109/TIM.2020.3047502
Wang Y., Chen C.-B. (2022). “Recurrence quantification analysis for spatial data,” in IIE annual conference. Proceedings, 1–6.
Wang Z., Chen C., Li J., Wan F., Sun Y., Wang H. (2023). ST-CapsNet: linking spatial and temporal attention with capsule network for P300 detection improvement. IEEE Trans. Neural Syst. Rehabilitation Eng. 31, 991–1000. doi:10.1109/tnsre.2023.3237319
Webber Jr C. L., Zbilut J. P. (2005). Recurrence quantification analysis of nonlinear dynamical systems. Tutorials Contemp. nonlinear methods Behav. Sci. 94, 26–94.
Wolpaw J. R., Birbaumer N. (2006). Brain–computer interfaces for communication and control. doi:10.1017/cbo9780511545061.036
Xu T., Huang J., Pei Z., Chen J., Li J., Bezerianos A., et al. (2023b). The effect of multiple factors on working memory capacities: aging, task difficulty, and training. IEEE Trans. Biomed. Eng. 70, 1967–1978. doi:10.1109/TBME.2022.3232849
Xu T., Wang H., Lu G., Wan F., Deng M., Qi P., et al. (2023a). E-key: an EEG-based biometric authentication and driving fatigue detection system. IEEE Trans. Affect Comput. 14, 864–877. doi:10.1109/taffc.2021.3133443
Yang H., Chen C. B., Kumara S. (2020). Heterogeneous recurrence analysis of spatial data. Chaos 30, 013119. doi:10.1063/1.5129959
Yang H., Chen Y. (2014). Heterogeneous recurrence monitoring and control of nonlinear stochastic processes. Chaos 24, 013138. doi:10.1063/1.4869306
Yang L., Zheng W., Wang L., Zong Y., Cui Z. (2022). From regional to global brain: a novel hierarchical spatial-temporal neural network model for EEG emotion recognition. IEEE Trans. Affect Comput. 13, 568–578. doi:10.1109/taffc.2019.2922912
Yuvaraj R. ;, Thagavel P., Thomas J., Fogarty J., Ali F., Guo Y., et al. (2023). Comprehensive analysis of feature extraction methods for emotion recognition from multichannel EEG recordings. Sensors 23 (23), 915. doi:10.3390/s23020915
Zhang B., Shang P., Mao X., Liu J. (2023). Dispersion heterogeneous recurrence analysis and its use on fault detection. Commun. Nonlinear Sci. Numer. Simul. 117, 106902. doi:10.1016/j.cnsns.2022.106902
Zheng W. L., Liu W., Lu Y., Lu B. L., Cichocki A. (2019b). EmotionMeter: a multimodal framework for recognizing human emotions. IEEE Trans. Cybern. 49, 1110–1122. doi:10.1109/TCYB.2018.2797176
Zheng W. L., Zhu J. Y., Lu B. L. (2019a). Identifying stable patterns over time for emotion recognition from eeg. IEEE Trans. Affect Comput. 10, 417–429. doi:10.1109/taffc.2017.2712143
Zhong P., Wang D., Miao C. (2019). EEG-based emotion recognition using regularized graph neural networks. Available at: http://arxiv.org/abs/1907.07835.
Keywords: heterogeneous recurrence analysis, emotion recognition, multi-channel EEG, dynamic system, ensemble learning
Citation: Wang Y, Chen C-B, Imamura T, Tapia IE, Somers VK, Zee PC and Lim DC (2024) A novel methodology for emotion recognition through 62-lead EEG signals: multilevel heterogeneous recurrence analysis. Front. Physiol. 15:1425582. doi: 10.3389/fphys.2024.1425582
Received: 30 April 2024; Accepted: 27 June 2024;
Published: 25 July 2024.
Edited by:
Bing Yao, The University of Tennessee, United StatesReviewed by:
Pranjali Gajbhiye, Nirvesh Enterprises Private Limited, IndiaCopyright © 2024 Wang, Chen, Imamura, Tapia, Somers, Zee and Lim. This is an open-access article distributed under the terms of the Creative Commons Attribution License (CC BY). The use, distribution or reproduction in other forums is permitted, provided the original author(s) and the copyright owner(s) are credited and that the original publication in this journal is cited, in accordance with accepted academic practice. No use, distribution or reproduction is permitted which does not comply with these terms.
*Correspondence: Cheng-Bang Chen, Y3hjMTkyMEBtaWFtaS5lZHU=
Disclaimer: All claims expressed in this article are solely those of the authors and do not necessarily represent those of their affiliated organizations, or those of the publisher, the editors and the reviewers. Any product that may be evaluated in this article or claim that may be made by its manufacturer is not guaranteed or endorsed by the publisher.
Research integrity at Frontiers
Learn more about the work of our research integrity team to safeguard the quality of each article we publish.