 V. Pradeep1
 Ananda Babu Jayachandra
 Mohamed Abouhawwash
- 1Department of Information Science and Engineering, Alva’s Institute of Engineering and Technology, Mangaluru, India
- 2Department of Information Science and Engineering, Malnad College of Engineering, Hassan, India
- 3Department of Statistics and Operations Research, College of Science, King Saud University, Riyadh, Saudi Arabia
- 4Department of Mathematics, Faculty of Science, Mansoura University, Mansoura, Egypt
Introduction: Eye movement is one of the cues used in human–machine interface technologies for predicting the intention of users. The developing application in eye movement event detection is the creation of assistive technologies for paralyzed patients. However, developing an effective classifier is one of the main issues in eye movement event detection.
Methods: In this paper, bidirectional long short-term memory (BILSTM) is proposed along with hyperparameter tuning for achieving effective eye movement event classification. The Lévy flight and interactive crossover-based reptile search algorithm (LICRSA) is used for optimizing the hyperparameters of BILSTM. The issues related to overfitting are avoided by using fuzzy data augmentation (FDA), and a deep neural network, namely, VGG-19, is used for extracting features from eye movements. Therefore, the optimization of hyperparameters using LICRSA enhances the classification of eye movement events using BILSTM.
Results and Discussion: The proposed BILSTM–LICRSA is evaluated by using accuracy, precision, sensitivity, F1-score, area under the receiver operating characteristic (AUROC) curve measure, and area under the precision–recall curve (AUPRC) measure for four datasets, namely, Lund2013, collected dataset, GazeBaseR, and UTMultiView. The gazeNet, human manual classification (HMC), and multi-source information-embedded approach (MSIEA) are used for comparison with the BILSTM–LICRSA. The F1-score of BILSTM–LICRSA for the GazeBaseR dataset is 98.99%, which is higher than that of the MSIEA.
1 Introduction
The human eye is considered a spontaneous way of understanding human communication and interaction, which is exploited for processing data according to the nearby environment, in response to the respective situation. The physiological capacities are highly constrained from creating movement in any of the limbs or the head, as a result of various diseases such as Parkinson’s, spinal cord injury, locked-in syndrome, muscular dystrophy, multiple sclerosis, complete paralysis, and arthritis. Hence, around 132 million disabled people require a wheelchair, and only 22% of them have access to one. Moreover, these disabled people cannot use a technically improved wheelchair. Therefore, an eye detection and tracking method is investigated for enhancing the interaction between humans and computers, and it will enhance the living standard of disabled people (Dahmani et al., 2020; Barz, and Sonntag, 2021; Koochaki, and Najafizadeh, 2021; Aunsri, and Rattarom, 2022). Brain activity triggers eye movements that are a response to visual stimuli or an intent to obtain information about the neighboring environment (Harezlak, and Kasprowski, 2020; Li et al., 2021; Vortmann, and Putze, 2021). Generally, eye movements are categorized into saccades and fixations, i.e., when the eye gaze moves from one position to another position and pauses at a certain position, respectively (Harezlak et al., 2019; Rahman et al., 2021; Yoo et al., 2021).
Eye tracking is the process of tracking and determining the movements of the eye and the focal point of the eye. The technology of eye tracking is used in various fields such as cognitive science, computer gaming, marketing, medicine, and psychology. Hence, eye tracking is extensively used in computer science applications by making use of the features of the eye for studying information processing tasks. In general, eye-tracking information is computed and acquired by using an eye-tracking sensor/camera. The acquired data offer many features and are useful in various classification tasks (Lim et al., 2022; Holmqvist et al., 2023). Eye tracking metrics are used for disclosing perceptions about the participant’s actions and mindset in different circumstances. Significant eye-tracking metrics are saccades, duration, pointing, fixation, and pupil diameter (Bitkina et al., 2021; Elmadjian et al., 2023). Eye movement classification is affected because eye-tracking data contain a huge amount of user data that are not required for all applications. For example, eye movement discovers characteristics such as bio-markers, identity, and gender (David-John et al., 2021).
In this research, eye movement event detection is performed using a deep learning classifier with hyperparameter tuning. Generally, hyperparameter tuning is used to choose the parameter values and obtain improved classification (Shankar et al., 2020). The major contributions of this research are given as follows:
• A BILSTM is used for classifying eye movement events to help disabled people. The BILSTM is used in this research because it considers both the past and upcoming data while classifying the given input.
• The LICRSA-based hyperparameter tuning has been proposed to optimize the following parameters: dropout, learning rate, L2 regularization, and max-epoch. The LICRSA is used because its Lévy flight approach helps discover out-of-local solutions. Next, interactive crossover increases the ability to search by acquiring the solution through optimal and remaining candidate solutions.
The remaining paper is organized as follows: Section 2 provides the details about existing eye-tracking applications. The proposed method is detailed in Section 4, whereas the outcomes of the proposed method are presented in Section 4. Finally, Section 5 offers the conclusion.
2 Related works
Li et al. (2020) implemented a machine learning-based automated approach to perform fatigue detection and classification for equipment operators. Toeplitz inverse covariance-based clustering (TICC) was used to obtain various mental fatigue levels and labeling based on the movement of the eye. Features of eye movement were acquired for various construction sites, and supervised learning classified the mental fatigue levels of the operator. TICC along with machine learning were used in various construction sites due to higher accuracy. An additional enhancement in accuracy was achieved only by using a large number of eye movement metrics related to mental fatigue.
Yang et al. (2023) developed an analysis for the attention patterns in depressed patients based on the region-of-interest (ROI) analysis. The established ROI recognition analysis was named ROI eventless clustering (REC) and did not need eye movement event discovery. For diverse attribute features, ROI clustering was operated with deflection elimination (RCDE) for supporting the discovery of depression. This RCDE also used noisy data for describing the attention patterns. Moreover, it was essential to use eye movement event because gaze features were vital while performing classification.
Mao et al., 2020 implemented disease classification according to the movements of the eye by using a deep neural network. Normalized pupil data such as size and location were offered as features of the eye movement. For each feature, long short-term memory (LSTM) was used for developing a weak classifier. The weights of each weak classifier were discovered using a self-learning method. Next, a strong classifier was designed by synthesizing the weak classifiers. The classifier with fewer samples was less robust while performing the classification.
Zemblys et al., 2019 implemented event detection using gazeNet without any requirement for hand-crafted signal features or signal thresholding. End-to-end deep learning was used in gazeNet, which categorized raw eye-tracking data into fixations, post-saccadic oscillations, and saccades. The problems created by unbalanced inputs were overcome by using heuristic data augmentation. However, the effect of previously classified information was required to be eliminated in gazeNet for enhancing event detection.
Friedman et al., 2023 developed the classification of eye movement using human manual classification (HMC). In manual classification, higher inter-rater reliability was used because it was an important representation of an expressive standardized categorization. For evaluating the results acquired from automatic classification, inter-rater reliability was used, alongside the training of machine learning approaches to achieving better classification. The HMC was effective only when operated with less input data during eye movement detection.
Yuan et al., 2021 presented the multi-source information-embedded approach (MSIEA) to investigate driving actions. A precise eye gaze was estimated by using the identification of eye gaze without gaze calibration. The information of multiscale sparse features of eye and head poses was combined for predicting the direction of gaze. Next, fused data were obtained by integrating the estimated gaze with vehicle data. The FastICA was used for discovering a large amount of driving-related data which were used for understanding the driving actions. The driver’s head orientations affected the performances of the MSIEA.
Kanade et al., 2021 developed gaze classification using convolutional neural networks (CNNs) for vehicular environments. From the input, the images of the face, right eye, and left eye were acquired using region-of-interest. Appropriate gaze features were obtained by fine-tuning the VGG-face network with pre-trained CNNs. Here, the classification was performed using the distance factor. The learning methodologies used in eye-tracking were utilized for enhancing the performance of eye feature evaluation.
3 BILSTM–LICRSA method
The classification of eye movement event detection is performed using a BILSTM deep learning classifier, whereas the LICRSA is used to optimize the hyperparameters. The important processes of this proposed method are dataset acquisition, data augmentation, feature extraction using VGG-19, BILSTM classification, and LICRSA-based hyperparameter tuning process. The block diagram for the BILSTM–LICRSA method is shown in Figure 1.
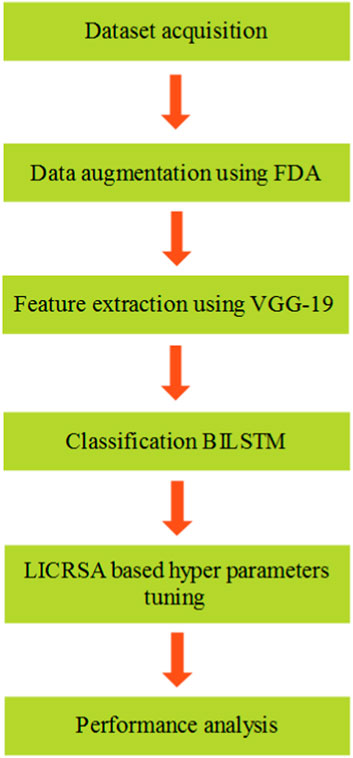
Figure 1. Block diagram of the BILSTM–LICRSA method.
3.1 Dataset acquisition
This research uses four different datasets: Lund2013 dataset (Larsson et al., 2013), collected dataset, GazeBaseR dataset (https://figshare.com/articles/dataset/GazeBase_Data_Repository/12912257.), and UTMultiView dataset (Sugano et al., 2014). Information about the datasets is given below:
3.1.1 Lund2013
An annotated eye-tracker dataset, Lund2013 dataset, created at Humanities Lab (Larsson et al., 2013) was used to perform eye movement event detection. Monocular eye movement data of a person’s viewing images, videos, and moving dots are included in the Lund2013 dataset. The Lund2013 dataset has different classes such as fixations, saccades, smooth pursuit, post-saccadic oscillations, blinks, and undefined events. The data of fixations, saccades, and post-saccadic oscillations from the Lund2013 dataset are used in this research, which are 136,078 samples in total.
3.1.2 Collected dataset
Participants were made to sit directly facing the webcam at a fixed distance for collecting real-time face images. Videos are obtained by the webcam while the user follows a pre-defined on-screen target, i.e., a dot that moves in different locations. An onscreen target’s trajectory is recorded as the eye movement trajectory (EMT) in the system, and related angle images are saved using the real-time webcam. A sample real-time face image is shown in Figure 2. Both the images and EMT are combined as a collective dataset and used for real-time analysis. The total instances gathered are 10,000 from 100 test users, and it has the labels of fixations, saccades, and post-saccadic oscillations.

Figure 2. Sample real-time image.
3.1.3 GazeBaseR
The GazeBaseR dataset has temporal motion features of gaze points and spatial distribution features of saccades. The gaze point’s temporal motion features are a sequence of timestamps, and it is related to the gaze points, e.g., [0.1 s, (30, 20)], [0.2 s, (32, 22)], and [0.3 s, (31, 21)], which denotes the gaze point at various times. On the other hand, spatial distribution is a saccade vector series, e.g., (5, 3), (4, 2), and (3, 1), which denotes the distance and direction of eye movements. Two classes exist in this dataset during the prediction: movement or no movement.
3.1.4 UTMultiView dataset
The UTMultiView has eye image and 3D head pose features, where the eye image is a grayscale and low-resolution image that has the iris, pupil, and some portion of the sclera. Next, the 3D head pose is a three-element vector (such as 30, 45, and 60) denoting a person’s head orientation by means of roll, pitch, and yaw. The prediction provides the three-element vector, e.g., 10, 20, and −10, denoting the evaluated direction of gaze.
The real-time images from the collected dataset and UTMultiView dataset are processed under FDA and VGG-19 to augment and extract features from the images. The text data are directly fed to the classifier along with the respective extracted features from VGG-19 for classification.
3.2 FDA-based data augmentation
FDA (Dabare et al., 2022) augments the collected data (i.e., images from the dataset), which is considered a preprocessing approach for avoiding overfitting issues in a classifier. There are two different phases that exist in the augmentation: fuzzification and generation of new augmented data. First, fuzzification is performed according to the clustering and identifying the membership grade of every record. A new input characteristic value is created according to the adequate cluster center value discovery and using the threshold value, which is an
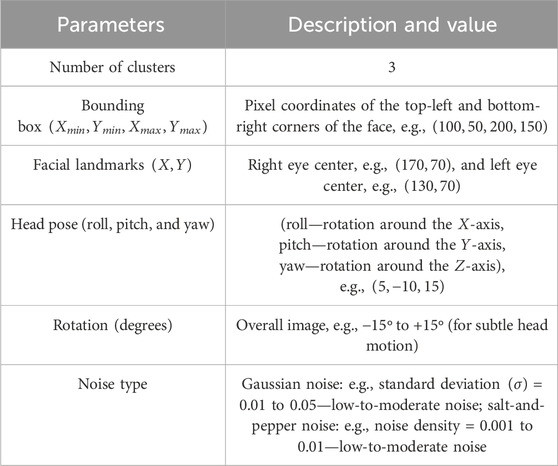
Table 1. Augmentation parameters.
3.2.1 Fuzzification of an entire input space
For the input data, the attributes are clustered using the fuzzy C-means (FCM) clustering method. The FCM method is selected because of the identification capacity for each cluster’s membership grade of every piece of information. The fuzzification process is described as follows:
1. FCM clusters the input data and deduces the membership degree of each attribute of the cluster. The usage of FCM clustering for unknown data offers a measure of belongingness, which is represented as the membership grade for every cluster. If unknown information is clustered, it belongs to various clusters. In FCM clustering, data have membership degrees either as 1 or 0 for the cluster center. The membership degree is 1, when the data belong to a respective cluster; otherwise, the membership degree is 0. Therefore, the values of membership degree are defined by the cluster.
2. The membership grade is considered in descending order for each attribute during the formation of the new membership dataset. For each record in the dataset, it is considered that the input contains
Therefore,
where,
3.2.2 New augmented dataset generation
An allocation of cluster center
1. Fuzzy uncertainty and fuzzy clustering are used to transform the input for identifying the appropriate cluster center of each data of cluster.
2. The fixed
3. Data with a smaller membership degree than the selected
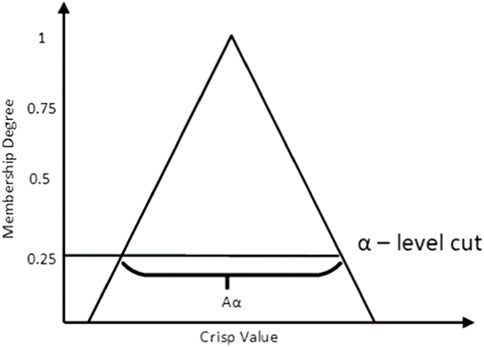
Figure 3. Sample of the triangular membership function for
Equation 6 is the identified threshold value for
where
Hence, the cluster center of each element is transformed as the
The augmented data from the FDA is concatenated with the input data results, in 305,744 samples, which is 55.49% is higher than the given input. The sample for the augmented real-time image used along with the input is shown in Figure 4.
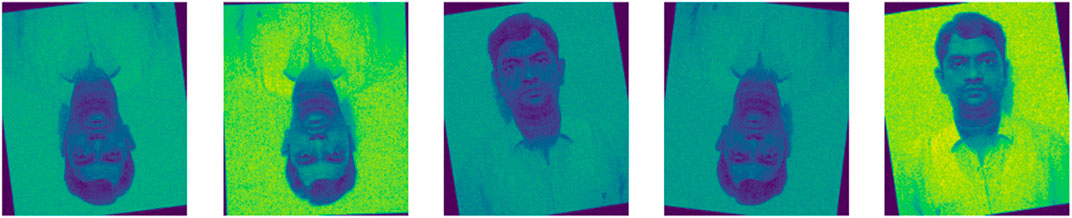
Figure 4. Sample augmented image.
3.3 Feature extraction using VGG-19
In feature extraction, the VGG-19 (Mateen et al., 2019) is used to obtain important features from the augmented input
3.4 Classification using BILSTM
The features from VGG-19 are given along with the text features from the respective dataset as input to the BILSTM (Ali et al., 2021) for classifying eye movements. In general, LSTM is an extended version of a recurrent neural network with a similar kind of architecture. The RNN and LSTM transfer the data from one stage to another stage. The LSTM classification offers higher success in longstanding dependencies. However, a single LSTM unit is restricted to classifying the output according to the previous data. Hence, the single LSTM has the possibility of providing misclassification without considering the forward data. Accordingly, the BILSTM approach is developed, which incorporates both the past and upcoming data, therefore enhancing the classification. There are two LSTM models operated in a parallel manner, as shown in Figure 5. In that, one LSTM operates from the input data’s start, and the other operates from the input data’s end. Consequently, the BILSTM classification supports both the previous and upcoming data. For instance, the first and second LSTM of BILSTM studies the data starting from left to right and ending from right to left. This helps the BILSTM model completely keep the information of eye movement data for classification.
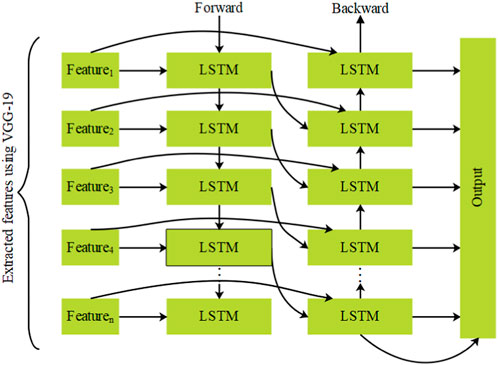
Figure 5. Architecture of BILSTM.
The BILSTM model shown in Figure 5 is used in the hidden layers, which have the capacity for keeping older data for a short time. An essential element in the BILSTM model is a memory cell
The
Here, the parameters that need to be learned in the BILSTM classification are
where BILSTM has
3.5 LICRSA-based hyperparameter tuning for BILSTM
The important goal of this work is to optimize BILSTM’s hyperparameters using the LICRSA (Huang et al., 2022) and obtain improved performance in the classification. In general, the RSA replicates the predation plan and social activities of crocodiles. Hyperparameters such as dropout, learning rate, L2 regularization, and max-epoch are optimized using the LICRSA. The LICRSA starts from the initial solutions, i.e., randomly initializes the hyperparameters and helps enhance the classification. The fitness function considered for BILSTM is to perform the analysis and return the accuracy of eye movement classification.
3.5.1 An iterative process of the LICRSA for hyperparameter tuning
The solutions of the LICRSA are initialized using the minimum and maximum values of dropout, learning rate, L2 regularization, and max-epoch. The range of dropout is
Equation 22 expresses the definition of Lévy dissemination.
where
where the location
where a difference in the percentage among the crocodiles in the best location and current location is denoted as
The candidate solutions in the current location are readjusted using interaction crossover based on the information exchange of the candidate in the best solution and two candidate solutions. The new location obtains data over optimal and remaining candidate solutions for enhancing the ability to search for achieving an optimal set of hyperparameters. Initially, the parameter
The population in the LICRSA is randomly separated into two portions with the same amount of crocodiles. The selected portions are
where stochastic integers in the range of
The evaluation measures considered for this research are accuracy, precision, sensitivity, and F1-score, which are expressed in Eqs 29–32.
where
4 Results and discussion
The proposed eye movement detection is implemented and simulated using MATLAB R 2020a software, where the system functions with an i5 processor and 8 GB RAM. The proposed method is used to classify the eye movements of disabled people.
4.1 Performance analysis
Eye movement event detection is an important objective of this proposed method, which is specifically designed for disabled people. For performing eye movement event detection and classification, data from the Lund2013 and collected datasets acquired in real-time are used for analysis. However, event detection using eye movement is not implemented by many types of research; hence, two more datasets: GazeBaseR dataset (https://figshare.com/articles/dataset/GazeBase_Data_Repository/12912257.) and UTMultiView (Sugano et al., 2014) are considered for further analyzing the proposed method. A total of 322 subjects are included in the GazeBaseR dataset, where everyone has completed two recording sessions. Moreover, UTMultiView has 24,320 samples, which include head pose and gaze directions. The training and testing ratio of 70:30 is considered for evaluating the BILSTM–LICRSA. In this section, the proposed method is evaluated with different classifiers and optimization algorithms for the hyperparameter tuning process.
4.1.1 BILSTM–LICRSA evaluation with different classifiers
This section shows the performance of BILSTM with different classifiers such as GAN, RNN, and LSTM. The confusion matrix (CM) of the GAN, RNN, LSTM, and BILSTM for the Lund2013 dataset is shown in Figure 6. The numbers 0, 1, and 2 represent the classes of fixations, saccades, and post-saccadic oscillations, respectively. This CM is used to determine how well the developed model performs an effective classification. From the analysis, it is concluded that BILSTM offers a better performance than the GAN, RNN, and LSTM.
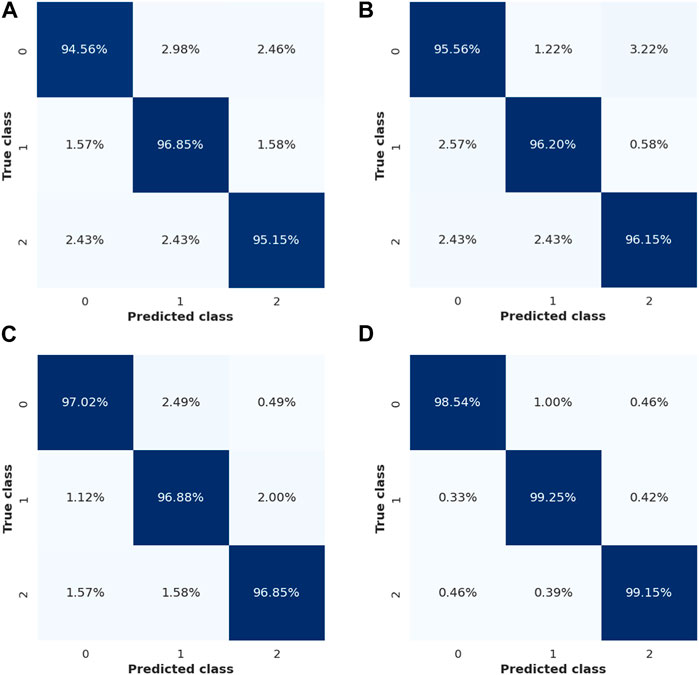
Figure 6. Confusion matrix. (A) GAN, (B) RNN, (C) LSTM, and (D) BILSTM.
Here, the LICRSA-based hyperparameter tuning is incorporated into the classifiers. The analysis of BILSTM with different classifiers is shown in Tables 2–5 for Lund2013, collected, GazeBaseR, and UTMultiView datasets, respectively. From these analyses, it is found that the proposed BILSTM method provides better performance than the GAN, RNN, and LSTM. For example, the accuracy of BILSTM for the GazeBaseR dataset is 98.95%, whereas the GAN obtains 95.93%, RNN obtains 96.80%, and LSTM obtains 97.40%. The reasons for BILSTM having superior performances are stated as follows: 1) the combined information of both the past and upcoming data is used to avoid misclassification while classifying the data and 2) the hyperparameter tuning process developed for BILSTM further enhances the classification.
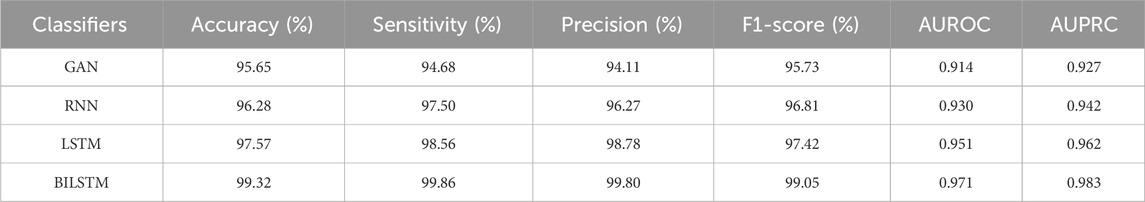
Table 2. BILSTM–LICRSA evaluation with different classifiers for the Lund2013 dataset.

Table 3. BILSTM–LICRSA evaluation with different classifiers for the collected dataset.
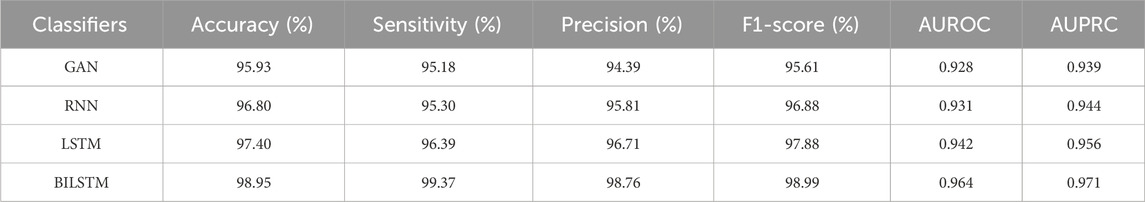
Table 4. BILSTM–LICRSA evaluation with different classifiers for the GazeBaseR dataset.
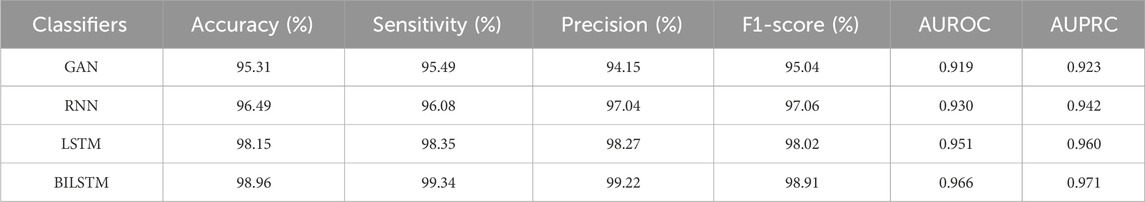
Table 5. BILSTM–LICRSA evaluation with different classifiers for the UTMultiView dataset.
The performance evaluation for the BILSTM–LICRSA according to the augmentation is shown in Table 6. This shows that BILSTM–LICRSA with augmented data from the FDA improves the classification than the actual input. The BILSTM–LICRSA with FDA achieves enhanced performance compared to the classifier with actual input by avoiding the overfitting issue.
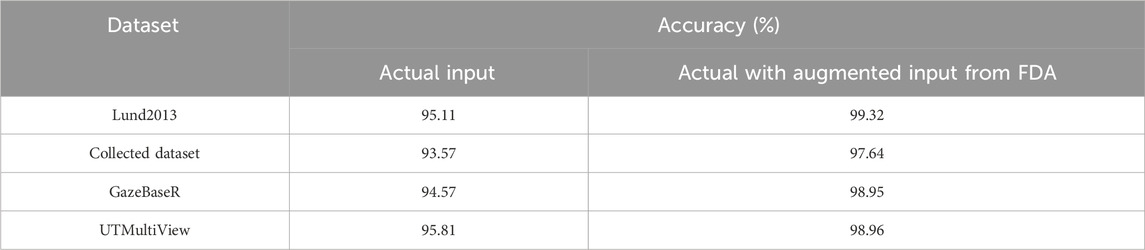
Table 6. Analysis of accuracy based on FDA.
The bootstrapping average precision (AP) and rank for different classifiers is shown in Table 7. According to the statistics, an average precision is investigated from a single test set sample, that is, the point evaluation. The point evaluation is varied with the usage of various test sets for investigation, which falls into confidence intervals with a definite probability. These confidence intervals are utilized for evaluating the difference among the algorithms. This analysis represents that BILSTM has the first grade among other classifiers.
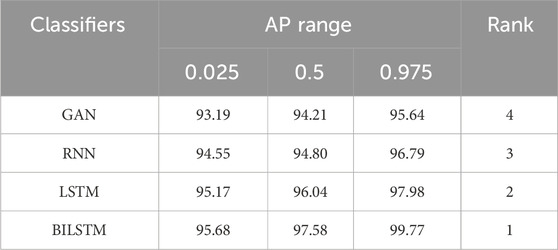
Table 7. Analysis of bootstrapping AP and rank.
4.1.2 BILSTM–LICRSA evaluation with different optimizations
This section shows the performance of the LICRSA with different optimization algorithms such as PSO, GWO, and RSA. The evaluation of BILSTM–LICRSA with different optimization algorithms for Lund2013, collected, GazeBaseR, and UTMultiView datasets is given in Tables 8–11, respectively. This analysis shows that the LICRSA achieves improved classification than PSO, GWO, and RSA. The LICRSA with BILSTM for the GazeBaseR dataset achieves an accuracy of 98.95%, whereas the PSO obtains 93.56%, GWO obtains 96.24%, and RSA obtains 97.89%. In LICRSA, the Lévy flight and interactive crossover are used for searching the local solutions and enhancing the ability to search, which is further used to achieve the optimal set of hyperparameters. This helps improve the classification of eye movement.
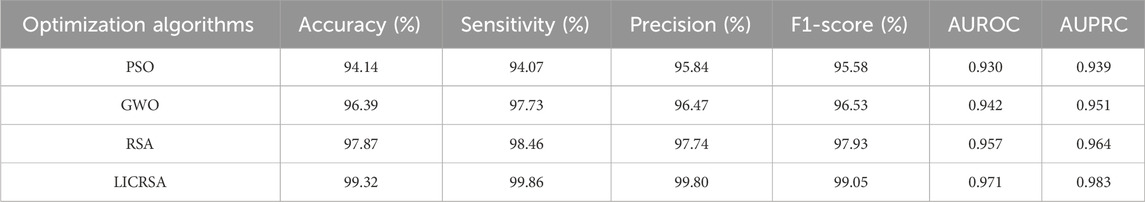
Table 8. BILSTM–LICRSA evaluation with different optimization algorithms for the Lund2013 dataset.
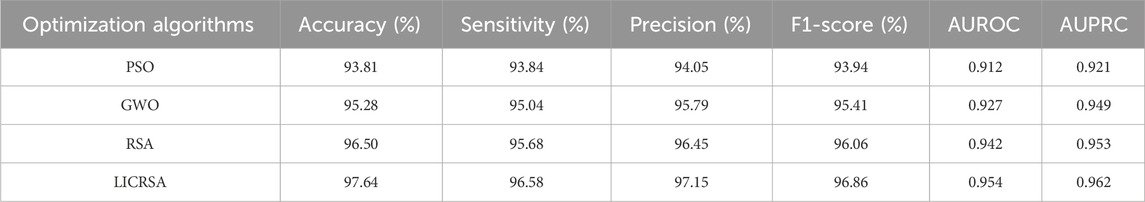
Table 9. BILSTM–LICRSA evaluation with different optimization algorithms for the collected dataset.
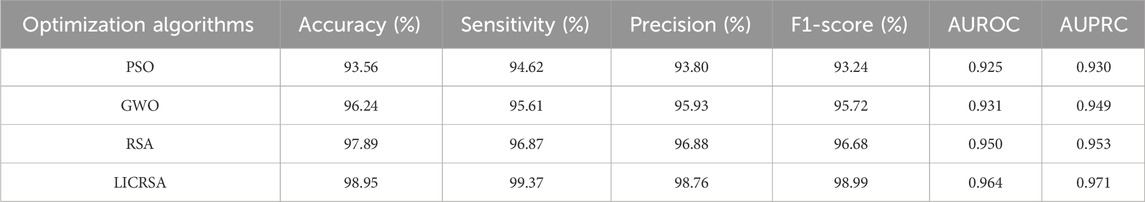
Table 10. BILSTM–LICRSA evaluation with different optimization algorithms for the GazeBaseR dataset.
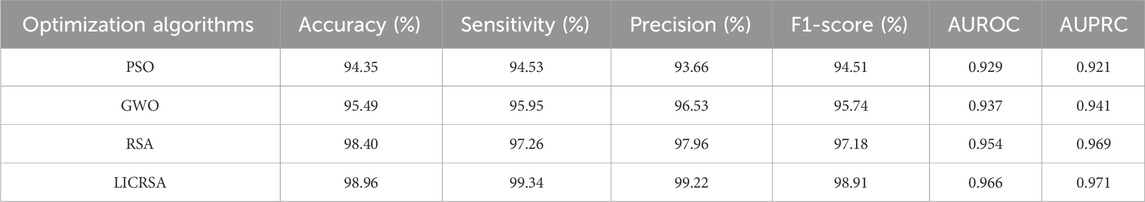
Table 11. BILSTM–LICRSA evaluation with different optimization algorithms the UTMultiView dataset.
4.2 Comparative analysis
The comparative analysis of BILSTM–LICRSA with existing methods such as the gazeNet (Zemblys et al., 2019), HMC (Friedman et al., 2023), and MSIEA (Yuan et al., 2021) is provided in this section. The comparative analysis is provided for three different datasets: Lund2013, GazeBaseR, and UTMultiView. Here, the gazeNet (Zemblys et al., 2019), HMC (Friedman et al., 2023), and MSIEA (Yuan et al., 2021) are considered for comparisons of the Lund2013 dataset, GazeBaseR dataset, and UTMultiView dataset, respectively. The evaluation of BILSTM–LICRSA with gazeNet (Zemblys et al., 2019), HMC (Friedman et al., 2023), and MSIEA (Yuan et al., 2021) is shown in Tables 12–14. This comparison denotes that the BILSTM–LICRSA accomplishes improved classification than the gazeNet (Zemblys et al., 2019), HMC (Friedman et al., 2023), and MSIEA (Yuan et al., 2021). The LICRSA is used to identify the optimal set of hyperparameters, alongside the utilization of past and upcoming data in BILSTM being utilized to enhance the classification.
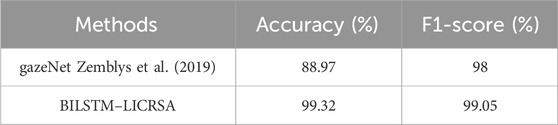
Table 12. Comparison for the Lund2013 dataset.
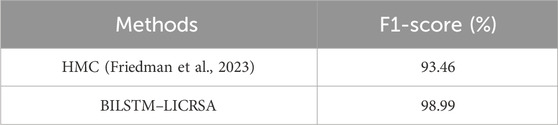
Table 13. Comparison for the GazeBaseR dataset.
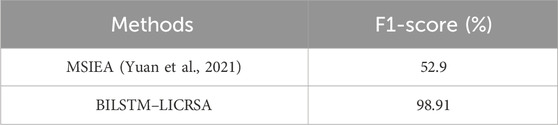
Table 14. Comparison for the UTMultiView dataset.
4.3 Discussion
This section offers a detailed discussion related to the outcomes of BILSTM–LICRSA developed for eye movement event classification. Initially, the results of BILSTM were investigated with different state-of-the-art classifiers such as the GAN, RNN, and LSTM. Next, different optimization algorithms such as PSO, GWO, and RSA were used to investigate the efficiency of optimal hyperparameters discovered from the LICRSA. The developed BILSTM–LICRSA method is analyzed with four datasets: Lund2013, collected dataset, GazeBaseR, and UTMultiView. The evaluation of results represents that the BILSTM–LICRSA achieves a better performance than the GAN, RNN, LSTM, PSO, GWO, and RSA. Moreover, the BILSTM–LICRSA has better performance than the existing gazeNet (Zemblys et al., 2019), HMC (Friedman et al., 2023), and MSIEA (Yuan et al., 2021). BILSTM presents robust classification by integrating both the past and upcoming data during the recognition. Moreover, the optimum hyperparameters obtained from the LICRSA additionally help improve the classification.
5 Conclusion
In this paper, an effective eye movement event classification is achieved by using BILSTM with a hyperparameter tuning process. The LICRSA-based hyperparameter tuning is done according to the accuracy for improving the classification process. The Lévy flight and interactive crossover are used for searching the local solutions and improving the searching ability to achieve the optimal set of hyperparameters. On the other hand, the utilization of past and upcoming data in BILSTM further enhances the classification. The issue related to overfitting is avoided by using FDA-based augmentation. Therefore, the combination of BILSTM and the LICRSA achieves better classification of eye movements. The outcomes of the BILSTM–LICRSA show that it outperforms the gazeNet, HMC, and MSIEA. The F1-score of BILSTM–LICRSA for the GazeBaseR dataset is 98.99%, which is superior to that of the MSIEA. In future, different ways of feature aggregation can be studied to enhance the performance of the proposed eye movement event classification.
Data availability statement
The original contributions presented in the study are included in the article/Supplementary Material; further inquiries can be directed to the corresponding author.
Author contributions
VP: conceptualization, data curation, formal analysis, investigation, validation, visualization, writing–original draft, and writing–review and editing. AJ: data curation, investigation, methodology, resources, validation, writing–original draft, and writing–review and editing. SA: funding acquisition, investigation, methodology, project administration, and writing–review and editing. MA: conceptualization, investigation, methodology, project administration, resources, supervision, validation, visualization, and writing–review and editing.
Funding
The author(s) declare that financial support was received for the research, authorship, and/or publication of this article. This project is funded by King Saud University, Riyadh, Saudi Arabia. Researchers Supporting Project number (RSP2024R167), King Saud University, Riyadh, Saudi Arabia.
Conflict of interest
The authors declare that the research was conducted in the absence of any commercial or financial relationships that could be construed as a potential conflict of interest.
Publisher’s note
All claims expressed in this article are solely those of the authors and do not necessarily represent those of their affiliated organizations, or those of the publisher, the editors, and the reviewers. Any product that may be evaluated in this article, or claim that may be made by its manufacturer, is not guaranteed or endorsed by the publisher.
References
Ali F., Ali A., Imran M., Naqvi R. A., Siddiqi M. H., Kwak K. S. (2021). Traffic accident detection and condition analysis based on social networking data. Accid. Anal. Prev. 151, 105973. doi:10.1016/j.aap.2021.105973
Aunsri N., Rattarom S. (2022). Novel eye-based features for head pose-free gaze estimation with web camera: new model and low-cost device. Ain Shams Eng. J. 13 (5), 101731. doi:10.1016/j.asej.2022.101731
Barz M., Sonntag D. (2021). Automatic visual attention detection for mobile eye tracking using pre-trained computer vision models and human gaze. Sensors 21, 4143. doi:10.3390/s21124143
Bitkina O. V., Park J., Kim H. K. (2021). The ability of eye-tracking metrics to classify and predict the perceived driving workload. Int. J. Ind. Ergon. 86, 103193. doi:10.1016/j.ergon.2021.103193
Dabare R., Wong K. W., Shiratuddin M. F., Koutsakis P. (2022). A fuzzy data augmentation technique to improve regularisation. Int. J. Intell. Syst. 37 (8), 4561–4585. doi:10.1002/int.22731
Dahmani M., Chowdhury M. E. H., Khandakar A., Rahman T., Al-Jayyousi K., Hefny A., et al. (2020). An intelligent and low-cost eye-tracking system for motorized wheelchair control. Sensors 20, 3936. doi:10.3390/s20143936
David-John B., Hosfelt D., Butler K., Jain E. (2021). A privacy-preserving approach to streaming eye-tracking data. IEEE Trans. Vis. Comput. Graph. 27 (5), 2555–2565. doi:10.1109/TVCG.2021.3067787
Elmadjian C., Gonzales C., Costa R. L. d., Morimoto C. H. (2023). Online eye-movement classification with temporal convolutional networks. Behav. Res. Methods 55 (7), 3602–3620. doi:10.3758/s13428-022-01978-2
Friedman L., Prokopenko V., Djanian S., Katrychuk D., Komogortsev O. V. (2023). Factors affecting inter-rater agreement in human classification of eye movements: a comparison of three datasets. Behav. Res. Methods 55 (1), 417–427. doi:10.3758/s13428-021-01782-4
Harezlak K., Augustyn D. R., Kasprowski P. (2019). An analysis of entropy-based eye movement events detection. Entropy 21, 107. doi:10.3390/e21020107
Harezlak K., Kasprowski P. (2020). Application of time-scale decomposition of entropy for eye movement analysis. Entropy 22, 168. doi:10.3390/e22020168
Holmqvist K., Örbom S. L., Hooge I. T., Niehorster D. C., Alexander R. G., Andersson R., et al. (2023). Eye tracking: empirical foundations for a minimal reporting guideline. Behav. Res. Methods 55 (1), 364–416. doi:10.3758/s13428-021-01762-8
Huang L., Wang Y., Guo Y., Hu G. (2022). An improved reptile search algorithm based on Lévy flight and interactive crossover strategy to engineering application. Mathematics 10, 2329. doi:10.3390/math10132329
Kanade P., David F., Kanade S. (2021). Convolutional neural networks (CNN) based eye-gaze tracking system using machine learning algorithm. Eur. J. Electr. Eng. Comput. Sci. 5 (2), 36–40. doi:10.24018/ejece.2021.5.2.314
Koochaki F., Najafizadeh L. (2021). A data-driven framework for intention prediction via eye movement with applications to assistive systems. IEEE Trans. Neural Syst. Rehabil. Eng. 29, 974–984. doi:10.1109/TNSRE.2021.3083815
Larsson L., Nyström M., Stridh M. (2013). Detection of saccades and postsaccadic oscillations in the presence of smooth pursuit. IEEE Trans. Biomed. Eng. 60 (9), 2484–2493. doi:10.1109/TBME.2013.2258918
Li J., Li H., Umer W., Wang H., Xing X., Zhao S., et al. (2020). Identification and classification of construction equipment operators' mental fatigue using wearable eye-tracking technology. Autom. Constr. 109, 103000. doi:10.1016/j.autcon.2019.103000
Li X. S., Fan Z. Z., Ren Y. Y., Zheng X. L., Yang R. (2021). Classification of eye movement and its application in driving based on a refined pre-processing and machine learning algorithm. IEEE Access 9, 136164–136181. doi:10.1109/ACCESS.2021.3115961
Lim J. Z., Mountstephens J., Teo J. (2022). Eye-tracking feature extraction for biometric machine learning. Front. Neurorobotics 15, 796895. doi:10.3389/fnbot.2021.796895
Mao Y., He Y., Liu L., Chen X. (2020). Disease classification based on synthesis of multiple long short-term memory classifiers corresponding to eye movement features. IEEE Access 8, 151624–151633. doi:10.1109/ACCESS.2020.3017680
Mateen M., Wen J., Song S., Huang Z. (2019). Fundus image classification using VGG-19 architecture with PCA and SVD. Symmetry 11, 1. doi:10.3390/sym11010001
Rahman H., Ahmed M. U., Barua S., Funk P., Begum S. (2021). Vision-based driver’s cognitive load classification considering eye movement using machine learning and deep learning. Sensors 21, 8019. doi:10.3390/s21238019
Shankar K., Zhang Y., Liu Y., Wu L., Chen C. H. (2020). Hyperparameter tuning deep learning for diabetic retinopathy fundus image classification. IEEE Access 8, 118164–118173. doi:10.1109/ACCESS.2020.3005152
Sugano Y., Matsushita Y., Sato Y. (2014). “Learning-by-synthesis for appearance-based 3D gaze estimation,” in Proceedings of the IEEE Conference on Computer Vision and Pattern Recognition, Columbus, OH, USA, June 23 2014 to June 28 2014, 1821–1828.
Vortmann L. M., Putze F. (2021). Combining implicit and explicit feature extraction for eye tracking: attention classification using a heterogeneous input. Sensors 21 (24), 8205. doi:10.3390/s21248205
Yang M., Cai C., Hu B. (2023). Clustering based on eye tracking data for depression recognition. IEEE Trans. Cogn. Dev. Syst. 15 (4), 1754–1764. doi:10.1109/TCDS.2022.3223128
Yoo S., Jeong S., Jang Y. (2021). Gaze behavior effect on gaze data visualization at different abstraction levels. Sensors 21 (4), 4686. doi:10.3390/s21144686
Yuan G., Wang Y., Peng J., Fu X. (2021). A novel driving behavior learning and visualization method with natural gaze prediction. IEEE Access 9, 18560–18568. doi:10.1109/ACCESS.2021.3054951
Keywords: accuracy, bidirectional long short-term memory, eye movement event classification, fuzzy data augmentation, F1-score, Lévy flight and interactive crossover, reptile search algorithm
Citation: Pradeep V, Jayachandra AB, Askar SS and Abouhawwash M (2024) Hyperparameter tuning using Lévy flight and interactive crossover-based reptile search algorithm for eye movement event classification. Front. Physiol. 15:1366910. doi: 10.3389/fphys.2024.1366910
Received: 07 January 2024; Accepted: 10 April 2024;
Published: 15 May 2024.
Edited by:
Xing Lu, University of California, San Diego, United StatesCopyright © 2024 Pradeep, Jayachandra, Askar and Abouhawwash. This is an open-access article distributed under the terms of the Creative Commons Attribution License (CC BY). The use, distribution or reproduction in other forums is permitted, provided the original author(s) and the copyright owner(s) are credited and that the original publication in this journal is cited, in accordance with accepted academic practice. No use, distribution or reproduction is permitted which does not comply with these terms.
*Correspondence: Mohamed Abouhawwash, c2FsZWgxMjg0QG1hbnMuZWR1LmVn, YWJvdWhhd3dAbXN1LmVkdQ==