 Haixia Yin
 Deshan Zhao
- Department of Nuclear Medicine, The Second Hospital of Shanxi Medical University, Taiyuan, China
Objective: This study aimed to investigate the application value of the renal region of interest (ROI) corrected by computed tomography (CT) in single-kidney glomerular filtration rate (GFR) in patients with hydronephrosis.
Methods: A total of 46 patients with hydronephrosis were divided into four groups based on their degree of unilateral hydronephrosis: a normal group (left kidney and right kidney) and three abnormal groups (mild, moderate, and severe hydronephrosis). GFR was measured using the two-sample method (tGFR). The single-kidney GFR of each patient was derived from differential renal function values in dynamic renal imaging multiplied by GFR. The single-kidney GFRs, including GFR from the Gates method (gGFRsingle) and CT area-corrected GFR (aGFRsingle), were compared with tGFRsingle. A paired-sample t-test and Pearson’s test were used for data analysis. p < 0.05 was considered statistically significant.
Results: There were no significant differences between aGFRsingle and tGFRsingle in patients in the normal, mild hydronephrosis, and moderate hydronephrosis groups (t = –0.604∼1.982, all p > 0.05), but there was a significant difference between them in the severe hydronephrosis group (t = 2.302, p < 0.05). There were no significant differences between gGFRsingle and tGFRsingle in the normal and mild hydronephrosis groups (t = 0.194∼0.962, all p > 0.05), but there was a significant difference between them in the moderate and severe hydronephrosis groups (t = 3.321, 3.494, p < 0.05). Both gGFRsingle and aGFRsingle were correlated with tGFRsingle, with aGFRsingle being more strongly correlated (r = 0.890, p < 0.001).
Conclusion: In patients with moderate hydronephrosis, aGFRsingle is more strongly correlated with tGFRsingle than gGFRsingle. However, in patients with severe hydronephrosis and accompanying renal morphological changes, the aGFRsingle measured by the renal ROI area-correction method using CT has higher accuracy and better clinical application value than the conventional gGFRsingle.
1 Introduction
Hydronephrosis is a common disease of the urinary system that is most commonly found in upper urinary tract obstructions (Klahr and Morrissey, 2002). Tc-99m-labeled diethylenetriamine pentaacetic acid (Tc-99m DTPA) dynamic renal imaging, which has been promoted as an effective method for evaluating renal function (Klahr and Morrissey, 2002), not only identifies simple renal pelvis dilatation and mechanical obstruction but also quantitatively analyzes renal function, especially separate renal function. The method introduced by Gates is commonly used in routine clinical settings; this method requires that the region of interest (ROI) of the kidney be delineated by the boundary of the kidney’s external shadow or the expansion of one or two pixels. If the kidney itself, or other external factors, lead to inaccurate delineation, the glomerular filtration rate (GFR) deviates from its true value. Due to the abnormal expansion of the renal pelvis and/or renal calyces in patients with moderate to severe hydronephrosis, the morphology of the involved kidney changes: the thickness of the cortex is thinner than that of a normal kidney, and renographic findings show a radioactive defect or slightly higher radioactivity in the involved kidney than in the background area. In this case, the delineation of renal ROI is prone to deviation. Several other factors that can disturb GFR values can also be measured using the Gates method. Furthermore, some studies have shown that renal depth correction using integrated computed tomography (CT) may have great significance for the accuracy of GFR determination except in the cases of moderate or severe hydronephrosis.
The two-sample method is considered to be accurate in the determination of GFR and serves as the standard method in the present study. The aim of this study is to compare the accuracy of the two-sample method with that of two different methods for the evaluation of single-kidney GFR (GFRsingle)—the Gates GFRsingle (gGFRsingle) and CT area-correction GFRsingle (aGFRsingle)—to identify which method is more accurate in the evaluation of GFRsingle in patients with moderate or severe hydronephrosis.
2 Materials and Methods
2.1 Patients
A prospective study was conducted to analyze patients with hydronephrosis diagnosed by ultrasound. All patients underwent diuretic renography and integrated CT scans within 1 year. The study included 46 patients (20 male and 26 female), with an average age of 45.67 ± 13.52 years. There were 32 cases of unilateral hydronephrosis and 14 cases of bilateral hydronephrosis, with a total of 92 kidneys (32 normal kidneys and 60 kidneys with hydronephrosis).
Inclusion criteria: 1) the presence of unilateral or bilateral hydronephrosis and a referral for both Tc-99m DTPA dynamic imaging and renal homologous by a clinician or ultrasound physician; 2) GFR was calculated using the double-plasma method; 3) no contraindications to the administration of Tc-99m DTPA.
Exclusion criteria: 1) surgical history involving the urinary system, such as renal transplantation or drainage of hydronephrosis; 2) significant anomaly of the urinary system, including horseshoe kidney, solitary kidney, polycystic kidney, and renal tumors; 3) other risk factors, such as hypertension, severe cardiac insufficiency, or diabetes.
Written informed consent was obtained from all participants, and the study was conducted in accordance with the principles of the Helsinki Declaration.
2.2 Grouping
The enrolled patients were divided into two groups (normal and abnormal) according to the degree of unilateral hydronephrosis identified by CT. The severity of hydronephrosis was then determined according to CT imaging. Mild renal hydronephrosis was characterized by the renal parenchyma thickness not changing significantly; moderate hydronephrosis was identified by obvious renal calyceal hydronephrosis and dilatation, the disappearance of the cup mouth, an increase in renal volume, and part of the renal parenchyma becoming thinner; severe renal hydronephrosis was characterized by an enlarged renal outline, renal sinus area cystic dilatation and hydronephrosis, and a thinned or nearly atrophied renal parenchyma.
The normal kidney group consisted of 32 kidneys, including 19 left kidneys and 13 right kidneys. The abnormal kidney group consisted of 60 kidneys, including 28 left kidneys and 32 right kidneys. The abnormal group was further divided into three groups: a mild hydronephrosis group, a moderate hydronephrosis group, and a severe hydronephrosis group.
2.3 Diuretic Dynamic Renal Imaging
In all patients, 185MBq Tc-99m DTPA (Atom High-Tech Co. Ltd., Beijing, China), with a volume less than 1 ml and a radiochemical purity greater than 95%, was administered via bolus injection into the cubital vein. All patients were hydrated with 5–7 ml/kg of water 30 min before the renal scan and their bladders were emptied. The procedure was carried out using routine Tc-99m DTPA dynamic renal imaging with a dual-head gamma camera (SPECT, Discovery NM/CT 670; General Electric Company, New York, United States). With the patient in a supine position, the dynamic acquisition was performed using a gamma camera equipped with a high-resolution, low-energy collimator at the same time as a bolus intravenous injection of Tc-99m DTPA was administered into the patient’s forearm. Regions of the kidneys and bladder were placed in the center view of the gamma camera. Data were collected at 2-second intervals for 1 min and at 30-second intervals for 30 min, and 40 mg furosemide was administered intravenously at 20 min of image acquisition. After dynamic renal imaging was complete, integrated CT with 16 rows in a hybrid SPECT/CT was used to perform a low-dose scan (100 mA, 90 kV) on the bilateral renal areas, with the patient remaining in a supine position. Images with 5-mm thick transverse sections at 5-mm intervals were used for analysis.
2.4 Unilateral Renal Glomerular Filtration Rate Measurement
2.4.1 Two-Sample Method
The International Scientific Committee of Radionuclides in Nephrourology recommended the two-sample method as a reference standard for the evaluation of GFR in clinical research (Maioli et al., 2020) with the two samples being taken from the vein in the patient’s forearm at 120 and 240 min, respectively, being found to be the most accurate. In the present study, two 5-ml blood samples were drawn at 120 and 240 min from the opposite forearm to the one in which the Tc-99m DTPA injection was administered. In accordance with the procedure for blood sampling, each sample was processed immediately after withdrawal.
The filtration counts of the two blood samples were tested and recorded on the basis of the procedure for ultrafiltration. The two-sample GFR (tGFR) of each patient was obtained from the data using the equation of the two-sample method, before being standardized using the patient’s body surface area. The tGFR was considered the standard GFR value for the patients in this study. The single-kidney tGFR (tGFRsingle) was calculated based on the differential renal function of two kidneys obtained by routine diuretic dynamic renal imaging.
2.4.2 The Gates Method
Imaging data during the 2–3 min after radiotracer injection were used to calculate the GFR using the dedicated data-processing workstation linked to the gamma camera. The ROIs of the kidneys, backgrounds, and aorta were drawn by manual operation. After entering the patient’s weight and height, the gGFRsingle was automatically calculated using the Gates algorithm.
2.4.3 Renal Region of Interest Area Correction by Computed Tomography
The ROIs of the kidneys were delineated layer by layer on CT coronal sectional images. After all unilateral renal ROIs were superimposed, the maximum ROI area of the kidney was redrawn and used as the renal ROI area from CT. According to the maximum renal ROI area and its contour from CT, bilateral renal ROIs were delineated on the renal images. The aGFRsingle was then determined using the Gates method (Figure 1).
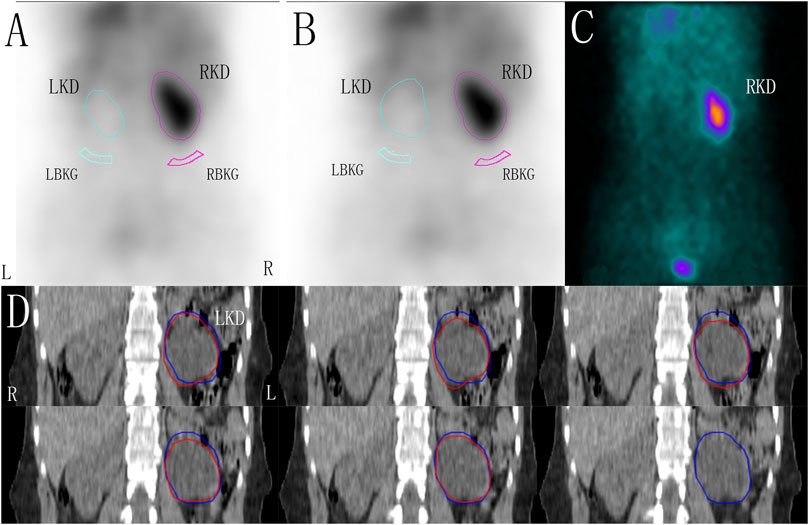
FIGURE 1. The renal region of interest (ROI) was corrected by computer tomography (CT) in a patient with left hydronephrosis, zoom: 1.5. (A) ROI of the kidneys and the background drawn using the Gates method. (B) Based on the maximum renal ROI area corrected by CT, the ROI of the kidneys and the backgrounds was drawn using the Gates method. (C) One-minute frames: shows the frame-per-minute image overlaid by the kidneys, cortex, background, and bladder. (D) ROIs of the left kidney were delineated layer by layer on CT coronal sectional images (red line), and the maximum ROI area of the kidney were redrawn and used as the renal ROI area from CT (blue line). LKD, left kidney; RKD, right kidney; LBKG, left background; RBKG, right background.
2.5 Statistical Analysis
Data were expressed as the mean ± standard deviation (SD). The GFRsingle measurements obtained using the three methods were compared. Paired-sample t-tests and Pearson’s correlation analysis were used for statistical analysis. p < 0.05 was considered statistically significant.
3 Results
A total of 46 patients with 92 kidneys were included in this study. The gGFRsingle, aGFRsingle, and tGFRsingle were normally distributed according to the results of the Shapiro–Wilk normality test.
3.1 Paired-Sample T-Test
There were no significant differences between aGFRsingle and tGFRsingle in patients in the normal, mild hydronephrosis, and moderate hydronephrosis groups (t = 0.653, 0.058, −0.604, −0.096, 1.982, all p > 0.05). In patients with severe hydronephrosis, however, the difference between aGFRsingle and tGFRsingle was statistically significant (t = 2.302, p < 0.05) (Figure 2; Table 1).
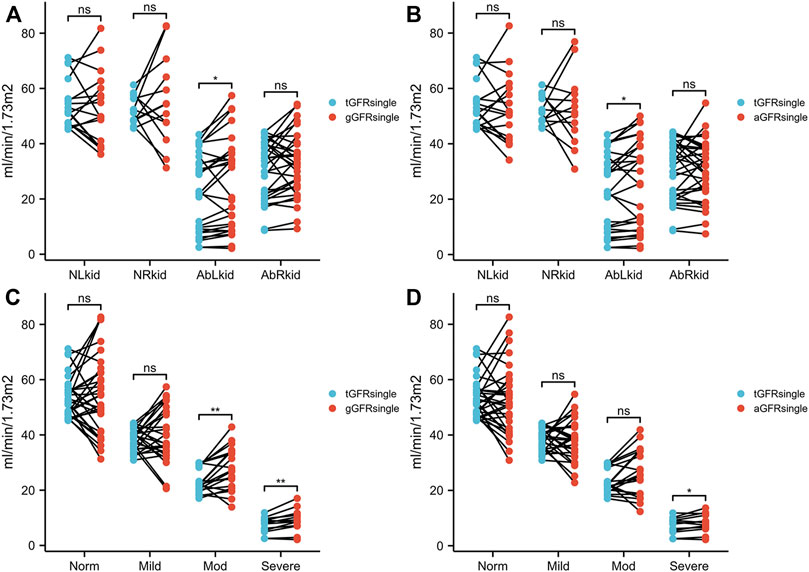
FIGURE 2. Comparison between gGFRsingle and tGFRsingle (A, C) and between aGFRsingle and tGFRsingle (B, D) in patients with hydronephrosis. NLkid, normal left kidney; NRkid, normal right kidney; AbLkid, abnormal left kidney; AbRkid, abnormal right kidney; Norm, normal; Mod, moderate; GFR, glomerular filtration rate; gGFRsingle, single GFR measured using the Gates method; aGFRsingle, single GFR measured by the renal region of interest area correction by CT method; tGFRsingle, single GFR, total GFR measured by the two-sample method multiplied by the differential renal function. p < 0.05 was considered statistically significant. ns, p ≥ 0.05, *p < 0.05, **p < 0.01.
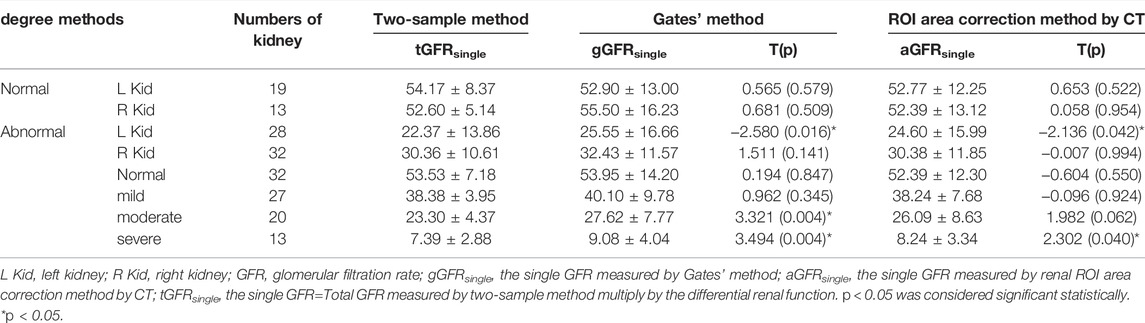
TABLE 1. Glomerular filtration rate (GFR) measured by three methods in the patients with hydronephrosis.
There were no significant differences between gGFRsingle and tGFRsingle in patients in the normal and mild hydronephrosis groups (t = 0.565, 0.681, 0.194, 0.962, all p > 0.05). In patients with moderate or severe hydronephrosis, however, the differences between gGFRsingle and tGFRsingle were statistically significant (t = 3.321, 3.494, p < 0.05) (Figure 2; Table 1).
3.2 The Correlation Between aGFRsingle, gGFRsingle, and tGFRsingle
A good correlation (p < 0.001) was identified between aGFRsingle and tGFRsingle and between gGFRsingle and tGFRsingle, with the former having the stronger correlation. The correlation coefficient between aGFRsingle and tGFRsingle was 0.890 (p < 0.001) (Figure 3).
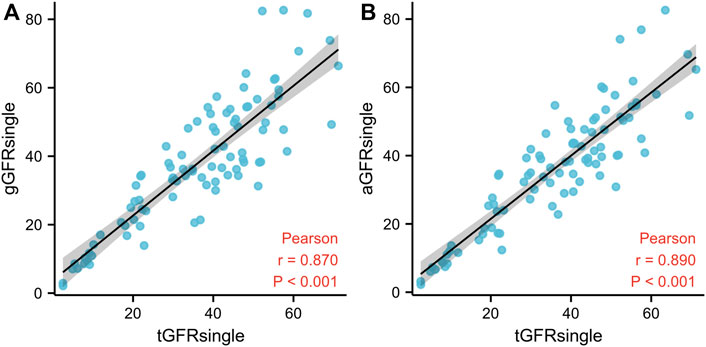
FIGURE 3. The relationship between gGFRsingle and tGFRsingle (A) and between aGFRsingle and tGFRsingle (B) in patients with hydronephrosis. The solid line represents linear correlation. GFR, glomerular filtration rate; gGFRsingle, single GFR measured using the Gates method; aGFRsingle, single GFR measured by the renal region of interest area correction by CT method; tGFRsingle, the single GFR, total GFR measured by the two-sample method multiplied by the differential renal function.
4 Discussion
Hydronephrosis refers to the retention of urine in the dilated pelvis and calyces caused by obstruction, causing an increase in hydrostatic pressure and resulting in increased glomerular pressure and renal cortex atrophy, which ultimately diminishes GFR (Blaufox et al., 1996). Note that GFR is an objective index reflecting glomerular filtration function (Thotakura and Anjum, 2021) and is used as the main basis for assessing renal function (Stevens and Levey, 2009; Berg, 2006). It can be used to explain any abnormalities in the signs and symptoms of patients, as well as in the laboratory examination results of renal diseases (Thomas and Huber, 2006). It is of great significance for the diagnosis, the evaluation of the severity, development, and prognosis, and the selection of treatment options in renal diseases.
Using the two-sample method to measure GFR has been found to have better accuracy and higher clinical application value; however, it cannot identify the separate renal functions. Due to its good repeatability and relatively high accuracy, GFR measured by the Gates method is recommended for the clinical evaluation of total and separate renal function (Levey et al., 2020), but it is susceptible to many factors (Levey et al., 2007; Li et al., 2016). It also lacks accuracy in the GFR measurement of patients with severe hydronephrosis, so it is more suitable for patients with mild to moderate hydronephrosis. The results of the present study indicate that the Gates method is suitable for patients with normal kidneys or mild hydronephrosis.
The precise delineation of renal ROI determines the accuracy of GFR (Wei et al., 2020). Because of the increased hydrostatic pressure of the dilated renal pelvis and calycles in patients with moderate to severe hydronephrosis, the involved renal cortexes became thinner or even disappeared, and their clearance rate decreased. Initially, the distribution of the radiopharmaceutical was significantly reduced and/or defective in the involved renal cortexes in dynamic renal imaging, and the involved kidney in the following images was gradually seen or not clearly seen initially. At this point, errors in the renal ROI delineation were caused by the obscure border of the kidney during the 2–3 min after radiotracer injection, affecting the accuracy of GFR measurement. In addition, when identifying the involved renal ROI in patients with moderate and severe hydronephrosis, the boundary between the dilated collecting system and renal parenchyma was often unclear, which may have led to incorrect renal ROIs and false GFR values.
Troell et al. (Ma et al., 2019) found that the renal parenchyma area, which can be calculated by ultrasound, is highly correlated with GFR. Therefore, the method of drawing the renal ROI layer by layer on CT images and drawing the bilateral renal ROI on dynamic renal imaging according to the size and outline of the kidneys can outline ROIs more accurately, thereby ensuring they are not too large or too small. Due to the abnormal increase of involved renal size in patients with moderate to severe hydronephrosis, however, bilateral kidneys may overlap with the liver and the spleen, which are then easily included in the involved renal ROI delineated using the Gates method and can increase the radioactive counts of the kidneys, leading to an overestimation of GFR values. The present study found that the aGFRsingle of the normal right kidney was closer to tGFR than to gGFR. However, this difference was not found in the normal left kidney, which might be related to the fact that the right kidney is closer to the liver. When the right renal ROI was drawn using the Gates method, the delineated ROI was affected by the liver. In the abnormal groups, there were no significant differences between the GFRsingle measured by the Gates method or the renal ROI area correction by CT and tGFRsingle in the right kidney, whereas the opposite was true in the left kidney, which may be due to the fact that only 2 of the 32 abnormal right kidneys had severe hydronephrosis, compared with 11 of the 28 left kidneys. Due to the abnormal increase in the left kidney’s renal size in patients with severe hydronephrosis, its position was higher than that of a normal left kidney. When left renal ROIs were drawn using the Gates method, the delineated ROI often overlapped with the spleen and was therefore affected by it. In these cases, the aGFRsingle was closer to the tGFRsingle than the gGFRsingle.
Kidney depth is also an important factor affecting the measurement of GFR in the Gates method (Troell et al., 1984). It affects the vertical distance between the kidneys and the back surface of the body, resulting in a difference in γ-ray attenuation through soft tissue and affecting the net count rate of the two kidneys, thereby affecting the accuracy of gGFR. There are several methods by which renal depth can be measured, including ultrasound, CT (Gates, 1982), and lateral Tc-99m DTPA scintigraphy. Renal depth correction by CT is more accurate than by ultrasound. However, some studies have suggested that, while the correction of renal depth improves the accuracy of GFR measurement for patients in stages 1–2 kidney disease according to the Kidney Disease Outcomes Quality Initiative Guidelines, GFR measurement has low accuracy for patients in stages 3–5, and renal depth correction does not improve it. Therefore, the influence of renal depth on GFR measurement requires further study.
The present study had some limitations. Due to the small number of cases, there may be some bias in the statistical results, which can reduce the accuracy of the conclusions; therefore, it is necessary to increase the number of cases in subsequent research. Furthermore, the renal ROI delineated on the coronal plane of the CT images could not be automatically copied and pasted to the renal dynamic images, which limited the application of this method; therefore, the research and development of the image processing program are vital to promoting this technical method.
5 Conclusion
The GFR values of the patients with normal kidneys and most patients with mild hydronephrosis can be measured using the Gates method, and the involved renal ROI in this method does not need to be corrected. However, in patients with severe hydronephrosis, the conventional delineation of the involved renal ROI is prone to correction, and the patients’ therapeutic regimen needs a more accurate evaluation of the involved renal function and changes in kidney morphology. The ROI area correction using CT can obtain more accurate GFR values and can more accurately meet clinical needs. Therefore, if necessary, integrated CT scans should be used to correct the involved renal ROI for GFR measurement in patients with severe hydronephrosis, and this can be used as an effective supplementary or auxiliary diagnostic method in place of the Gates method (Inoue et al., 2016).
Data Availability Statement
The original contributions presented in the study are included in the article/Supplementary Material, further inquiries can be directed to the corresponding author.
Ethics Statement
The studies involving human participants were reviewed and approved by the Ethics Committee of The Second Hospital of Shanxi Medical University (2015KY007). The patients/participants provided their written informed consent to participate in this study.
Author Contributions
Conception and design of the research: DZ and HY. Acquisition of data: WL and HY. Analysis and interpretation of the data: HY. Statistical analysis: HY. Writing of the manuscript: HY. Critical revision of the manuscript for intellectual content: DZ and HY. All authors read and approved the final draft.
Conflict of Interest
The authors declare that the research was conducted in the absence of any commercial or financial relationships that could be construed as a potential conflict of interest.
Publisher’s Note
All claims expressed in this article are solely those of the authors and do not necessarily represent those of their affiliated organizations, or those of the publisher, the editors, and the reviewers. Any product that may be evaluated in this article, or claim that may be made by its manufacturer, is not guaranteed or endorsed by the publisher.
Acknowledgments
We would like to acknowledge the hard and dedicated work of all the staff that implemented the intervention and evaluation components of the study.
References
Berg U. B. (2006). Differences in Decline in GFR with Age between Males and Females. Reference Data on Clearances of Inulin and PAH in Potential Kidney Donors. Nephrol. Dial. Transpl. 21 (9), 2577–2582. doi:10.1093/ndt/gfl227
Blaufox M. D., Aurell M., Bubeck B., Fommei E., Piepsz A., Russell C., et al. (1996). Report of the Radionuclides in Nephrourology Committee on Renal Clearance. J. Nucl. Med. 37 (11), 1883–1890.
Gates G. (1982). Glomerular Filtration Rate: Estimation from Fractional Renal Accumulation of 99mTc-DTPA (Stannous). Am. J. Roentgenology 138 (3), 565–570. doi:10.2214/ajr.138.3.565
Inoue Y., Itoh H., Tagami H., Miyatake H., Asano Y. (2016). Measurement of Renal Depth in Dynamic Renal Scintigraphy Using Ultralow-Dose CT. Clin. Nucl. Med. 41 (6), 434–441. doi:10.1097/RLU.0000000000001146
Klahr S., Morrissey J. (2002). Obstructive Nephropathy and Renal Fibrosis. Am. J. Physiology-Renal PhysiologyRenal Physiol. 283 (5), F861–F875. doi:10.1152/ajprenal.00362.2001
Levey A. S., Coresh J., Greene T., Marsh J., Stevens L. A., Kusek J. W., et al. (2007). Expressing the Modification of Diet in Renal Disease Study Equation for Estimating Glomerular Filtration Rate with Standardized Serum Creatinine Values. Clin. Chem. 53 (4), 766–772. doi:10.1373/clinchem.2006.077180
Levey A. S., Titan S. M., Powe N. R., Coresh J., Inker L. A. (2020). Kidney Disease, Race, and GFR Estimation. Cjasn 15 (8), 1203–1212. doi:10.2215/CJN.12791019
Li L., Hongwei S., Ying Q., Jianzhong L., Zhifang W., Ling G., et al. (2016). Influence of Weight-Age Normalization on Glomerular Filtration Rate Values of Renal Patients. Medicine (Baltimore) 95 (3), e2492. doi:10.1097/MD.0000000000002492
Ma G., Shao M., Xu B., Tian J., Chen Y. (2019). Glomerular Filtration Rate Measured by 99mTc-DTPA Gates Method Is Not Significantly Affected by the Premature or Delayed Initiation of Image Acquisition. Quant. Imaging Med. Surg. 9 (6), 1103–1109. doi:10.21037/qims.2019.06.14
Maioli C., Mangano M., Conte F., Del Sole A., Tagliabue L., Alberici F., et al. (2020). The Ideal Marker for Measuring GFR: what Are We Looking for? Acta bio-medica : Atenei Parmensis. 91 (4), e2020132. doi:10.23750/abm.v91i4.9304
Stevens L. A., Levey A. S. (2009). Measured GFR as a Confirmatory Test for Estimated GFR. Jasn 20, 2305–2313. doi:10.1681/ASN.2009020171
Thomas L., Huber A. R. (2006). Renal Function - Estimation of Glomerular Filtration Rate. Clin. Chem. Lab. Med. 44 (11), 1295–1302. doi:10.1515/CCLM.2006.239
Thotakura R., Anjum F. (20212820). “Hydronephrosis and Hydroureter,” in StatPearls (Treasure Island, FL: StatPearls Publishing). PMID: 33085364.
Troell S., Berg U., Johansson B., Wikstad I. (1984). Ultrasonographic Renal Parenchymal Volume Related to Kidney Function and Renal Parenchymal Area in Children with Recurrent Urinary Tract Infections and Asymptomatic Bacteriuria. Acta Radiologica. Diagn. 25 (5), 411–416. doi:10.1177/028418518402500512
Wei Y., Liu Y., Li Q., Zhang Y., Wang Q., Yang Y., et al. (2020). Establishment of normal Reference Ranges for Total and Separate Glomerular Filtration Rates in Living Kidney Donors by Gates' Method after Renal Depth Measured Using Single-Photon Emission Computed Tomography/computed Tomography. Quant Imaging Med. Surg. 10 (12), 2297–2306. doi:10.21037/qims-19-772
Keywords: glomerular filtration rate, hydronephrosis, dynamic renal scintigraphy, computed tomography, renal region of interest
Citation: Yin H, Liang W and Zhao D (2022) The Application Value of the Renal Region of Interest Corrected by Computed Tomography in Single-Kidney Glomerular Filtration Rate for the Evaluation of Patients With Moderate or Severe Hydronephrosis. Front. Physiol. 13:861895. doi: 10.3389/fphys.2022.861895
Received: 04 February 2022; Accepted: 31 March 2022;
Published: 09 May 2022.
Edited by:
John D. Imig, Medical College of Wisconsin, United StatesReviewed by:
Xiaoli Lan, Huazhong University of Science and Technology, ChinaMuhammet İrfan Dönmez, Istanbul University, Turkey
Copyright © 2022 Yin, Liang and Zhao. This is an open-access article distributed under the terms of the Creative Commons Attribution License (CC BY). The use, distribution or reproduction in other forums is permitted, provided the original author(s) and the copyright owner(s) are credited and that the original publication in this journal is cited, in accordance with accepted academic practice. No use, distribution or reproduction is permitted which does not comply with these terms.
*Correspondence: Deshan Zhao, emhhb2Rlc2hhbnpkc3FAMTI2LmNvbQ==