 Haruno Arai1,2Akira Inaba1,2Shojiro Ikezaki1Mika Kumakami-Sakano1Marii Azumane1,3
 Hayato Ohshima4Kazumasa Morikawa2
 Hidemitsu Harada1*
 Keishi Otsu1*
- 1Division of Developmental Biology and Regenerative Medicine, Department of Anatomy, Iwate Medical University, Yahaba, Japan
- 2Division of Pediatric and Special Care Dentistry, Department of Oral Health Science, School of Dentistry, Iwate Medical University, Morioka, Japan
- 3Division of Oral and Maxillofacial Surgery, Department of Reconstructive Oral and Maxillofacial Surgery, Iwate Medical University, Morioka, Japan
- 4Division of Anatomy and Cell Biology of the Hard Tissue, Department of Tissue Regeneration and Reconstruction, Niigata University Graduate School of Medical and Dental Sciences, Niigata, Japan
Maturation stage ameloblasts (M-ABs) are responsible for terminal enamel mineralization in teeth and undergo characteristic cyclic changes in both morphology and function between ruffle-ended ameloblasts (RA) and smooth-ended ameloblasts (SA). Energy metabolism has recently emerged as a potential regulator of cell differentiation and fate decisions; however, its implication in M-ABs remains unclear. To elucidate the relationship between M-ABs and energy metabolism, we examined the expression pattern of energy metabolic enzymes in M-ABs of mouse incisors. Further, using the HAT7 cell line with M-AB characteristics, we designed experiments to induce an energy metabolic shift by changes in oxygen concentration. We revealed that RA preferentially utilizes oxidative phosphorylation, whereas SA depends on glycolysis-dominant energy metabolism in mouse incisors. In HAT7 cells, hypoxia induced an energy metabolic shift toward a more glycolytic-dominant state, and the energy metabolic shift reduced alkaline phosphatase (ALP) activity and calcium transport and deposition with a change in calcium-related gene expression, implying a phenotype shift from RA to SA. Taken together, these results indicate that the energy metabolic state is an important determinant of the RA/SA phenotype in M-ABs. This study sheds light on the biological significance of energy metabolism in governing M-ABs, providing a novel molecular basis for understanding enamel mineralization and elucidating the pathogenesis of enamel hypomineralization.
Introduction
Enamel is the most highly mineralized tissue in the vertebrate body and is composed of substituted hydroxyapatite, primarily calcium and inorganic phosphate. Ameloblasts, which are responsible for enamel formation, are oral epithelial cells of ectodermal origin. The proliferating inner enamel epithelium (IEEs) differentiates into secretory stage ameloblasts (S-AMs), and they differentiate into maturation stage ameloblasts (M-ABs) through transition stage ameloblasts (T-ABs) (Figures 1A–E). S-AMs secrete enamel matrix proteins, which form the base of enamel and contribute to the initial calcification, while M-ABs modulate enamel mineralization by transporting minerals, controlling pH, and modulating protein degradation and absorption (Nanci, 2008; Bartlett, 2013).
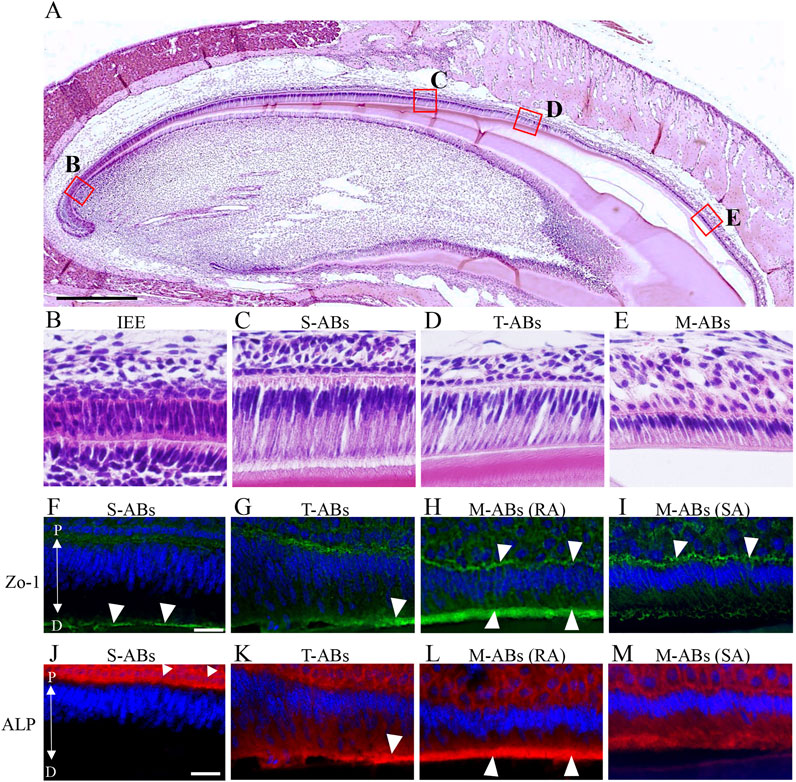
FIGURE 1. Differential expression of Zo-1 and ALP during amelogenesis in the maxillary incisor. (A) Low magnification image of H&E-stained sections of mouse maxillary incisors. The boxed areas in (A) are magnified in (B–E). (B) Inner enamel epithelium cells. (C) Secretory stage ameloblasts. (D) Transition stage ameloblasts (E) Maturation stage ameloblasts. (F–I) Zo-1 immunostaining of mouse maxillary incisor ameloblasts. (J–M) ALP staining of mouse maxillary incisor ameloblasts. The nucleus is stained with DAPI (blue). S-ABs, secretory stage ameloblasts; T-ABs, transition stage ameloblasts; M-ABs, maturation stage ameloblasts; RA, ruffle-ended ameloblasts; SA, smooth-ended ameloblasts; P, proximal; D, distal. Scale bars: 500 μm (A); 20 μm (B–M).
During the maturation stage, ameloblasts change their morphology in a unique series of modulations (cyclical changes) between a ruffle-ended (RA) appearance and a smooth-ended (SA) appearance in coordinated groups, appearing as bands of similar morphology (Warshawsky and Smith, 1974; Reith and Boyde, 1981). RA cells are characterized by distinct distal striated or ruffled borders (Reith and Boyde, 1979). In contrast, SA cells exhibit a complete absence of the distal ruffled border (Sasaki et al., 1987). RA has a greater capacity to transport ions into and away from the enamel matrix and to absorb the enamel matrix protein debris. SA with incomplete junctional complexes may engage in the paracellular movement of fluids and ions, which may contribute to the neutralization of pH in the enamel matrix (Lacruz, 2017). SA appear at ∼8.5 h intervals in rat incisors, and these ameloblasts change into RA cells after 2 h, reforming their characteristic features at the distal border (Smith et al., 1987). Thus, cyclic RA-SA modulation is crucial for normal enamel mineralization. However, the regulatory mechanisms and determinants that distinguish RA from SA are not yet understood.
A close relationship between energy metabolism, cellular differentiation, and fate decisions has emerged in recent years. Early embryos are dependent on oxidative phosphorylation (OXPHOS). As developmental stages progress, they utilize the glycolytic system to synthesize ATP, which peaks after implantation and slowly declines as oxidative metabolism is reinitiated by vascularization (Folmes et al., 2012). Human ES and iPS cells differ in their energy metabolism state between the naïve type, which is close to the internal cell mass before implantation, and the primed type, which resembles pluripotency in the epiblast after implantation (Tsogtbaatar et al., 2020). Recently, we reported that, in ameloblasts, slowly dividing dental epithelial stem cells are glycolytic-dominated, while rapidly dividing transient amplifying (TA) cells are OXPHOS-dominated in their energy metabolism (Otsu et al., 2021), indicating the implication of energy metabolism in the cell fate decision of ameloblasts. Based on this, we hypothesized that energy metabolism is involved in RA-SA modulation in M-ABs.
In this study, we explored the change of energy metabolic characteristics in M-ABs immunohistochemically. To elucidate the effect of an energy metabolic shift on M-ABs, we utilized the change of oxygen concentration. We found that RA and SA have distinct characteristics of energy metabolism and that metabolic shift is a potential regulator of RA-SA modulation of M-ABs. Our study proposes a novel perspective on enamel research and attempts to elucidate the pathogenesis of enamel hypomineralization.
Materials and methods
Animals and preparation of tissues
All animal experiments complied with the guidelines of the Ministry of Education, Culture, Sports, Science and Technology, the Ministry of Environment, and the Science Council of Japan, and were carried out in accordance with the Act on Welfare and Management of Animals. The experimental protocol was approved by the Institutional Animal Care and Use Committee (approval no. 01-007). For hematoxylin and eosin (H&E) staining and immunostaining, ddY male mice (Japan SLC) mouse jaws were fixed in 4% paraformaldehyde (PFA) and decalcified using Osteosoft (#101728, Merck, Darmstadt, Germany) and paraffin-embedded thin tissue sections (thickness, 6-7 μm) were used. Kawamoto’s film method was used to detect the activity of alkaline phosphatase (ALP) in mouse incisors (Kawamoto, 2003). Briefly, the jaws were taken from ddYmice, snap-frozen directly, soaked in hexane with dry ice, and embedded in an embedding medium. The samples were sectioned at 10 μm thickness using a cryostat. Sections were moved to a container filled with the appropriate amount of 100% ethanol, fixed with 4% paraformaldehyde (PFA) for 5 min, and washed. The specimens were stained with the ImmPACT Vector Red Alkaline Phosphatase Substrate kit (#SK-5105, Vector, Burlingame, CA, United States) according to the manufacturer’s protocol. For analysis of cytochrome oxidase (CO) activity in ameloblasts using transmission electron microscopy, the animals (30-day-old Wistar rats) were anesthetized and perfused through the ascending aorta with physiological saline, followed by 2.5% glutaraldehyde in 0.1 M phosphate buffer (pH 7.4) at 4°C for 10 min. The removed maxillae were immersed in the same fixative at 4°C for 2 h before decalcification in 5% ethylenediaminetetraacetic acid (EDTA) at 4°C for 3 weeks, then sagittally sectioned (90-μm sections) using a vibratome (Brunswick, St. Louis, MO, United States). At least three animals were studied for each experiment.
Cell culture
The ameloblast cell line HAT7 was established from rat incisors and cultured as previously described (Kawano et al., 2002). The cells were maintained in Dulbecco’s modified Eagle’s medium (DMEM/F12) (#11330-032; Life Technologies, Inc., Grand Island, NY, United States) supplemented with 10% fetal bovine serum (#12483-020, Thermo Scientific, Waltham, MA, United States) and 1% penicillin-streptomycin (#15140; Thermo Fisher Scientific). To induce hypoxia, the cells were cultured in hypoxic chambers (MCO-5M, PHCbi, Tokyo, Japan) with 5% O2, 5% CO2, and 90% N2. Nitrogen gas was supplied to the chambers to induce a controlled reduced percentage of oxygen. For normoxia, the cells were cultured in incubators at 5% CO2 and 21% O2. Apoptotic cells were determined by Annexin V staining (#A13199, Thermo Fisher Scientific) according to the manufacturer’s instructions. As a positive control of apoptosis induction, the cells were treated with mitomycin C (#M4287, Sigma-Aldrich, St Louis, MO, United States, 50 μM) for 6 h.
Alizarin red staining
For alizarin red staining for calcium deposition, HAT7 cells were cultured in 24-well plastic plates coated with collagen type I (#638-00781, Nitta Gelatin Co., Osaka, Japan) at confluence in calcification induction medium; DMEM/F12 supplemented with 10% FBS, dexamethasone (10 nM), CaCl2 (final concentration 2.1 mM) for 7 days under normoxia (21% O2) or hypoxia (5% O2), or for 5 days with UK-5099 (#S5317, Selleckchem, Randnor, PA, United States). The culture supernatant in the wells was removed, and the cells were washed with PBS, fixed with 4% PFA, and then washed three times with distilled water. Next, a 1.0% Alizarin Red S (#A5533, Sigma-Aldrich) stain was added, and the mixture was allowed to stand at room temperature for 30 min. The cells were then washed three times with PBS. The collagen gels with the cells were placed on the prepared slide and then dried at 37°C for 1 h. After drying, the gels were observed.
Alkaline phosphatase staining
HAT7 cells were cultured in 24-well plastic plates at confluence and cultured under normoxia or hypoxia for 48 h, or with UK-5099 for 48 h. The culture supernatant was removed, and the cells were washed with PBS and then fixed in wells with 4% PFA for 10 min at room temperature (RT). Thereafter, the fixative solution was removed, and the cells were washed three times with PBS. Subsequently, the substrate (ImmPACT Vector Red Alkaline Phosphatase Substrate) was added and reacted at 37°C for 30 min. Finally, after washing three times with PBS, the staining was observed.
In vitro calcium transport assay
HAT7 cells were grown on permeable polyester Transwell culture inserts with a 0.4-μm pore size (#353095 Corning Inc., Corning, NY, USA) at confluence. The medium in both the upper and lower chambers was then changed to an induction medium, and the cells were cultured under normoxia or hypoxia. After 24 h, the medium in the lower chamber was replaced with Ca2+-free DMEM (#21068028, Thermo Fisher Scientific, Waltham, MA, United States), and the cells were continuously cultured. At various time intervals (6, 12, 24, and 48 h after medium change), 50 μl aliquots of media from the lower chamber were collected into 1.5 ml Eppendorf tubes. The amount of Ca2+ in the media was evaluated with an AmpliteTM Fluorimetric Calcium Quantitation Kit (#36360, AAT Bioquest, CA, United States) by measuring the fluorescence intensity using a multi-mode microplate reader (SpectraMax M2, Molecular Devices, CA, United States) with excitation at 540 nm and emission at 590 nm, according to the manufacturer’s protocol. Increases in the amount of Ca2+ transferred through the cell layer from the upper chamber to the lower chamber indicate increased Ca2+ transport across the cells. After reaching confluence, the HAT7 cells on Transwell filters were fixed in 4% PFA, and the filters were removed from the plastic inserts and cut into strips. Some strips were processed for paraffin cross-sections, dewaxed, and stained with H&E. To obtain an en-face view, other strips were transferred to 24-well plates, rinsed in PBS containing Triton X-100 (0.01% v/v), immunoreacted with primary antibodies, followed by incubation with secondary fluorescent antibodies, and then observed.
ATP measurement in culture cells
HAT7 cells were cultured in 24-well plastic plates at confluence and then maintained under normoxia or hypoxia for 48 h. The cells were harvested using the extraction solution provided in the Intracellular ATP assay kit (#IC2-100, Toyo Ink Group, Tokyo, Japan). Luciferin substrate and luciferase enzyme were added, and bioluminescence was assessed using a multi-mode microplate reader according to the manufacturer’s instructions. Cellular ATP levels were evaluated and expressed as the ratio of hypoxic to normoxic conditions.
Staining of mitochondria with probes
HAT7 cells were cultured in 96-well plastic plates at confluence and then maintained under normoxia or hypoxia for 48 h. Mito Tracker Orange CMXRos (500 nM, #M7510, Thermo Fisher Scientific) or JC-1 (2 μmol/l, #MT09, Dojindo, Kumamoto, Japan) was added to the cells and incubated for 60 min at 37°C. The cells were washed 2 × with culture media, and fluorescence images were obtained using a fluorescence microscope (BX51, IX71, Olympus, Tokyo, Japan). JC-1 green/red fluorescence ratios were calculated and analyzed statistically.
Lactate assay
HAT7 cells were cultured in 24-well plastic plates at confluence and then maintained under normoxia or hypoxia for 48 h. The supernatant was collected, and the released lactate level in the medium was measured using a Lactate Assay Kit-WST (#L256, Dojindo) following the manufacturer’s instructions.
Immunohistochemistry and immunofluorescence
Immunohistochemical (IHC) and immunofluorescent (IF) staining were performed as previously described (Otsu et al., 2011). After blocking, the samples were incubated with the following antibodies (1:100): PDH (MA5-14805, Thermo Fisher Scientific), Zo-1 (sc-33725, Santa Cruz, Dallas, TX, USA) and LDH (ab52488, Abcam). DAPI (300 nM; D1306), Hoechst 33,342 (#R37605), Alexa Fluor 488 (1:500), and Alexa Fluor 546 (1:500) secondary antibodies were purchased from Thermo Fisher Scientific. Images were obtained using a fluorescence microscope (BX51, IX71; Olympus) or laser-scanning confocal microscope (C1si, Nikon). Image analyses were performed using ImageJ or software provided by the microscope. Fluorescence intensity was quantitated in at least five randomly chosen fields of view using the same threshold. Appropriate positive and negative controls were used for each experiment.
RT-PCR
Total RNA was extracted using the RNeasy Mini Kit (#74104, Qiagen, Hilden, Germany). Reverse transcription of total RNA was performed using the PrimeScript RT reagent kit (#RR037A, Takara Bio, Otsu, Japan). Quantitative analysis of gene expression was performed by qRT-PCR using the TB Green Fast qPCR Mix (#RR430A, Takara Bio, Otsu, Japan) and oligonucleotide primers specific for the target sequences (Table 1) on a Thermal Cycler Dice (Takara Bio, Otsu, Japan) according to the manufacturer’s protocol. The specificity of the PCR was confirmed by the appearance of a single band of PCR product in 2% agarose gel stained with ethidium bromide. The target gene expression levels were normalized to the corresponding levels of GAPDH mRNA. Gene expression levels were calculated relative to the values in control cultures using the comparative Ct (2−ΔΔCT) method. The experiments were performed in triplicates.
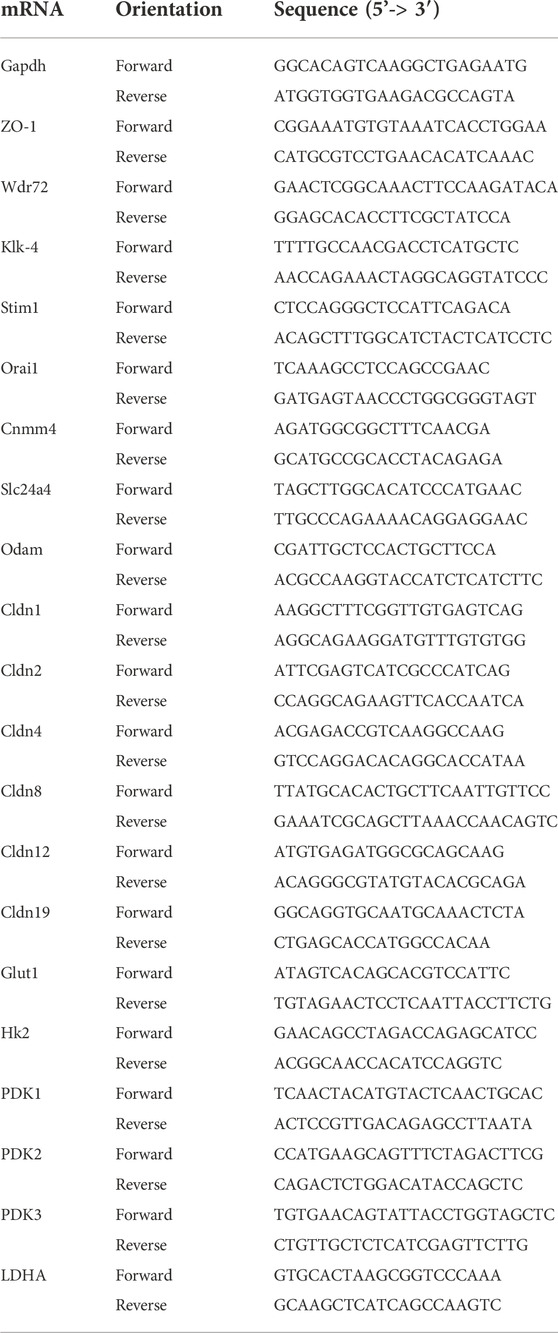
TABLE 1. List of PCR primer used in this study.
Transmission electron microscopy
Analysis of cytochrome oxidase activity in ameloblasts using transmission electron microscopy has been described previously (Ohshima et al., 1998). The sections (90-μm) were incubated for the demonstration of CO activity according to Seligman et al. (Seligman et al., 1968): preincubation in 0.1 M phosphate buffer (pH 7.4) with 1 mg/ml catalase for 10 min at 37°C, and incubation immediately in a medium consisting of 0.1 M phosphate buffer (pH 7.4) containing 1 mg/ml 3,38-diaminobenzidine (DAB) tetrahydrochloride, 0.1 mg/ml catalase, 1 mg/ml cytochrome c (horse heart, type III, Sigma Chemical Co., St Louis, MO), 85 mg/ml sucrose at 37°C for 1 h. After washing in the cold phosphate buffer, the incubated sections were post-fixed in 1% osmium tetroxide containing 1.5% potassium ferrocyanide for 1 h, and then dehydrated through a graded series of ethanol, and embedded in Epon 812. Ultrathin sections (70 nm) were prepared using a Reichert Ultracut-N ultramicrotome (Reichert-Nissei, Tokyo, Japan) with a diamond knife. Samples were examined under a Hitachi H-7000 transmission electron microscope (Hitachi Co. Ltd., Tokyo, Japan) without staining.
Statistical analyses
All data are reported as the mean ± SD. Differences were considered statistically significant if p < 0.05 by Student’s t-test. * denotes p < 0.05.
Results
Identification of differential developmental stage of ameloblasts
First, we investigated differences in the distribution of tight junction proteins and ALP activity in each differentiation stage of ameloblasts from S-ABs to early M-ABs in mouse incisors. Immunofluorescence showed that a punctiform expression of Zo-1 was observed at the distal end of S-ABs (Figure 1F, arrowheads). The expression in T-ABs gradually became stronger toward the incisal end (Figure 1G, arrowhead). Distinct expression of Zo-1 was observed at both the distal and proximal ends of the RA (Figure 1H, arrowheads) but only at the proximal end of the SA (Figure 1I, arrowheads). ALP staining revealed that S-ABs did not show any ALP activity, whereas the strong activity was observed in the stratum intermedium (Figure 1J arrowheads). The activity gradually increased at the distal end of T-ABs (Figure 1K, arrowhead). Strong ALP activity was observed at the distal end of the RA (Figure 1L, arrowheads), but it was weak in the SA (Figure 1M).
Energy metabolic shift occurs during ameloblasts differentiation in vivo
We further examined the difference in the energy metabolic state between S-ABs and early M-ABs. The expression of pyruvate dehydrogenase (PDH), which aerobically catalyzes the conversion of pyruvate to acetyl-CoA for use in mitochondrial metabolism (Harris et al., 2002), gradually increased from S-ABs to RA, and a distinct expression was observed at the distal end of RA. In contrast, expression in SA was weaker than that in RA (Figure 2A). The expression of LDH, which catalyzes the conversion of pyruvate to lactate during glycolysis (Doherty and Cleveland, 2013), was weak in S-ABs. The expression of LDH in RA cells exhibited a punctate pattern in the cytoplasm, whereas it became stronger throughout the cytoplasm in SA cells (Figure 2B).
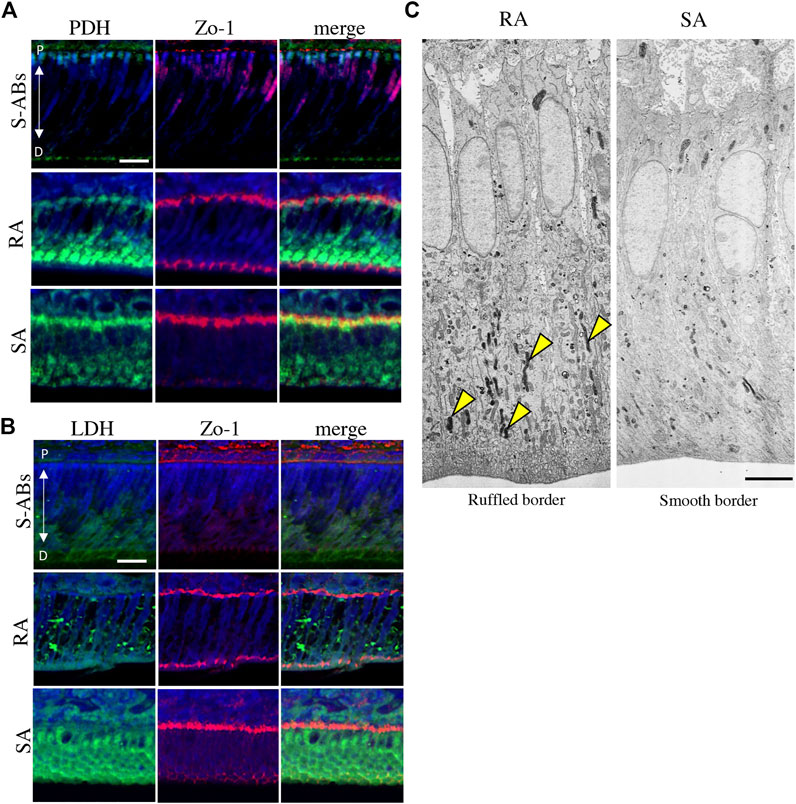
FIGURE 2. Energy metabolic state during ameloblasts differentiation in vivo. Double immunostaining for Zo-1 and PDH (A) and LDH (B) in P10 mouse maxillary incisors. Nuclei were stained with DAPI (blue). (C) Electron microscopic images of cytochrome oxidase (CO) activity in rat ruffle-ended (left) and smooth-ended (right) ameloblasts. Arrowheads indicate CO-positive mitochondria. Scale bars:20 µm (A,B) and 5 µm (C).
The well-developed mitochondrial apparatus has been implicated as an important indicator of substantial energy-generating potential, permitting, for example, active ion transport function (Garant and Nalbandian, 1968; Hubbard, 2000). To compare the functional activity of mitochondria in RA and SA in vivo, the activity of CO, a membrane-bound mitochondrial enzyme involved in OXPHOS, was analyzed using transmission electron microscopy (TEM). A large population of mitochondria in the distal cytoplasm was positive for CO (Figure 2C, arrowheads), whereas mitochondria in the distal cytoplasm displayed diversity in the proportion of CO activity in SA, suggesting that the activity of mitochondria in RA was higher than that in SA. Together, these results indicate that during differentiation, ameloblasts change their energy metabolic status and suggest that RA preferentially utilizes OXPHOS in mitochondria with high oxygen consumption, whereas SA undergoes a metabolic switch toward glycolysis-dominant energy metabolism.
Energy metabolic shift by oxygen in HAT7 cells
To further elucidate the relationship between M-ABs and energy metabolic states, we performed in vitro experiments using the ameloblast cell line HAT7, which has been shown to possess some of characteristics of M-ABs (Bori et al., 2016). First, we validated the expression of the M-AB marker in HAT7 cells. PCR analysis revealed that HAT7 cells expressed Wdr72, Klk4, Stim1, Orai1, Cnmm4, Slc24a4, and Zo-1 (Figure 3A). Furthermore, HAT7 cells expressed PDH, and the expression pattern was consistent with that of ALP activity (Figure 3B), consistent with in vivo results (Figures 1L,M, 2A).
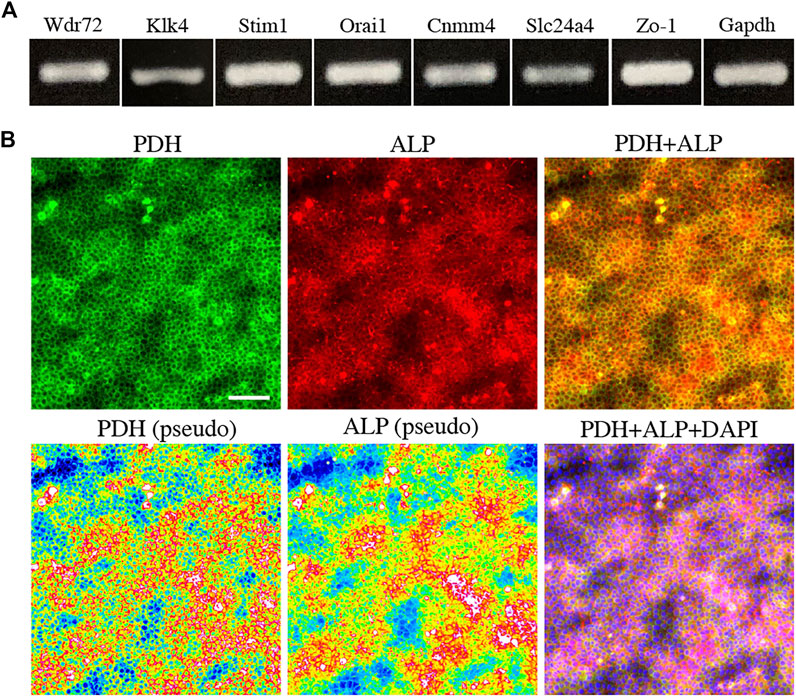
FIGURE 3. The expression of marker for maturation stage ameloblasts and energy metabolism in HAT7 cells. (A) The expression of maturation stage ameloblasts marker in HAT7 cells, as determined by RT-PCR. (B) Double staining of PDH and ALP in HAT7 cells. The bottom left and bottom middle images are the pseudo-color images of PDH and ALP, respectively. The nucleus is stained with DAPI (blue). Scale bars: 50 μm.
Next, to analyze the effect of energy metabolic shift on HAT7 cells, we designed experiments to induce an energy metabolic shift by hypoxia. Immunofluorescence revealed that hypoxic culture (5% O2 48 h) decreased PDH expression (Figures 4A,B) and increased LDH expression (Figures 4C,D) possibly without induction of apoptosis (Supplementary Figure S1). qPCR analysis also showed that hypoxia increased the gene expression of glycolytic markers, such as Glut1, Hexokinase 2 (HK2), PDK1, PDK2, PDK3, and LDHA (Figure 4E), and lactate production (Figure 4F), and decreased intracellular ATP production (Figure 4G). We further analyzed the effect of hypoxia on the mitochondrial membrane potential and morphology. JC-1 dye accumulates preferentially in polarized mitochondria, existing as green fluorescent monomers at low membrane potentials and as red fluorescent aggregates at high membrane potentials. Under hypoxia, the red/green fluorescence ratio decreased (Figures 5A–C), indicating depolarization of the mitochondrial membrane potential. Mitochondrial morphology was evaluated using MitoTracker™ Orange CMTMRos. Under normoxia, large mitochondria exhibited a spherical or oval morphology (Figures 5D–F), whereas, under hypoxia, mitochondria exhibited a tubular morphology (Figures 5G–I). These results indicate that HAT7 cells undergo an energy metabolic shift that is dependent on oxygen concentration, accompanied by changes in mitochondrial function and morphology.
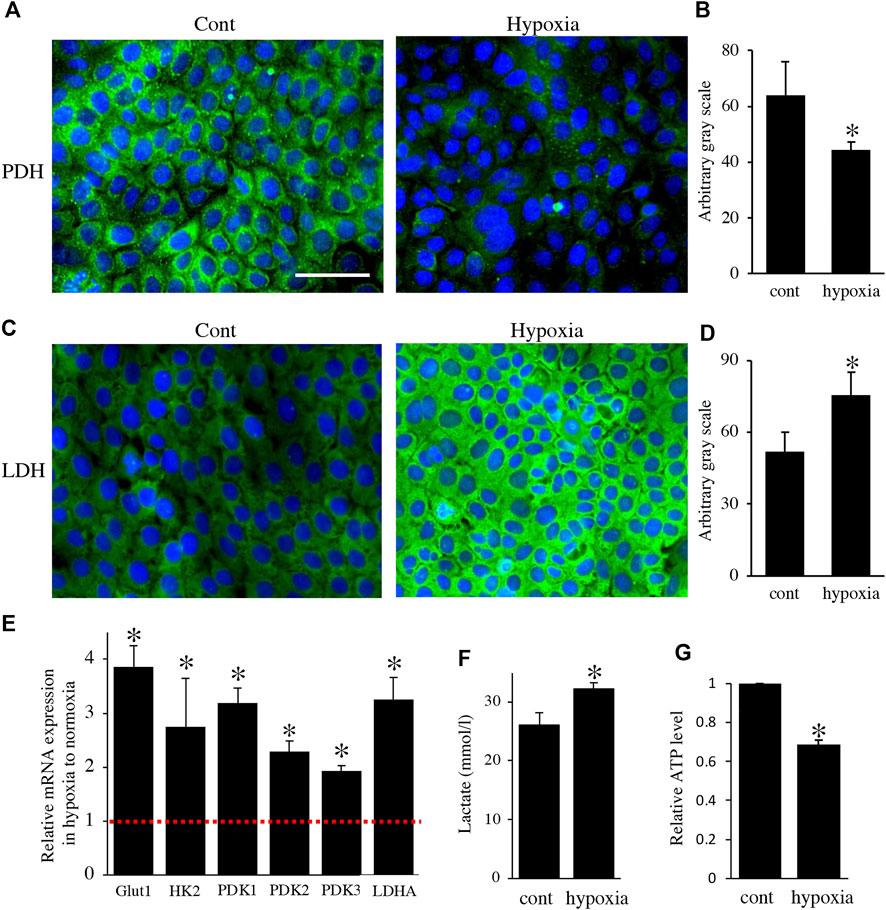
FIGURE 4. Environmental hypoxia induced energy metabolic shift to glycolysis in HAT7 cells. Immunostaining for PDH (A) and LDH (C) in HAT7 cells cultured under normoxia (left) and hypoxia (right) for 48 h. Nuclei were stained with DAPI (blue). Quantification of PDH (B) and LDH (D) fluorescence; n = 3 each. (E) Relative expression of the target genes in HAT7 cells under hypoxia for 48 h under normoxia; n = 3. (F) Lactate secretion into the culture medium of HAT7 cells incubated for 48 h under normoxia or hypoxia; n = 3. (G) Intracellular ATP production in HAT7 cells incubated for 48 h under normoxia or hypoxia (n = 3). Data are presented as the mean ± SD. *p < 0.05 (unpaired two-tailed Student’s t-test).
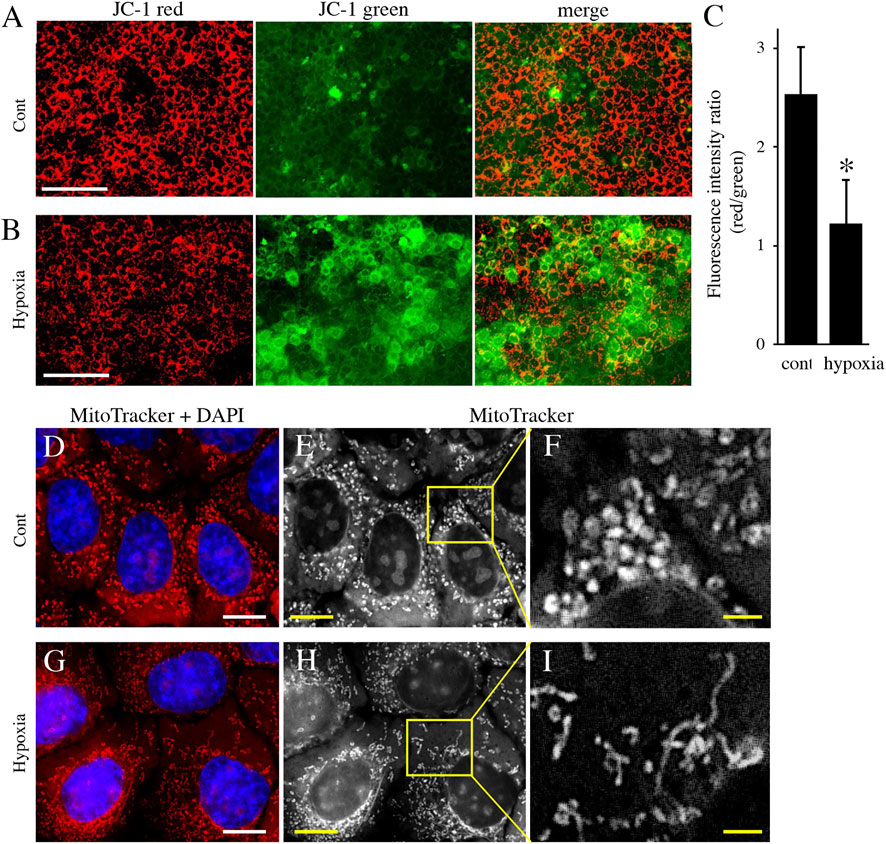
FIGURE 5. The effect of environmental hypoxia on mitochondrial membrane potential and morphology in HAT7 cells. (A,B) HAT7 cells cultured in hypoxia display a decrease in mitochondrial membrane potential is evident by the lack of red JC-1 aggregate (red) accumulation and higher staining for JC-1 green monomers. (C) Quantification of red/green JC-1 staining indicative of membrane potential. n = 3. MitoTracker Orange CMXRos staining of HAT7 cells cultured in normoxia (D–F) and hypoxia (G–I) for 48 h. The boxed area in (E,H) are magnified in (F,J), respectively. The nucleus is stained with DAPI (blue). Data are represented as their mean ± SD. *p < 0.05 (unpaired two-tailed Student’s t-test). Scale bars, 100 μm (A,B); 10 μm (D,E,G,H); 2 μm (F–I).
Effect of energy metabolic shift on maturation stage ameloblasts function
We examined the effect of the oxygen-mediated energy metabolic shift on HAT7 cells. During enamel mineralization, calcium is transported from the blood vessels in the papillary layer to the enamel matrix across M-ABs. Therefore, we developed an in vitro experimental model to analyze calcium transport across M-ABs in HAT7 cells. The cells were cultured on Transwell culture inserts, reached confluence, and then cultured under normoxia or hypoxia for 24 h. Subsequently, the culture medium in the lower chamber was replaced with Ca2+ free medium. The amount of Ca2+in the medium of the lower chamber under normoxia or hypoxia was measured using a fluorescent Ca2+ probe at each time point (Figure 6A). HE staining of the transverse section after reaching confluence showed that the cells mostly formed a single or 2-cell layer (Figure 6B). We confirmed that the cell layer significantly hindered Ca2+ transfer from the upper chamber to the lower chamber compared to the control Transwell surface covered with no cells under normoxia (Figure 6C). Furthermore, hypoxia significantly reduced Ca2+ transport (Figure 6C).
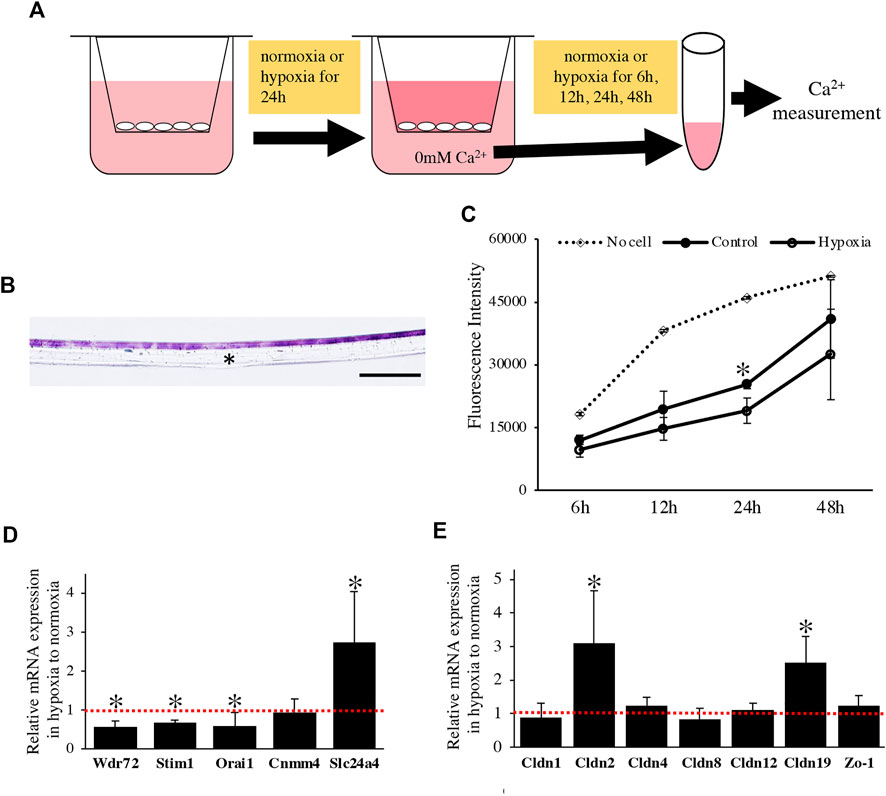
FIGURE 6. The effect of oxygen-mediated energy metabolic shift on Ca2+ transport of HAT7 cells. (A) The experimental procedure for in vitro calcium transport assay. For more detailed information, see the materials and methods section. (B) HE staining of HAT7 cells cultured on Transwell filter in cross-section. (C) Changes over time in the amount of calcium in the lower chamber. Calcium was transferred from the upper chamber to the lower chamber through HAT7 cells cultured in normoxia or hypoxia. n = 3. (D,E) Relative expression of target genes in HAT7 cells under hypoxia for 48 h to normoxia; n = 3. Data are represented as their mean ± SD. *p < 0.05 (unpaired two-tailed Student’s t-test). Scale bars, 100 μm (B).
We performed a qPCR assay to determine the effect of the oxygen-mediated energy metabolic shift on gene expression related to transcellular and paracellular Ca2+ transport. Hypoxia significantly decreased the expression of mRNA related to transcellular Ca2+ transport, such as Wdr72, Stim1, and Orai1, and increased Slc24a4 (Figure 6D). Claudin (Cldn) determines the barrier function of tight junctions and creates paracellular pores (channels) for Ca2+ between neighboring cells (Günzel and Yu, 2013). In HAT7 cells, hypoxia increased the mRNA expression of Cldn2 and Cldn19, but not that of Cldn1, 4, 8, 12, or Zo-1 (Figure 6E).
Finally, we examined the effects of energy metabolic shifts on ALP activity and Ca2+ deposition. ALP staining revealed that ALP activity was reduced by hypoxia (Figures 7A,B). Alizarin red staining also showed that hypoxia inhibited Ca2+ deposition (Figures 7C,D and Supplementary Figure S2A). Furthermore, UK-5099, an inhibitor of the mitochondrial pyruvate transporter (MPT) that induces energy metabolic shift from OXPHOS to glycolysis (Zhong et al., 2015), significantly decreased ALP activity and PDH expression (Figures 8A–C) possibly without induction of apoptosis (Figure 8D). UK-5099 also inhibited Ca2+ deposition (Figures 8E,F and Supplementary Figure S2B).
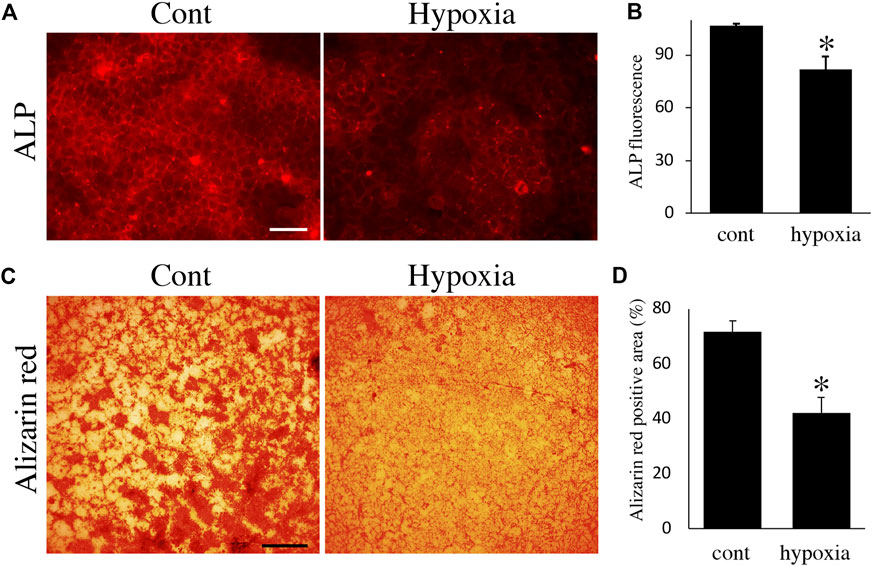
FIGURE 7. The effect of oxygen-mediated energy metabolic shift on mineralization. (A) ALP staining of HAT7 cells cultured in normoxia (left) and hypoxia (right) for 48 h. (B) Quantification of ALP fluorescence; n = 3. (C) Alizarin red staining of HAT7 cells cultured in normoxia (left) and hypoxia (right) for 7 days. (D) Image analysis of the mineral coverage (Alizarin red positive) in the culture dish; n = 3. Data are represented as their mean ± SD. *p < 0.05 (unpaired two-tailed Student’s t-test). Scale bars, 50 μm (A); 500 μm (C).
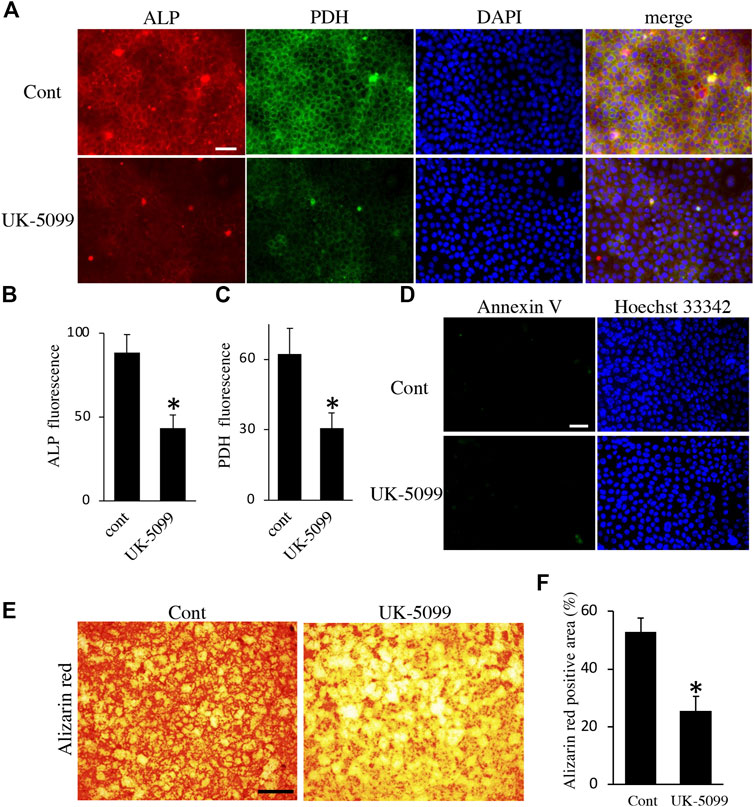
FIGURE 8. The effect of UK-5099 on mineralization. (A) Double staining of ALP and PDH in HAT7 cells treated with DMSO (upper: control) and 10 μM UK-5099 (lower) for 48 h. The nucleus is stained with DAPI (blue). Quantification of ALP (B) and PDH (C) fluorescence; n = 3 each. (D) Annexin V staining of HAT7 cells cultured with DMSO (upper: control) and 10 μM UK-5099 (lower) for 48 h. The nucleus is stained with Hoechst 33,342 (blue). (E) Alizarin red staining of HAT7 cells cultured with DMSO (left: control) and 10 μM UK-5099 (right) for 5 days. (F) Image analysis of the mineral coverage (Alizarin red positive) in the culture dish; n = 3. Data are represented as their mean ± SD. *p < 0.05 (unpaired two-tailed Student’s t-test). Scale bars, 50 μm (A,D); 500 μm (E).
Discussion
In this study, we have shown that, in vivo, RA cells are in an OXPHOS-dominant energy metabolic state, whereas SA cells are in a glycolysis-dominant energy metabolic state. In vitro experiment revealed that an energy metabolic shift from OXPHOS to glycolysis decreased the mineralization function by suppressing ALP activity and Ca2+ transport, implying the induction of phenotypic changes from RA to SA. Together, we have identified differences in the energy metabolic properties of RA and SA in M-ABs and highlighted the importance of the energy metabolic state for M-AB regulation (Figure 9).
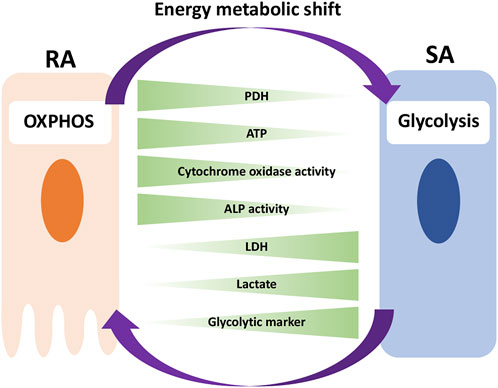
FIGURE 9. Model for the implication of energy metabolism in RA-SA modulation. RA cells are in an OXPHOS-dominant energy metabolic state, whereas SA cells are in a glycolysis-dominant energy metabolic state. An energy metabolic shift from OXPHOS to glycolysis decreases the mineralization function of M-ABs, implying a phenotypic change from RA to SA.
A metabolic switch is activated during ameloblast differentiation
We identified the differentiation stages of ameloblasts based on the expression of Zo-1 (Inai et al., 2008) and ALP (Okumura et al., 2010) and examined the expression of metabolic markers in each cell. From S-ABs to RA, the expression of OXPHOS markers increased, whereas that of glycolytic markers decreased. In contrast, from RA to SA in early M-ABs, OXPHOS markers and mitochondrial activity decreased, and glycolytic markers increased. This indicated that a gradual metabolic shift to an OXPHOS-dominant energy metabolism state occurs from S-ABs to RA, and conversely, a shift to a glycolysis-dominant energy metabolism state occurs from RA to SA. In line with this, previous studies have shown that in the transition stage, the expression of many genes involved in ion transport, proteolysis, and pH homeostasis, which required sufficient ATP production, was upregulated (Hu et al., 2012; Lacruz et al., 2012; Wang et al., 2014; Yin et al., 2014). Ultrastructural and cytochemical studies have suggested that in comparison with RA, SA is metabolically inactive and renews exhausted cytoplasmic organelles (Takano and Ozawa, 1980). We also showed that sodium-dependent active glucose transporter 2 (SGLT2), which is expressed in highly metabolically active cells, is expressed in RA but not in SA (Ida-Yonemochi et al., 2020). These results strongly indicated that ameloblasts could shift their metabolic state to meet the cell energy demand for their respective cellular functions, allowing us to identify the differentiation stage of ameloblasts in terms of energy metabolic status.
Environmental oxygen induces energy metabolic shifts
To analyze the effect of energy metabolic shift on HAT7 cells, we performed experiments to induce an energy metabolic shift by hypoxia. For most cell types, hypoxia has been found to decrease the levels of respiratory enzymes and oxygen consumption rate but increase the production of glycolytic enzymes and lactate, which eventually forces the cells to rely on glycolysis (Kierans and Taylor, 2021). Indeed, in HAT7 cells, hypoxia increases lactate production and the expression of Glut1 (Ebert et al., 1995; Ida-Yonemochi et al., 2020), HK2 (Iyer et al., 1998), PDH (Golias et al., 2016), PDK1-3 (Kim et al., 2006; Lu et al., 2008; Takubo et al., 2013), and LDHA (Yang et al., 2014). Hypoxia alters mitochondrial morphology and function (Galloway et al., 2012). Under hypoxia, the activity of the mitochondrial electron transport chain decreases, and energy needs to shift from OXPHOX to glycolysis (Ježek et al., 2010). We demonstrated that in HAT7 cells, hypoxia changed mitochondrial morphology and reduced ATP production and JC-1 red/green ratio, indicating mitochondrial depolarization and loss-of-function. These results indicated that hypoxia induced an energy metabolic shift in HAT7 cells from OXPHOS-dominant to a more glycolysis-dominant state, implying a phenotypic change from RA to SA.
Energy metabolic shift affects M-ABs mineralization function
M-ABs are responsible for enamel mineralization through an increase in calcium influx across the ameloblast layer into the enamel matrix. Here, we have shown that an energy metabolic shift alters the enamel mineralization function of M-ABs. We developed a novel in vitro experimental model and demonstrated that hypoxia-induced energy metabolic shift to a glycolysis-dominant state reduced Ca2+ transport across M-ABs, Ca2+ deposition and ALP activity. Further, we demonstrated that UK-5099, that induces energy metabolic shift from OXPHOS to glycolysis, inhibited Ca2+ deposition and ALP activity. These findings indicate the critical involvement of energy metabolism in enamel mineralization. Consistent with our findings, Kim et al. demonstrated that hypoxia inhibited normal enamel mineralization in a tooth germ transplantation model (Kim et al., 2021).
Involvement of energy metabolic shift in trans- and intracellular Ca2+ transport in M-ABs
Recent reports suggest that Ca2+ transport follows a proximal to distal route across the ameloblast cell layer to form mature enamel crystals. The principal mode of Ca2+ transport appears to be the transcellular route (Paine et al., 2008; Lacruz et al., 2013), while the contribution of the paracellular passage of Ca2+ during the RA to SA cycles has been indicated (Smith, 1979; Nanci, 2008). In the present study, we showed that oxygen-mediated energy metabolic shifts affected the expression of genes involved in both trans- and paracellular Ca2+ transport. We showed that hypoxia decreased the expression of Orai1 and Stim1. When Stim1 senses a decrease in Ca2+ in the endoplasmic reticulum, it forms clusters in the proximal region of the ER and plasma membrane and activates Orai1, which triggers store-operated Ca2+ entry (SOCE) (Prakriya and Lewis, 2015). In M-ABs, SOCE via the Orai1-Stim1 complex has been suggested to be the main calcium influx pathway (Nurbaeva et al., 2017), and patients with loss-of-function or null mutations in the STIM1 and ORAI1 genes present with a hypocalcified form of amelogenesis imperfecta (Mccarl et al., 2009; Picard et al., 2009; Fuchs et al., 2012). Thus, an energy metabolic shift may have a significant effect on transcellular calcium transport via the Orai1-Stim1 complex in M-ABs. In addition, Orai1 and Stim1 were reported to be predominantly expressed in RA compared to SA (Nurbaeva et al., 2015; Nurbaeva et al., 2017), indicating that Ca2+ uptake may predominantly occur in RA, which requires more oxygen for energy production than SA. Therefore, hypoxia may have a greater effect on RA function than on SA.
Furthermore, hypoxia reduced WDR72 expression. Mutation of the WDR72 gene results in hypomaturation defects of the enamel, which are thought to be caused by the abnormal removal of enamel matrix proteins and subsequent enamel mineralization (Katsura et al., 2014; Wang et al., 2015). Mutations in WDR72 have also been shown to decrease the number and size of blood vessels in the capillary layer and alter the subcellular localization of SLC24a4 (sodium/potassium/calcium exchanger 4; NCKX4), which is critical for transcellular Ca2+ transport in M-ABs (Wang et al., 2015). Interestingly, our data showed that hypoxia increased SLC24a4 mRNA expression. We speculated that this may have occurred to compensate for the mislocalization of Slc24a4 caused by the decrease in WDR72.
Paracellular access of ions and small molecules to form enamel depends on the composition of TJs, including members of the zonula occludens, occludin, and claudin families (Denker and Sabath, 2011). A combination of different claudins either allows intercellular passage of ions or is tightly closed and restricts passage (Günzel and Yu, 2013). We demonstrated that hypoxia decreased Ca2+ transport across HAT7 cells with an increase in CLND2 and 19 mRNA expression. This result suggests that CLDN2 and 19 may contribute to inhibit paracellular Ca2+ transport in M-ABs. CLDN2 has been identified as a cation pore-forming protein (Günzel and Yu, 2013). In the renal proximal tubule, TJs containing CLDN 2 have been shown to be leaky and have low transepithelial resistance (Denker and Sabath, 2011). Recently, a missense mutation in Cldn2 associated with obstructive azoospermia in a four-generation spanning family has been identified (Seker et al., 2019). Cldn2 KO mice have also shown higher urinary fractional excretion of Ca2+ in renal proximal tubules (Muto et al., 2010). However, the function of CLDN2 in the ameloblasts remains unclear. Cldn19 has been shown to be located in tight junctions of ameloblasts in mice and rats, where it plays a role in regulating extracellular pH, which is critical for the processing and secretion of extracellular matrix proteins (Bardet et al., 2017; Yamaguti et al., 2017). Mutations in CLDN19 are associated with amelogenesis imperfecta, a genetic disorder characterized by tooth enamel defects (Bardet et al., 2017; Yamaguti et al., 2017). These reports indicate that CLDN19 plays a critical role in amelogenesis. However, the detailed involvement of paracellular Ca2+ transport in M-ABs is unknown. Thus, further investigation of the role of each CLDN isoform in paracellular Ca2+ transport in M-ABs is required.
Although we used HAT7 cells to clarify the implication of an energy metabolic shift in M-ABs, we must note the limitation of the model. HAT7 cells are established from rat ameloblasts and express M-ABs markers, but alone cannot be a sufficient model for M-ABs. Besides Ca2+ transport and mineralization, additional mechanisms have to be identified, such as morphological change and protein degradation and absorption, as well as their coordinating mechanism. Thus, more complex cell culture models and analysis methods need to be developed in the future for better modeling of M-ABs. In addition, the oxygen concentration of M-ABs in vivo is different from in vitro conditions. Therefore, direct measurements of oxygen concentration in vivo and animal experiments under hypoxic conditions will help to identify the correlation between oxygen concentration and energy metabolism in M-ABs, and elucidate the regulatory mechanisms underlying RA-SA modulation.
Contribution and importance of this research in clinical dental medicine
In this study, we uncovered the energy metabolic characteristics of ameloblasts and demonstrated the involvement of energy metabolic shifts in the phenotype modulation of M-ABs. This discovery not only has a significant impact on our understanding of the regulatory mechanism underlying normal amelogenesis but also raises the possibility that failure of this mechanism can cause enamel malformation in human patients. To date, a variety of causal genes for inherited enamel malformations have been identified. These genes are involved in diverse functions, such as the secretion of enamel matrix proteins and their proteolytic processing enzymes, vesicle transport, pH sensing, calcium homeostasis, and cell adhesion (Smith et al., 2017). However, the involvement of energy metabolism in enamel malformation has not been demonstrated. Intriguingly, it was recently suggested that more common enamel defects, such as molar incisor hypomineralization (MIH), defined as a qualitative, demarcated, enamel defect of hypomineralization affecting at least one first permanent molar, while permanent incisors are often affected (Weerheijm et al., 2001), were caused by perinatal hypoxia (Garot et al., 2022). Therefore, further studies to clarify whether the abnormality of energy metabolic regulation causes enamel defects by interacting with intracellular signal networks and environmental factors in humans will aid in the development of novel treatment and prevention strategies for enamel malformations.
Data availability statement
Datasets are available on request: The raw data supporting the conclusions of this article will be made available by the authors, without undue reservation.
Ethics statement
The animal study was reviewed and approved by the Institutional Animal Care and Use Committee in Iwate medical University (approval no. 01-007).
Author contributions
HA contributed to conception and design, data acquisition, analysis, and interpretation, drafted and critically revised the manuscript; AI, SI, MK-S, MA, and HO contributed to data acquisition, analysis, and interpretation, drafted and critically revised the manuscript; KM contributed to conception and design, drafted and critically revised the manuscript; HH contributed to conception and design, data acquisition and interpretation, and critically revised the manuscript; KO contributed to conception and design, data acquisition, analysis, and interpretation, and drafted and critically revised the manuscript.
Funding
This work was financially supported by JSPS KAKENHI (Grant Numbers 21K09832 and 18K09526 to KO, 18H02984 to HH) and a KEIRYOKAI Research grant (Collaborative project 2017-2019) (to KO).
Acknowledgments
We thank T. Fukasawa, T. Sugawara, M. Takahashi (Center for In Vivo Science, Iwate Medical University), and Aya Kikuchi (Division of Developmental Biology and Regenerative Medicine, Department of Anatomy, Iwate Medical University) for providing technical assistance and Yukiko Onuma (Division of Developmental Biology and Regenerative Medicine, Department of Anatomy, Iwate Medical University) for their secretarial support.
Conflict of interest
The authors declare that the research was conducted in the absence of any commercial or financial relationships that could be construed as a potential conflict of interest.
Publisher’s note
All claims expressed in this article are solely those of the authors and do not necessarily represent those of their affiliated organizations, or those of the publisher, the editors and the reviewers. Any product that may be evaluated in this article, or claim that may be made by its manufacturer, is not guaranteed or endorsed by the publisher.
Supplementary material
The Supplementary Material for this article can be found online at: https://www.frontiersin.org/articles/10.3389/fphys.2022.1062042/full#supplementary-material
SUPPLEMENTARY FIGURE S1Annexin V staining of HAT7 cells cultured in hypoxia. (A) Double staining of Hoechst 33342 (left) and Annexin V (middle) in HAT7 cells cultured on plastic plates under normoxia (upper: control) and hypoxia (lower) for 48 h. (B) Double staining of Hoechst 33342 (left) and Annexin V (middle) in HAT7 cells treated with 50 μM mitomycin C for 6 h. Scale bars, 50 μm.
SUPPLEMENTARY FIGURE S2DAPI staining of HAT7 cells cultured on plastic plates coated with collagen type I for alizarin red staining. (A) DAPI staining of HAT7 cells cultured under normoxia (left) and hypoxia (right) for 7 days. (B) DAPI staining of HAT7 cells cultured with DMSO (left: control) and UK-5099 (right) for 5 days. Scale bars, 200 μm.
References
Bardet C., Ribes S., Wu Y., Diallo M. T., Salmon B., Breiderhoff T., et al. (2017). Claudin loss-of-function disrupts tight junctions and impairs amelogenesis. Front. Physiol. 8, 326. doi:10.3389/fphys.2017.00326
Bartlett J. D. (2013). Dental enamel development: Proteinases and their enamel matrix substrates. ISRN Dent. 2013, 684607. doi:10.1155/2013/684607
Bori E., Guo J., Rácz R., Burghardt B., Földes A., Kerémi B., et al. (2016). Evidence for bicarbonate secretion by ameloblasts in a novel cellular model. J. Dent. Res. 95, 588–596. doi:10.1177/0022034515625939
Denker B. M., Sabath E. (2011). The biology of epithelial cell tight junctions in the kidney. J. Am. Soc. Nephrol. 22, 622–625. doi:10.1681/ASN.2010090922
Doherty J. R., Cleveland J. L. (2013). Targeting lactate metabolism for cancer therapeutics. J. Clin. Invest. 123, 3685–3692. doi:10.1172/JCI69741
Ebert B. L., Firth J. D., Ratcliffe P. J. (1995). Hypoxia and mitochondrial inhibitors regulate expression of glucose transporter-1 via distinct cis-acting sequences. J. Biol. Chem. 270, 29083–29089. doi:10.1074/jbc.270.49.29083
Folmes C. D., Dzeja P. P., Nelson T. J., Terzic A. (2012). Metabolic plasticity in stem cell homeostasis and differentiation. Cell Stem Cell 11, 596–606. doi:10.1016/j.stem.2012.10.002
Fuchs S., Rensing-Ehl A., Speckmann C., Bengsch B., Schmitt-Graeff A., Bondzio I., et al. (2012). Antiviral and regulatory T cell immunity in a patient with stromal interaction molecule 1 deficiency. J. Immunol. 188, 1523–1533. doi:10.4049/jimmunol.1102507
Galloway C. A., Lee H., Yoon Y. (2012). Mitochondrial morphology-emerging role in bioenergetics. Free Radic. Biol. Med. 53, 2218–2228. doi:10.1016/j.freeradbiomed.2012.09.035
Garant P. R., Nalbandian J. (1968). Observations on the ultrastructure of ameloblasts with special reference to the Golgi complex and related components. J. Ultrastruct. Res. 23, 427–443. doi:10.1016/s0022-5320(68)80108-x
Garot E., Rouas P., Somani C., Taylor G. D., Wong F., Lygidakis N. A. (2022). An update of the aetiological factors involved in molar incisor hypomineralisation (MIH): A systematic review and meta-analysis. Eur. Arch. Paediatr. Dent. 23, 23–38. doi:10.1007/s40368-021-00646-x
Golias T., Papandreou I., Sun R., Kumar B., Brown N. V., Swanson B. J., et al. (2016). Hypoxic repression of pyruvate dehydrogenase activity is necessary for metabolic reprogramming and growth of model tumours. Sci. Rep. 6, 31146. doi:10.1038/srep31146
Günzel D., Yu A. S. (2013). Claudins and the modulation of tight junction permeability. Physiol. Rev. 93, 525–569. doi:10.1152/physrev.00019.2012
Harris R. A., Bowker-Kinley M. M., Huang B., Wu P. (2002). Regulation of the activity of the pyruvate dehydrogenase complex. Adv. Enzyme Regul. 42, 249–259. doi:10.1016/S0065-2571(01)00061-9
Hu P., Lacruz R. S., Smith C. E., Smith S. M., Kurtz I., Paine M. L. (2012). Expression of the sodium/calcium/potassium exchanger, NCKX4, in ameloblasts. Cells Tissues Organs 196, 501–509. doi:10.1159/000337493
Hubbard M. J. (2000). Calcium transport across the dental enamel epithelium. Crit. Rev. Oral Biol. Med. 11, 437–466. doi:10.1177/10454411000110040401
Ida-Yonemochi H., Otsu K., Harada H., Ohshima H. (2020). Functional expression of sodium-dependent glucose transporter in amelogenesis. J. Dent. Res. 99, 977–986. doi:10.1177/0022034520916130
Inai T., Sengoku A., Hirose E., Iida H., Shibata Y. (2008). Differential expression of the tight junction proteins, claudin-1, claudin-4, occludin, ZO-1, and PAR3, in the ameloblasts of rat upper incisors. Anat. Rec. 291, 577–585. doi:10.1002/ar.20683
Iyer N. V., Kotch L. E., Agani F., Leung S. W., Laughner E., Wenger R. H., et al. (1998). Cellular and developmental control of O2 homeostasis by hypoxia-inducible factor 1 alpha. Genes Dev. 12, 149–162. doi:10.1101/gad.12.2.149
Ježek P., Plecitá-Hlavatá L., Smolková K., Rossignol R. (2010). Distinctions and similarities of cell bioenergetics and the role of mitochondria in hypoxia, cancer, and embryonic development. Int. J. Biochem. Cell Biol. 42, 604–622. doi:10.1016/j.biocel.2009.11.008
Katsura K. A., Horst J. A., Chandra D., Le T. Q., Nakano Y., Zhang Y., et al. (2014). WDR72 models of structure and function: A stage-specific regulator of enamel mineralization. Matrix Biol. 38, 48–58. doi:10.1016/j.matbio.2014.06.005
Kawamoto T. (2003). Use of a new adhesive film for the preparation of multi-purpose fresh-frozen sections from hard tissues, whole-animals, insects and plants. Arch. Histol. Cytol. 66, 123–143. doi:10.1679/aohc.66.123
Kawano S., Morotomi T., Toyono T., Nakamura N., Uchida T., Ohishi M., et al. (2002). Establishment of dental epithelial cell line (HAT-7) and the cell differentiation dependent on Notch signaling pathway. Connect. Tissue Res. 43, 409–412. doi:10.1080/03008200290000637
Kierans S. J., Taylor C. T. (2021). Regulation of glycolysis by the hypoxia-inducible factor (HIF): Implications for cellular physiology. J. Physiol. 599, 23–37. doi:10.1113/JP280572
Kim E. J., Lee J. E., Yoon S., Lee D. J., Mai H. N., Ida-Yonemochi H., et al. (2021). Hypoxia-responsive oxygen nanobubbles for tissues-targeted delivery in developing tooth germs. Front. Cell Dev. Biol. 9, 626224. doi:10.3389/fcell.2021.626224
Kim J. W., Tchernyshyov I., Semenza G. L., Dang C. V. (2006). HIF-1-mediated expression of pyruvate dehydrogenase kinase: A metabolic switch required for cellular adaptation to hypoxia. Cell Metab. 3, 177–185. doi:10.1016/j.cmet.2006.02.002
Lacruz R. S. (2017). Enamel: Molecular identity of its transepithelial ion transport system. Cell Calcium 65, 1–7. doi:10.1016/j.ceca.2017.03.006
Lacruz R. S., Smith C. E., Bringas J. R., P., Chen Y..B., Smith S. M., Snead M. L., et al. (2012). Identification of novel candidate genes involved in mineralization of dental enamel by genome-wide transcript profiling. J. Cell. Physiol. 227, 2264–2275. doi:10.1002/jcp.22965
Lacruz R. S., Smith C. E., Kurtz I., Hubbard M. J., Paine M. L. (2013). New paradigms on the transport functions of maturation-stage ameloblasts. J. Dent. Res. 92, 122–129. doi:10.1177/0022034512470954
Lu C. W., Lin S. C., Chen K. F., Lai Y. Y., Tsai S. J. (2008). Induction of pyruvate dehydrogenase kinase-3 by hypoxia-inducible factor-1 promotes metabolic switch and drug resistance. J. Biol. Chem. 283, 28106–28114. doi:10.1074/jbc.M803508200
Mccarl C. A., Picard C., Khalil S., Kawasaki T., Röther J., Papolos A., et al. (2009). ORAI1 deficiency and lack of store-operated Ca2+ entry cause immunodeficiency, myopathy, and ectodermal dysplasia. J. Allergy Clin. Immunol. 124, 1311–1318. e7. doi:10.1016/j.jaci.2009.10.007
Muto S., Hata M., Taniguchi J., Tsuruoka S., Moriwaki K., Saitou M., et al. (2010). Claudin-2–deficient mice are defective in the leaky and cation-selective paracellular permeability properties of renal proximal tubules. Proc. Natl. Acad. Sci. U. S. A. 107, 8011–8016. doi:10.1073/pnas.0912901107
Nurbaeva M. K., Eckstein M., Concepcion A. R., Smith C. E., Srikanth S., Paine M. L., et al. (2015). Dental enamel cells express functional SOCE channels. Sci. Rep. 5, 15803. doi:10.1038/srep15803
Nurbaeva M. K., Eckstein M., Feske S., Lacruz R. S. (2017). Ca2+ transport and signalling in enamel cells. J. Physiol. 595, 3015–3039. doi:10.1113/JP272775
Ohshima H., Maeda T., Takano Y. (1998). Cytochrome oxidase activity in the enamel organ during amelogenesis in rat incisors. Anat. Rec. 252, 519–531. doi:10.1002/(SICI)1097-0185(199812)252:4<519:AID-AR3>3.0.CO;2-I
Okumura R., Shibukawa Y., Muramatsu T., Hashimoto S., Nakagawa K.-I., Tazaki M., et al. (2010). Sodium-calcium exchangers in rat ameloblasts. J. Pharmacol. Sci. 112, 223–230. doi:10.1254/jphs.09267fp
Otsu K., Ida-Yonemochi H., Ikezaki S., Ema M., Hitomi J., Ohshima H., et al. (2021). Oxygen regulates epithelial stem cell proliferation via RhoA-actomyosin-YAP/TAZ signal in mouse incisor. Development 148, dev194787. doi:10.1242/dev.194787
Otsu K., Kishigami R., Fujiwara N., Ishizeki K., Harada H. (2011). Functional role of Rho-kinase in ameloblast differentiation. J. Cell. Physiol. 226, 2527–2534. doi:10.1002/jcp.22597
Paine M. L., Snead M. L., Wang H. J., Abuladze N., Pushkin A., Liu W., et al. (2008). Role of NBCe1 and AE2 in secretory ameloblasts. J. Dent. Res. 87, 391–395. doi:10.1177/154405910808700415
Picard C., Mccarl C. A., Papolos A., Khalil S., Lüthy K., Hivroz C., et al. (2009). STIM1 mutation associated with a syndrome of immunodeficiency and autoimmunity. N. Engl. J. Med. 360, 1971–1980. doi:10.1056/NEJMoa0900082
Prakriya M., Lewis R. S. (2015). Store-operated calcium channels. Physiol. Rev. 95, 1383–1436. doi:10.1152/physrev.00020.2014
Reith E. J., Boyde A. (1979). A correlated scanning and transmission electron microscopic study of maturation ameloblasts in developing molar teeth of rats. Cell Tissue Res. 197, 421–431. doi:10.1007/BF00233567
Reith E. J., Boyde A. (1981). The arrangement of ameloblasts on the surface of maturing enamel of the rat incisor tooth. J. Anat. 133, 381–388.
Sasaki T., Debari K., Garant P. R. (1987). Ameloblast modulation and changes in the Ca, P, and S content of developing enamel matrix as revealed by SEM-EDX. J. Dent. Res. 66, 778–783. doi:10.1177/00220345870660031501
Seker M., Fernandez-Rodriguez C., Martinez-Cruz L. A., Müller D. (2019). Mouse models of human claudin-associated disorders: Benefits and limitations. Int. J. Mol. Sci. 20, E5504. doi:10.3390/ijms20215504
Seligman A. M., Karnovsky M. J., Wasserkrug H. L., Hanker J. S. (1968). Nondroplet ultrastructural demonstration of cytochrome oxidase activity with a polymerizing osmiophilic reagent, diaminobenzidine (DAB). J. Cell Biol. 38, 1–14. doi:10.1083/jcb.38.1.1
Smith C. E. (1979). Ameloblasts: Secretory and resorptive functions. J. Dent. Res. 58, 695–707. doi:10.1177/002203457905800221011
Smith C. E. L., Poulter J. A., Antanaviciute A., Kirkham J., Brookes S. J., Inglehearn C. F., et al. (2017). Amelogenesis imperfecta; genes, proteins, and pathways. Front. Physiol. 8, 435. doi:10.3389/fphys.2017.00435
Smith C. E., Mckee M. D., Nanci A. (1987). Cyclic induction and rapid movement of sequential waves of new smooth-ended ameloblast modulation bands in rat incisors as visualized by polychrome fluorescent labeling and GBHA-staining of maturing enamel. Adv. Dent. Res. 1, 162–175. doi:10.1177/08959374870010020401
Takano Y., Ozawa H. (1980). Ultrastructural and cytochemical observations on the alternating morphologic changes of the ameloblasts at the stage of enamel maturation. Arch. Histol. Jpn. 43, 385–399. doi:10.1679/aohc1950.43.385
Takubo K., Nagamatsu G., Kobayashi C. I., Nakamura-Ishizu A., Kobayashi H., Ikeda E., et al. (2013). Regulation of glycolysis by Pdk functions as a metabolic checkpoint for cell cycle quiescence in hematopoietic stem cells. Cell Stem Cell 12, 49–61. doi:10.1016/j.stem.2012.10.011
Tsogtbaatar E., Landin C., Minter-Dykhouse K., Folmes C. D. L. (2020). Energy metabolism regulates stem cell pluripotency. Front. Cell Dev. Biol. 8, 87. doi:10.3389/fcell.2020.00087
Wang S., Choi M., Richardson A. S., Reid B. M., Seymen F., Yildirim M., et al. (2014). STIM1 and SLC24A4 are critical for enamel maturation. J. Dent. Res. 93, 94S–100S. doi:10.1177/0022034514527971
Wang S. K., Hu Y., Yang J., Smith C. E., Nunez S. M., Richardson A. S., et al. (2015). Critical roles for WDR72 in calcium transport and matrix protein removal during enamel maturation. Mol. Genet. Genomic Med. 3, 302–319. doi:10.1002/mgg3.143
Warshawsky H., Smith C. E. (1974). Morphological classification of rat incisor ameloblasts. Anat. Rec. 179, 423–446. doi:10.1002/ar.1091790403
Weerheijm K. L., Jälevik B., Alaluusua S. (2001). Molar-incisor hypomineralisation. Caries Res. 35, 390–391. doi:10.1159/000047479
Yamaguti P. M., Neves F. A., Hotton D., Bardet C., de La Dure-Molla M., Castro L. C., et al. (2017). Amelogenesis imperfecta in familial hypomagnesaemia and hypercalciuria with nephrocalcinosis caused by CLDN19 gene mutations. J. Med. Genet. 54, 26–37. doi:10.1136/jmedgenet-2016-103956
Yang C., Jiang L., Zhang H., Shimoda L. A., Deberardinis R. J., Semenza G. L. (2014). Analysis of hypoxia-induced metabolic reprogramming. Methods Enzymol. 542, 425–455. doi:10.1016/B978-0-12-416618-9.00022-4
Yin K., Hacia J. G., Zhong Z., Paine M. L. (2014). Genome-wide analysis of miRNA and mRNA transcriptomes during amelogenesis. BMC Genomics 15, 998. doi:10.1186/1471-2164-15-998
Keywords: tooth, enamel, ameloblast, energy metabolism, OxPhos, glycolysis, hypoxia, mineralization
Citation: Arai H, Inaba A, Ikezaki S, Kumakami-Sakano M, Azumane M, Ohshima H, Morikawa K, Harada H and Otsu K (2022) Energy metabolic shift contributes to the phenotype modulation of maturation stage ameloblasts. Front. Physiol. 13:1062042. doi: 10.3389/fphys.2022.1062042
Received: 05 October 2022; Accepted: 15 November 2022;
Published: 29 November 2022.
Edited by:
Pamela Den Besten, University of California, San Francisco, United StatesReviewed by:
Catherine Chaussain, Université Paris Cité, FranceSylvie Babajko, INSERM U1138 Centre de Recherche des Cordeliers (CRC), France
Copyright © 2022 Arai, Inaba, Ikezaki, Kumakami-Sakano, Azumane, Ohshima, Morikawa, Harada and Otsu. This is an open-access article distributed under the terms of the Creative Commons Attribution License (CC BY). The use, distribution or reproduction in other forums is permitted, provided the original author(s) and the copyright owner(s) are credited and that the original publication in this journal is cited, in accordance with accepted academic practice. No use, distribution or reproduction is permitted which does not comply with these terms.
*Correspondence: Hidemitsu Harada, aGlkZWhhQGl3YXRlLW1lZC5hYy5qcA==; Keishi Otsu, a290c3VAaXdhdGUtbWVkLmFjLmpw