 Yuhao Jiang1,2Hongzhong Li3Yu Pang1Jiwei Ling1Hao Wang1Yuling Yang1Xinyu Li1Yin Tian1,4*Xiuxin Wang1,5*
- 1Institute for Advanced Sciences, Chongqing University of Posts and Telecommunications, Chongqing, China
- 2Central Nervous System Drug Key Laboratory of Sichuan Province, Luzhou, China
- 3School of Civil Engineering, Guangdong Communication Polytechnic, Guangzhou, China
- 4Guangyang Bay Laboratory, Chongqing Institute for Brain and Intelligence, Chongqing, China
- 5Key Laboratory of Opto-technology and Intelligent Control, Ministry of Education, Lanzhou Jiaotong University, Lanzhou, China
Digital holography is an effective technology in image reconstruction as amplitude and phase information of cells can be acquired without any staining. In this paper, we propose a holographic technique with an improved Gerchberg-Saxton (GS) algorithm to reconstruct cell imaging based on phase reconstruction information. Comparative experiments are conducted on four specific models to investigate the effectiveness of the proposed method. The morphological parameters (such as shape, volume, and sphericity) of abnormal erythrocytes can be obtained by reconstructing cell hologram of urinary sediment. Notably, abnormal red blood cells can also be detected in mussy circumstances by the proposed method, owing to the significantly biophysical contrast (refractive index distribution and mass density) between two different cells. Therefore, this proposed method has a broad application prospect in cell image reconstruction and cell dynamic detection.
Introduction
In the research field of biomedical and life sciences, researchers expect to capture the cell morphological shapes, dynamic characteristics, physiological parameters, interaction among cells, cell reactions to medicines and drug transport information by visual observation of biological cells in nutrient solution or under natural circumstances, which has an important role in early diagnosis and medicine design (Dixit and Cyr, 2003). Optical microscopy, which is regarded as a conventional medical imaging tool, is capable of magnifying images of minute object specimens with visible light. However, the conventional optical microscope can only examine the strength of the optical wave and achieve a two-dimensional, light intensity distribution map. Optical microscopy has difficulty capturing the three-dimensional spatial information of specimens. In addition, fluorescence microscopy demonstrated great performance in enhancing the contrast in cell images (Otuboah et al., 2019; Wen et al., 2020). Before observation using fluorescence microscopy, stains and dyes, such as rhoda mine, acridine orange, green fluorescent protein or other substances, are usually employed to mark biological cells to enhance the contrast in different biological specimens (Kricka and Fortina, 2009). The staining pretreatment process not only increases the complexity of cell imaging in operation but also greatly impacts cellular activity. Therefore, with the development of biomedical science, conventional cell imaging technologies have difficulty meeting the requirements of the dynamic observation and quantitative analysis of living cells (Ushenko et al., 2018; Borovkova et al., 2019; Ushenko et al., 2019; Peyvasteh et al., 2020).
Optical holography is a technology that adopts a photosensitive medium to record the optical wavefront information and that subsequently superimposes a second wavefront, which is referred to as a diffracted wave, to reconstruct the final image (Su et al., 2003; Wang et al., 2014; Lucchetta et al., 2015; Deng and Li, 2017). Digital holography is established by optical holography, dividing the procedures into recording and reconstruction (Demoli et al., 2019; Xia et al., 2019). Digital holography has drawn much attention from researchers as a cell imaging technique, owing to its advantageous characteristics of low production cost, rapid reconstruction speed, flexible recording and capturing of phase information of optical fields (Wang et al., 2018; Zhong et al., 2020). Digital holography utilizes photoelectric sensors (i.e., CCD or COMS) instead of a photosensitive medium to record the wavefront information, which is processed by computers. The light transmitting process is simulated by a computer based on diffraction propagation theory to quantitatively calculate the amplitude and phase distribution of the recorded object. Although existing optical instruments easily capture the light intensity data of high-frequency optical waves, the phase information is hard to collect or even lost in the course of recording. Notably, the optical wave phase has important morphological information with respect to the specimens and may contain up to 80% information of the imaged specimens. A phase retrieval algorithm has been reported to promote the speed of reconstructing images of X-rays, and this method is responsible for phase holograms in both the visible band and the non-visible band (Hennelly and Sheridan, 2003). Digital holographic techniques have been reported for dynamic estimation by analyzing the specimen shape and deformation analysis (Cui et al., 2010; Jin et al., 2017). Recently, digital holographic techniques also had been adopted for specific neural activity patterns (Adesnik and Abdeladim, 2021), monitoring cell characteristic variations in their density (Delikoyun et al., 2021), and cells migrating in a 3D environment (Hellesvik et al., 2020).
In this paper, we proposed a holographic technique to reconstruct cell imaging based on phase recovery information using an improved GS algorithm. The improved GS algorithm could optimize the initial phase based on local convergence theorem, and accomplish the reconstructed holographic image from contrapuntal phase information. We built four specific models to investigate the effectiveness of the proposed method. Comparative experiment results demonstrated that the proposed method is able to reconstruct phase images with a high signal-to-noise ratio, in which the edge and whole structural information has been reserved. The proposed method is utilized to detect abnormal red blood cells in urine sediment. Specifically, the improved GS algorithm enhances the quality of the phase-reconstructed holographic cell image and successfully detects abnormal red blood cells with distinct edges from the mussy circumstance. This method has great potential for practical biomedical applications in monitoring cell activities.
Methods
Digital holographic instruments
In this section, Figure 1 shows the general setup of the holographic imaging measurement system for holographic information acquisition and object reconstruction, and the optical holography adopts optical interference and diffraction theories to establish the light path. The system is composed of a laser source, beamsplitter cube, lens, reflector and beam receiver CCD. The laser beam emitted by the laser source is split into two orthogonal laser beams via the beamsplitter cube, and the laser beams are expanded by a beam expander. The outgoing beams from the beam expander are then collimated by a convex lens, and the beams are regarded as plane waves. One incident plane wave is projected onto the sample object, and the other plane wave goes through the acoustic-optic modulator as the reference wave. The frequency of outgoing waves from the acoustic-optic modulator has changed. Then, the light wave projected by the sample object and reference wave transmit through different optical paths and then become incident on the CCD sensor, on which optical interference simultaneously occurs. The CCD sensor acquires the holographic data, which are saved by the computer. The digital holographic technique eliminates the laser source and complex light path structure with respect to optical holography. The digital holographic technique saves the interference pattern generated on the conventional sensor plane of optical holography as a digital image for simulation (Wang et al., 2019). By computing the complex amplitude map of the optical wave, the phase information or amplitude information can be coded, and the encoding function is adopted to depict the diffracted propagation of the object projected wave from the holographic plane to the object plane. The digital holographic map is reconstructed by computer holography (Schnars and Jüptner, 2002).

FIGURE 1. General setup of the holographic imaging measurement system.
Holographic imaging algorithm
The holographic image is reconstructed in the steps of computer holography. First, we conduct a discrete sampling operation on the optical images to obtain a discrete digital image. A random initial phase distribution of the input optical field corresponding to the amplitude of the sampled image is generated for iterative process. Second, we conduct Fresnel or Fourier transformation on the discrete optical field image. Third, we use an optimal encoding scheme to transform the amplitude and phase information into the optimal transmittance expression function. Last, the holographic image is reconstructed through iterative calculations based on the encoding function.
During computer holographic image reconstruction, we simulate the holographic imaging process and optical diffraction theory by computer calculation based on scalar diffraction theory, which is responsible for describing optical propagation. In computer holography, z defines the distance between the diffractive plane and the observed plane, and
where
Then, we obtain the following equation.
where FFT demonstrates the Fourier transformation and IFFT demonstrates the inverse Fourier transformation.
The phase reconstruction algorithm is divided into two categories: The first interference phase detection category primarily includes the holographic technique and shear interference method, and the second non-interference detection category primarily includes the iterative method and transport-of-intensity equation method (Teague, 1983; Deutsch et al., 2008). The iterative method is based on the GS algorithm, reported by Gerchberg and Saxton (Gerchberg and Saxton, 1972), which is a typical algorithm to overcome the phase reconstruction problem. This algorithm adopts an iterative method for phase reconstruction by evaluating the relationship between the optical intensity distribution on the incident plane and that on the imaging plane. The GS method has a fast rate of convergence and high accuracy. In this section, we propose an improved GS algorithm, and Figure 2 demonstrates a schematic of holographic imaging with the improved GS algorithm. We normalize the phase and then set a threshold value of the processed phase to achieve a better reconstruction performance. Here, the optical field display on the incident plane using the wavefront coding technique is expressed as:
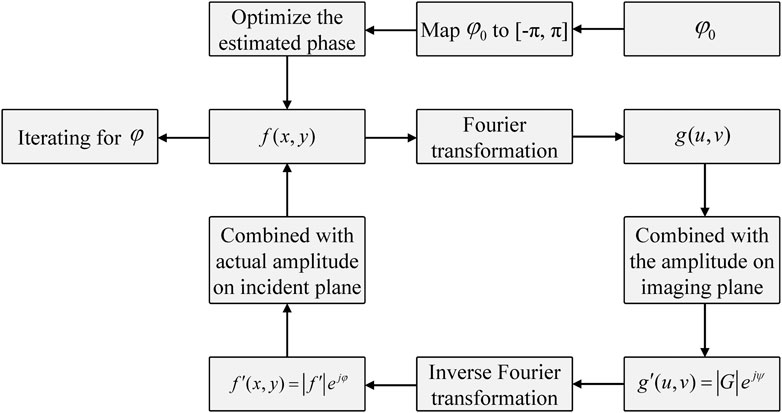
FIGURE 2. Schematic of the improved algorithm calculating steps.
The optical field on the imaging plane using the wavefront coding technique is expressed as:
where
A random generating phase of the optical field on the incident plane is input into the iterative operation as the initial phase, and the phase is continuously updated by the following iterations. Then, we normalize the phase and multiply the normalized phase by a factor value to optimize the initial phase. We combine
Comparative experimental models
In our study, an improved GS algorithm was adopted to reconstruct the wavefront phase map of urine sediment. Comparative experiments were conducted to validate the effectiveness of the proposed method. The performance of computer holography was analysed based on the phase and amplitude information of the cell reconstructed holographic image.
The urine sediment image was adopted as the experimental object. Computer holographic GS modelling is performed as follows: First, we perform preprocessing on an original RGB cell image, including downsampling the image with M × N pixels to an image with 256 × 256 pixels and conducting a greyscale operation. Second, the amplitude in each pixel was multiplied by a randomly generated phase value. Last, the iteration operation using the proposed method was conducted to obtain the reconstructed holographic cell image.
In this study, four models were built to investigate the effectiveness of the improved GS algorithm in cell holographic imaging. For Model 1, the original GS algorithm was adopted to obtain the amplitude information of the image, and the number of iterations was set to 20, 200, and 2,000. Then, we compared the amplitude of the holographic images with different iterations. For Model 2, the GS algorithm was adopted to obtain the phase information of the cell image. Neither Model 1 nor Model 2 was performed with phase mapping values. For Model 3, normalization processing and phase mapping were conducted on the amplitude and phase in Model 2, including transforming the image into greyscale from 0 to 1 and restricting the initial phase map value in the range of
To quantitatively estimate the impact of the phase reconstruction, the root mean squared error (RMSE) is employed as an indicator to assess the results. The indicator of the RMSE is expressed as follows:
where n is the number of iterations,
Results
In this study, the original image was a coloured image of urine sediment with 493
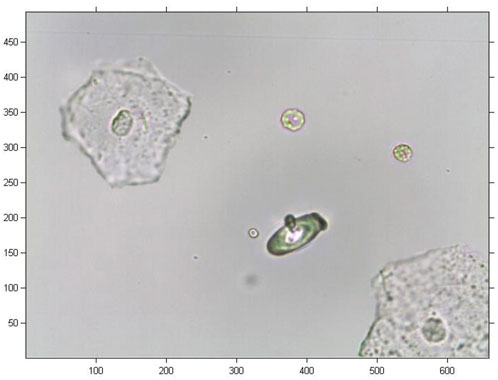
FIGURE 3. Original urine sediment image.
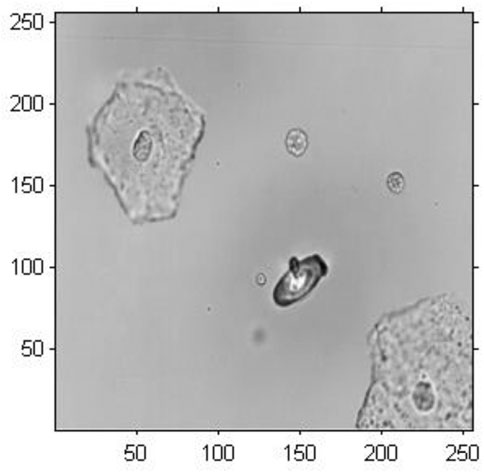
FIGURE 4. Pretreatment of image of urine sediment.
Figure 5 demonstrates the amplitude reconstruction-based holographic image for Model 1, which adopted the original GS algorithm to extract amplitude information with the number of iterations set to 20, 200 and 2,000. According to the visual comparison, there is a slight difference among the amplitude reconstruction-based holographic reconstructed images with different numbers of iterations. The reconstructed cell images only revealed a difference in brightness. Therefore, the amplitude information showed minimal impact on the cell holographic imaging.
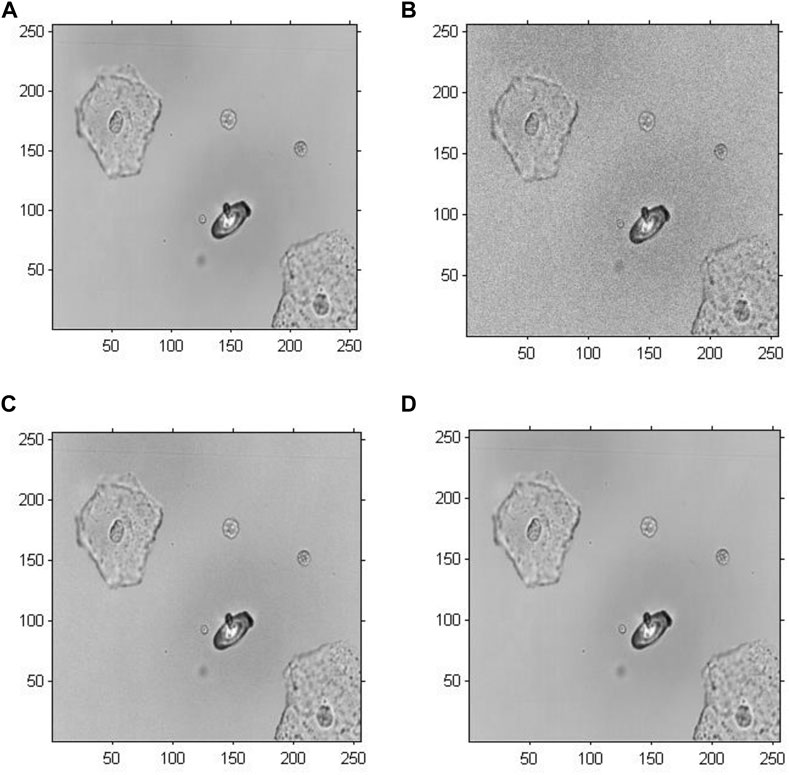
FIGURE 5. Amplitude reconstruction-based holographic image for Model 1. (A) Original greyscale image, (B) 20 iterative reconstruction images of amplitude information, (C) 200 iterative reconstruction images of amplitude information, and (D) 2000 iterative reconstruction images of amplitude information.
The GS algorithm with a random initial phase was conducted on the preprocessed greyscale image to investigate the performance of cell holographic imaging. The phase reconstruction-based cell holographic images for Model 2 are shown in Figure 6. The comparative results demonstrated that the phase image would be fuzzy and chaotic without phase normalization, leading to different results for each calculation.
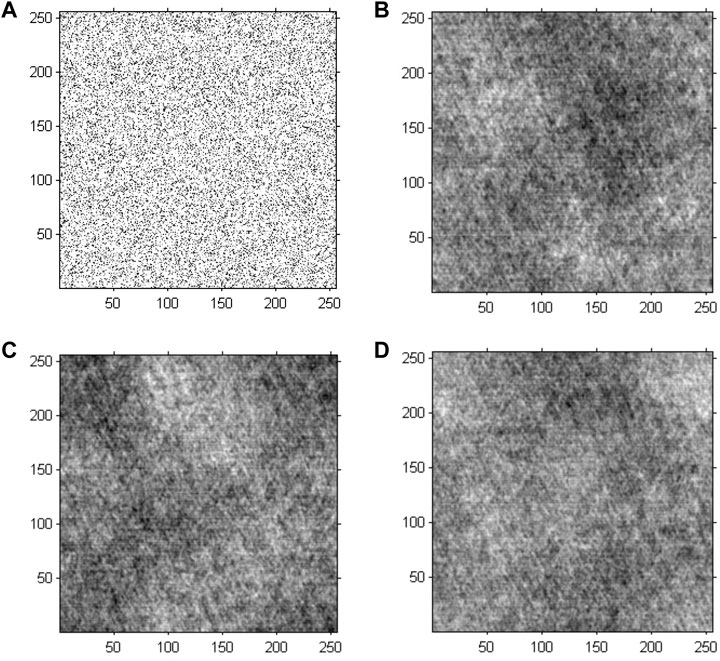
FIGURE 6. Phase reconstruction-based holographic image for Model 2 using the conventional GS algorithm. (A) Initial random phase, (B) 20 iterative reconstruction images of phase information, (C) 200 iterative reconstruction images of phase information, and (D) 2000 iterative reconstruction images of phase information.
Figure 7 demonstrates the phase reconstruction-based holographic image for Model 3, which adopted an improved GS algorithm with a random initial phase to extract phase information with the number of iterations set to 20, 200 and 2,000. According to the cell reconstructed images with different iterations, the comparative results suggested that as the number of iterations increased, the edges and the entire structure of abnormal red blood cells gradually became clearer, and the sharpness of the images increased. Compared with the results of Model 2, the abnormal blood red blood cells were successfully detected, and other impure cells were removed. Specifically, compared with the results of Model 1, the phase information had a more important role in cell holographic imaging than amplitude information, which only depicted the light and dark distribution.
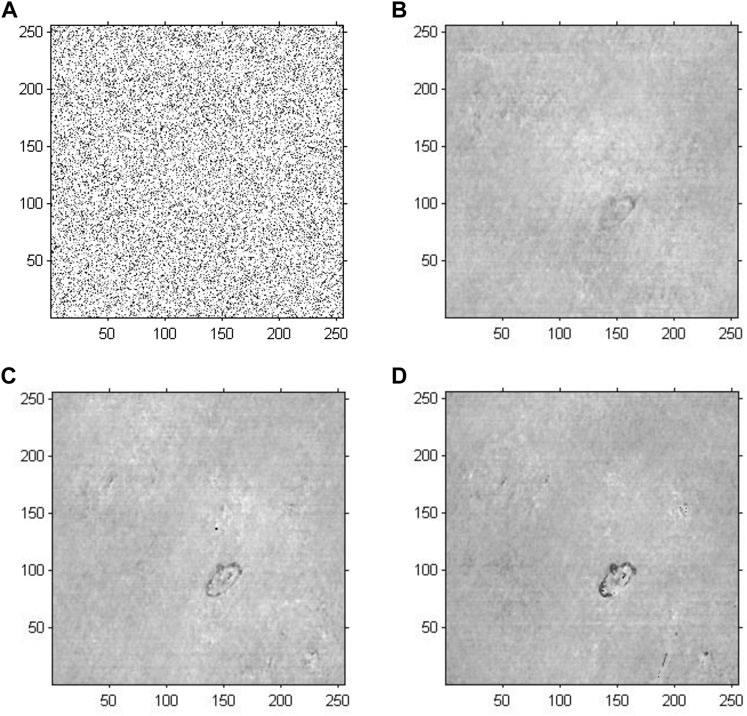
FIGURE 7. Phase reconstruction-based holographic image for Model 3 using the improved GS algorithm with the optimal initial phase. (A) Optimized initial phase. (B) Twenty iterative reconstruction images of phase information. (C) 200 iterative reconstruction images of phase information. (D) 2000 iterative reconstruction images of phase information.
We conducted holographic imaging using an improved GS algorithm with an optimal initial phase to investigate the effectiveness of the proposed method for cell holographic imaging. Figure 8 shows the phase reconstruction-based cell holographic images for Model 4 with the initial phase limited by a certain threshold value and the number of iterations set to 20, 200 and 2,000. A comparison of the cell holographic image with different iterations reveals that the edges and the entire structure of abnormal blood red cells became clearer as the number of iterations increased. A comparison of the image results of Model 3 and Model 4 reveal that the abnormal blood red cell of Model 4 was clearer than the cell image of Model 3, which suggested that the cell holographic image using the proposed method showed effective performance in holographic reconstruction and cell detection.
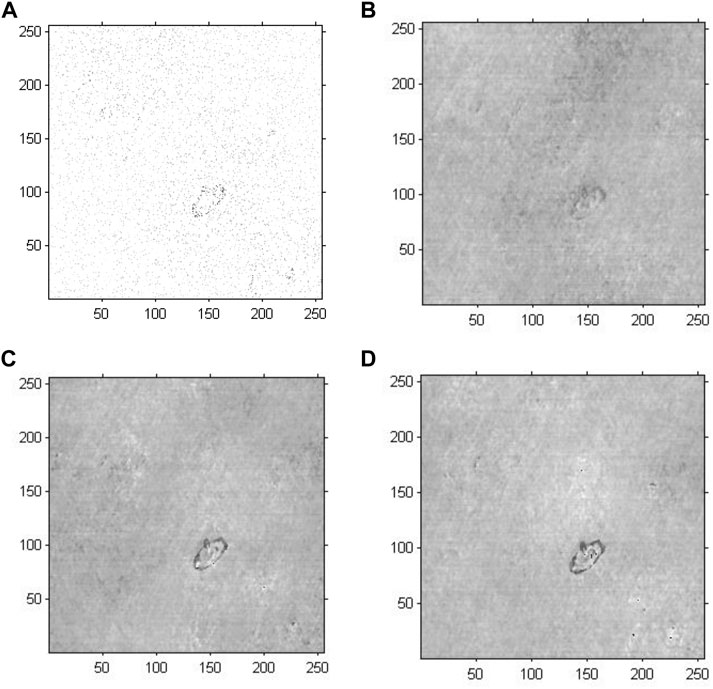
FIGURE 8. Phase reconstruction-based holographic image for Model 4 using the improved GS algorithm. (A) Optimized initial phase, (B) 20 iterative reconstruction images of phase information, (C) 200 iterative reconstruction images of phase information, and (D) 2000 iterative reconstruction images of phase information.
The root mean squared error (RMSE) was calculated to quantitatively demonstrate the impact of phase reconstruction. We take the logarithm of the RMSE for easy comparison. The RMSE results support the above conclusion that the proposed method is suitable for cell holographic reconstruction.
Model 2 is the unmapped phase original GS algorithm; the phase peaks are disordered and small. Model 3 is the phase of the mapped original GS algorithm; the phase peak at the red blood cell in the target image is more obvious than that in Model 2. Model 4 is the phase of the mapped improved GS algorithm. Compared with Model 3, the phase peak at the position of the red blood cell is slightly higher, and the performance of the phase imaging image quality is slightly outstanding. Each model ultimately presents a phase energy diagram with 20, 200 and 2,000 iterations.To verify the enhancement effects of the improved GS algorithm, the phase distributions of different models were conducted using corresponding methods with different iterations, as shown in Figure 9. The phase results of Model 2 revealed that the phase distributions were scrambled and that the peak value was small. Notably, the phase peaks concentrated on the position of the blood red cell in Model 3 and Model 4. More specifically, the phase peaks of Model 4 at the position of the blood red cell were more concentrated and higher than the phase peaks in Model 3. These comparative results validated that the imaging quality using the proposed method was outstanding.
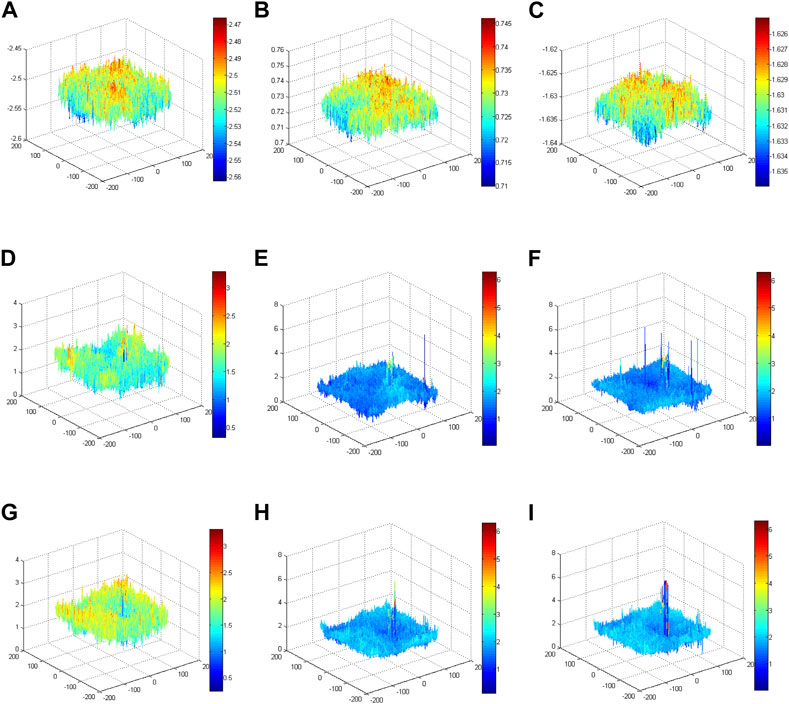
FIGURE 9. Phase energy map using the improved GS algorithm for different models. (A) Phase energy map with 20 iterations for Model 2. (B) Phase energy map with 200 iterations for Model 2. (C) Phase energy map with 2,000 iterations for Model 2. (D) Phase energy map with 20 iterations for Model 3. (E) Phase energy map with 200 iterations for Model 3. (F) Phase energy map with 2,000 iterations for Model 3. (G) Phase energy map with 20 iterations for Model 4. (H) Phase energy map with 200 iterations for Model 4. (I) Phase energy map with 2,000 iterations for Model 4.
Discussions
In this paper, we proposed an improved GS algorithm for cell reconstructed imaging, which demonstrated the capability of detecting normal red blood cells in urinary mussy circumstances. The proposed method adopted phase mapping and optimization to overcome the random and chaotic defects during conventional phase reconstruction processing.
The holographic image based on amplitude reconstruction results demonstrated that cell edges and detailed information is difficult to extract from the amplitude information. The comparative experimental results suggested that phase information was more important for cell holographic imaging than amplitude information. The amplitude information only demonstrates the light and shade distribution of the image, but does not associate with the content of cell characteristic properties, while the phase information is related to cell characteristic properties, such as edge and structure. According to the results of Model 3 and Model 4, when the phase was mapped in the range of
Cells can be considered phase objects. As many cells have a low absorption or scattering rate of light, cell phase changes are closely associated with the structure and other morphological parameters. Therefore, digital holography has attracted more attention in the field of biological cell imaging as it is capable of quantitatively analysing biological cells and non-destructively and dynamically observing living cells. Specifically, Kemper and Von Bally (2008) applied digital holography technology in biomedical applications and carried out three-dimensional reconstruction of human liver tumour cells and red blood cells. Potcoava and Kim (2008) conducted research on the thickness of blood vessels and retina using digital holographic technology. Wang et al. (2016) promoted the resolution of digital holographic imaging by combining microspheres and image planes. Sandoz et al. (2019) adopted a digital holographic system to estimate the biochemical change in lipid droplets, which are responsible for lipid storage and metabolism. Research on variations in the physicochemical characteristics of the nucleolus in HeLa cells using a digital holographic system has been reported (Kim et al., 2019). Additionally, a report associated with the observation of living diatoms in seawater using a digital holographic system was presented (Umemura et al., 2020). In addition to quantitatively imaging single cells, many studies have referred to cell pathology monitoring using digital holographic techniques (Charrière et al., 2006; Sung et al., 2009; Hsu et al., 2012).
Conclusion
In this paper, digital holographic technique could analyse cell physiological property without staining and dyeing, which is more suitable for the reconstruction of cell phase information, and makes up for the shortage that the traditional optical microscope can only provide amplitude images but is difficult to accurately distinguish the cell edges. An improved Gerchberg-Saxton algorithm was adopted to reconstruct the cell holographic image in light of the phase reconstruction information. Comparative experiments were carried out on four specific models with different phase constraint contidions, and the cell holographic image results clearly verified and revealed that this proposed improved GS method achieved better performance than the conventional GS method on the basis of phase reconstruction data. As the phase image reveals not only the spatial information but also the temporal statistics during the transmission of various frequency waves, the accumulation of phase information is able to depict the accurate shape parameters of the recorded object. Then, validation experiments were conducted on urine sediment images, and the reconstructed holographic image results demonstrated that this improved GS method was able to extract abnormal red blood cells with sharp edges and filter out other impure objects. In conclusion, the reconstructed holographic phase image achieved by the proposed method had a high signal-to-noise ratio, and the method was specific to discriminate the morphological parameters. Thus, these results demonstrated the possibility of this proposed holographic method in practical biomedical applications in cell activities monitoring.
Data availability statement
The original contributions presented in the study are included in the article/supplementary material, further inquiries can be directed to the corresponding authors.
Author contributions
XW: experiments design and conception. JL, HW, and XL: performed experiments and data analysis. YJ, HL, YP, YT, and YY: contributed to data analysis and wrote the draft of the manuscript. All the authors edited the manuscript.
Funding
This work was sponsored in part by the National Natural Science Foundation of China (Grant No. 61605021); in part by Science and Technology Research Program of Chongqing Municipal Education Commission (No. KJQN202000624) in part by Opening Foundation of Key Laboratory of Opto-technology and Intelligent Control (Lanzhou Jiao tong University), The Ministry of Education (KFKT 2020-08); in part by China Postdoctoral Science Foundation (No. 2021MD703941); in part by special support for Chongqing post-doctoral research project (2021XM 2051); in part by Natural Science Foundation of Chongqing (Nos. cstc2019jscx-msxmX0079 and cstc2019jcyj-msxmX0275); in part by Project of Central Nervous System Drug Key Laboratory of Sichuan Province (200028-01SZ); in part by the Doctoral Foundation of Chongqing University of Posts and Telecommunications (A2020-19, A2018-89, X2020-53, A2022-255).
Conflict of interest
The authors declare that the research was conducted in the absence of any commercial or financial relationships that could be construed as a potential conflict of interest.
Publisher’s note
All claims expressed in this article are solely those of the authors and do not necessarily represent those of their affiliated organizations, or those of the publisher, the editors and the reviewers. Any product that may be evaluated in this article, or claim that may be made by its manufacturer, is not guaranteed or endorsed by the publisher.
References
Adesnik H., Abdeladim L. (2021). Probing neural codes with two-photon holographic optogenetics. Nat. Neurosci. 24, 1356–1366. doi:10.1038/s41593-021-00902-9
Borovkova M., Trifonyuk L., Ushenko V., Dubolazov O., Vanchulyak O., Bodnar G., et al. (2019). Mueller-matrix-based polarization imaging and quantitative assessment of optically anisotropic polycrystalline networks. PloS One 14, e0214494. doi:10.1371/journal.pone.0214494
Charriere F., Pavillon N., Colomb T., Depeursinge C., Heger T. J., Mitchell E. A., et al. (2006). Living specimen tomography by digital holographic microscopy: Morphometry of testate amoeba. Opt. Express 14, 7005–7013. doi:10.1364/OE.14.007005
Cui H., Wang D., Wang Y., Liu C., Zhao J., Li Y. (2010). “Automatic procedure for non-coplanar aberration compensation in lensless Fourier transform digital holography,” in Proceedings of the 5th international Symposium on advanced optical Manufacturing and testing technologies: Optical Test and measurement Technology and equipment: SPIE, October 2010, 213–219. doi:10.1117/12.865688
Delikoyun K., Yaman S., Yilmaz E., Sarigil O., Anil-Inevi M., Telli K., et al. (2021). HologLev: A hybrid magnetic levitation platform integrated with lensless holographic microscopy for density-based cell analysis. ACS Sens. 6, 2191–2201. doi:10.1021/acssensors.0c02587
Demoli N., Gladić J., Lovrić D., Abramović D. (2019). Digital holography using LCOS microdisplay as input three-dimensional object. Optik 194, 162877. doi:10.1016/j.ijleo.2019.05.083
Deng Z. L., Li G. (2017). Metasurface optical holography. Mater. Today Phys. 3, 16–32. doi:10.1016/j.mtphys.2017.11.001
Deutsch B., Hillenbrand R., Novotny L. (2008). Near-field amplitude and phase recovery using phase-shifting interferometry. Opt. Express 16, 494–501. doi:10.1364/OE.16.000494
Dixit R., Cyr R. (2003). Cell damage and reactive oxygen species production induced by fluorescence microscopy: Effect on mitosis and guidelines for non-invasive fluorescence microscopy. Plant J. 36, 280–290. doi:10.1046/j.1365-313X.2003.01868.x
Gerchberg R. W., Saxton W. O. (1972). A practical algorithm for the determination of plane from image and diffraction pictures. Optik 35, 237–246.
Hellesvik M., Øye H., Aksnes H. (2020). Exploiting the potential of commercial digital holographic microscopy by combining it with 3D matrix cell culture assays. Sci. Rep. 10, 14680–14714. doi:10.1038/s41598-020-71538-1
Hennelly B., Sheridan J. T. (2003). Fractional fourier transform-based image encryption: Phase retrieval algorithm. Opt. Commun. 226, 61–80. doi:10.1016/j.optcom.2003.08.030
Hsu W. C., Su J. W., Chang C. C., Sung K. B. (2012). “Investigating the backscattering characteristics of individual normal and cancerous cells based on experimentally determined three-dimensional refractive index distributions,” in Proceedings of the Optics in health Care and biomedical optics V: SPIE, December 2012, 248–254. doi:10.1117/12.999804
Jin D., Zhou R., Yaqoob Z., So P. T. (2017). Tomographic phase microscopy: Principles and applications in bioimaging [invited]. J. Opt. Soc. Am. B 34, B64–B77. doi:10.1364/JOSAB.34.000B64
Kemper B., Von Bally G. (2008). Digital holographic microscopy for live cell applications and technical inspection. Appl. Opt. 47, A52–A61. doi:10.1364/AO.47.000A52
Kim T. K., Lee B. W., Fujii F., Kim J. K., Pack C. G. (2019). Physicochemical properties of nucleoli in live cells analyzed by label-free optical diffraction tomography. Cells 8, 699. doi:10.3390/cells8070699
Kricka L. J., Fortina P. (2009). Analytical ancestry:“Firsts” in fluorescent labeling of nucleosides, nucleotides, and nucleic acids. Clin. Chem. 55, 670–683. doi:10.1373/clinchem.2008.116152
Liu G., Scott P. D. (1987). Phase retrieval and twin-image elimination for in-line Fresnel holograms. J. Opt. Soc. Am. A 4, 159–165. doi:10.1364/JOSAA.4.000159
Lucchetta D., Spegni P., Di Donato A., Simoni F., Castagna R. (2015). Hybrid surface-relief/volume one dimensional holographic gratings. Opt. Mater. 42, 366–369. doi:10.1016/j.optmat.2015.01.028
Otuboah F. Y., Jihong Z., Tianyun Z., Cheng C. (2019). Design of a reduced objective Lens fluorescence dPCR Gene chip detection system with high-throughput and large field of view. Optik 179, 1071–1083. doi:10.1016/j.ijleo.2018.11.052
Peyvasteh M., Dubolazov A., Popov A., Ushenko A., Ushenko Y., Meglinski I. (2020). Two-point Stokes vector diagnostic approach for characterization of optically anisotropic biological tissues. J. Phys. D. Appl. Phys. 53, 395401. doi:10.1088/1361-6463/ab9571
Potcoava M., Kim M. (2008). Optical tomography for biomedical applications by digital interference holography. Meas. Sci. Technol. 19, 074010. doi:10.1088/0957-0233/19/7/074010
Sandoz P. A., Tremblay C., Van Der Goot F. G., Frechin M. (2019). Image-based analysis of living mammalian cells using label-free 3D refractive index maps reveals new organelle dynamics and dry mass flux. PLoS Biol. 17, e3000553. doi:10.1371/journal.pbio.3000553
Schnars U., Jüptner W. P. (2002). Digital recording and numerical reconstruction of holograms. Meas. Sci. Technol. 13, R85–R101. doi:10.1088/0957-0233/13/9/201
Su W. C., Chen Y. W., Ouyang Y., Sun C. C., Wang B. (2003). Optical identification using a random phase mask. Opt. Commun. 219, 117–123. doi:10.1016/S0030-4018(03)01308-7
Sung Y., Choi W., Fang-Yen C., Badizadegan K., Dasari R. R., Feld M. S. (2009). Optical diffraction tomography for high resolution live cell imaging. Opt. Express 17, 266–277. doi:10.1364/OE.17.000266
Teague M. R. (1983). Deterministic phase retrieval: A green’s function solution. J. Opt. Soc. Am. 73, 1434–1441. doi:10.1364/JOSA.73.001434
Umemura K., Matsukawa Y., Ide Y., Mayama S. (2020). Corrigendum to "Label-free imaging and analysis of subcellular parts of a living diatom cylindrotheca sp. using optical diffraction tomography" [MethodsX: 7 (2020) 100889]. MethodsX 7, 100923. doi:10.1016/j.mex.2020.100889
Ushenko V., Sdobnov A., Syvokorovskaya A., Dubolazov A., Vanchulyak O., Ushenko A., et al. (2018). 3D Mueller-matrix diffusive tomography of polycrystalline blood films for cancer diagnosis. Photonics 5, 54. doi:10.3390/photonics5040054
Ushenko V., Sdobnov A. Y., Mishalov W., Dubolazov A., Olar O., Bachinskyi V., et al. (2019). Biomedical applications of Jones-matrix tomography to polycrystalline films of biological fluids. J. Innov. Opt. Health Sci. 12, 1950017. doi:10.1142/S1793545819500172
Wang X., Jiang Y., Li Z., Wang W., Li Z. (2019). Sensitivity characteristics of microfiber fabry-perot interferometric photoacoustic sensors. J. Light. Technol. 37 (17), 4229–4235. doi:10.1109/JLT.2019.2922223
Wang X., Jin L., Li J., Ran Y., Guan B. O. (2014). Microfiber interferometric acoustic transducers. Opt. Express 22 (7), 8126–8135. doi:10.1364/oe.22.008126
Wang X. X., Li Z. Y., Tian Y., Wang W., Pang Y., Tam K. Y. (2018). Two dimensional photoacoustic imaging using microfiber interferometric acoustic transducers. Opt. Commun. 419, 41–46. doi:10.1016/j.optcom.2018.02.048
Wang Y., Guo S., Wang D., Lin Q., Rong L., Zhao J. (2016). Resolution enhancement phase-contrast imaging by microsphere digital holography. Opt. Commun. 366, 81–87. doi:10.1016/j.optcom.2015.12.031
Wen C., Kong Y., Zhao J., Li Y., Yu M., Zeng S., et al. (2020). Efficacy of the photon‐initiated photoacoustic streaming combined with different solutions on he root canals. Enterococcus faecalis in tMicrosc. Res. Tech. 83, 647–657. doi:10.1002/jemt.23455
Xia P., Wang Q., Ri S., Tsuda H. (2019). Calibrated phase-shifting digital holography based on space-division multiplexing. Opt. Lasers Eng. 123, 8–13. doi:10.1016/j.optlaseng.2019.06.022
Keywords: computer hologram, cell image, GS algorithm, phase reconstruction, reconstruction
Citation: Jiang Y, Li H, Pang Y, Ling J, Wang H, Yang Y, Li X, Tian Y and Wang X (2022) Cell image reconstruction using digital holography with an improved GS algorithm. Front. Physiol. 13:1040777. doi: 10.3389/fphys.2022.1040777
Received: 09 September 2022; Accepted: 17 October 2022;
Published: 31 October 2022.
Edited by:
Hao Yang, University of South Florida, United StatesReviewed by:
Bo Lan, Summation Bio Inc, United StatesHaiyan Shang, Chongqing Jiaotong University, China
Fei Yang, Guangdong University of Technology, China
Copyright © 2022 Jiang, Li, Pang, Ling, Wang, Yang, Li, Tian and Wang. This is an open-access article distributed under the terms of the Creative Commons Attribution License (CC BY). The use, distribution or reproduction in other forums is permitted, provided the original author(s) and the copyright owner(s) are credited and that the original publication in this journal is cited, in accordance with accepted academic practice. No use, distribution or reproduction is permitted which does not comply with these terms.
*Correspondence: Xiuxin Wang, wangxx@cqupt.edu.cn; Yin Tian, tianyin@cqupt.edu.cn