 Zhao-Qun Li
 Xiao-Ming Cai
95% of researchers rate our articles as excellent or good
Learn more about the work of our research integrity team to safeguard the quality of each article we publish.
Find out more
ORIGINAL RESEARCH article
Front. Physiol. , 14 November 2018
Sec. Invertebrate Physiology
Volume 9 - 2018 | https://doi.org/10.3389/fphys.2018.01602
This article is part of the Research Topic Insect Olfactory Proteins (From Gene Identification to Functional Characterization) View all 39 articles
The sibling species Ectropis grisescens and E. obliqua are the major chewing tea pests in China. A difference in sex pheromone components plays a central role in premating isolation in these two species. To investigate the mechanism of premating isolation in these two Ectropis species, we sequenced the transcriptomes of the antennae of female and male E. obliqua individuals and performed phylogenetic analyses, abundance analyses, and tissue expression profile analyses to compare the olfactory genes involved in the detection of sex pheromones. A total of 36 odorant-binding proteins (OBPs) and 52 olfactory receptors (ORs) were identified in E. obliqua. Phylogenetic analyses showed that EoblOBP2, 3, and 25 were grouped in the pheromone-binding protein clade with EgriOBP2, 3, 25, and another lepidopteran PBP. EoblOR25 and 28 were grouped with EgriOR25, 28, and pheromone receptors for the detection of Type-I sex pheromone components. EoblOR24, 31, 37, and 44 were grouped with EgriOR24, 31, 37, and 44. All of these 4 EoblORs and 4 EgriORs showed higher abundance in male antennae than in female ones. Therefore, OBP2, 3, 25 and OR24, 31, 37, 44 of E. grisescens and E. obliqua might be responsible for sex pheromone component detection. However, the sequences of these genes in E. grisescens and E. obliqua were more than 90% identical. This indicates that these orthologous genes might play similar roles in the detection of sex pheromones. In contrast, the observed OBPs and ORs differed in abundance between the antennae of the two Ectropis species. Therefore, we speculate that these two Ectropis species use the different transcript levels of PRs to differentiate sex pheromone components. The results of the present study might contribute in deciphering the mechanism for premating isolation in these species and may be of use in devising strategies for their management.
The tea geometrid, Ectropis obliqua, is a notorious chewing pest in the tea plantations of China (Ma et al., 2016b), and use of the E. obliqua nucleopolyhedrosis virus (EoNPV) preparation is an effective management strategy for its control. The susceptibility of tea geometrids collected from Quzhou, Zhejiang province to EoNPV is reported to be about 724.5-fold higher than in those collected from Yixing, Jiangsu province (Xi et al., 2011). Based on the assessment of external morphology, molecular biology, and interspecific hybridization, these two geographical populations were shown to be two different Ectropis species, namely E. grisescens and E. obliqua (Lepidoptera: Geometridae) (Jiang N. et al., 2014; Zhang G.H. et al., 2016). Because of morphological similarities, these two Ectropis species were mischaracterized as a single tea geometrid species, E. obliqua.
In moths, courtship and mating behaviors are regulated by sex pheromones, which play crucial roles in reproduction and are associated with reproductive isolation (Wyatt, 2009). The sex pheromones in both E. grisescens and E. obliqua were reported to be (Z,Z,Z)-3,6,9-octadecatriene (Z3,Z6,Z9-18:H) and (Z,Z)-3,9-cis-6,7-epoxy-octadecadiene (Z3,epo6,Z9-18:H) and were present at similar ratios (Ma et al., 2016c; Yang et al., 2016), which is unusual for sibling species occurring in the same region. The female sex pheromones of the two Ectropis species were reexamined in order to clarify how these two geometrids maintain premating isolation (Luo et al., 2017). The results showed that Z3,Z6,Z9-18:H and Z3,epo6,Z9-18:H were the sex pheromones of E. grisescens, whereas Z3,Z6,Z9-18:H, Z3,epo6,Z9-18:H, and (Z,Z)-3,9-cis-6,7-epoxy-nonadecadiene (Z3,epo6,Z9-19:H) were the sex pheromones of E. obliqua. Thus, the presence or absence of Z3,epo6,Z9-19:H may be the major determinant for premating isolation of these two Ectropis species. Moth sex pheromone components are classified into three groups: Type-I, Type-II, and miscellaneous type (Ando et al., 2004). Type-I sex pheromone components are composed of unsaturated compounds with C10–C18 straight chain unsaturated alcohols, aldehydes, or acetate esters. Type-II sex pheromone comprise unsaturated hydrocarbons and epoxy derivatives with a C17–C23 straight chain (Millar, 2000; Ando et al., 2004). Both E. grisescens and E. obliqua thus produce Type-II sex pheromone components.
Previous studies have shown that both soluble binding proteins and membrane-bound receptors are used in the detection of sex pheromones in moth (Leal, 2012).The odorant-binding proteins (OBPs) and water-soluble carriers are thought to aid in the capture and transport of odorants and pheromones to their receptors (Pelosi et al., 2014), and the pheromone-binding proteins (PBPs), a sub-class of OBPs, are thought to enhance the solubility of lipophilic Type-I sex pheromone components and deliver them to the membrane-bound receptors (Zhou, 2010; Sun et al., 2013; Jin et al., 2014). Sex pheromone receptors (PRs), a subfamily of odorant receptors (ORs), are specifically activated by Type-I sex pheromone components and have been widely studied in lepidopteran insects (Jiang X.J. et al., 2014; Zhang et al., 2014; Chang et al., 2015). In addition to PBPs and PRs, GOBP2 is also thought to be involved in the detection of Type-I sex pheromones (Liu et al., 2015). The analysis of the molecular mechanisms for the olfactory detection of sex pheromones in E. grisescens and E. obliqua might contribute to decipher the strategy for premating isolation in these two Ectropis species.
Less is known about the perception mechanism of Type-II pheromone components (Zhang D.D. et al., 2016). In our previous studies, we sequenced the antennae transcriptomes of E. grisescens, and identified 40 OBPs and 59 ORs, including an OR attuned to E. grisescens sex pheromone (Li et al., 2017). Although 24 OBPs and 4 ORs were identified from the leg transcriptome of E. obliqua (Ma et al., 2016a), the gene numbers were far different from E. grisescens. We therefore sequenced the transcriptomes of the antennae, the principal olfactory organs, of female and male E. obliqua individuals, and performed analyses of phylogeny, abundance, and tissue expression profile to compare the olfactory genes involved in sex pheromone detection in the two species.
Individuals of E. grisescens and E. obliqua were originally collected from the Experimental Tea Plantation of the Tea Research Institute, Chinese Academy of Agricultural Sciences (Hangzhou, Zhejiang, China). The larvae of the two species were accurately identified by comparing the cytochrome c oxidase I gene sequences and were reared on fresh tea shoots in different climate-controlled rooms under the same conditions (25 ± 1°C and 70 ± 5% relative humidity with a 14-h light:10-h dark photoperiod), enclosed in nylon mesh cages (70 cm × 70 cm × 70 cm). After pupation, the male and female pupae were separated based on their morphological characters and kept separately in cages for eclosion. After emergence, the adult moths were fed on a 10% honey solution. For transcriptome sequencing, antennae from 100 female and 100 male 2-day-old virgin E. obliqua individuals were collected in duplicates. For qRT-PCR analyses, a different sample of twenty 2-day-old virgin female and male E. grisescens and E. obliqua adults were used to collect antennae, heads without antennae, thoraxes, abdomen without the pheromone gland, legs, wings, proboscises, and pheromone glands. These tissues were immediately frozen and stored at −80°C until RNA isolation. Total RNA was extracted with TRIzol reagent (Invitrogen, Carlsbad, CA, United States). The quality of the RNA samples was assessed by agarose gel electrophoresis, NanoDrop (Thermo, Wilmington, DE, United States), and Agilent 2100 Bioanalyzer.
The cDNA library construction and Illumina sequencing of the samples were performed at Novogene Bioinformatics Technology Co., Ltd. (Beijing, China). Poly adenylated mRNAs were isolated from 5 μg total RNA using oligo (dT) magnetic beads and were fragmented into short fragments in the presence of divalent cations in fragmentation buffer at 94°C for 5 min. Using these short fragments as templates, random hexamer primers were used to synthesize first-strand cDNAs. Second-strand cDNAs were generated using RNase H and DNA polymerase I. After end repair and adaptor ligation, the short sequences were amplified by PCR, purified with a QIAquick® PCR Purification Kit (Qiagen, Venlo, Netherlands), and sequenced on the HiSeqTM 2500 platform (San Diego, CA, United States). The de novo transcriptome assembly was carried out using the short-read assembly program, Trinity (r20140413p1) (Grabherr et al., 2011) based on the paired-end reads with default settings. The transcriptomic data were deposited in the NCBI/SRA database (SRR7757597 and SRR7757596). Transcripts longer than 150 bp were first aligned by BLASTX against protein databases (NR, Swiss-Prot, KEGG, and COG; E-value < 10−5) to retrieve the proteins with the highest sequence similarity to the unigenes along with their functional annotations. We then used Blast2GO (Conesa et al., 2005) for gene ontology (GO) annotation of the transcripts and WEGO software (Ye et al., 2006) to plot the results of the GO annotation.
Transcript abundance was calculated as reads per kilobase per million mapped reads (RPKM) method, which can eliminate the influence of different transcript lengths and sequencing discrepancies when calculating the abundance (Mortazavi et al., 2008). We used the following equation:
where RPKM (A) represents the RPKM value of the transcript A, C is the number of reads uniquely aligned to the transcript A, N is the total number of fragments uniquely aligned to all the transcripts, and L is the number of bases in the transcript A.
Genes showing differential expression between the two conditions/groups were detected using the DESeq R package (1.10.1) (Anders and Huber, 2010), which provides statistical routines to determine differential expression from digital gene expression data using a model based on negative binomial distribution. The resulting P-values were adjusted using Benjamini and Hochberg’s approach to control the false discovery rate. Genes with an adjusted P-value < 0.05 found using DESeq were considered to be differentially expressed.
Sequenced transcriptomes were annotated by combining the transcriptomes of the antennae from females and males, then searching against the non-redundant (NR) database using BLASTX with a cut-off e-value of 10−5. EoblOBPs and EoblORs were named according to sequence similarity with EgriOBPs and EgriORs.
The amino acid sequence alignments of EgriOBPs, EoblOBPs, EgriORs, and EoblORs were performed using ClustalX 2.0 (Larkin et al., 2007). To investigate the phylogenetic relationships of the OBPs and ORs between E. grisescens, E. obliqua and other insect species, we aligned them using MAFFT (E-INS-I parameter) (Katoh and Standley, 2013). The phylogenetic trees were constructed using PhyML 3.1 with LG substitution model to generate a maximum likelihood phylogenetic tree (Guindon et al., 2010). Finally, the trees were viewed and group edited with FigTree v1.4.21.
The tissue expression patterns of EgriOBPs, EgriORs, EoblOBPs, and EoblORs in different tissues were measured using a qPCR method performed according to the minimum information for publication of quantitative real-time PCR experiments (Bustin et al., 2009). Total RNA was isolated using the SV Total Isolation System (Promega, Madison, WI, United States) according to manufacturer’s instructions. The quality and quantity of the RNA samples was assessed using agarose gel electrophoresis and NanoDrop (Thermo). Single-stranded cDNA templates were synthesized using the Reverse Transcription System (Promega) following manufacturer’s instructions. The qRT-PCRs were performed on a Bio-Rad CFX96 touch real-time PCR detection system (Bio-Rad, Hercules, CA, United States). The primers were designed using Beacon Designer 7.7 based on the E. grisescens and E. obliqua nucleotide sequences obtained from the transcriptome data (Supplementary Table S1). The reaction was performed as follows: 30 s at 95°C, followed by 40 cycles at 95°C for 5 s and 60°C for 34 s. Templates were diluted in a five-fold series of samples and were used to determine the amplification of primers. Each reaction was run in triplicate (technical repeats). Theguanine nucleotide-binding protein G(q) subunit alpha and glyceraldehyde-3-phosphate dehydrogenase genes of both E. grisescens and E. obliqua were selected as reference genes for the qPCR analysis. A blank control without template cDNA (replacing cDNA with H2O) served as the negative control. Each reaction included three independent biological replicates and was repeated three times (technical replicates). The relative transcript levels were calculated using the comparative 2−ΔΔCq method (Livak and Schmittgen, 2001).
A total of 36 EoblOBPs were identified in the E. obliqua antennae transcriptome. Sequence analyses showed that 31 of the 36 EoblOBPs were full-length genes (Figure 1). Of the 36 EoblOBPs, EoblOBP8, 13, 14, 15, 32, C-15995, and C-6102 contained only four conserved cysteine residues. EgriOBP4, 5, and 7 contained more than six conserved cysteine residues. The other EoblOBPs contained six conserved cysteine residues. A total of 52 EoblORs were identified in the E. obliqua antennae, 37 of which contained a full-length open reading frame, and had a full-length of about 1200 bp. EgriOBP2, 3, 25 and EgriOR24, 28, 31, 27 44 were identified as candidate genes involved in detecting sex pheromones. The identities between the sequences of EoblOBP2 and EgriOBP2, EoblOBP3 and EgriOBP3, and EoblOBP25 and EgriOBP25 were 98.77, 98.84, and 97.65%, respectively, whereas those between the sequences of EoblOR24 and EgriOR24, EoblOR25 and EgriOR25, EoblOR28 and EgriOR28, EoblOR31 and EgriOR31, EoblOR37 and EgriOR37, and EoblOR44 and EgriOR44, were 96.04, 96.08, 90.68, 92.72, 99.29, and 90.68%.
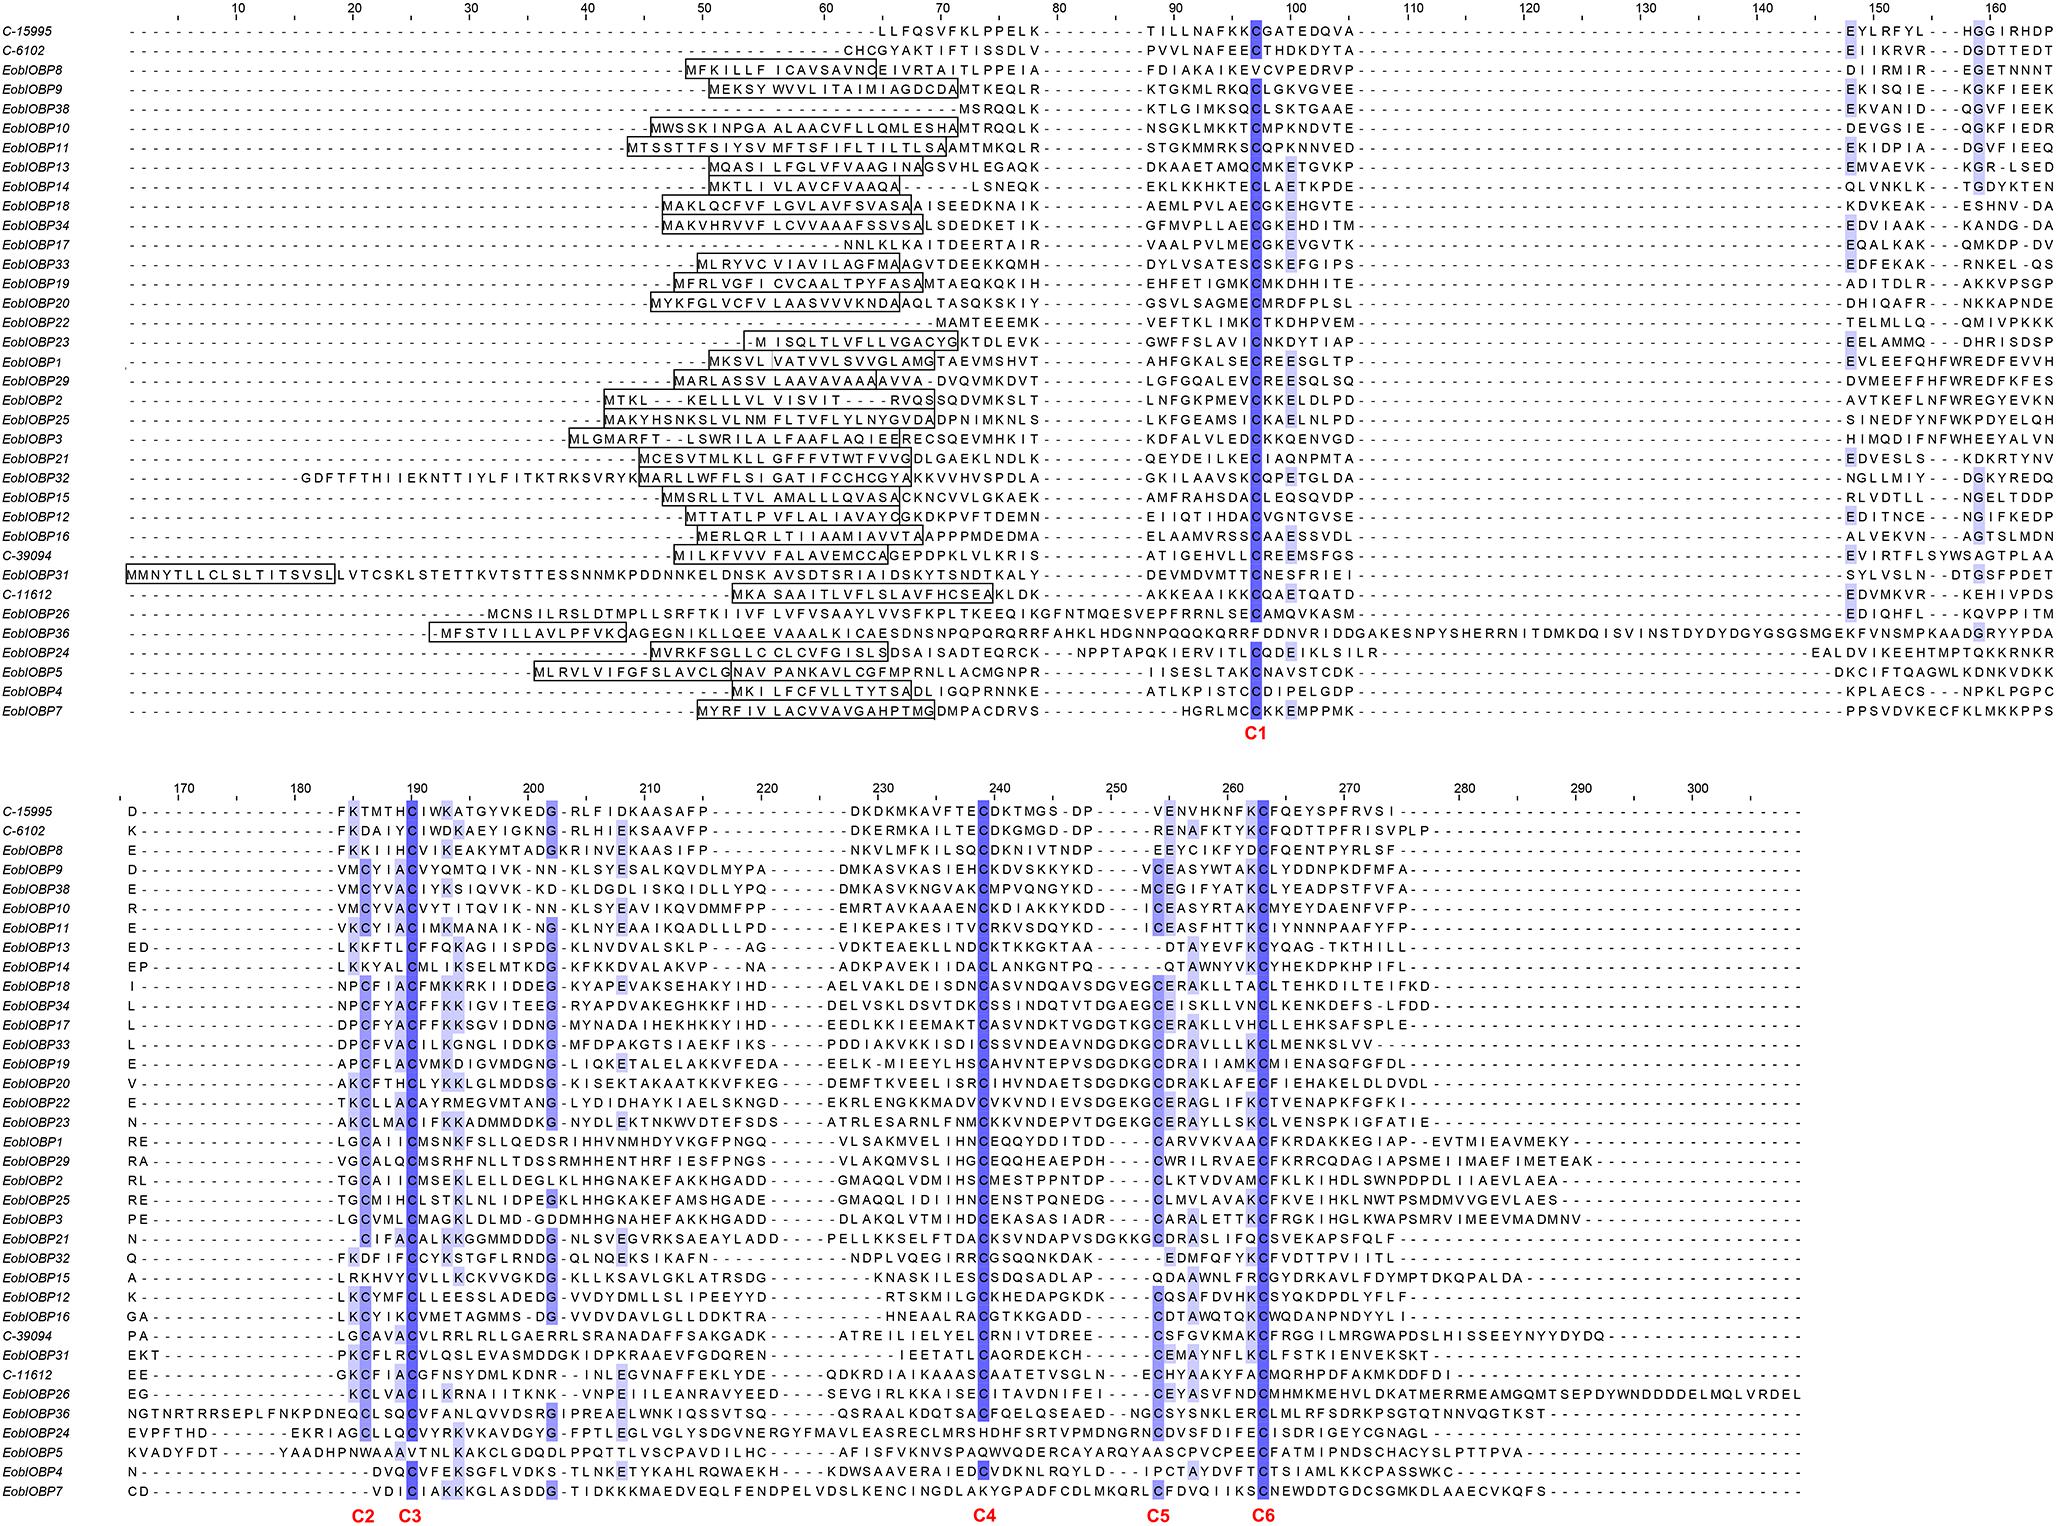
FIGURE 1. Alignment of amino acid sequences of EoblOBPs. Boxes indicate the predicted signal peptides; blue highlight indicates the conserved cysteine residues.
In the phylogenetic tree based on the OBP sequences, four EoblOBPs (EoblOBP2, 3, 25, and C-39094) were grouped in the PBP clade with EgriOBP2, 3, 25, and other lepidopteran PBP (Figure 2). The orthologs EoblOBP1 and 29 were in the GOBP group with their orthologs EgriOBP1 and 29 (Figure 2). The phylogenetic tree generated using the OR sequences showed that EoblORco was well clustered with EgriORco, ObruORco(ORco of Operophtera brumata), HvirORco(ORco of Heliothis virescens), and BmorOR2(ORco of Bombyx mori) with high bootstrap support (Figure 3). EoblOR25 and 28 were grouped with EgriOR25, 28, ObruOR1 (a PR for Type-II sex pheromone), and PRs for Type-I sex pheromone, including B. mori, Helicoverpa armigera, H. assulta, and H. virescens (Figure 3). EoblOR24, 31, 37, and 44 were grouped with EgriOR24, 31, 37, and 44 (Figure 3).
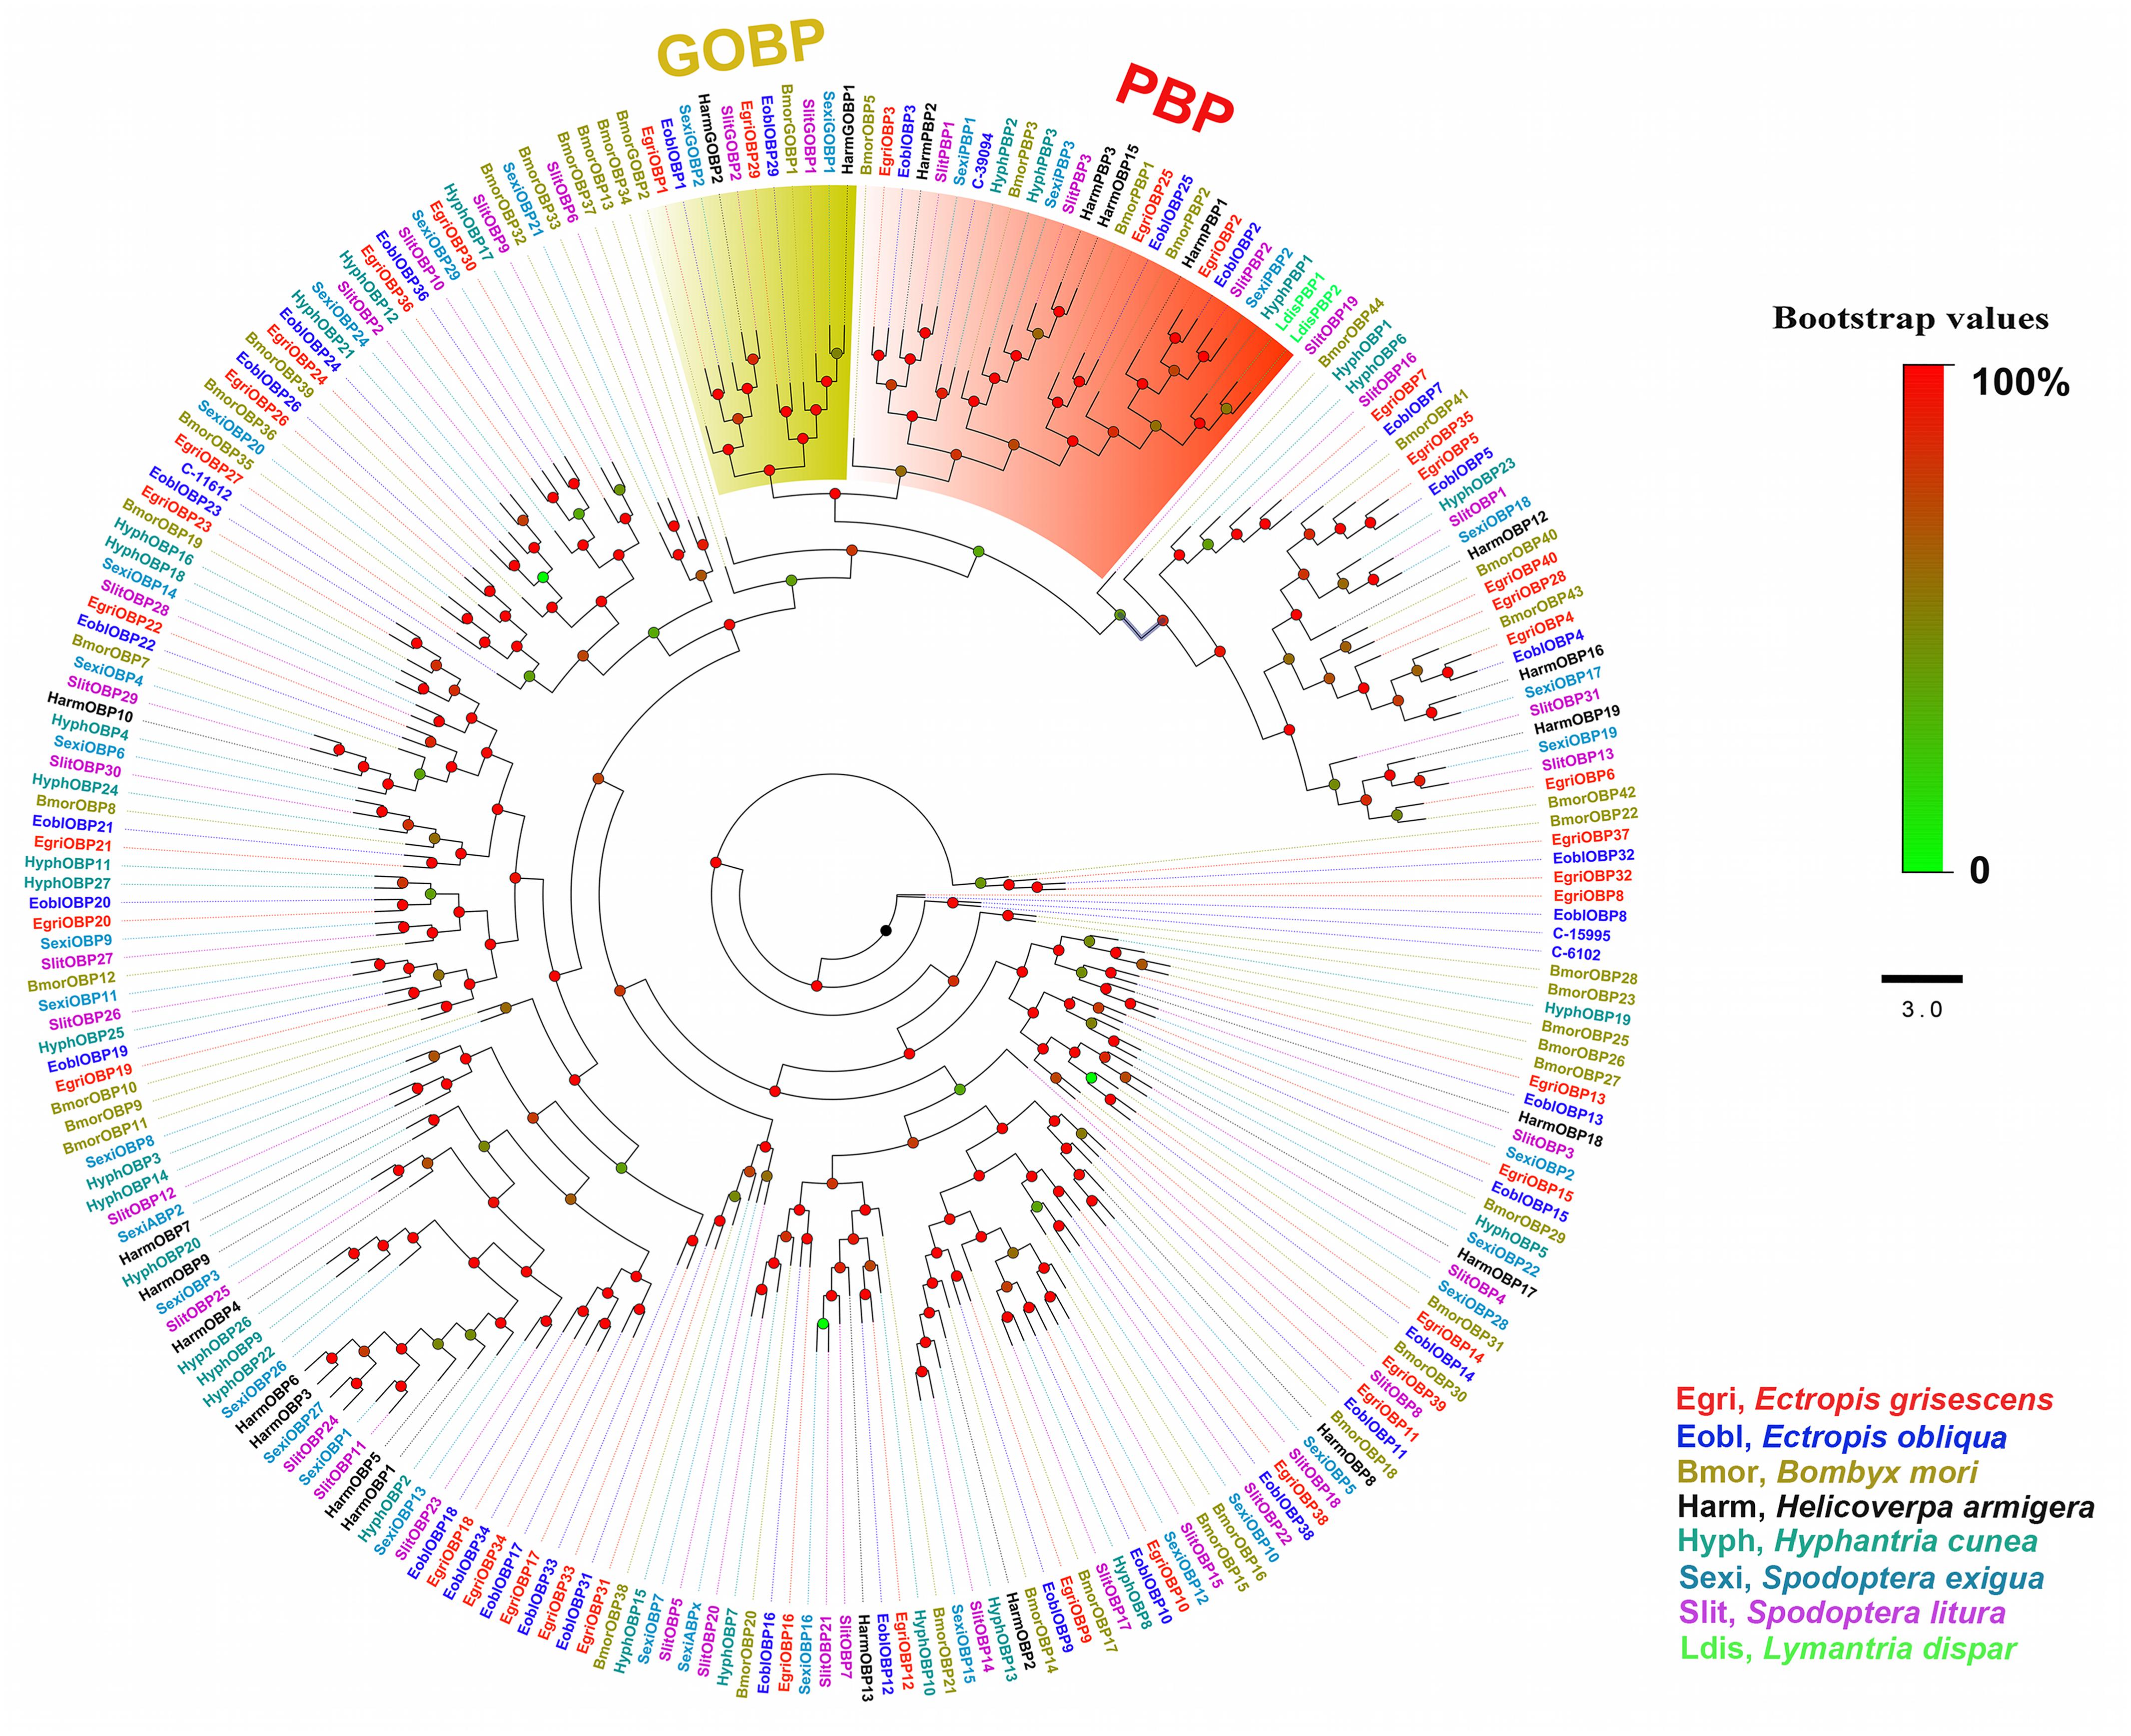
FIGURE 2. Phylogenetic analyses of EoblOBPs and EgriOBPs with the OBPs of other lepidopteran insects. GOBP and PBP subfamily are labeled. EgriOBP, OBPs from Ectropis grisescens; EoblOBP, OBPs from Ectropis obliqua; BmorOBPs, OBPs from Bombyx mori; HarmOBPs, OBPs from Helicoverpa armigera; HyphOBPs, OBPs from Hyphantria cunea; SexiOBPs, OBPs from Spodoptera exigua; SlitOBPs, OBPs from Spodoptera litura; LdisOBPs, OBPs from Lymantria dispar; Phylogenetic tree was constructed with PhyML3.1 using the maximum likelihood method.
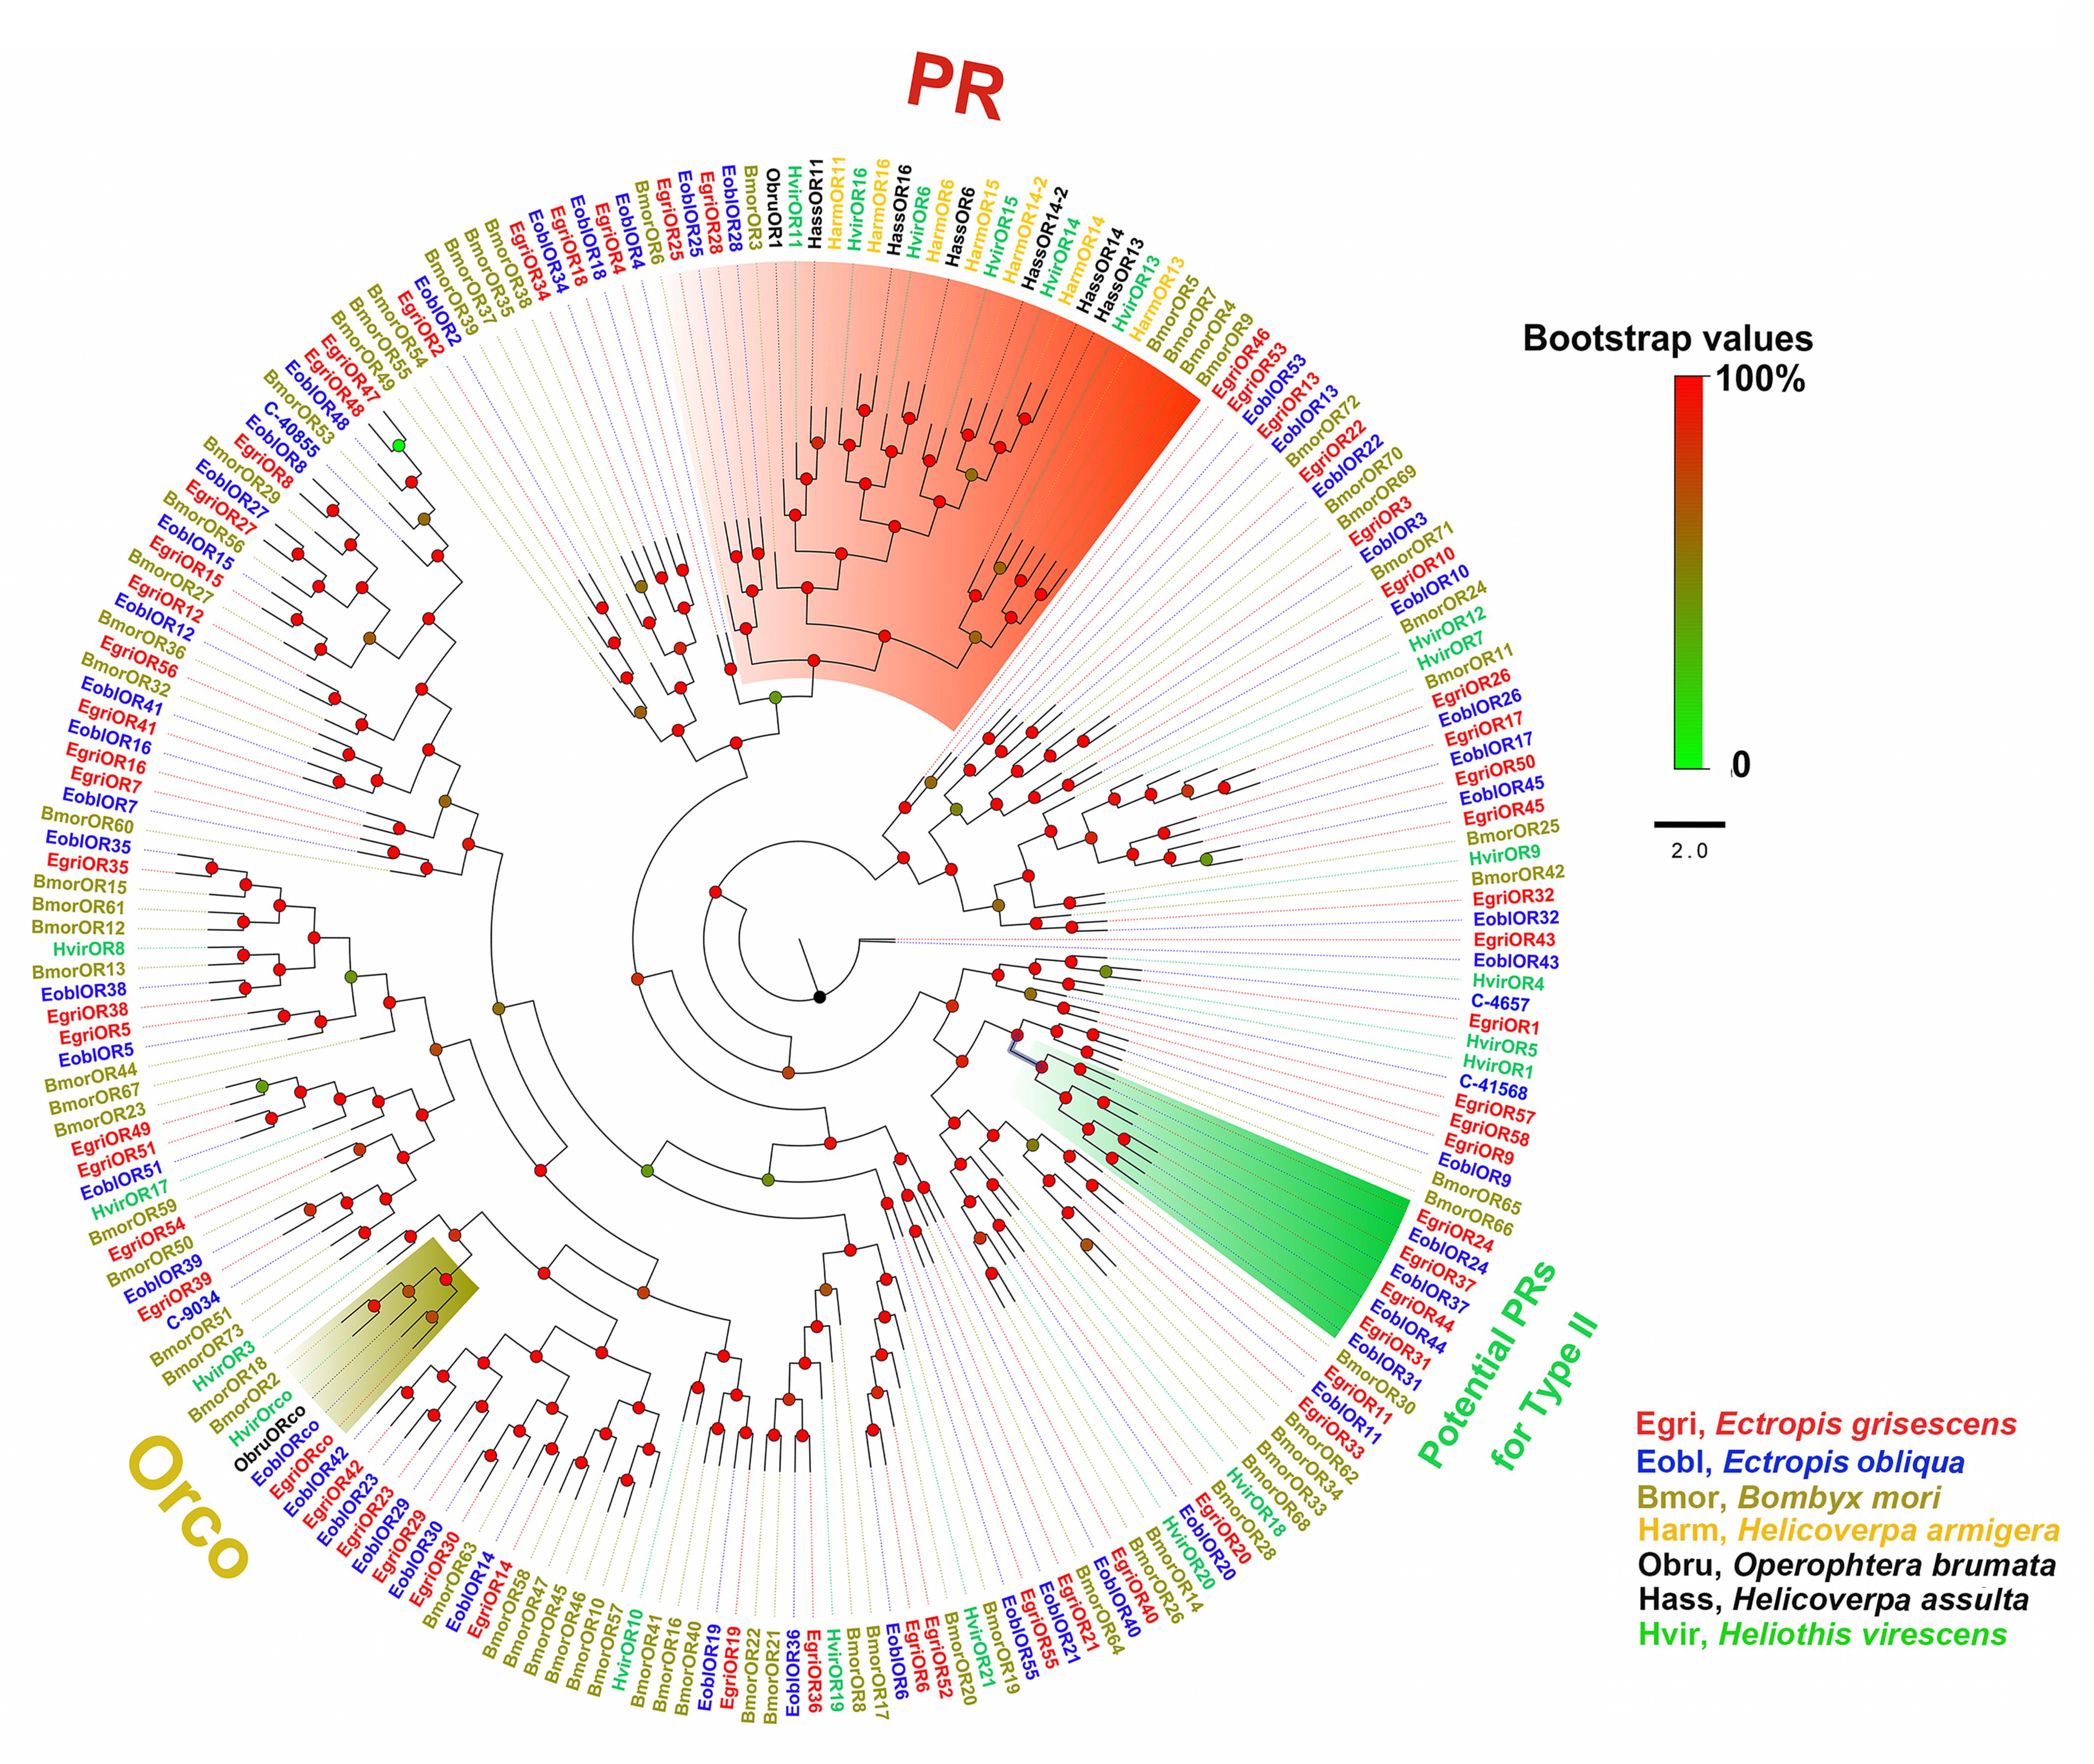
FIGURE 3. Phylogenetic analysis of EoblORs and EgriORs with ORs of other lepidopteran insects. The branches of Orco, PRs, and potential PRs for Type-II were labeled. EgriORs, ORs from Ectropis grisescens; EoblOR, ORs from Ectropis obliqua; BmorORs, ORs from Bombyx mori; HarmORs, ORs from H. armigera; ObruORs, ORs from Operophtera brumata; HassORs, ORs from H. assulta; HvirORs, ORs from Heliothis virescens. The phylogenetic tree was constructed with PhyML3.1 using maximum likelihood.
To compare the abundance of E. obliqua and E. grisescens OBP/OR in the antennae, we characterized their abundance by evaluating their RPKM values and combined these results with those of the phylogenetic analyses (Figures 4–6). We observed that most of the orthologs of E. obliqua and E. grisescens OBP/OR had similar expression levels in the antennae (Figures 4, 5). However, several orthologous genes that were more abundant in the antennae of male individuals showed different abundance in the antennae of the two Ectropis sibling species (Figure 6). E. obliqua and E. grisescens OBP2, 3, 9, 12, and 25 showed higher transcription levels in the antennae of the male individuals than in those of the females (Figure 6). Among these 10 male antenna-biased OBPs, EgriOBP2 and 3 were the two most abundant OBPs in the E. grisescens antennae, followed by EgriOBP12. However, EoblOBP12 showed the highest transcript level in the antennae, which was more than four-fold higher than the EoblOBP2 and 3 levels. Comparing the orthologous OBP2, 3, 9, 12, and 25 of E. obliqua and E. grisescens, the RPKM values of EoblOBP3, 12 and 25 were respectively 1.8-, 17.3-, and 7.9-fold higher than their orthologs, EgriOBP3, 12 and 25,. The transcript levels of OBP2 and 9 were similar in E. obliqua and E. grisescens.

FIGURE 4. Phylogenetic analysis and abundance of OBPs in Ectropis grisescens and E. obliqua. MA, male antennae; FA, female antennae. The phylogenetic tree was constructed using PhyML3.1 with maximum likelihood.
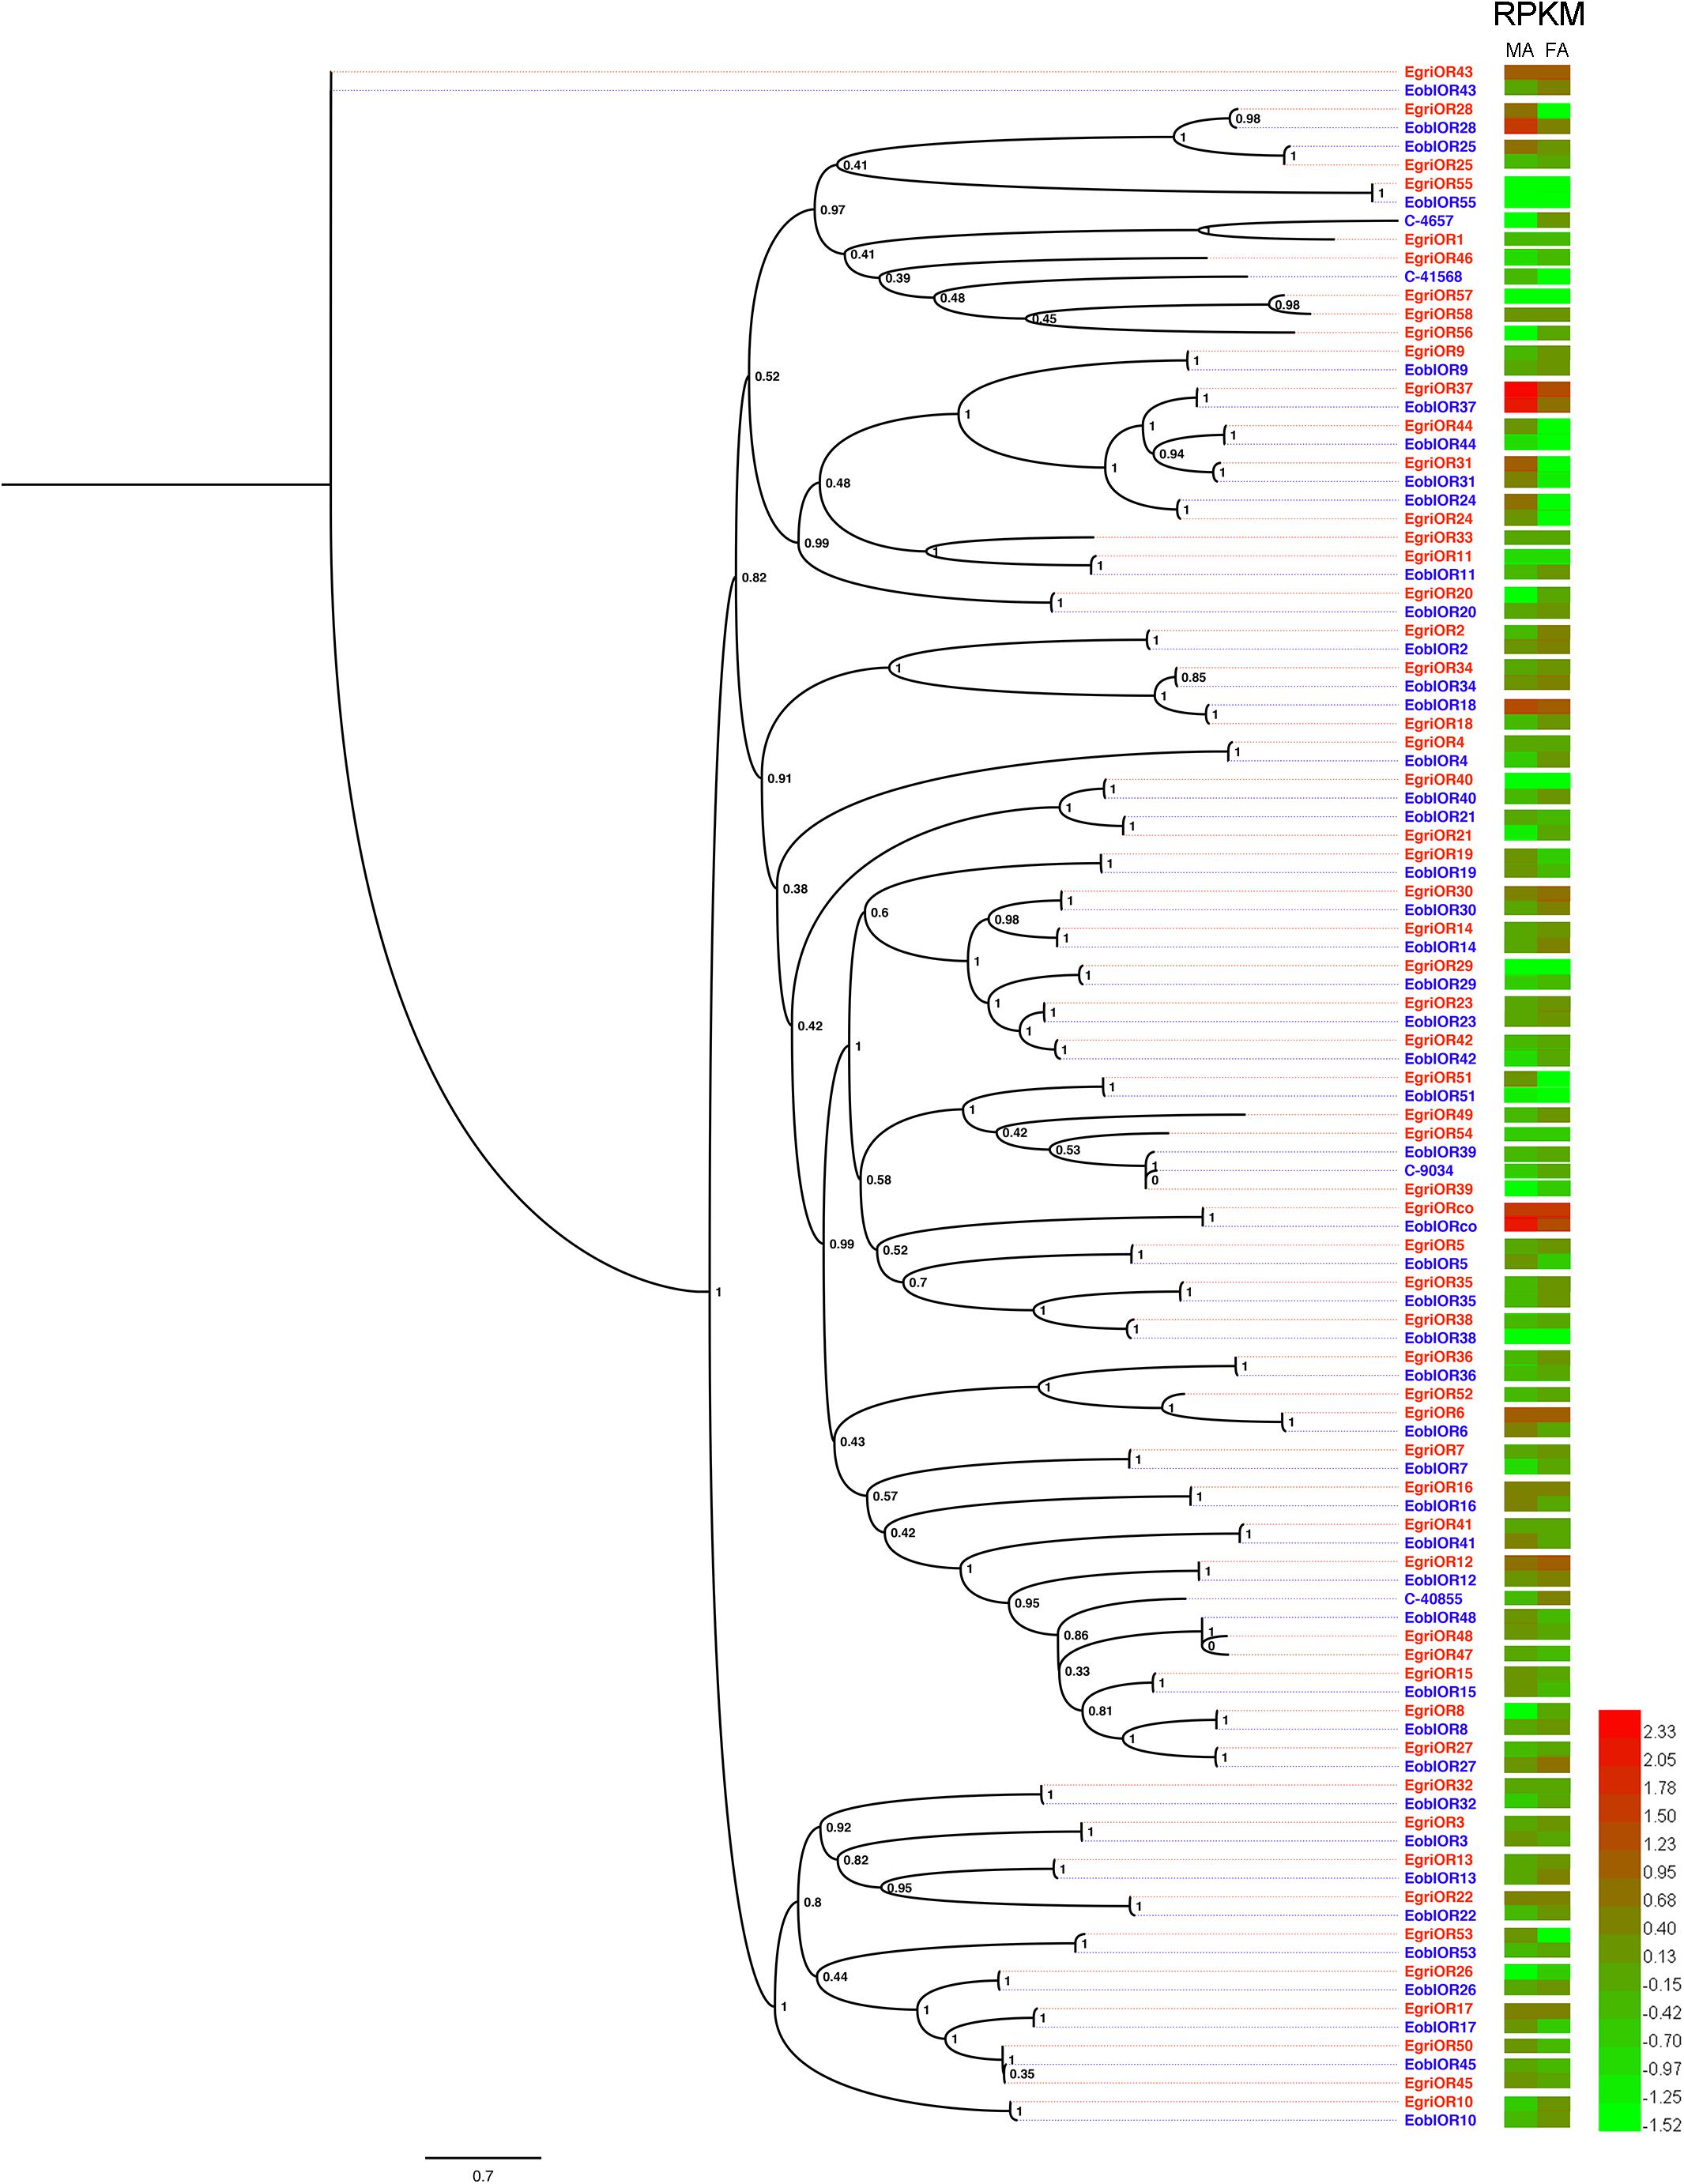
FIGURE 5. Phylogenetic analysis and abundances of ORs in Ectropis grisescens and E. obliqua. MA, male antennae; FA, female antennae. The phylogenetic tree was constructed using PhyML3.1 with maximum likelihood.
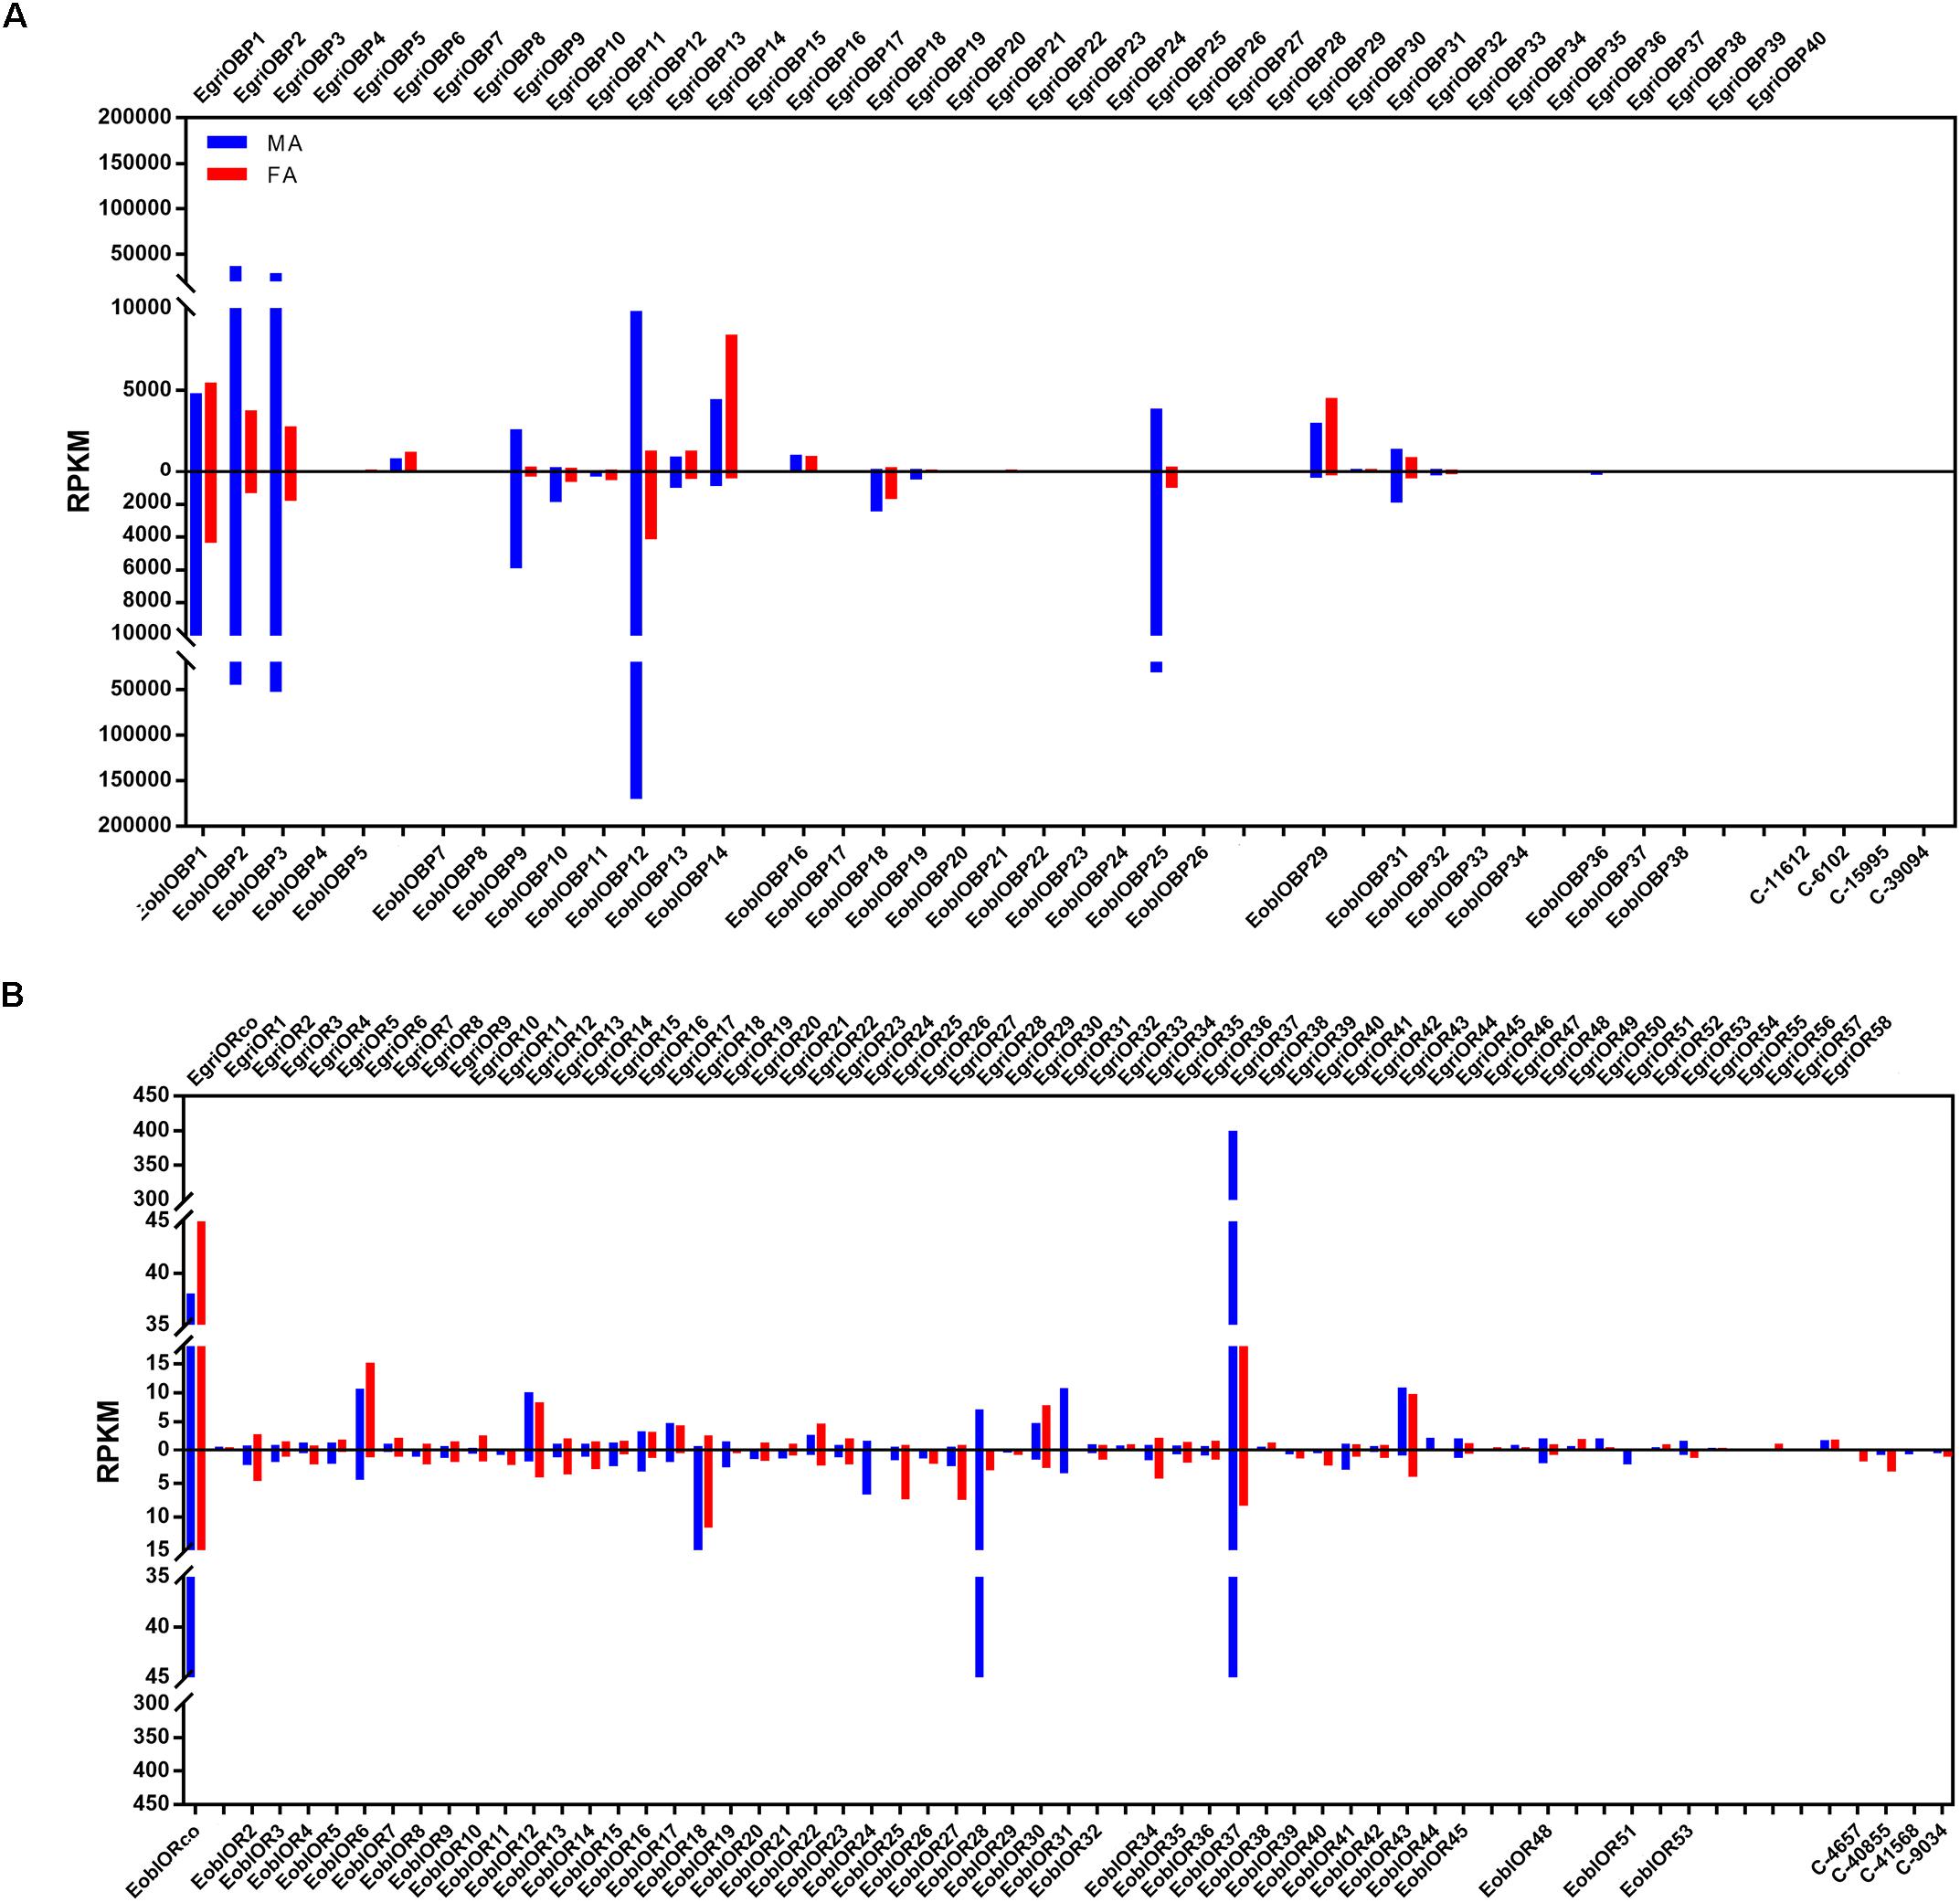
FIGURE 6. Expression levels of the selected OBP and OR genes in the antennae based on the RPKM values. (A) RPKM values of OBPs in the antennae of male and female Ectropis grisescens and E. obliqua. (B) RPKM values of ORs in the antennae of male and female E. grisescens and E. obliqua. FA, antennae of female individuals; MA, antennae of male individuals.
The analyses of the abundance of EoblOR and EgriOR mRNAs showed that ORco and OR37 showed the highest expression levels in the antennae of E. obliqua and E. grisescens (Figure 6). The E. obliqua and E. grisescens OR24, 28, 31, 37, and 44 were predominantly expressed in the antennae of the male individuals. However, the orthologs of these ORs showed different transcript levels in the two Ectropis sibling species. The RPKM values of EoblOR24 and 28 were 4.2- and 8.0-fold higher than those of their orthologous genes, EgriOR24 and 28, respectively. On the other hand, OR31, 37, and 44 showed higher expression levels in E. grisescens with RPKM values in the antennae of male E. grisescens being 3.2-, 2.6-, and 17.0-fold of the levels of their orthologs in the antennae of male E. obliqua.
Expression patterns of E. obliqua and E. grisescens OBP/OR genes in different adult tissues detected by qPCR showed that the orthologous genes of EoblOBPs and EgriOBPs had similar expression patterns (Figure 7). Most of the EoblOBPs and EgriOBPs were highly expressed in the antennae of both the female and male individuals. Among those, E. obliqua and E. grisescens OBP2, 3, 9, 12, and 25 were expressed at higher levels in the antennae of males than females. E. obliqua and E. grisescens OBP7, 21, and 33 were expressed in both female and male proboscises at relatively high levels. EoblOBP20 and EgriOBP20 were predominantly expressed in the legs of both sexes, and EoblOBP24, EgriOBP24, and EgriOBP35 were mainly expressed in the wings of both sexes. EoblOBP15 and 27, and EgriOBP15, 27, and 40 were highly expressed in male abdomens. The expression patterns of the other OBP genes were ubiquitous in most tested tissues, at relatively high levels.
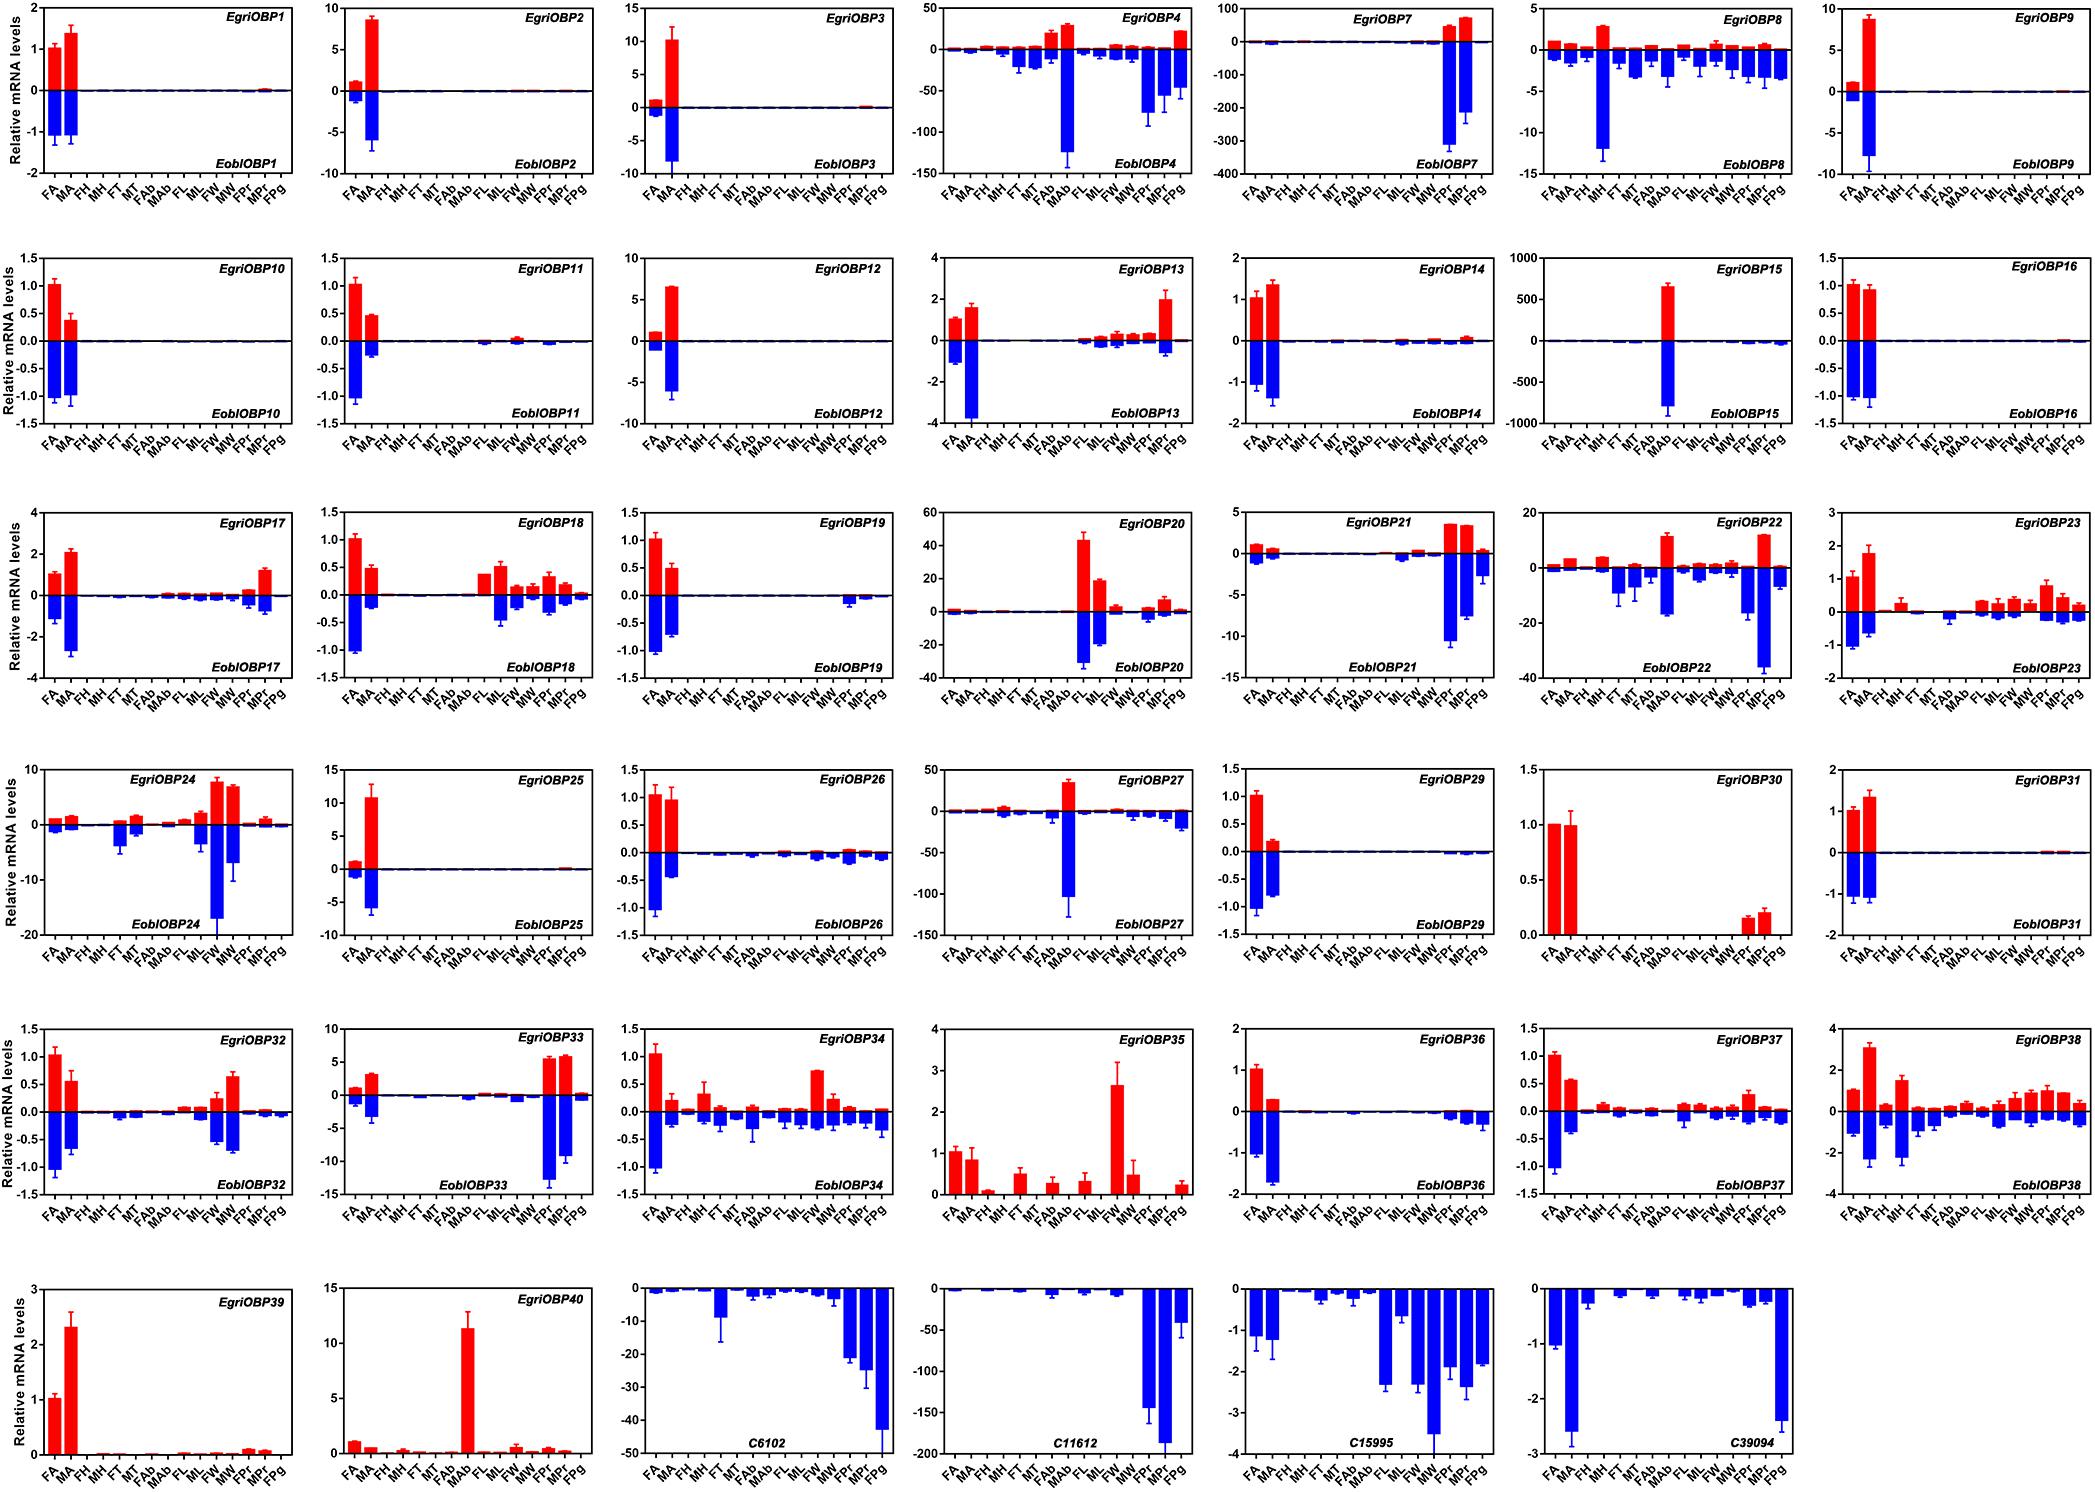
FIGURE 7. Tissue expression profiles of EgriOBPs and EoblOBPs. FA, antennae of female individuals; MA, antennae of male individuals; FH, head without antennae of female individuals; MH, head without antennae of male individuals; FT, thorax of female individuals; MT, thorax of male individuals; FAb, abdomen without pheromone gland of female individuals; MAb, abdomen of male individuals; FL, legs of female individuals; ML, legs of male individuals; FW, wings of female individuals; MW, wings of male individuals; FPr, proboscis of female individuals; MPr, proboscis of male individuals; Pg, pheromone gland.
The analyses of the expression profile of ORs showed that the orthologs of EoblORs and EgriORs also had similar profiles, as observed for EoblOBPs and EgriOBPs (Figure 8). Most of the EoblORs and EgriORs were mainly expressed in the antennae. Among the ORs showing an expression bias for the antenna, E. obliqua and E. grisescens OR24, 28, 31, 37, and 44 were more highly expressed in the antennae of males than in those of females. EoblOR7, 32, 41, and EgriOR7, 32, 41, 57, 58 were expressed in female and male heads at relatively high levels. EgriOR54 was predominantly expressed in female wings, and EgriOR55 was highly expressed in male abdomens.

FIGURE 8. Tissue expression profiles of EgriORs and EoblORs. FA, antennae of female individuals; MA, antennae of male individuals; FH, head without antennae of female individuals; MH, head without antennae of male individuals; FT, thorax of female individuals; MT, thorax of male individuals; FAb, abdomen without pheromone glands of female individuals; MAb, abdomen of male individuals; FL, legs of female individuals; ML, legs of male individuals; FW, wings of female individuals; MW, wings of male individuals; FPr, proboscis of female individuals; MPr, proboscis of male individuals; Pg, pheromone gland.
Sex pheromone-induced behavior plays crucial roles in insect reproduction. The difference in the sex pheromone components of Z3,epo6,Z9-19:H may be the major determinant for premating isolation between these two Ectropis sibling species (Ma et al., 2016c; Luo et al., 2017). This difference in the sex pheromone components indicates that these two Ectropis sibling species might differ in the detection of sex pheromones, leading to premating isolation. We identified the candidate genes for detection of E. grisescens sex pheromones and analyzed the transcriptomes of the antennae of female and male individuals of E. obliqua to identify olfactory genes potentially involved in the perception of sex pheromones, for comparison with E. grisescens.
Insect PBPs are responsible for detecting the sex pheromone components in lepidopterans (Leal, 2012). In our study, we identified 36 EoblOBPs in E. obliqua. Generally, olfactory genes involved in detecting sex pheromones were expressed at higher levels in the male antennae than in female antennae. The abundance in antennae and tissue expression profiles showed that E. obliqua and E. grisescens OBP2, 3, 9, 12, and 25 were predominantly expressed in the male antennae, with relatively high RPKM values. Among these, EoblOBP2, 3, 25 and EgriOBP2, 3, 25 were grouped in the PBP clade with another lepidopteran PBP. Therefore, OBP2, 3, and 25 from E. obliqua and E. grisescens might encode the PBPs for Type-II pheromone components. However, the abundance of OBP3 and 25 in antennae differed between E. obliqua and E. grisescens. The RPKM values of OBP3 and 25 in E. obliqua were higher than in E. grisescens. On the other hand, the amino acid sequences of OBP2, 3, and 25 in E. obliqua and E. grisescens were more than 97% identical, indicating that these three orthologous genes might have similar functions in binding and transporting sex pheromone components. Therefore, the difference in the transcript levels might be used to detect the difference in sex pheromone components of these two Ectropis sibling species. Unlike OBP2, 3, and 25, OBP12 was not grouped in the PBP clade, but it was the most abundant EoblOBP in the antennal transcriptome of male E. obliqua individuals. The RPKM value of EoblOBP12 was 17.3-fold higher than that of EgriOBP12, indicating that OBP12 might relate to sex pheromone perception in E. obliqua and E. grisescens. The GOBP2, another sub-class of OBPs, is reported to strongly bind sex pheromones in S. litura (Liu et al., 2015), B. mori (Zhou et al., 2009), and S. exigua (Liu et al., 2014). EoblOBP1 and EgriOBP1 were grouped in the GOBP2 sub-class. Consequently, we speculate that these two OBPs might be involved in the binding of sex pheromone components.
Insect PRs, a key sub-class of ORs, are specifically dedicated to the detection of sex pheromone components in the Lepidoptera (Jiang X.J. et al., 2014; Zhang et al., 2014; Chang et al., 2015). In our previous study, we found that EgriOR25 and 28 were grouped in the PR clade with PRs for Type-I sex pheromone components and four male antenna-biased EgriORs (EgriOR24, 31, 37, and 44) formed an independent group in the phylogenetic analysis (Li et al., 2017). Of these four male antenna-biased EgriORs, EgriOR31 responded robustly to Z3,epo6,Z9-18:H but weakly to Z3,Z6,Z9-18:H (Li et al., 2017). Because PRs are a conserved sub-class of OR, EgriOR24, 25, 28, 31, 37, and 44 might be potential PRs of E. grisescens. In present study, EoblOR25 and 28 were grouped with EgriOR25, 28, ObruOR1, and PRs of B. mori, H. armigera, H. assulta, and H. virescens, and EoblOR24, 31, 37, and 44 were grouped with EgriOR24, 31, 37, and 44. The results of tissue expression profiles indicate that EoblOR24, 25, 28, 31, 37, and 44 had similar expression patterns with EgriOR24, 25, 28, 31, 37, and 44, with these more highly expressed in the male antennae than in other tissues. Therefore, the number of potential PRs that we identified in E. obliqua was the same as in E. grisescens. Moreover, the sequence identity matches of OR24, 25, 28, 31, 37, and 44 between E. obliqua and E. grisescens were greater than 90%. Among these, the identity between EoblOR37 and EgriOR37 was as high as 99.29%. The high degree of similarity in sequence identities and tissue expression patterns indicate that these orthologous genes might play similar roles in the detection of sex pheromones. The equal number and high identity of PRs between these two Ectropis sibling species implies that the differences in the detection of sex pheromones might occur at the transcription state.
We determined the RPKM values of OR24, 28, 31, 37, and 44 to characterize their abundance in the antennae of E. obliqua and E. grisescens. These values showed that the abundance of these ORs in the antennae differed between E. obliqua and E. grisescens. EoblOR24 and 28 showed much higher transcript levels than EgriOR24 and 28, while, the transcript levels of EoblOR31, 37, and 44 were much lower than those of EgriOR31, 37, and 44. The differences in the transcript levels of OR24, 28, 31, 37, and 44 between E. obliqua and E. grisescens might relate to the recognition of different sex pheromones. Because E. obliqua and E. grisescens (Jiang N. et al., 2014; Zhang G.H. et al., 2016) underwent sympatric speciation, the males of these two Ectropis sibling species must recognize females of their own species by correctly differentiating the sex pheromones of E. obliqua and E. grisescens. This means that the E. grisescens male can detect Z3,epo6,Z9-19:H, the sex pheromone of E. obliqua. Therefore, it is understandable that these two Ectropis sibling species have an equal number of PRs with high identities, and regulation of the transcript levels of PRs might be selected by the two species to differentiate the difference in their sex pheromone components. Further research about the functions of E. obliqua and E. grisescens OBP1, 2, 3, 9, 12, and 25 and OR24, 25, 28, 31, 37, and 44 in the detection of sex pheromones is required to understand how these two Ectropis sibling species recognize the differences of their sex pheromone components.
Z-QL and Z-MC conceived and designed the experiments. Z-QL performed the experiments and wrote the manuscript. Z-QL, X-MC, Z-XL, LB, Z-JX, BC, and YL analyzed the data. All authors reviewed the final manuscript.
This study was funded by the National Key Research & Development (R&D) Plan (2016YFD0200900), the National Natural Science Foundation of China (31701795), the Modern Agricultural Industry Technology System (CARS-23), and the Central Public-Interest Scientific Institution Basal Research Fund (1610212018011).
The authors declare that the research was conducted in the absence of any commercial or financial relationships that could be construed as a potential conflict of interest.
The Supplementary Material for this article can be found online at: https://www.frontiersin.org/articles/10.3389/fphys.2018.01602/full#supplementary-material
Anders, S., and Huber, W. (2010). Differential expression analysis for sequence count data. Genome Biol. 11:R106. doi: 10.1186/gb-2010-11-10-r106
Ando, T., Inomata, S., and Yamamoto, M. (2004). Lepidopteran sex pheromones. Top. Curr. Chem. 239, 951–961. doi: 10.1007/b95449
Bustin, S. A., Benes, V., Garson, J. A., Hellemans, J., Huggett, J., Kubista, M., et al. (2009). The MIQE guidelines: minimum information for publication of quantitative real-time PCR experiments. Clin. Chem. 55, 611–622. doi: 10.1373/clinchem.2008.112797
Chang, H. T., Liu, Y., Yang, T., Pelosi, P., Dong, S. L., and Wang, G. R. (2015). Pheromone binding proteins enhance the sensitivity of olfactory receptors to sex pheromones in Chilo suppressalis. Sci. Rep. 5:13093. doi: 10.1038/srep13093
Conesa, A., Gotz, S., Garcia-Gomez, J. M., Terol, J., Talon, M., and Robles, M. (2005). Blast2GO: a universal tool for annotation, visualization and analysis in functional genomics research. Bioinformatics 21, 3674–3676. doi: 10.1093/bioinformatics/bti610
Grabherr, M. G., Haas, B. J., Yassour, M., Levin, J. Z., Thompson, D. A., Amit, I., et al. (2011). Full-length transcriptome assembly from RNA-Seq data without a reference genome. Nat. Biotechnol. 29, 644–U130. doi: 10.1038/Nbt.1883
Guindon, S., Dufayard, J. F., Lefort, V., Anisimova, M., Hordijk, W., and Gascuel, O. (2010). New algorithms and methods to estimate maximum-likelihood phylogenies: assessing the performance of PhyML 3.0. Syst. Biol. 59, 307–321. doi: 10.1093/sysbio/syq010
Jiang, N., Liu, S. X., Xue, D. Y., Tang, M. J., Xiao, Q., and Han, H. X. (2014). External morphology and molecular identification of two tea geometrid moth from southern China. Chin. J. Appl. Entomol. 51, 987–1002.
Jiang, X. J., Guo, H., Di, C., Yu, S. L., Zhu, L. G., Huang, L. Q., et al. (2014). Sequence similarity and functional comparisons of pheromone receptor orthologs in two closely related Helicoverpa species. Insect Biochem. Mol. Biol. 48, 63–74. doi: 10.1016/j.ibmb.2014.02.010
Jin, J. Y., Li, Z. Q., Zhang, Y. N., Liu, N. Y., and Dong, S. L. (2014). Different roles suggested by sex-biased expression and pheromone binding affinity among three pheromone binding proteins in the pink rice borer, Sesamia inferens (Walker) (Lepidoptera: Noctuidae). J. Insect Physiol. 66, 71–79. doi: 10.1016/j.jinsphys.2014.05.013
Katoh, K., and Standley, D. M. (2013). MAFFT multiple sequence alignment software version 7: improvements in performance and usability. Mol. Biol. Evol. 30, 772–780. doi: 10.1093/molbev/mst010
Larkin, M. A., Blackshields, G., Brown, N. P., Chenna, R., McGettigan, P. A., McWilliam, H., et al. (2007). Clustal W and Clustal X version 2.0. Bioinformatics 23, 2947–2948. doi: 10.1093/bioinformatics/btm404
Leal, W. S. (2012). Odorant reception in insects: roles of receptors,binding proteins, and degrading enzymes. Annu. Rev. Entomol. 58, 373–463. doi: 10.1146/annurev-ento-120811153635
Li, Z.-Q., Luo, Z.-X., Cai, X.-M., Bian, L., Xin, Z.-J., Liu, Y., et al. (2017). Chemosensory gene families in Ectropis grisescens and candidates for detection of Type-II sex pheromones. Front. Physiol. 8:953. doi: 10.3389/fphys.2017.00953
Liu, N. Y., Yang, F., Yang, K., He, P., Niu, X. H., Xu, W., et al. (2014). Two subclasses of odorant-binding proteins in Spodoptera exigua display structural conservation and functional divergence. Insect Mol. Biol. 24, 167–182. doi: 10.1111/imb.12143
Liu, N. Y., Yang, K., Liu, Y., Xu, W., Anderson, A., and Dong, S. L. (2015). Two general-odorant binding proteins in Spodoptera litura are differentially tuned to sex pheromones and plant odorants. Comp. Biochem. Physiol. A Mol. Integr. Physiol. 180, 23–31. doi: 10.1016/j.cbpa.2014.11.005
Livak, K. J., and Schmittgen, T. D. (2001). Analysis of relative gene expression data using real-time quantitative PCR and the 2(-Delta Delta C(T)) Method. Methods 25, 402–408. doi: 10.1006/meth.2001.1262
Luo, Z. X., Li, Z. Q., Cai, X. M., Bian, L., and Chen, Z. M. (2017). Evidence of premating isolation between two dibling moths: Ectropis grisescens and Ectropis obliqua (Lepidoptera: Geometridae). J. Econ. Entomol. 110, 2364–2370. doi: 10.1093/jee/tox216
Ma, L., Bian, L., Li, Z. Q., Cai, X. M., Luo, Z. X., and Chen, Z. M. (2016a). Ultrastructure of Chemosensilla on Antennae and Tarsi of Ectropis obliqua (Lepidoptera: Geometridae). Ann. Entomoll. Soc. Am. 109, 574–584. doi: 10.1093/aesa/saw027
Ma, L., Li, Z. Q., Bian, L., Cai, X. M., Luo, Z. X., Zhang, Y. J., et al. (2016b). Identification and comparative study of chemosensory genes related to host selection by legs transcriptome analysis in the tea geometrid Ectropis obliqua. PLoS One 11:e0149591. doi: 10.1371/journal.pone.0149591
Ma, T., Xiao, Q., Yu, Y. G., Wang, C., Zhu, C. Q., Sun, Z. H., et al. (2016c). Analysis of tea geometrid (Ectropis grisescens) pheromone gland extracts using GC-EAD and GCxGC/TOFMS. J. Agric. Food Chem. 64, 3161–3166. doi: 10.1021/acs.jafc.6b00339
Millar, J. G. (2000). Polyene hydrocarbons and epoxides: a second major class of lepidopteran sex attractant pheromones. Annu. Rev. Entomol. 45, 575–604. doi: 10.1146/annurev.ento.45.1.575
Mortazavi, A., Williams, B. A., McCue, K., Schaeffer, L., and Wold, B. (2008). Mapping and quantifying mammalian transcriptomes by RNA-Seq. Nat. Methods 5, 621–628. doi: 10.1038/nmeth.1226
Pelosi, P., Iovinella, I., Felicioli, A., and Dani, F. R. (2014). Soluble proteins of chemical communication: an overview across arthropods. Front. Physiol. 5:320. doi: 10.3389/fphys.2014.00320
Sun, M., Liu, Y., and Wang, G. (2013). Expression patterns and binding properties of three pheromone binding proteins in the diamondback moth, Plutella xyllotella. J. Insect Physiol. 59, 46–55. doi: 10.1016/j.jinsphys.2012.10.020
Xi, Y., Yin, K. S., and Xiao, Q. (2011). The susceptibility difference against EoNPV in different geographic populations of tea geometrid (Ectropis oblique Prout). J. Tea Sci. 31, 100–104.
Yang, Y. Q., Zhang, L. W., Guo, F., Long, Y. H., Wang, Y., and Wan, X. C. (2016). Reidentification of sex pheromones of tea geometrid Ectropis obliqua prout (Lepidoptera: Geometridae). J. Econ. Entomol. 109, 167–175. doi: 10.1093/jee/tov282
Ye, J., Fang, L., Zheng, H., Zhang, Y., Chen, J., Zhang, Z., et al. (2006). WEGO: a web tool for plotting GO annotations. Nucleic Acids Res. 34, W293–W297. doi: 10.1093/nar/gkl031
Zhang, D. D., Wang, H. L., Schultze, A., Fross, H., Francke, W., Krieger, J., et al. (2016). Receptor for detection of a Type II sex pheromone in the winter moth Operophtera brumata. Sci. Rep. 6:18576. doi: 10.1038/srep18576
Zhang, G. H., Yuan, Z. J., Yin, K. S., Fu, J. Y., Tang, M. J., and Xiao, Q. (2016). Asymmetrical reproductive interference between two sibling species of tea looper: Ectropis grisescens and Ectropis obliqua. Bull. Entomol. Res. doi: 10.1017/s0007485316000602 [Epub ahead of print].
Zhang, Y. N., Zhang, J., Yan, S. W., Chang, H. T., Liu, Y., Wang, G. R., et al. (2014). Functional characterization of sex pheromone receptors in the purple stem borer. Sesamia inferens (Walker). Insect Mol. Biol. 23, 611–620. doi: 10.1111/imb.12109
Zhou, J. J. (2010). Odorant-binding proteins in insects. Vitam. Horm. 83, 241–272. doi: 10.1016/S0083-6729(10)83010-9
Zhou, J. J., Robertson, G., He, X. L., Dufour, S., Hooper, A. M., Pickett, J. A., et al. (2009). Characterisation of Bombyx mori odorant-binding proteins reveals that a general odorant-binding protein discriminates between sex pheromone components. J. Mol. Biol. 389, 529–545. doi: 10.1016/j.jmb.2009.04.015
Keywords: transcriptomic analysis, olfaction gene, sex pheromone perception, Ectropis grisescens, Ectropis obliqua
Citation: Li Z-Q, Cai X-M, Luo Z-X, Bian L, Xin Z-J, Chu B, Liu Y and Chen Z-M (2018) Comparison of Olfactory Genes in Two Ectropis Species: Emphasis on Candidates Involved in the Detection of Type-II Sex Pheromones. Front. Physiol. 9:1602. doi: 10.3389/fphys.2018.01602
Received: 26 May 2018; Accepted: 25 October 2018;
Published: 14 November 2018.
Edited by:
Nicolas Durand, Sorbonne Université, FranceReviewed by:
Hao Guo, Chinese Academy of Sciences, ChinaCopyright © 2018 Li, Cai, Luo, Bian, Xin, Chu, Liu and Chen. This is an open-access article distributed under the terms of the Creative Commons Attribution License (CC BY). The use, distribution or reproduction in other forums is permitted, provided the original author(s) and the copyright owner(s) are credited and that the original publication in this journal is cited, in accordance with accepted academic practice. No use, distribution or reproduction is permitted which does not comply with these terms.
*Correspondence: Zhao-Qun Li, enFsaUB0cmljYWFzLmNvbQ== Zong-Mao Chen, em1jaGVuMjAwNkAxNjMuY29t
Disclaimer: All claims expressed in this article are solely those of the authors and do not necessarily represent those of their affiliated organizations, or those of the publisher, the editors and the reviewers. Any product that may be evaluated in this article or claim that may be made by its manufacturer is not guaranteed or endorsed by the publisher.
Research integrity at Frontiers
Learn more about the work of our research integrity team to safeguard the quality of each article we publish.