
95% of researchers rate our articles as excellent or good
Learn more about the work of our research integrity team to safeguard the quality of each article we publish.
Find out more
ORIGINAL RESEARCH article
Front. Phys. , 17 March 2025
Sec. Physical Acoustics and Ultrasonics
Volume 13 - 2025 | https://doi.org/10.3389/fphy.2025.1554969
This paper introduces the concept of the intrinsic-noise-atom (i.e., intrinsic-noise-element) and its applications. We propose a method to extract intrinsic noise generated within viscous solids and discuss its impact on material exploration and analysis. The analysis is designed to improve our ability to explore viscous material, enhancing the inversion of physical formation characteristics in acoustic logging while drilling. We show that under a harmonic single-frequency force, the medium viscosity and the particles’ inertia inside the viscous solids lead to a transient process from the static state to the stable state of a harmonic single-frequency vibration. The spectrum corresponding to this transient process reveals information on the intrinsic noise within viscous solids. A damped oscillatory spring model of particle vibration corresponding to longitudinal wave propagation is established, and the acoustic impulse response and system function are obtained, where we can extract the intrinsic noise signal from the vibration state generated by the particle under the action of harmonic single-frequency force. Based on a representative frequency spectrum, the characteristics of the physical formation around the drilled oil well can be retrieved to determine whether it is a hydrocarbon reservoir and if there are deformations, such as fractures, or if it is in good condition. With its reliability, this method can effectively extract the intrinsic noise and successfully retrieve the characteristics of the physical formation of solid media.
Owing to the particle’s inertia and medium viscosity within viscous solids, a stationary particle undergoes a critical transition from a static state to a stable harmonic single-frequency vibration under a harmonic single-frequency force. The spectrum associated with this transient transition process corresponds to the intrinsic noise generated by the vibrating particle. We define the intrinsic noise produced by a harmonic single-frequency force acting on a particle as an “intrinsic-noise-atom.” Based on the principles of linear superposition and Fourier transform, the intrinsic noise induced by multifrequency forces can be considered as the superposition of intrinsic-noise-atoms caused by each harmonic frequency component of the multifrequency force. The combination or superposition of different intrinsic-noise-atoms can constitute the intrinsic noise generated by any complex multifrequency force applied to a particle. Studying the intrinsic-noise-atom is crucial in understanding the complex vibrational particle behavior and the propagation property of waves in viscous solids. Intrinsic noise is a natural physical phenomenon of particle vibration in viscous solids under external disturbances. At the same time, the intrinsic-noise-atom is a key concept and a critical factor in acoustic measurement for practical applications.
The physical properties and microstructures of different solid media exhibit distinct characteristics. For instance, when the harmonic single-frequency force is applied to particles inside different mediums or objects, the transient transition processes generated during their vibrations, along with the corresponding spectra and central frequencies, vary accordingly. Consequently, the information conveyed by intrinsic-noise-atoms (or intrinsic noise) is helpful to infer the physical properties of the media and their internal structures.
Extensive research has been conducted on intrinsic-noise-atom or intrinsic noise at the micro/macro scale, leading to applications across various fields. Based on frequency domain analysis, Michael et al. described a frequency-domain technique for analyzing intrinsic noise generated in negatively self-regulating genetic circuits [1]. Ramaswamy et al. studied how intrinsic spectral noise affects mesoscopic oscillating chemical reactions [2]. Alex et al. introduced an extended mathematical framework for analyzing classical intrinsic/extrinsic noise [3]. Jangir et al. demonstrated that intrinsic randomness in biochemical reactions (intrinsic noise) and variability in cellular states (extrinsic noise) reduce information transfer through signaling networks [4]. Villegas et al. investigated intrinsic noise and critical deviation in Boolean gene regulatory networks [5]. Hong et al. highlighted that acoustic stress and wave resonance play crucial roles in plasma bubbles, providing novel approaches for sustainable chemical processes [6]. Fa and Zhao also reported intrinsic noise generated during the vibration of particles in viscous media and piezoelectric transducers, along with its potential applications [7].
The transient transition process and the intrinsic noise generated by the whole motion of some objects have also been studied. Piquette theoretically and experimentally studied the transient response of piezoelectric transducers, revealing that harmonic single-frequency voltage excitation of piezoelectric transducers produces a transient process from a stationary state to a steady harmonic single-frequency vibration [8, 9]. Similarly, Fa and Zhao et al. confirmed the transient process of piezoelectric transducers transitioning from stationary to steady harmonic single-frequency vibration under harmonic single-frequency electrical excitation [10–13]. The frequency spectrum corresponding to this transient process represents the intrinsic noise generated during the vibration of the transducer. They verified the existence of the intrinsic-noise-atom generated by the piezoelectric transducer. Fa and Zhao at al. Have also experimentally confirmed the presence of intrinsic noise generated during piezoelectric transducers’ vibration when excited by a multifrequency electric-voltage signal [14]. Zha et al. studied novel piezoelectric surface and bulk acoustic wave resonators for communication technologies, which also involved intrinsic noise applications [15].
The transient responses of piezoelectric transducers with mechanical loads have also been investigated. Moon et al. found that the center frequency of a piezoelectric transducer varies with the mechanical load and environmental conditions. They proposed a method to track the resonant frequency by using the transient characteristics of the transducer [16]. Wang et al. studied the relationship between the central frequency of intrinsic noise and the early strength development of cement mortar by using piezoelectric transducers. Their findings showed that the central frequency of intrinsic noise is related to the properties of the cement mortar surrounding the transducer, which represents the combined response of the mechanical load of cement mortar and the electric-acoustic (or acoustic-electric) conversion of the piezoelectric transducer [17].
From the foregoing analysis and discussion, it is evident that whether considering a particle within a viscous solid medium, a composite structure formed by two media, or an entire object, any alteration in their motion state due to external perturbations will generate associated intrinsic noise. The transient process of harmonic states and the corresponding spectra are influenced by the medium’s viscosity, density, stiffness, and other properties, as well as the geometry of the particle or object.
The concept of the intrinsic-noise-atom holds significant implications for the forward modeling of intrinsic noise and for inverting physical properties of the measured medium and its geometric structure using the intrinsic noise information contained within acoustic signals. Leveraging the matching pursuit algorithm [19, 20], Zhang and Castagna developed a wavelet dictionary for seismic exploration signals derived from the well logging data. They used logging data from several oil wells (including density and acoustic velocity) and specialized algorithms to construct a wavelet dictionary for seismic exploration signals. By matching and tracking the recorded seismic exploration data against the basic wavelet element in this wavelet dictionary, they successfully reconstructed information on the characteristics and structures of underground rock formations (such as reflection coefficient sequences), aiding in the search for hydrocarbon reservoirs [21, 22]. We propose replacing the logging data with intrinsic noise data from limited acoustic signals that measure homogeneous or heterogeneous media with varying internal structures. Employing algorithms of interpolation, extrapolation, scaling and squeeze/stretch of frequency, we also can construct a dictionary of intrinsic-noise-atoms by using some intrinsic noises generated from vibration particles in media with diverse physical properties and structures [19]. This intrinsic noise dictionary and the intrinsic noise extracted from the measured acoustic signal are then used for matching-pursuing and iterative calculations to reconstruct the physical characteristics (such as reflection coefficients and acoustic velocities) and internal structure of the measured medium. Meanwhile, the intrinsic noise extracted from acoustic signals and density data measured by Logging while drilling (LWD) are valuable elements for reconstructing the acoustic wave propagation velocity in the formation.
This allows for the accurate acquisition of formation wave first arrivals and enables the inversion of formation properties around the drilled well using spectral information. It helps determine whether reservoirs and fractures are present, as well as oil/gas content and evaluates the cement bond quality of the cased well. Although substantial research has been conducted on intrinsic noise, the physical mechanisms of its generation still require study, and its potential applications merit further exploration, such as the study of intrinsic noise provides one of the essential conditions for the parallel/series acoustic lumped particle vibrational transmission network model which can describe the whole acoustic measurement process more accurately from the physical mechanism.
The vibrating “particles” in acoustics are fundamental tangible substances with mass and energy. When the harmonic single-frequency force compelling the particle to vibrate near its equilibrium position in a viscous solid suddenly disappears, the amplitude of the particle’s vibration diminishes over time due to energy dissipation from frictional resistance force. When a harmonic single-frequency force is applied to the stationary particle in a viscous solid, a particle transitions from stationary to stable harmonic single-frequency vibration due to the particle’s inertia and the medium’s viscosity.
Therefore, in addition to the frequency component of the steady-state harmonic single-frequency vibration, the particle vibration also contains the frequency component corresponding to the transient process of the particle vibration, i.e., the frequency component of the intrinsic noise.
Damping can be used to measure the attenuation of a particle’s vibration amplitude inside a medium near its equilibrium position as time increases. Then, we may analyze the intrinsic noise corresponding to the transient process experienced by the vibration of a particle inside a viscous solid.
Particle vibration in a viscous medium will be affected by frictional resistance force. The magnitude of this frictional resistance is not only related to the viscosity of the medium but also to the geometric shape and size of the object, the mode of movement, and the speed. For instance, when a small ball moves within a viscous liquid at a constant speed, it encounters a frictional resistance force,
In Equation 1, the frictional resistance force is proportional to friction resistance (
Considering particle vibration in viscous solid media, let’s assume the particles behave like tiny balls with a constant radius. During their vibrational motion, the influence of the geometric parameter of particles on the friction resistance remains unchanged. The key impact factors are the vibration speed and viscosity of the solid media. In analogy to Equation 1, we assume that the frictional resistance force of the vibrating particles in the viscous solid medium is proportional to the vibration speed and the viscosity coefficient of the medium surrounding the particles, and the direction of the frictional resistance force is opposite to that of movement of the particles.
The P-wave corresponds to the compression and extension strain of the solid medium. Elastic damping is a complex phenomenon associated with the strain mode within a solid medium caused by the vibration of the particles. When the particle vibrates, the size and density of the volume element in a solid medium will change. As shown in Figure 1A, the compression deformation of the uniform compression rod, we will use such a model to analyze the particle vibration process corresponding to the P-wave. As shown in Figure 1B, the compression strain of the compression rod is equivalent to a spring oscillator model. Assume that the length of the spring when the particle is in the equilibrium position is
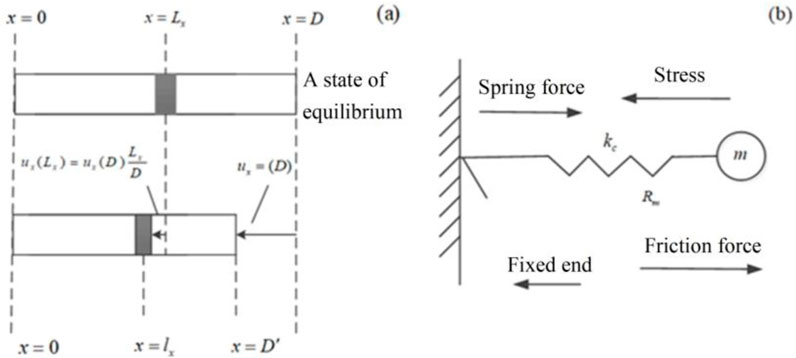
Figure 1. Mechanical analogy model of particle damped vibration corresponding to P-wave: (a) Compression deformation of a uniformly compressed rod; (b) Equivalent spring oscillator.
Assuming that the P-wave propagates along the x-axial direction, the displacement direction of the particle corresponding to the P-wave is parallel to the x-axial direction, which is the horizontal direction in Figure 1B. In such a spring oscillator model of compression/extension strain, the particle is initially at the equilibrium position with the length of the spring
As shown in Figure 1, in addition to the ideal microscopic elastic force, the vibrating particles in the viscous solid medium are also subject to frictional resistance force (
The particle displacement corresponding to the P-wave is
For a given stiffness coefficient (
When a harmonic single-frequency external force (
In accordance with Newton’s Second Law and Equation 5, we can derive a second-order linear differential equation with constant coefficients that describes the motion of a particle as follows,
The displacement velocity of the particle (
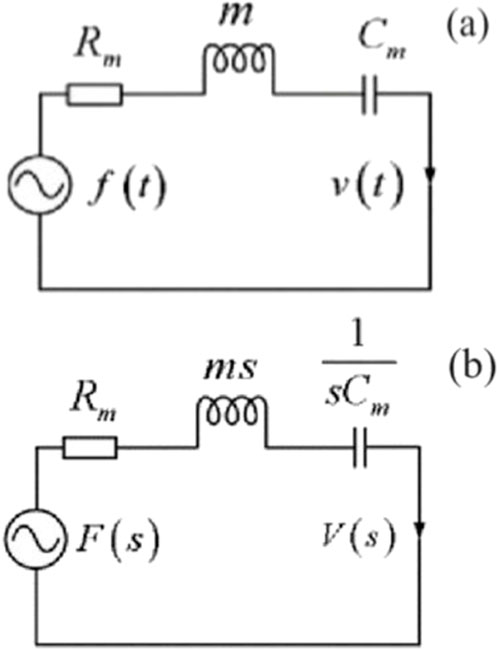
Figure 2. Equivalent mechanical network of particle motion in viscous solids: (a) Time domain; (b) s-domain.
The displacement velocity (
Using the residue theorem, we can get the analytical expression of the mechanical network impulse response corresponding to the particle motion in the time domain as follows,
where, N is the number of singular points of system function (
here
Equation 10 would provide a few different potential solutions.
1) There are two different real roots [
where
This solution indicates that the particle in a viscous solid medium is in an overdamped physical state, which is not a solution for the particle being in a vibrational state.
2) The system is in the case of two identical real roots where [
where
The mechanical network impulse response is in exponential decay with time, indicating that the particle system in the viscous solid medium is in a critical damping state, which is also not a solution that conforms to the actual particle vibration.
3) There is a pair of conjugate complex roots [
where
Equations 11, 12 are not solutions in practical physical sense. Equation 13 indicates that the particle system is underdamped and that the mechanical network impulse response is described well for particle vibrational state motion. The amplitude (
The system function of the particle vibration system in the viscous solid medium, i.e., the frequency domain expression corresponding to the impulse response of the particle system, can be obtained from Equation 8,
Equations 13, 14 show that this case is a linear time-invariant system whose impulse response and system function are functions of the physical properties and parameters of the viscous solid. Consequently, by inverting the impulse response or system function with the measured acoustic wave signal, we can gain information on the physical properties of the viscous solid media and discover its internal structural anomalies.
Finally, when an external force (
where Equation 15 is a time-domain expression of Equation 7.
We selected a few solid medium samples for calculation and analysis, neglecting the anisotropy of the rocks, where their physical parameters [18] are shown in Table 1.
From the physical properties of the selected rock samples (Table 1), we can obtain the friction resistance of the vibrating particle (
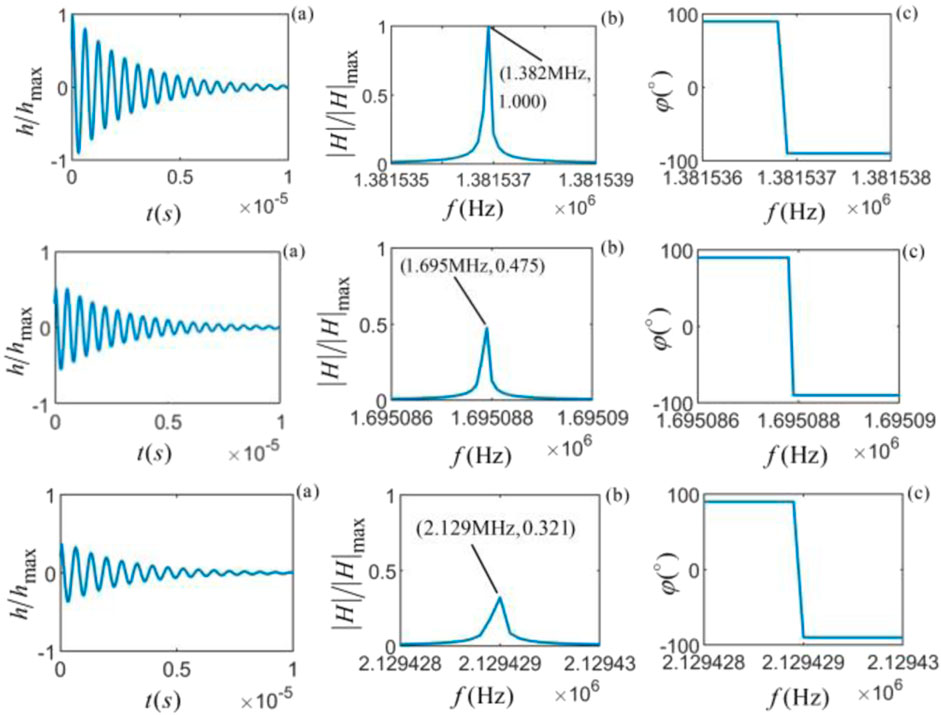
Figure 3. From top to bottom, the vibrational system (
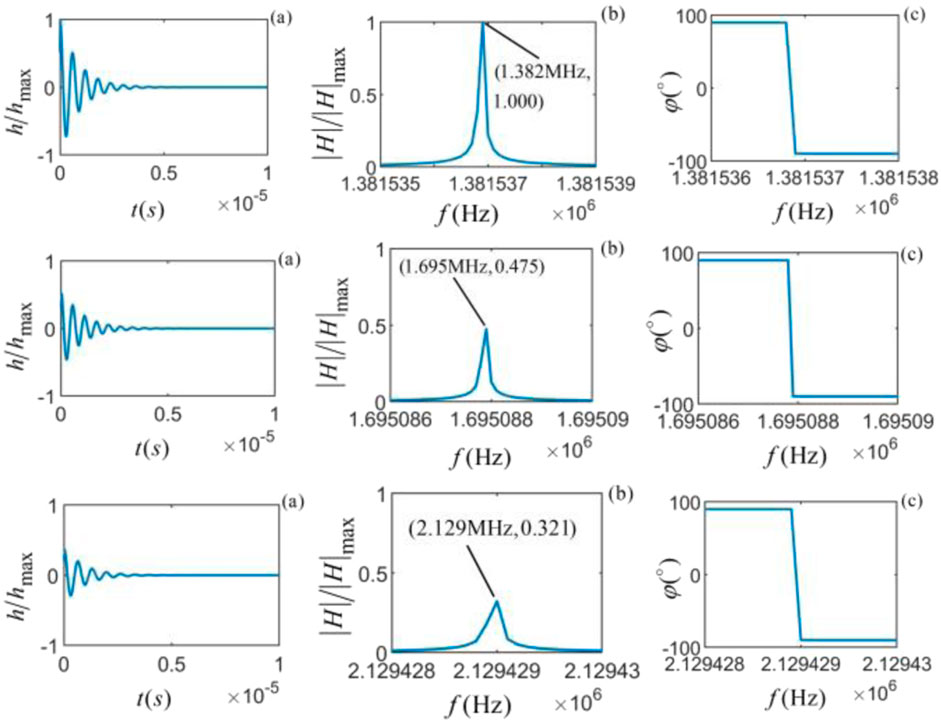
Figure 4. From top to bottom, the vibrational system (
The calculation results show that for different rocks with the same viscosity coefficient, the waveform amplitude in the time domain decays exponentially with time until it decays to zero; under the same viscosity coefficient, the amplitude of the time domain waveform and amplitude spectrum of the internal particle vibration of shale is the largest, and that of C-sandstone is the smallest; the amplitude spectrum of the particle vibration increases with frequency until it reaches the maximum amplitude at a specific frequency, and then the amplitude starts to decrease with frequency. The frequency corresponding to the maximum amplitude of the amplitude spectrum is defined as the center frequency (
For the same rock with different viscosities, the center frequency of the particle vibration is independent of the viscosity of the medium, but the amplitude of the spectrum will decrease with the increase of viscosity; the center frequency of the particle vibration inside C-sandstone is the highest (2.129 MHz) and followed by M-sandstone (1.695 MHz), where the shale stone has the lowest center frequency (1.382 MHz). This further supports our understanding of the influence of the stiffness coefficient on the center frequency. The larger the stiffness coefficient, the larger the center frequency corresponding to the particle vibration system; at the center frequency, the phase of the system function has a 180° mutation.
In summary, the viscosity of solid media will affect the amplitude of the particle vibration system function but will not affect its center frequency. The stiffness coefficient will affect the center frequency of the particle vibration system. Therefore, the mechanical properties of viscous solid media’s particle vibration are related to the shape and geometric parameters of the particles and the viscosity and stiffness coefficient of the medium solid.
Let’s consider and compare the particle vibrations within solid media under the action of harmonic single-frequency forces with different frequencies (f = 0.8
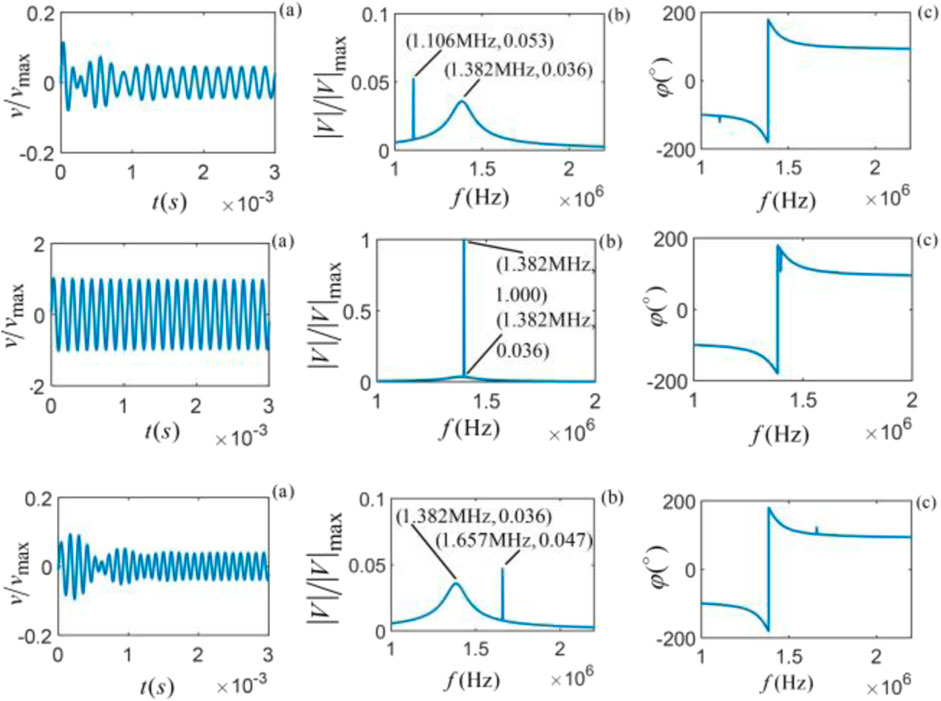
Figure 5. Vibrational state of Shale stone at different frequencies, from top to bottom (
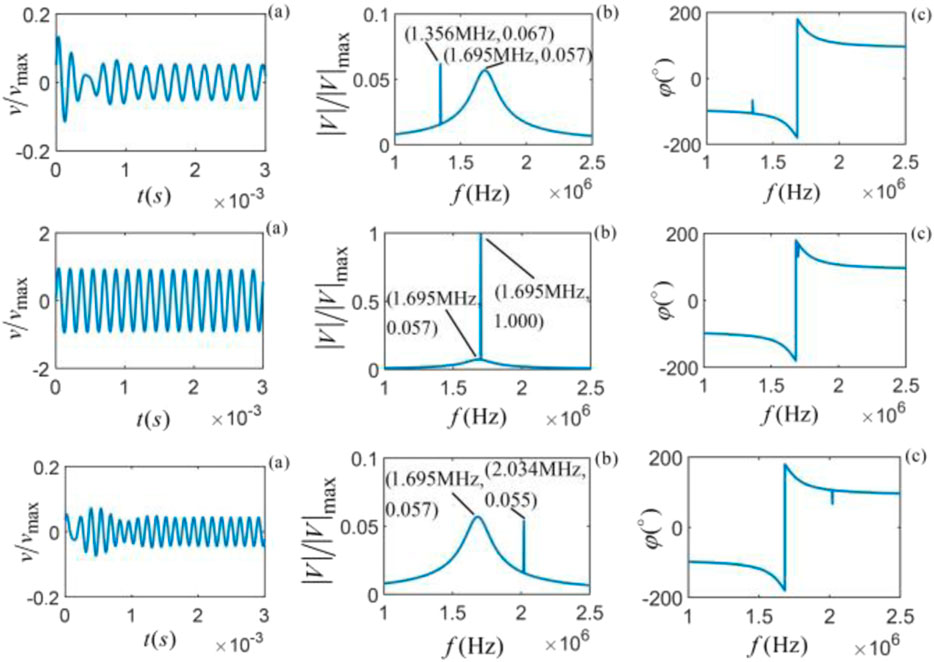
Figure 6. Vibrational state of M-sandstone at different frequencies, from top to bottom (
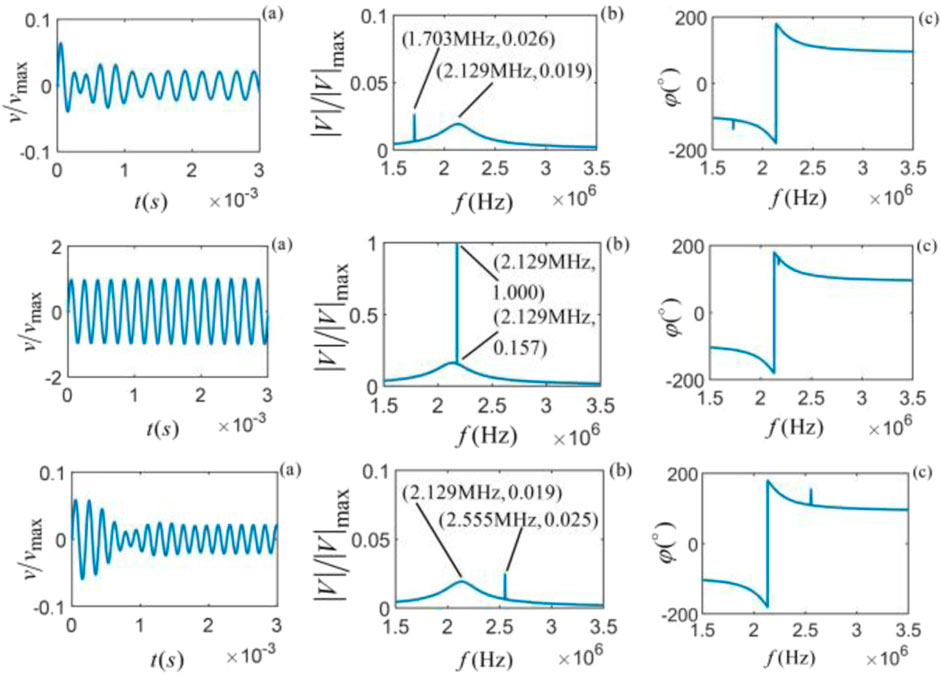
Figure 7. Vibrational state of C-sandstone at different frequencies, from top to bottom (
When the single-frequency harmonic force frequency is equal to the center frequency of the particle vibration, resonance occurs, and the amplitude of the time domain waveform and the corresponding amplitude spectrum is the largest, as shown in the middle penal (the second from top to bottom). The time domain waveform and amplitude spectrum are normalized by the maximum values of the time domain waveform and amplitude spectrum at resonance.
As shown in the first column of the figures for each sample, its time domain waveform consists of two parts, i.e., a transient transition process and a steady-state harmonic single-frequency vibration with the frequency of the harmonic force. The time domain waveform of the particle vibration has different transient processes at the beginning but gradually stabilizes to a sinusoidal vibration over time. The closer the harmonic single-frequency force (excitation signal) frequency is to the center frequency of the particle system, the greater the amplitude of the particle vibration and the shorter the duration of the transient transition process. When harmonic single-frequency excitation signals of different frequencies act on the particles, the time domain waveform generated by the particle vibration shows different transient processes and gradually stabilizes a harmonic single-frequency vibration with the frequency of over time.
The corresponding amplitude spectrum contains two types of spectrum information: one is the spectrum corresponding to the harmonic single-frequency signal of steady-state harmonic single-frequency oscillation, i.e., the impulse pulse in the frequency domain, which is the frequency of the harmonic single-frequency force, and the other is the spectrum corresponding to the transient process, which is the frequency component of the intrinsic noise generated by the particles inside the viscous solid medium under the action of the harmonic single-frequency force.
The phase spectrum’s behavior at the intrinsic noise center frequency is a key indicator for understanding the vibration spectrum. At this frequency, the phase spectrum exhibits a positive jump, and at the regular frequency of the harmonic single-frequency force, the phase spectrum shows an impulse. The phase jump and impulse coincide when the harmonic single-frequency force frequency aligns with the intrinsic noise center frequency. This alignment provides a crucial insight: when the frequency of the harmonic single-frequency force is significantly different from the center frequency of the intrinsic noise, it becomes easier to isolate the intrinsic noise from the particle vibration spectrum.
The excitation force signal acting on the particle in viscous solids is usually a wavelet containing many frequency components. A complex multifrequency signal can be decomposed into separate single-frequency components with different amplitudes, frequencies, and phases based on discrete Fourier transform. The more frequency components are used, the more accurate the waveform shape is to represent the original wavelet.
It is common to use the gate-selected sinusoidal force applied to the particle with a time domain expression,
By Fourier transform, we can get its spectrum expression and the corresponding phase spectrum:
where
Taking the center frequency of the particle system inside shale (
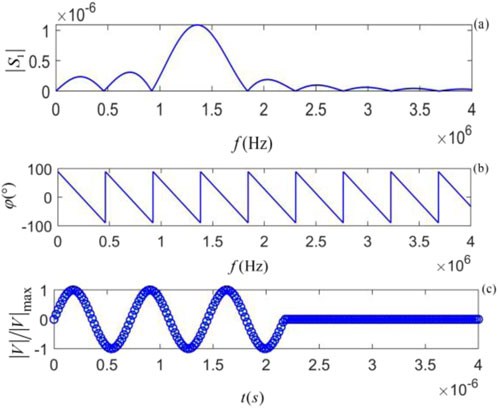
Figure 8. The gate-selected sinusoidal signal: (a) amplitude spectrum, (b) phase spectrum, and (c) time domain waveform.
By exploring a few selected frequency components of a gate-selected sinusoidal force at frequencies (
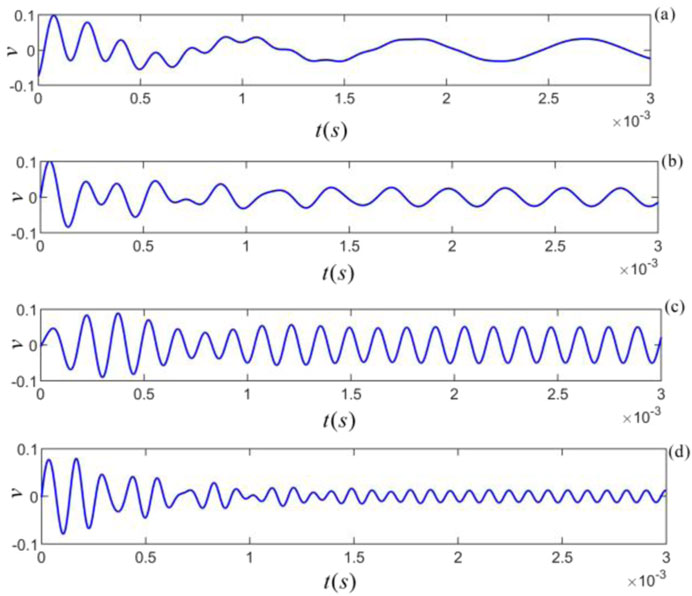
Figure 9. Different frequency components of the gate-selected sinusoidal force acting on the particles inside the shale: (a)
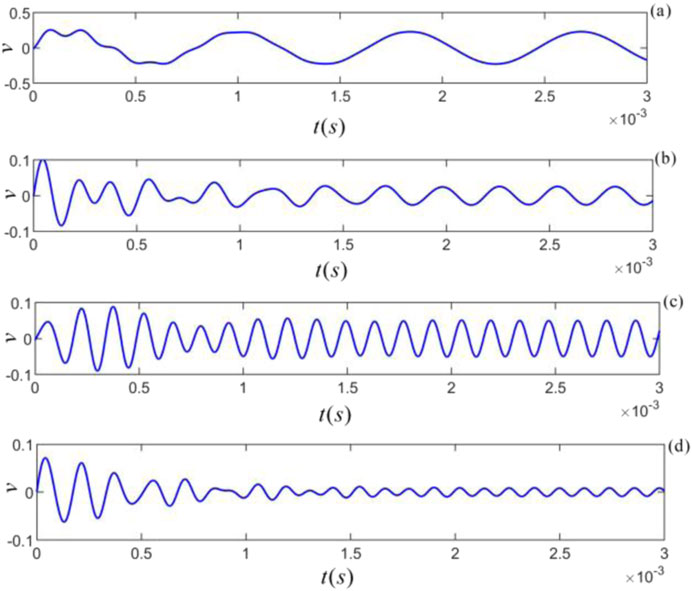
Figure 10. Different frequency components of the gate-selected sinusoidal force acting on M-sandstone: (a)
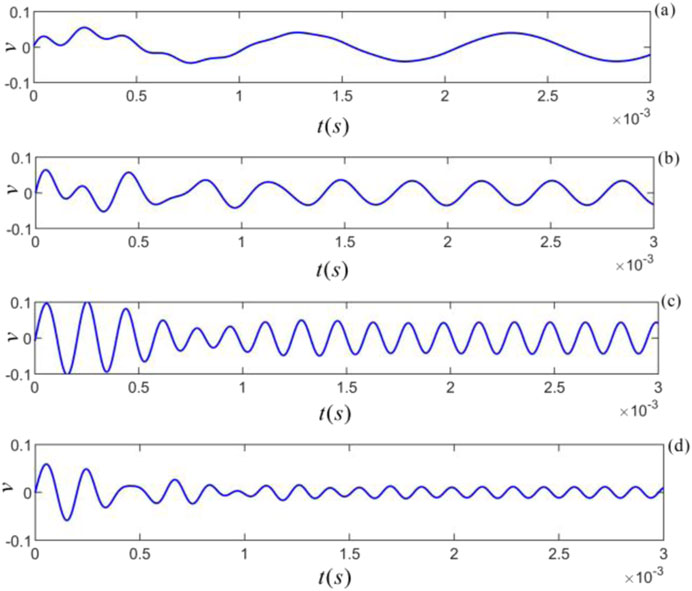
Figure 11. Different frequency components of the gate-selected sinusoidal force acting on C- sandstone: (a)
Figures 9–11 shows that each frequency component provided by the gate-selected sinusoidal force acting on the particle yields a distinctive transient process and steady-state harmonic single-frequency vibrations with different frequencies and amplitudes. For frequency components of the gate-selected sinusoidal force applied to the particle far away from the intrinsic noise center frequency, the transient transition of the particle vibration is long. When the gate-selected sinusoidal force frequency applied to the particle is equal to the center frequency of the intrinsic noise, the duration of the transient process of the particle vibration is the shortest, and the gate-selected sinusoidal force frequency is superimposed on the center frequency of the intrinsic noise. The frequency and magnitude of the intrinsic noise and the corresponding force frequency component determine the amplitude of the transient process. In contrast, the magnitude of this frequency component determines the steady-state harmonic vibration’s amplitude.
The vibration state of a particle inside the viscous solid medium is a summary contribution of all frequency components. Figures 12–14 shows the vibration states of the particles inside the three types of rocks (shale, M-sandstone, and C-sandstone) under the gate-selected sinusoidal forces of frequencies (
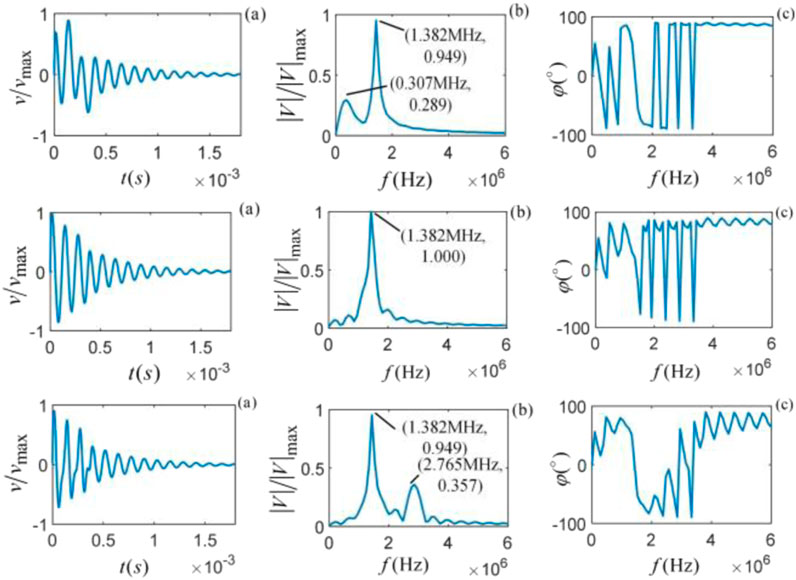
Figure 12. Shale vibration state from top to bottom (
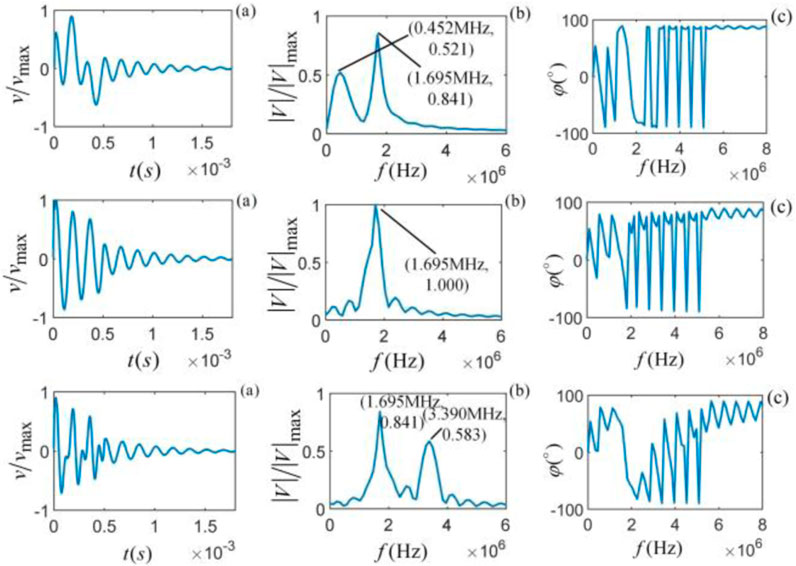
Figure 13. M-sandstone vibration state from top to bottom (
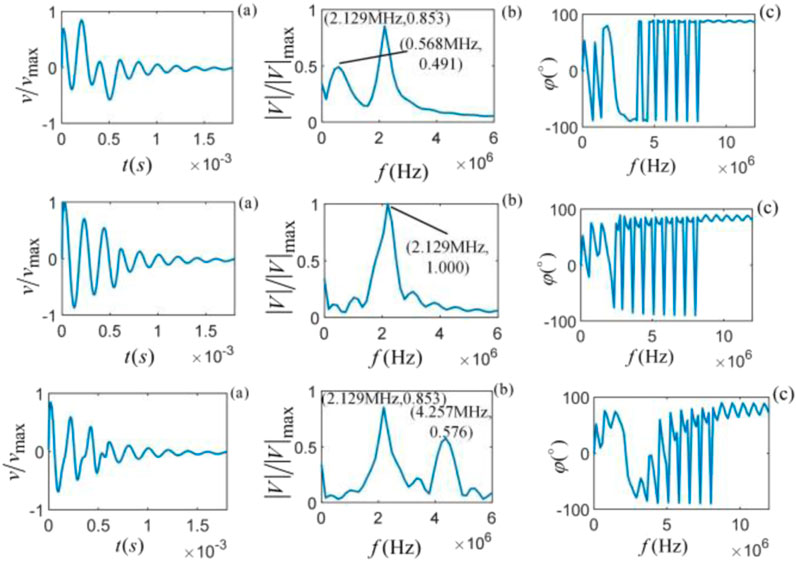
Figure 14. C-sandstone vibration state from top to bottom (
Figures 12–14 shows that different frequencies of gate-selected sinusoidal wavelet acting on its internal particles for a given rock medium yield different vibration states. The particle vibration has different time domain waveforms, amplitude, and phase spectra. When the gate-selected sinusoidal force frequency equals the central frequency of the intrinsic noise corresponding to the rock, the time domain waveform and amplitude spectrum will be at their maximum.
When the gate-selected sinusoidal force frequency overlaps with the intrinsic noise central frequency (
Figures 12–14 shows that, in the near frequency region around the spectrum of intrinsic noise and force, the fluctuation of the phase spectrum is more pronounced due to the influence of the spectrum distribution and characteristics of intrinsic noise, especially with multifrequency force. In the frequency range far away from the spectrum of intrinsic noise and excitation force, the fluctuation of the phase spectrum tends to become smaller. We found that the phase spectrum of the intrinsic noise generated by the internal particles of the different sample rock media under the action of the same type of force has similar changes and trends. Comparing Figures 9–11 with Figures 12–14 shows that when a single-frequency force acts on a particle, extracting the intrinsic noise generated by the vibrating particle is easier than that of multiple-frequency excitation.
We have introduced the concept of “intrinsic-noise-atom”. Through algorithms of interpolation, extrapolation, squeeze/stretch, and scaling, we can construct a dictionary that contains intrinsic-noise-atoms produced by vibrating particles within the viscous media with various physical properties and structures.
The combination or superposition of different intrinsic-noise-atoms can constitute the intrinsic noise generated when any complex multifrequency force is applied to a particle, and vice versa.
The generation and disappearance of particle vibrations have their own transient transition processes. The spectrum corresponding to the transient process is the intrinsic noise generated by the particle vibration system.
Intrinsic noise is closely related to the physical properties of the solid media and their internal structure. Applying the matching-pursuit algorithm on and the intrinsic noise extracted from measured acoustic wave signal with the atoms in dictionary can invert the physical properties of the solid media and their internal structure more accurately. Such as,in LWD acoustic logging, The intrinsic noise information can be used to reduce or eliminate the influence of the drill-collar direct wave on the measured acoustic wave efficiently, so that obtain propagation velocity of acoustic wave in the formation around the wellbore accurately.
This research lays a theoretical foundation for extracting the progressive intrinsic noise generated by the sequential vibration of all particles on the acoustic wave propagation path from the measured acoustic wave signal and the parallel-series lumped particle vibration model to describe the acoustic measurement process. The next step will be to establish a quantitative relationship between intrinsic noise and acoustic attenuation. A new lumped particle vibration transmission network that takes into account the influence of factors such as particle vibration-damping attenuation, wave propagation attenuation, progressive intrinsic noise generated by particles inside the medium, and the electric-acoustic (or acoustic-electric) conversion of the acoustic transducer on the measured acoustic wave signal (the electrical signal at the electrical end of the receiving transducer) is established to describe the acoustic measurement process.
This research has theoretically derived and simulated the intrinsic noise signal generated by the particle in viscous solid media and has not yet been verified by relevant experiments. In the subsequent process, some rock samples can be constructed for experimental measurement, combining theory with engineering, and we can develop corresponding software to interpret and process the physical properties of the inversion medium and the internal structural anomalies using the progressive intrinsic noise signal. It also lays the foundation for developing a new intrinsic noise logging tool.
The original contributions presented in the study are included in the article/supplementary material, further inquiries can be directed to the corresponding authors.
LF: Conceptualization, Validation, Writing–original draft, Writing–review and editing. SM: Data curation, Software, Writing–original draft. HY: Validation, Writing–review and editing. JL: Investigation, Writing–review and editing. YH: Project administration, Writing–review and editing. KZ: Supervision, Writing–review and editing. YX: Formal Analysis, Writing–review and editing. MZ: Conceptualization, Writing–original draft.
The author(s) declare that financial support was received for the research, authorship, and/or publication of this article. This work was supported in part by the National Natural Science Foundation of China (grant no. 41974130), Xi’an Fanyi University, Xi’an University of Posts and Telecommunications, and the Physical Sciences Division at The University of Chicago.
The authors declare that the research was conducted in the absence of any commercial or financial relationships that could be construed as a potential conflict of interest.
The author(s) declare that no Generative AI was used in the creation of this manuscript.
All claims expressed in this article are solely those of the authors and do not necessarily represent those of their affiliated organizations, or those of the publisher, the editors and the reviewers. Any product that may be evaluated in this article, or claim that may be made by its manufacturer, is not guaranteed or endorsed by the publisher.
1. Simpson ML, Cox CD, Sayler GS. Frequency domain analysis of noise in autoregulated gene circuits. Proc Natl Acad Sci (2003) 100(8):4551–6. doi:10.1073/pnas.0736140100
2. Ramaswamy R, Sbalzarini IF. Intrinsic noise alters the frequency spectrum of mesoscopic oscillatory chemical reaction systems. Scientific Rep (2011) 1(1):154. doi:10.1038/srep00154
3. Rhee A, Cheong R, Levchenko A. Noise decomposition of intracellular biochemical signaling networks using nonequivalent reporters. Proc Natl Acad Sci (2014) 111(48):17330–5. doi:10.1073/pnas.1411932111
4. Selimkhanov J, Taylor B, Yao J, Pilko A, Albeck J, Hoffmann A, et al. Accurate information transmission through dynamic biochemical signaling networks. Science (2014) 346(6215):1370–3. doi:10.1126/science.1254933
5. Villegas P, Ruiz-Franco J, Hidalgo J, Muñoz MA. Intrinsic noise and deviations from criticality in Boolean gene-regulatory networks. Scientific Rep (2016) 6(1):34743. doi:10.1038/srep34743
6. Hong J, Zhang T, Zhou R, Zhou R, Ostikov K, Rezaeimotlagh A, et al. Plasma bubbles: a route to sustainable chemistry. AAPPS Bull (2021) 31:26–14. doi:10.1007/s43673-021-00027-y
7. Fa L, Yang H, Fa Y, Meng S, Bai J, Zhang Y, et al. Progress in acoustic measurements and geoacoustic applications. AAPPS Bull (2024) 34(1):23. doi:10.1007/s43673-024-00127-5
8. Piquette JC. Method for transducer transient suppression. I: theory. The J Acoust Soc America (1992) 92(3):1203–13. doi:10.1121/1.403970
9. Piquette JC. Method for transducer transient suppression. II: experiment. J Acoust Soc America (1992) 92(3):1214–21. doi:10.1121/1.403971
10. Fa L, Castagna JP, Hovem JM. Derivation and simulation of source function for acoustic logging. In: 1999 IEEE Ultrasonics Symposium. Proceedings. International Symposium (Cat. No. 99CH37027); 17-20 Oct. 1999; USA. IEEE (1999).
11. Fa L, Mou J, Fa Y, Zhou X, Zhang Y, Liang M, et al. On transient response of piezoelectric transducers. Front Phys (2018) 6:123. doi:10.3389/fphy.2018.00123
12. Fa L, Tu N, Qu H, Wu Y, Sun K, Zhang Y, et al. Physical characteristics of and transient response from thin cylindrical piezoelectric transducers used in a petroleum logging tool. Micromachines (2019) 10(12):804. doi:10.3390/mi10120804
13. Fa L, Kong L, Gong H, Li C, Li L, Guo T, et al. Numerical simulation and experimental verification of electric–acoustic conversion property of tangentially polarized thin cylindrical transducer. Micromachines (2021) 12(11):1333. doi:10.3390/mi12111333
14. Fa L, Liu D, Gong H, Chen W, Zhang Y, Wang Y, et al. A frequency-dependent dynamic electric–mechanical network for thin-wafer piezoelectric transducers polarized in the thickness direction: physical model and experimental confirmation. Micromachines (2023) 14(8):1641. doi:10.3390/mi14081641
15. Zha X, Luo JT, Tao R, Fu C. Surface and bulk acoustic wave resonators based on aluminum nitride for bandpass filters. AAPPS Bull (2024) 34(1):14. doi:10.1007/s43673-023-00104-4
16. Moon J, Park S, Lim S. A novel high-speed resonant frequency tracking method using transient characteristics in a piezoelectric transducer. Sensors (2022) 22(17):6378. doi:10.3390/s22176378
17. Wang G, Qiu W, Wang D, Chen H, Wang X, Zhang M. Monitoring the early strength development of cement mortar with piezoelectric transducers based on eigenfrequency analysis method. Sensors (2022) 22(11):4248. doi:10.3390/s22114248
19. Mallat S, Zhang Z. Matching pursuit with time-frequency dictionaries. IEEE Trans Signal Process (1993) 41(12):3397–419. doi:10.1109/78.258082
20. Davis G, Mallat S, Avellaneda M. Adaptive greedy approximations. Constructive approximation (1997) 13:57–98. doi:10.1007/s003659900033
21. Zhang R, Castagna J. Seismic sparse-layer reflectivity inversion using basis pursuit decomposition (2011) 76(6). R147–58. doi:10.1190/geo2011-0103.1
Keywords: solid viscosity, damping attenuation, propagation attenuation, particle vibration, intrinsic noise
Citation: Fa L, Meng S, Yang H, Li J, Hu Y, Zhang K, Xu Y and Zhao M (2025) Intrinsic noise within viscous solids and impact on material exploration. Front. Phys. 13:1554969. doi: 10.3389/fphy.2025.1554969
Received: 08 January 2025; Accepted: 25 February 2025;
Published: 17 March 2025.
Edited by:
Han Zhang, Chinese Academy of Sciences (CAS), ChinaReviewed by:
Xinxin Liao, Federal Institute of Technology in Lausanne, SwitzerlandCopyright © 2025 Fa, Meng, Yang, Li, Hu, Zhang, Xu and Zhao. This is an open-access article distributed under the terms of the Creative Commons Attribution License (CC BY). The use, distribution or reproduction in other forums is permitted, provided the original author(s) and the copyright owner(s) are credited and that the original publication in this journal is cited, in accordance with accepted academic practice. No use, distribution or reproduction is permitted which does not comply with these terms.
*Correspondence: Lin Fa, ZmF4aWFveHVlQDEyNi5jb20=; Meishan Zhao, bS16aGFvQHVjaGljYWdvLmVkdQ==
Disclaimer: All claims expressed in this article are solely those of the authors and do not necessarily represent those of their affiliated organizations, or those of the publisher, the editors and the reviewers. Any product that may be evaluated in this article or claim that may be made by its manufacturer is not guaranteed or endorsed by the publisher.
Research integrity at Frontiers

Learn more about the work of our research integrity team to safeguard the quality of each article we publish.