 Birong Huang1
 Hao Ma
- 1College of Economics and Management, Nanjing University of Aeronautics and Astronautics, Nanjing, China
- 2School of Electric Power Engineering, Nanjing Institute of Technology, Nanjing, China
LiDAR (Light Detection and Ranging) is an essential device for capturing the depth information of objects. Unmanned aerial vehicles (UAV) can sense the surrounding environment through LiDAR and image sensors to make autonomous flight decisions. In this process, aerial slender targets, such as overhead power lines, pose a threat to the flight safety of UAVs. These targets have complex backgrounds, elongated shapes, and small reflection cross-sections, making them difficult to detect directly from LiDAR point clouds. To address this issue, this paper takes overhead power line as a representative example of aerial slender targets and proposes a method that utilizes visible light images to guide the segmentation of LiDAR point clouds under large depth of field conditions. The method introduces an image segmentation algorithm based on a voting mechanism for overhead power lines and designs a calibration algorithm for LiDAR point clouds and images in the scenarios with large depth of field. Experimental results demonstrate that in various complex scenes, this method can segment the LiDAR point clouds of overhead power lines, thereby achieving accurate positions and exhibiting good adaptability across multiple scenes. Compared to traditional point cloud segmentation methods, the segmentation accuracy of the proposed method is significantly improved, promoting the practical application of LiDAR.
1 Introduction
Light Detection and Ranging (LIDAR) is a crucial sensing device for Unmanned Aerial Vehicles (UAVs), providing detailed three-dimensional information of the scene. UAVs achieve autonomous flight through technologies such as LIDAR [1], visible light cameras [2], and Simultaneous Localization and Mapping (SLAM) [3]. However, during this process, aerial slender targets, primarily overhead power lines, pose a serious threat to the autonomous flight of UAVs. This is mainly because overhead power lines and similar targets have elongated and slender morphological features, small reflection cross-sections, and complex backgrounds. Consequently, the detection and spatial localization of such targets have become a research focus, with the main technical approaches including detection algorithms based on LIDAR point clouds and detection algorithms based on visible light images.
Detection algorithms based on LIDAR point clouds primarily rely on deep learning or clustering methods. Ma [4] proposed a method that combines PCA (Principal Component Analysis) and region growing algorithms. This approach leverages the spatial distribution characteristics of overhead power lines, enabling accurate and efficient extraction of individual overhead power lines. Matti [5] determined the direction of overhead power lines to obtain rough point estimates of the power lines. Then, the RANSAC line fitting algorithm and nearest neighbor search algorithm were used to accurately extract the overhead power lines. Kim [6] proposed a classification system suitable for extracting power lines, which integrates point cloud features and object features into two independent feature sets. The system uses a random forest algorithm to extract power lines that are characterized by point features. Although the aforementioned methods are capable of extracting point cloud data for overhead power lines, they do not take into account the large volume of point cloud data. In UAV-mounted point cloud data, the overall volume of point cloud data is large, but the point cloud corresponding to overhead power lines accounts for less than 5% of the total data. Therefore, processing the entire panoramic point cloud not only makes it difficult to transmit and process on the UAV end, but also wastes significant computational resources.
Detection algorithms based on visible light images are primarily divided into traditional image processing methods and deep learning-based segmentation methods. The traditional algorithms primarily rely on edge detection operators and line detection algorithms as the main methods. Wang [7] proposed an image processing method for measuring the ice thickness on transmission lines, which, under given conditions, can detect the edges of iced and non-iced transmission lines. Wang Hao [8] addressed the issue of difficulty in recognizing transmission lines in complex ground environments by proposing an overhead power line detection algorithm based on adaptive Canny edge detection. However, traditional methods only utilize shallow features of the image, and they cannot consistently maintain good performance in complex scenarios.
Deep learning-based semantic segmentation algorithms can achieve pixel-level segmentation of overhead power lines. Representative algorithms include Deep Convolutional Neural Networks (DCNN). Cano-Solis [9] proposed a deep learning-based method for overhead power line segmentation, using DeepLabV3 and U-Net segmentation networks to separate the power line corridors from the vegetation background. Mao [10] used a semantic segmentation algorithm to detect transmission lines and proposed an end-to-end semantic segmentation model based on binocular vision and a feature pyramid network—the Binocular FPN. This model can detect transmission lines and their defects on binocular images. However, due to the varying perspectives and changing scenes captured by drones, the detection results tend to be discontinuous (this phenomenon will be shown in the section of experiment), making it difficult to obtain a useful result.
To address this problem, this paper proposes a detection method for aerial slender targets that guides the segmentation of LIDAR point clouds using two-dimensional images in large-depth-of-field environments. Compared to existing methods, this approach balances detection accuracy, adaptability across multiple scenes, and algorithm complexity, effectively promoting the development of LiDAR technology. Considering practical applications, the aerial slender targets discussed in this paper are specifically overhead power lines.
2 Method
The method proposed in this paper is a 3D detection approach for overhead power line in large depth-of-field environments, which uses 2D images to guide 3D point cloud segmentation. It consists of two key parts:
(1) Overhead power line extraction algorithm in visible light images based on a voting mechanism is proposed, which demonstrates good scene adaptability.
(2) A joint calibration technique under large depth-of-field conditions is employed to accurately map the 3D point cloud onto the 2D image. Based on the above two parts, the 3D point cloud of the aerial power line can be distinguished, achieving the goal of 3D detection.
2.1 Aerial power line image extraction algorithm based on voting mechanism
The main idea of this method is to first use deep learning-based detection algorithms and traditional methods to detect images containing aerial power lines, and then apply a voting algorithm to fuse the results of both approaches, achieving the detection goal.
The deep learning detection algorithm uses the image segmentation network Deeplabv3+ [11, 12] for power line detection, with the results shown in Figure 1B. As can be seen, although this method eliminates interference from the surrounding environment, the detected line segments are discontinuous. On the other hand, traditional algorithms use the MCMLSD algorithm [13], which combines the advantages of image-domain perceptual clustering and Hough transform [14, 15]. Detection results are shown in Figure 1C. It can be seen that the integrity of line segment detection is ensured, but, the interference from linear textures in the background is apparent.
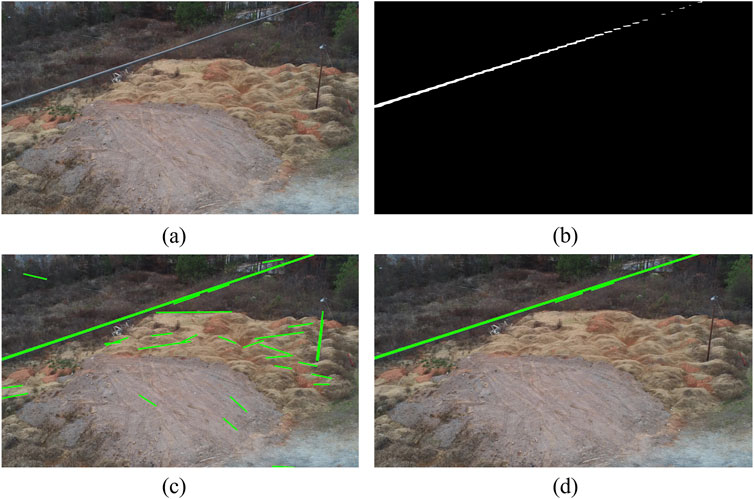
Figure 1. Overhead Transmission Line Based on Voting Mechanism Detection Method: (A) Image to be detected; (B) Detection results based on DeepLabv3+; (C) Detection results based on MCMLSD algorithm; (D) Detection results based on voting mechanism.
Based on the above methods, a fusion algorithm based on the voting mechanism is proposed, which combines the advantages of both approaches to complement each other, enabling overhead transmission line detection in multiple scenarios. Since the results of the above two methods are required, the output of both methods is first calibrated. For the detection results of the DeepLabv3+ algorithm, they are represented as a binary grayscale image. To facilitate the algorithm description, the set of positions of non-zero pixels is labeled as
(1) For the
(2) For each point
(3)Set a distance threshold
(4) Repeat steps (1) to (3) for all line segments to obtain the set of vote values
(5) Sort the non-zero elements of
The experimental result of the voting-based overhead line extraction method is shown in Figure 1D. It can be observed that this method has high accuracy, as it preserves the complete overhead line (marked in green). Compared to traditional algorithms (as shown in Figure 1C), this method demonstrates better resistance to interference. Its scene robustness will be presented in Section 3.
2.2 Calibration method for “Point Cloud-Image” in large depth-of-field environments
Traditional methods use an object (such as chess board) to calibrate the LiDAR, with the calibration board placed in multiple poses at a single depth. However, during drone flight, the images captured are typically large depth-of-field images, and traditional methods may result in mismatches between the LiDAR point cloud and the target. This paper adopts a simple but effective calibration method for “Point Cloud-Image” in large depth-of-field environments.
The calibration system is shown in Figure 2A, where the optical axes of the LiDAR and the visible light camera are parallel. The black solid line represents the common field of view of the two sensors. In this method, we use polar coordinates to describe the placement of the target. We define the depth of the visible light camera’s lens as 0 m, with the longitudinal direction of the calibration scene parallel to the camera’s optical axis. The depth at which the calibration board is placed is denoted as Z.
(1) Design and Placement Method of Calibration Object: The calibration object selected is a checkerboard target board. The object is placed at a depth of
(2) At each position, the Zhang Zhengyou calibration method is used to obtain the intrinsic parameters of the visible light camera and apply the method of Direct Linear Transform (DLT) [16] to measure the transformation matrix between the LiDAR and the camera, denoted as
(3) For each depth, calculate the transformation matrix
(4) Construct the look-up table
(5) In practical applications, suppose the point cloud dataset measured by the LiDAR is {
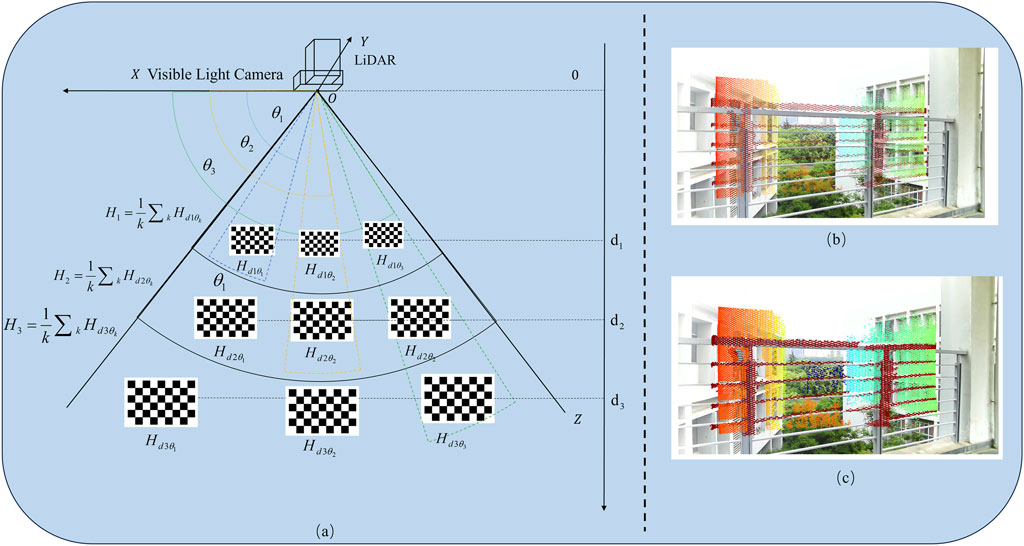
Figure 2. Calibration method (A) Scheme of calibration experiment (B) Calibration result using traditional method; (C) Calibration result using proposed method.
In order to validate the accuracy of the proposed method, comparative experiments were conducted. The experimental results are shown in Figures 2B, C. To intuitively show the calibration results, we apply this result directly to the point cloud, and then overlay them on the visible light image in the form of pseudo-color. Figure 2B presents the matching results using the traditional method, which shows insufficient accuracy, with noticeable mismatches at the railing. In contrast, Figure 2C presents the matching results using the method proposed in this paper, showing a better alignment performance.
2.3 Point cloud extraction
Once the joint calibration and line segment extraction in the 2D image are completed, the final step is to extract the 3D point cloud of the overhead power lines. We traverse all the point clouds and, using the transformation matrix obtained from the joint calibration, map their coordinates from the 3D coordinate system to the image coordinate system. Assume the coordinate of one point in the LiDAR point cloud is represented as
3 Experiment
The experimental section includes the following results: the line segment extraction results in visible light images, the point cloud segmentation results for the overhead power lines, and the extended applications of this method.
3.1 Extraction of power lines in 2D images
We build a dataset for Deeplabv3+. This dataset in this paper contains 1,025 images with overhead power lines, each with a resolution of 1920 × 1,080 pixels. The dataset was augmented by techniques such as mirroring, adding noise, and adjusting brightness, increasing the total number of images to 4,100, which serves as the experimental dataset for this paper. The experimental dataset is split into a training set and a validation set in a 9:1 ratio, with 3,690 images used for training and 410 images used for validation. The hardware, software environment, and training parameter settings used in this paper are shown in Table 1.
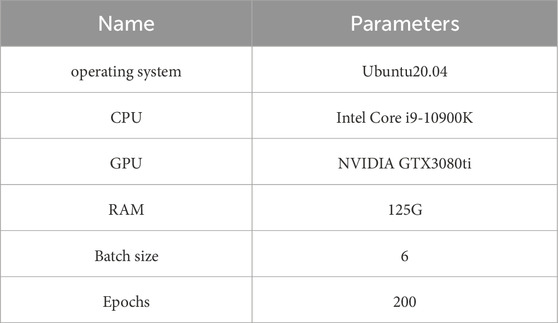
Table 1. Experimental environment and training parameters.
The results of MCMLSD, DeepLabv3+, and the proposed method were compared, as shown in Figure 3. It can be seen that the traditional algorithms maintain complete extraction of the wire shape, but are significantly interfered with by background textures. DeepLabv3+ (the third column) shows a significant improvement in accuracy, with almost no extraction of other types of objects. However, its drawbacks are also evident, as the integrity of the extracted power lines is poor. The results of the fused segmentation algorithm (fourth column of Figure 3) combine the advantages of the MCMLSD and DeepLabv3+. It can be seen that the proposed method can extract nearly complete overhead lines and is largely unaffected by external environmental interference, demonstrating the superiority of the method in this paper.
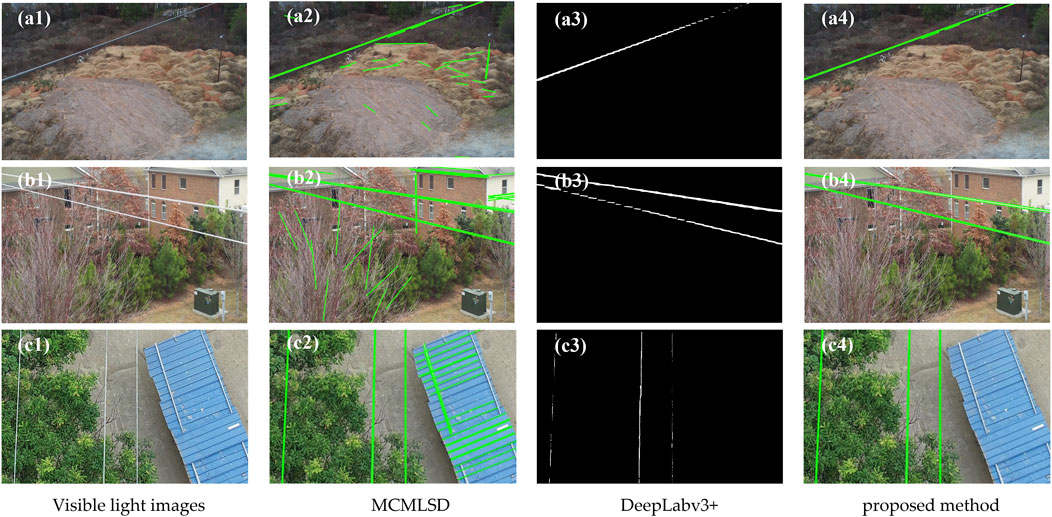
Figure 3. Detection Results of Overhead Power Lines in visible light images. (A1–C1) Visible light images of different scenarios; (A2–C2) Extraction results by MCMLSD; (A3–C3) Extraction results by Deeplabv3+; (A4–C4) Extraction results by the proposed method.
3.2 Extraction of LiDAR point cloud for overhead power lines
An unmanned aerial vehicle equipped with LiDAR and a visible light camera was used to inspect the overhead power lines. This resulted in comprehensive point cloud data collection for a 475-meter section of the overhead power line, consisting of a total of 24, 426, 219 points, as well as several images captured in visible light.
We selected three scenes, including some trees, houses, and overhead lines, as shown in Figures 4A1–C1. Figures 4A2–C2 displays the colored point clouds of the partial scenes. The coloring process involves using the calibration method described in Section 2.2 to compute the transformation matrix for each element in the LiDAR point cloud and then mapping the corresponding colors from the images onto the point cloud. These results demonstrate the effectiveness of our calibration approach. Figures 4A3–C3 shows the detection results of overhead power lines in visible light images using the method proposed in this paper. It can be observed that the detection accuracy is high, further validating the effectiveness of our method. Finally, Figures 4A4–C4 presents the extraction results of LiDAR point clouds of overhead power lines in the three scenes. It is evident that the results shown in Figures 4A4–C4 are minimally affected by the surrounding environment, allowing for the precise acquisition of the three-dimensional information of the overhead conductors.
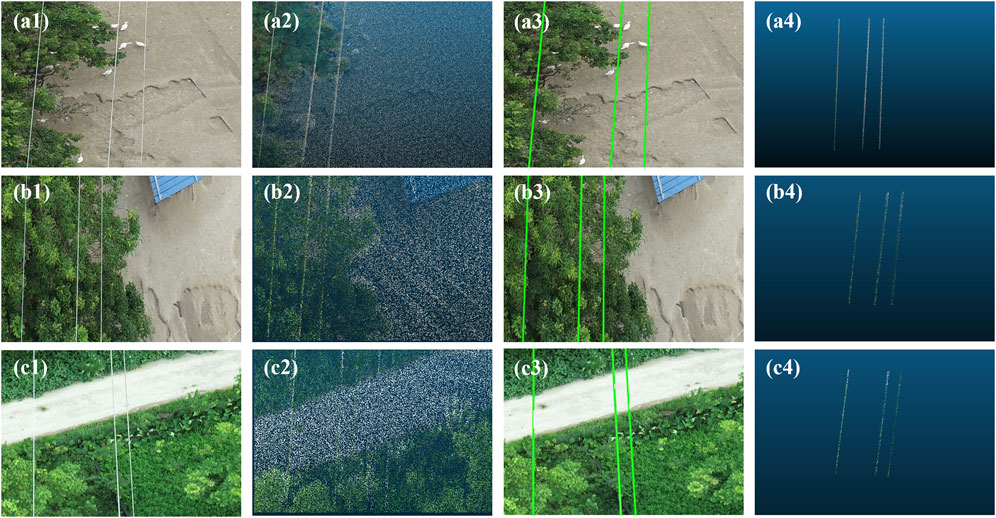
Figure 4. Extraction of the LiDAR point cloud of the Overhead Power Lines; (A1–C1) The visible light images of three local scenes; (A2–C2) The LiDAR point clouds of three local scenes; (A3–C3) In the visible light images, extraction of the overhead power lines; (A4–C4) The extraction of overhead power lines from LiDAR point clouds.
Here, we quantitatively evaluate the results of our algorithm. Currently, widely used evaluation metrics are Accuracy (Acc) and Intersection over Union (IoU). The model performance is evaluated using the mean Intersection over Union (mIoU) and mean Accuracy (mAcc). The mIoU function measures the overlapping area between the predicted extraction and the ground truth labels, providing a comprehensive assessment of segmentation accuracy. The mAcc function, on the other hand, takes into account the balance between different categories. Experiments were conducted on the dataset using the classic PointNet, PointNet++ [17] algorithms, as well as the method proposed in this paper. The results of these experiments are presented in Table 2.
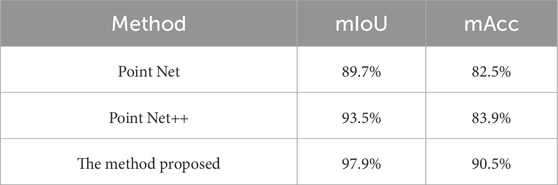
Table 2. Experimental comparison of accuracy for different methods.
As can be seen from Table 2, compared to the classic PointNet and PointNet++, the proposed model performs better overall in the power line inspection point cloud segmentation task. The improved method mIoU increased by 8.2% and 4.4% compared to PointNet and PointNet++, respectively. This indicates that the proposed method is better at capturing the boundaries and shapes of different objects. The improvement in mAcc suggests that the model’s classification accuracy has been enhanced, achieving better classification performance even when handling individual categories.
Furthermore, as shown in Table 3, the size of point cloud data significantly decreases by using the proposed method, which is beneficial for the processing by the onboard system, thereby providing data support for the real-time obstacle avoidance of UAV.
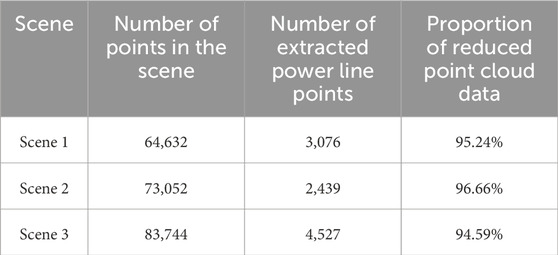
Table 3. Experimental analysis of overhead line point cloud data.
4 Conclusion
We propose an approach that uses visible light images to drive the extraction of LiDAR point clouds of the slender objects in the air. Essentially, LiDAR-acquired point cloud data is characterized by large-scale data with limited semantic information. Although various methods for processing point clouds exist, research focusing on UAVs avoiding aerial linear obstacles remains limited. The proposed method in this paper utilizes the rich semantics of 2D images to compensate for the lack of semantic information in point clouds, thereby enabling the segmentation of linear targets within the point cloud. Furthermore, this method shows promise for edge devices, offering real-time processing potential and providing a technical safeguard for UAV safety.
Moreover, this method exhibits strong cross-domain adaptability. For example, in the field of autonomous driving, the algorithm can be applied to detect linear targets such as road markings, cables, or guardrails. Furthermore, it has the potential for real-time operation on edge devices, making it particularly suitable for application scenarios that demand high responsiveness and low power consumption. This cross-domain transferability lays a solid foundation for the broader application of the method. It should be noted that although this study does not utilize point cloud segmentation networks for processing, it still requires traversing the coordinates of each point in the point cloud, which reduces the algorithm’s efficiency. Designing a regional traversal method will be one of the focuses of future research.
Data availability statement
The raw data supporting the conclusions of this article will be made available by the authors, without undue reservation.
Author contributions
BH: Conceptualization, Formal Analysis, Methodology, Writing–original draft, Writing–review and editing. ZW: Funding acquisition, Resources, Supervision, Writing–review and editing. JC: Data curation, Formal Analysis, Writing–review and editing. BZ: Investigation, Validation, Writing–review and editing. HM: Methodology, Software, Visualization, Writing–original draft.
Funding
The author(s) declare that financial support was received for the research, authorship, and/or publication of this article. This work is supported by Chinese National Funding of Social Sciences (Grant No. 20ZDA092).
Conflict of interest
The authors declare that the research was conducted in the absence of any commercial or financial relationships that could be construed as a potential conflict of interest.
Generative AI statement
The author(s) declare that no Generative AI was used in the creation of this manuscript.
Publisher’s note
All claims expressed in this article are solely those of the authors and do not necessarily represent those of their affiliated organizations, or those of the publisher, the editors and the reviewers. Any product that may be evaluated in this article, or claim that may be made by its manufacturer, is not guaranteed or endorsed by the publisher.
References
1. Wang Z, Du H, Wang J, Peng C, Zhou D. Defect detection of strain clamps in transmission lines based on improved YOLOv4. Guangdong Electric Power (2023) 36(05):105–14. doi:10.3969/j.issn.1007-290X.2023.05.012
2. Gao C, Wu Q, Yang F, Qiao J. Research on overhead traverse detection method based on cross-check. Guangdong Electric Power (2023) 36(08):124–30. doi:10.3969/j.issn.1007-290X.2023.08.014
3. Liu CY, Wu YQ. Research progress of vision detection methods based on deep learning for transmission lines. Chin Soc Electr Eng (2023) 43(19):7423–46. doi:10.13334/j.0258-8013.pcsee.221139
4. Ma W. Research and design of power line inspection point cloud segmentation algorithm. Beijing, China: North China Electric Power University (2022).
5. Lehtomäki M, Kukko A, Matikainen L, Hyyppä J, Kaartinen H, Jaakkola A. Power line mapping technique using all-terrain mobile laser scanning. Automation in Construction (2019) 105:102802. doi:10.1016/j.autcon.2019.03.023
6. Kim HB, Sohn G. Random forests based multiple classifier system for power-line scene classification. Int Arch Photogrammetry, Remote Sensing Spat Inf Sci (2012) 38:253–8. doi:10.5194/isprsarchives-xxxviii-5-w12-253-2011
7. Wang J, Wang J, Shao J, Li J. Image recognition of icing thickness on power transmission lines based on a least squares Hough transform. Energies (2017) 10:415. doi:10.3390/en10040415
8. Wang H, Wu G, Liu Z, He W. Power transmission line detection algorithm based on adaptive Canny edge detection. J Yangzhou Univ (Natural Sci Edition) (2020) 23(06):45–52. doi:10.19411/j.1007-824x.2020.06.009
9. Cano-Solis M, Ballesteros JR, Sanchez-Torres G. VEPL-net: a deep learning ensemble for automatic segmentation of vegetation encroachment in power line corridors using UAV imagery. ISPRS Int J Geo-inf (2023) 12:454. doi:10.3390/ijgi12110454
10. Mao M, Chen Y, Chen W, Du W, Zhang M, Mao T. Power transmission line image segmentation method based on binocular vision and feature pyramid network. In: 2021 international conference on sensing, measurement and data analytics in the era of artificial intelligence (ICSMD). Nanjing, China: IEEE (2021). p. 1–4.
11. Wen J. Research on image semantic segmentation method based on improved DeepLabV3+. Liaoning, China: Liaoning Technical University (2021).
12. Zhaohui LI, Kou G. Infrared aerial image overhead wire identification algorithm based on improved Deeplabv3. Infrared Laser Eng (2022) 51(11):181–9. doi:10.3788/IRLA20220112
13. Almazan EJ, Tal R, Qian Y, Elder JH. MCMLSD: a dynamic programming approach to line segment detection. In: Proceedings of the IEEE conference on computer vision and pattern recognition. Piscataway: IEEE (2017). p. 2031–9.
14. Liu Y. Research on line segment detection and evaluation technology. Suzhou, China: Soochow University (2021).
15. Hikmahwan B, Hario F, Mudjirahardjo P. A real-time video Analysis with an omni-directional camera for multi object detection using the Hough transform method. In: 2023 1st IEEE international conference on smart Technology (ICE-SMARTec). Bandung, Indonesia: IEEE (2023). p. 118–23.
16. Hartley R, Zisserman A. Multiple view geometry in computer vision. Cambridge, Britain: Cambridge University Press (2003).
Keywords: LiDAR, point cloud, segmentation, slender targets, unmanned aerial vehicles
Citation: Huang B, Wang Z, Chen J, Zhou B and Ma H (2025) A segmentation method for LiDAR point clouds of aerial slender targets. Front. Phys. 13:1548786. doi: 10.3389/fphy.2025.1548786
Received: 20 December 2024; Accepted: 13 January 2025;
Published: 30 January 2025.
Edited by:
Shuo Liu, Hebei University of Technology, ChinaCopyright © 2025 Huang, Wang, Chen, Zhou and Ma. This is an open-access article distributed under the terms of the Creative Commons Attribution License (CC BY). The use, distribution or reproduction in other forums is permitted, provided the original author(s) and the copyright owner(s) are credited and that the original publication in this journal is cited, in accordance with accepted academic practice. No use, distribution or reproduction is permitted which does not comply with these terms.
*Correspondence: Zilong Wang, d2FuZ3ppbG9uZ0BudWFhLmVkdS5jbg==; Hao Ma, MTUyNTYzOTc0NDdAMTYzLmNvbQ==