 Weiwei Zhu1*
 Xuchen Meng
 Dayong Zhang
- 1School of Economics and Management, University of Chinese Academy of Sciences, Beijing, China
- 2Collaborative Innovation Center for Computational Social Science, Harbin Institute of Technology, Harbin, China
Introduction: Identifying influential spreaders in complex networks is crucial for understanding information propagation and disease immunity. The spreading ability of a node has been commonly assessed through its neighbor information. However, current methods do not provide specific explanations for the role of neighbors or distinguish their individual contributions to the spread of information.
Methods: To address these limitations, we propose an efficient ranking algorithm that strictly distinguishes the contribution of each neighbor in information spreading. This method combines the count of common neighbors with the K-shell value of each node to produce its ranking. By integrating these two factors, our approach aims to offer a more precise measure of a node's influence within a network.
Results: Extensive experiments were conducted using Kendall’s rank correlation, monotonicity tests, and the Susceptible-Infected-Recovered (SIR) epidemic model on real-world networks. These tests demonstrated the effectiveness of our proposed algorithm in identifying influential spreaders accurately.
Discussion: Furthermore, computational complexity analysis indicates that our algorithm consumes less time compared to existing methods, suggesting it can be efficiently applied to large-scale networks.
1 Introduction
Over the past two decades, complex networks as abstractions of various real-world complex systems, have garnered significant attention [1, 2]. They are particularly instrumental in studying spreading processes across multiple domains in nature and human society. This includes controlling epidemics outbreaks [3], accelerating innovation diffusion, managing information dissemination [4, 5], overcoming cascading failures in power grids [6, 7], and preventing virus infection spread in computer networks, aiming to better understand the underlying mechanisms and consequences of such dynamic processes [8]. Identifying influential spreaders has emerged as a critical issue for effectively managing these spreading phenomena. Especially since the onset of COVID-19, timely identification of vital spreaders and implementation of interventions can significantly aid in controlling infectious disease outbreaks [9].
The identification of vital spreaders ties into the influence maximization problem, which seeks to discover a seed set of nodes that maximize influence under a given diffusion model [10]. Methods addressing this challenge can be categorized into three types: structural centrality methods, iterative refinement centrality methods, and greedy algorithms [11]. Structural centrality methods assign centrality values based on nodes’ specific structural or functional roles within the network, encompassing neighborhood-based methods like degree centrality (DC) and LocalRank [12], and path-based methods such as betweenness centrality (BC) and closeness centrality [13]. Iterative refinement methods identify influential nodes based on the mutual enhancement effects among nodes [14], with examples including PageRank [15], HITs [16], and LeaderRank [17]. These methods assume that a node’s influence is determined by its highly influential neighbors [18, 19], performing well in directed networks but less so in undirected ones.
Compared with neighborhood-based methods, path-based methods and iterative refinement methods require global topological information, leading to higher computational complexity but often greater accuracy. For instance, BC reflects the potential influence of a node to control information flow but involves calculating shortest paths repeatedly, causing high computational costs [20]. To improve the efficiency, some methods leverage node location information for evaluating spreading abilities. The K-shell decomposition algorithm (also called K-shell) selects influential nodes based on their network location through an iterative removal process [21]. Its robustness and low computational complexity make it suitable for many real-world networks [22]. However, it tends to classify too many nodes within a single shell, potentially differing in spreading ability, and multi-source nodes and spreading overlap can reduce its effectiveness [23]. Various improvements over the k-shell algorithm have been proposed [24, 25], yet there remains room for enhancing the K-shell algorithm.
Greedy algorithms (GAs) address the influence overlap issue from multiple sources by selecting a subset of nodes as seeds to maximize information coverage. Unlike centrality-based methods, Gas aim to find a seed set that incrementally maximizes influence [11]. Kempe et al. [26] used Monte Carlo simulations to repeatedly select nodes with the largest marginal influence increase, identifying a small seed set that updates incremental spreading. Mugisha and Zhou applied the belief propagation-guided decimation (BPD) to solve network optimal attack problems [27] and Li later extended BPD on factor graphs [28]. However, due to high computational complexity, most GAs are impractical for large or even moderately sized networks.
Given the intrinsic limitations of existing methods, such as balancing accuracy and the diversity of evaluation criteria, it is challenging to find a universal approach to quantify node spreading abilities [11]. In recent years, a group of hybrid centrality methods, as an improved version of centrality methods, has been provided to quantify the spreading abilities of nodes [29, 30]. Examples include combining local and semilocal indices [31] or local and global indices [32, 33]. Global indices evaluate a nodes’ spreading ability from the entire network topology, whereas local indices measure information exchange with immediate neighbors. Morone and Makse [34] proposed an optimization strategy by summing each node’s excess degree and its 1-order neighbors’ excess degrees to find the minimal set of influential nodes. Luan et al. [35] developed an improved closeness centrality (ICC) index using a semilocal iterative algorithm to enhance the detection of influential spreaders.
Hybrid centrality methods aim to fully leverage the advantages of various centrality indices, achieving a multidimensional evaluation of nodes’ spreading abilities. Particularly, a node’s information spreading capacity is reflected by its neighbors’ influence. Research has shown that exploring local network properties can compensate for the lack of global information and help identify optimal spreaders. For example, Hu et al. [36] found that global spreading size can be accurately measured using only local network properties when global information is unavailable. Zhong et al. [37] developed the Local Degree Dimension (LDD) algorithm, which evaluates node influence based on the number of neighbors at each layer. Li and Wang [38] categorized a node’s neighbors into four groups based on their K-shell scores and assigned different weights accordingly. Namtirtha et al. [39] proposed the Network Global Structure-based Centrality (NGSC) method, integrating K-shell and degree metrics for both nodes and their neighbors. Sheng et al. [40] used the number of common neighbors to measure the closeness of information sharing between nodes and their neighbors, distinguishing the importance of each neighbor.
While these methods have effectively improved identification accuracy and reduced computational complexity, selecting dimension indices that balance accuracy and simplicity remains a challenge. Existing methods still have limitations in describing the role of neighbors or distinguishing their contributions to information spreading. To address these issues, we propose a new algorithm designed to classify the contribution of neighbors from two perspectives: one aspect enhances the spreading effect within local connected areas, while the other measures the ability to transmit information to other regions of the network through neighbors. The ranking is produced by this algorithm combines each node’s number of common neighbors and its K-shell score. Simulations of the spreading process on 12 real-world networks using the standard SIR model show that our algorithm outperforms other widely used algorithms in terms of efficiency and computational complexity, which confirm the superiority of our approach.
2 Methods
For a spreading process, no matter what it propagates, information or virus, it always starts from several initial seed nodes. These seed nodes spread information or viruses to their neighbors. After the direct neighbor nodes are activated, it further spreads to the direct neighbors’ neighbors. In this way, the information will be transmitted in the target network. Obviously, the neighbors of a node are an important part of constructing its spreading ability. If we can fully understand the role of the node’s neighbors in the spreading process, we will be better equipped to identify super spreaders within the network. Based on this idea, we propose an adaptive and parameter-free centrality algorithm, namely, the semiglobal centrality focusing on neighbors contributions (SCNC) algorithm, which fully considers the multilayer contributions of neighbors in the spreading process. For the SCNC algorithm, the contribution of a node’s neighbors can be divided into two categories: one strengthens the propagation effect in the local area where the node is located, while the second expands the information carried by the node to other areas of the network.
For the sake of convenience, only unweighted and undirected networks are considered. These networks can be represented as a simple graph
In the first situation, we suppose that node i as the initial seed has two neighboring nodes j and k when node j is successfully activated, while node k is not. According to the mutual enhancement effect [14], if node i and node j share a common neighbor k, then node j will also try to activate node k with probability
In the second situation, node i as the initial seed has a neighboring node j, and node k can not connect directly to node i bypassing node j. When neighbor j is successfully activated by node i, node j will attempt to activate its neighbor node k, and then the information will be transmitted to a broader area through node k. In this case, node j plays the role of broker in the information spreading process. Moreover, the information can be transmitted externally only through the connection between node j and node k; otherwise, it will be limited to the local area where nodes i and j are located.
The key to distinguishing the contribution of node j is whether there is a common neighbor k between node i and node j. In this paper, we choose the number of common neighbors to measure the above two types of contributions of node j. The number of common neighbors has a simple and intuitive local attribute and can well measure the similarity between two nodes, so it is widely used as an index of link prediction in complex networks [41, 42]. Here, the number of common neighbors
where
The SCNC algorithm measures the first contribution of neighboring nodes based on the K-shell decomposition algorithm, that is, to strengthen the spreading effect in the closely connected local area where the node is located. Originally, the K-shell decomposition algorithm was used to measure the central position of nodes in the network by peeling off the outer nodes layer by layer, and the nodes located in the innermost layer are considered the most important nodes [21]. During the first stage, all nodes whose degree is 1 will be removed. The removal will cause the degree of some nodes to be reduced to 1. All the nodes with residual degree
In fact, this K-shell algorithm has an interesting attribute, that is, if the K-shell score of a node is equal to x, it must be at least in a fully connected subgraph with x+1 nodes. This attribute makes it easy to estimate the size of the most tightly connected area. Therefore, the first contribution of neighboring nodes of node i can be defined as:
where
In the second situation, the neighboring nodes of node i play the role of broker in the information spreading process. The information is carried by these “brokers” and can be transmitted to other areas of the network. The greater the proportion of the second contribution, the more important the role of the corresponding neighbor node in information spreading. Compared with the first contribution, the second contribution is to promote the dissemination of information in the whole network, and its role should be more important, so it is taken as an exponential form, whose score is determined by the degree and common neighbors, to participate in the operation. In this paper, the second contribution of neighbors of node i
The total contribution is the combination of the above two aspects, the first contribution and the second contribution. Therefore, the SCNC of node i can be defined as:
The algorithmic description of the SCNC is stated as follows.
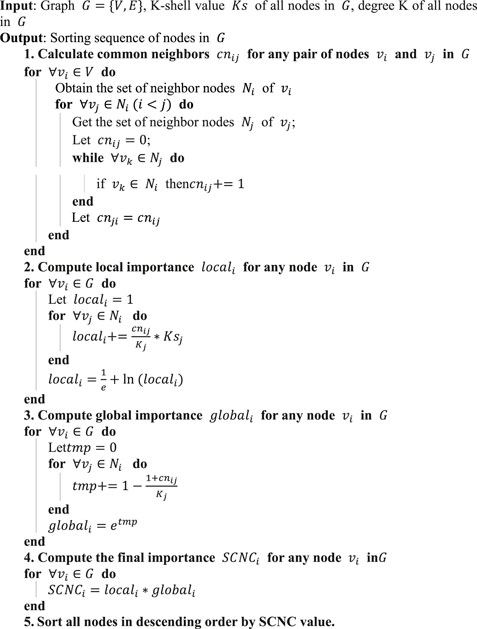
Algorithm 1. Pseudocode for the SCNC.
The hybrid algorithm proposed in this paper is capable of evaluating ability of nodes from both local and global perspectives. By combining these two approaches, it not only ensures that computational complexity does not increase but also compensates for the shortcomings of using a single metric. To better illustrate the computational procedure of our algorithm, we introduce a graph with 11 nodes and 17 edges to show the calculation process. In Figure 1, node
The neighbors of node
According to Equation 3, the spreading effect of node
It is worth noting that the second contribution provided by
Finally, according to Equation 4, the SCNC score of node
The SCNC values of other nodes in the example graph can be calculated according to a similar process. In our study, six widely-used algorithms including DC, BC, K-shell [21], PageRank, ICC [35] and NGSC [39] are introduced as benchmark algorithms. Table 1 shows the DC, BC, K-shell, PageRank (PR), ICC, NGSC1, NGSC2 and SCNC values of each node in the example network. In the NGSC1 and NGSC2, the parameter tune one is uniformly set to 0.9, and the parameter tune 2 is set to 0.2 and 0.6, respectively. According to the nodal influence values, in a descending order the ranking results of the above ranking methods are: according to SCNC, the ranking result is
According to SCNC ranking list, node
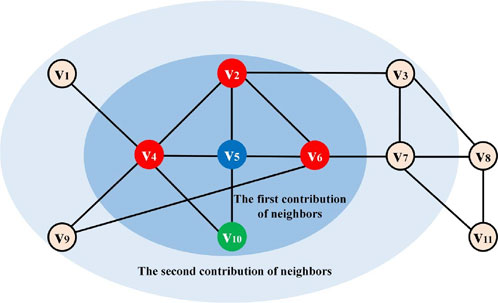
Figure 1. An illustrative example of a simple graph with 11 nodes and 17 edges.
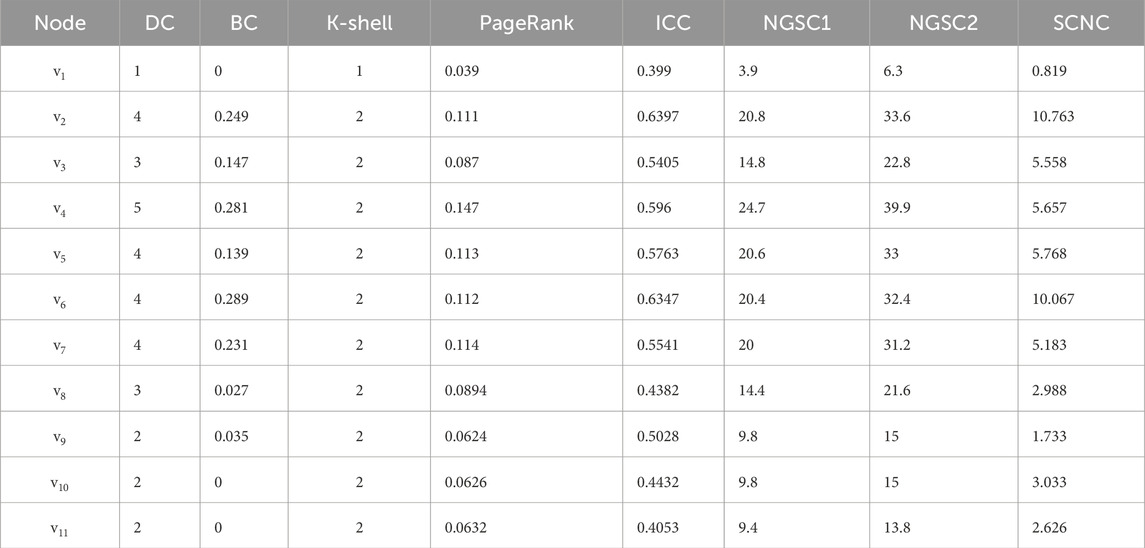
Table 1. Values of various algorithms in the example graph.
3 Experimental evaluation
3.1 Experimental data
To verify the effectiveness of our algorithm, we empirically examine 12 real collaboration networks, ranging in size from thousands of nodes to tens of thousands of nodes. The sample network datasets include: (1) CA-GrQc, which is a scientific collaboration network covering General Relativity and Quantum Cosmology; (2) CA-HepTh, which is a scientific collaboration network covering High Energy Physics-Theory category; (3) Deezer- Europe, which is a social network of Deezer users from European countries; (4) Email-Enron, which is a Email network from Enron company; (5) Musae-Facebook, which is a page-page graph of verified Facebook sites; (6) Musae-ES, which is a Twitch Spanish gamers networks; (7) Musae-RU, which is a Twitch Russian gamers networks; (8) Power, which is a power network of the United States; (9) p2p-Gnutella24 describes a Gnutella P2P network on 24 August 2002; (10) p2p-Gnutella30 describes a Gnutella P2P network on 30 August 2002; (11) Politician describes a politician page network by verified Facebook; Public-Figure describes a public figures network by verified Facebook. All datasets are publicly available and can be collected from the Stanford network datasets (http://snap.stanford.edu/data/index.html). The basic statistics information about twelve sample networks are shown in Table 2.
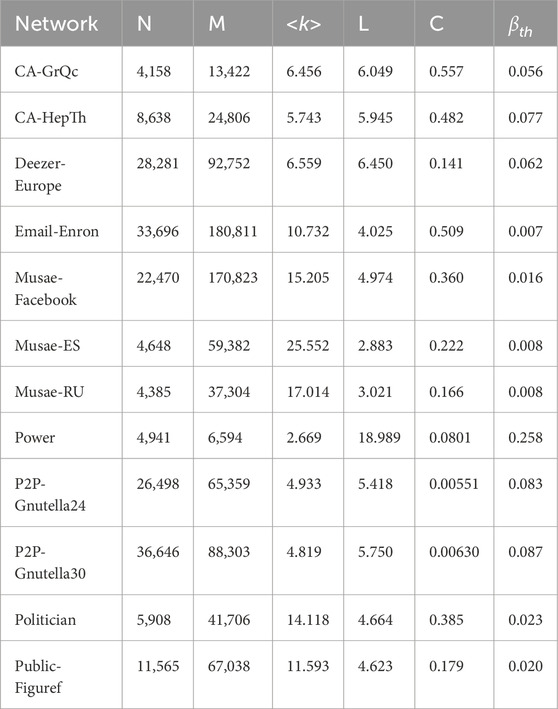
Table 2. The topological characteristics of the sample networks, where N and M are the number of nodes and edges, <k > represents the average degree, L is the average path length, C is clustering coefficient, and epidemic threshold is
3.2 Experimental analysis
In this section, Kendall’s tau coefficient, ranking monotonicity, the standard Susceptible-Infected-Recovered (SIR) epidemic model, and computational complexity are introduced to calculate and compare the performance of our algorithm (SCNC) and other algorithms. The nodal ranking list is calculated in the abovementioned twelve sample networks according to the DC, BC, K-shell, PageRank, ICC, NGSC and SCNC algorithms. All nodes in a sample network are ordered according to their corresponding influence values obtained by various ranking algorithms in a descending manner. If the influence values of nodes are equal, these nodes have the same ranking order.
First, Kendall’s tau coefficient is introduced as the comparison tool to measure the ranking consistency of our algorithm and other benchmark algorithms. A higher Kendall correlation coefficient indicates greater similarity between the two ranking algorithms. Kendall’s tau coefficient
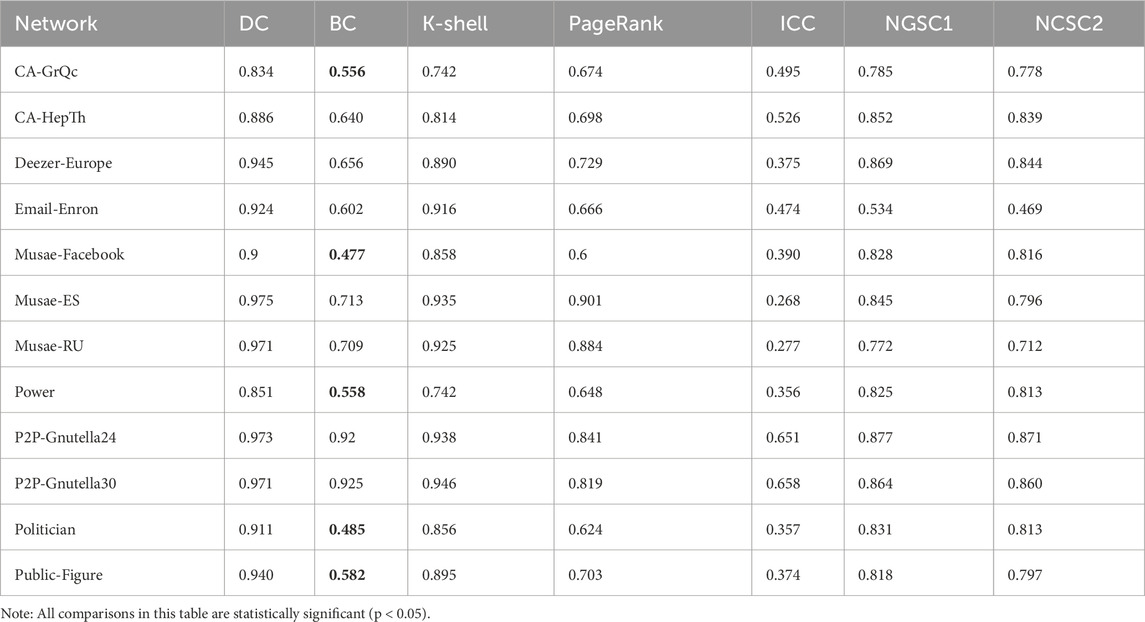
Table 3. Kendall’s tau correlation values between our algorithm (SCNC) and the benchmark algorithms for twelve real networks.
In the next step, another commonly used performance of ranking algorithms will be discussed. Monotonicity is introduced to quantify the resolution of various ranking algorithms. The monotonicity of a ranking algorithm increases when it assigns different ranks to all nodes and decreases when a large number of nodes are concentrated in the same ranking. The monotonicity can be calculated as follows:
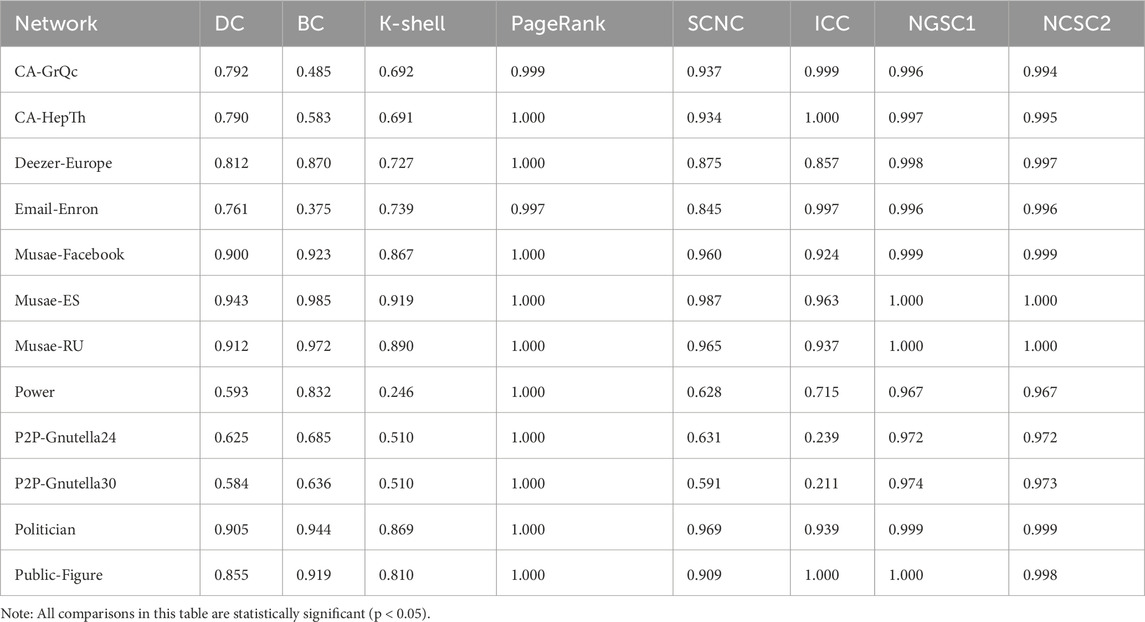
Table 4. Monotonicity
The appearance frequency of a ranking order refers to the number of nodes that appear in the same ranking. It is well known that if the appearance frequency of the ranking order calculated according to a given ranking algorithm is very high, it will mean that it is difficult for the ranking algorithm to strictly distinguish influence differences among nodes. Figure 2 further shows the discriminating degree of various ranking algorithms in identifying the nodal influence by calculating the cumulative appearance frequency of ranking orders. We observe that the K-shell and the DC have a very limited ranking orders (see the x-axis value), which means that the number of nodes placed in each rank is quite high. Comparatively, BC, PageRank, ICC, NGSC and SCNC are fine-grained ranking algorithms and generate a higher number of nodes with unique ranks. However, we also clearly see that SCNC, similar to BC and ICC, can well distinguish nodes located in the top of the ranking sequences but does not perform well for nodes located in the tail of the ranking sequences, which causes a large number of tail nodes to be concentrated (see the y-axis, where there is a breakpoint at the tail of the cumulative appearance frequency).
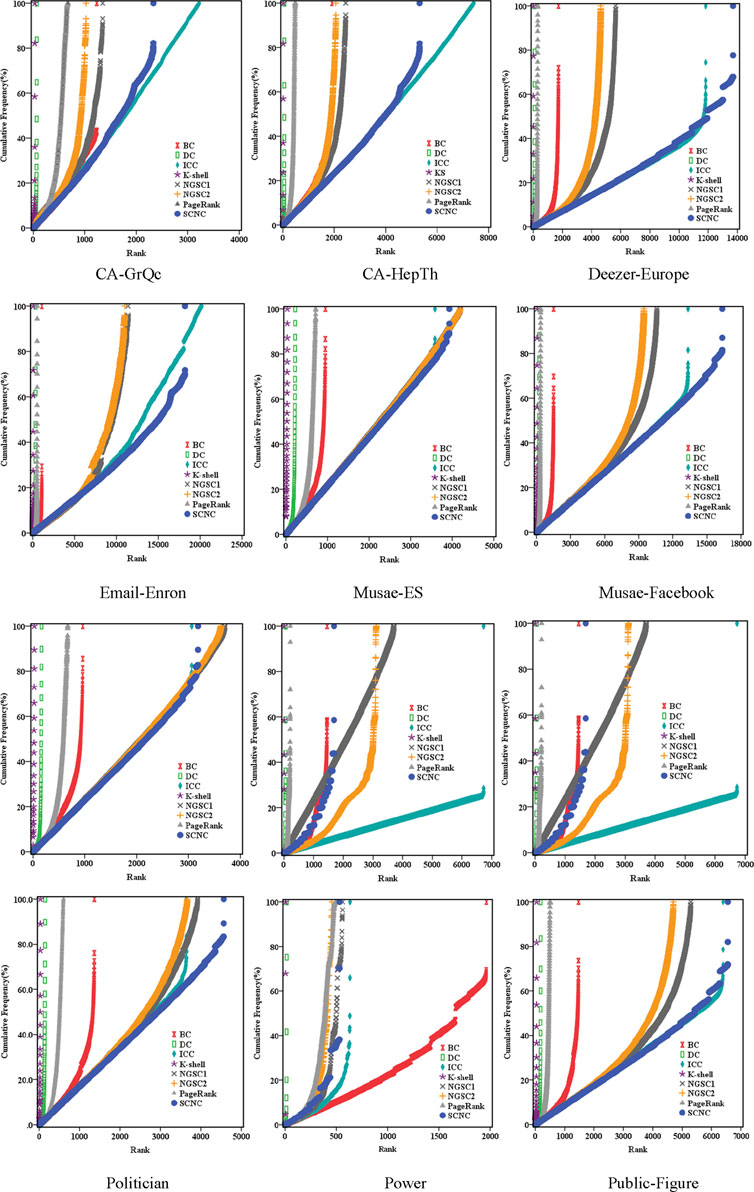
Figure 2. The cumulative appearance frequency of the ranking order based on DC, BC, K-shell, PageRank, ICC, NGSC1, NGSC2 and SCNC. In the NGSC1, the parameter tune 1 is 0.9 and the parameter tune 2 is set to 0.2; In the NGSC2, the parameter tune 1 is 0.9 and the parameter tune 2 is 0.6.
In general, the more important nodes activate more nodes during the spreading process. In other words, they may have greater spreading abilities. In this experiment, we use the standard SIR epidemic model to measure the spreading efficiency of target nodes in real social networks and to illustrate the competitive advantages of our algorithm over six widely-used algorithms. The standard SIR model considers the nodes of the network as one of three possible states: susceptible state S(t), infected state I(t) and recovered state R(t). Only a few nodes are in infected state initially, named seed nodes, while other nodes are set to be susceptible. As the originators of diseases, the initial seed nodes can be selected by various ranking algorithms. In the whole spreading process, each susceptible node who comes into contact with its infected neighbors will become an infected node with an infection probability of β. Meanwhile, the infected nodes can be recovered with a recovery probability of γ. Once a node converts to the recovered state, it will neither be re-infected nor infect others.
The iterative spreading process continues until there are no infected nodes in the network and each node maintains a stable state. The normalized infection rate F(t) is used to measure the spreading abilities of the infected nodes. F(t) represents the proportion of the sum of infected nodes I and recovered nodes R at time t, which can be presented as follows:
In the present study, we choose the top-10 nodes of each ranking algorithm as the initial spreaders, namely, the seed nodes, and all of the other nodes in the network are marked as susceptible nodes. The numerical simulation is conducted according to the standard SIR model, and the final F (t) is the average value obtained by 1,000 repeated calculations. The abscissa in Figure 3 represents the time step of the iteration in the standard SIR model, and the ordinate is the function F (t). By comparing the changes of F (t) under different infection sources, we can find that in most of the sample networks, the initial infection sources determined by the SCNC algorithm spread faster, and the final spreading scopes always reached the highest value.
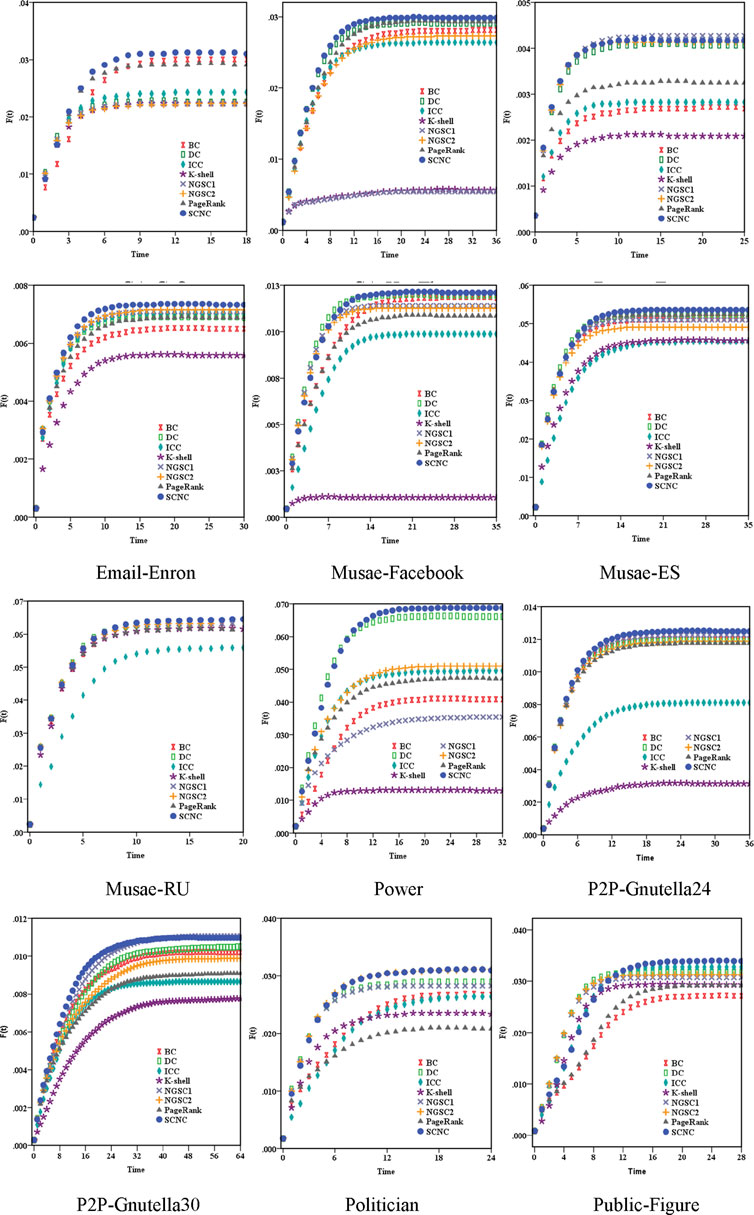
Figure 3. Plot of the spreading scope of initial infection sources obtained by different ranking algorithms in 12 real networks. The infection probability β is 0.06 in CA-GrQc, 0.08 in CA-HepTh, 0.07 in Deezer-Europe, 0.01 in Email-Enron, 0.02 in Musae-Facebook, 0.01 in Musae-ES, 0.01 in Musae-RU, 0.4 in Power, 0.09 in P2P-Gnutella 24, 0.09 in P2P-Gnutella30, 0.03 in Politician, and 0.03 in Public-Figure. The recovery rate
For example, in the CA-GrQc and Email-Enron datasets, when the iteration stops, the infection curve determined by SCNC is above all the curves, and the subsequent curves are accordingly determined by DC, PageRank, BC, ICC, NGSC and K-shell. Similarly, in the CA-GrQc, CA-HepTh, Power, p2p-Gnutella30, Politician, and Public-Figure datasets, the infection scope determined by SCNC is always the largest. Even in Musae-Facebook, Musae-ES, Musae-RU and p2p-Gnutella24, the infection curves determined by various ranking algorithms except the K-shell algorithm are very similar to the changes, but the infection curves determined by the SCNC algorithm are often in the optimal position. In addition, we find that the performance of NGSC largely depends on the suitable variable parameters, which can be selected and modified in the numerical tests. Experimental results further demonstrate the effectiveness of the SCNC algorithm, which has higher stability and accuracy and can be applied to different types of networks.
Finally, we briefly analyze the computational complexity of our algorithm. The total running times of SCNC include three parts: (1) the time computing the number of common neighbors between nodes; (2) the time computing the K-shell values of each node; and (3) the time computing the degree of each node. For the first part, the algorithm needs to traverse the neighbors of each node, so its average complexity is approximately
4 Conclusion
Previous studies have indicated that the spreading ability of a node depend on the quantity and quality of the other nodes pointing to it. However, they still do not give a specific description of the role of neighbors in propagation or distinguish the contributions of neighbors in different dimensions. Inspired by the PageRank algorithm, a new identification algorithm, named the semiglobal centrality focusing on neighbors contributions (SCNC) algorithm, is proposed to identify and quantify the spreading abilities of nodes in a complex network. Compared with previous algorithms, the SCNC algorithm strictly distinguishes the contribution of neighbors in information spreading from two aspects: one strengthens the spreading effect of nodes located in locally connected areas, and the other measures the ability to transmit information to other regions of the network through their neighbors. This design enables SCNC to more comprehensively assess nodes' spreading capabilities, surpassing the limitations of traditional methods that rely on single metrics. Additionally, we found that SCNC exhibits strong correlations with DC, K-shell, PageRank, and NGSC algorithms, while showing weaker correlations with BC and ICC algorithms. This phenomenon may reveal the different emphases these algorithms place on network structure and provides a theoretical basis for selecting appropriate spreader identification methods. Furthermore, extensive experiments on real networks datasets explicitly demonstrates that the SCNC algorithm achieves high performance equal to or better than existing well-known ranking algorithms. Its main advantages lie in high accuracy and low computational complexity, and has good ranking differentiation. The shortcoming of the SCNC algorithm is that it only considers the contribution from the first-order neighborhood nodes but does not consider the higher-order neighbor information. Although it makes SCNC less runtime, it also loses some accuracy. Future work will consider measuring the contribution from the second-or higher-order neighbors based on the local structure of the network under the premise of ensuring relatively low computational complexity.
Data availability statement
The original contributions presented in the study are included in the article/Supplementary Material, further inquiries can be directed to the corresponding author.
Author contributions
WZ: Writing–original draft. XM: Writing–original draft. JS: Writing–original draft. DZ: Writing–review and editing.
Funding
The author(s) declare that financial support was received for the research, authorship, and/or publication of this article. This work was supported by the Fundamental Research Funds for the Central Universities (No. SYL-JC-202203 and HIT.HSS.201917).
Conflict of interest
The authors declare that the research was conducted in the absence of any commercial or financial relationships that could be construed as a potential conflict of interest.
Generative AI statement
The author(s) declare that no Generative AI was used in the creation of this manuscript.
Publisher’s note
All claims expressed in this article are solely those of the authors and do not necessarily represent those of their affiliated organizations, or those of the publisher, the editors and the reviewers. Any product that may be evaluated in this article, or claim that may be made by its manufacturer, is not guaranteed or endorsed by the publisher.
Supplementary material
The Supplementary Material for this article can be found online at: https://www.frontiersin.org/articles/10.3389/fphy.2025.1529904/full#supplementary-material
References
1. Li HJ, Song S, Tan W, Huang Z, Li X, Xu W, et al. Characterizing the fuzzy community structure in link graph via the likelihood optimization. Neurocomputing (2022) 512:482–93. doi:10.1016/j.neucom.2022.09.013
2. Li H, Cao H, Feng Y, Li X, Pei J. Optimization of graph clustering inspired by dynamic belief systems. IEEE Trans Knowledge Data Eng (2023) 36:6773–85. doi:10.1109/tkde.2023.3274547
3. Pastor-Satorras R, Vespignani A. Epidemic spreading in scale-free networks. Phys Rev Lett (2001) 86:3200–3. doi:10.1103/physrevlett.86.3200
4. Araujo T, Neijens P, Vliegenthart R. Getting the word out on Twitter: the role of influentials, information brokers and strong ties in building word-of-mouth for brands. Int J Advertising (2017) 36:496–513. doi:10.1080/02650487.2016.1173765
5. Gupta M, Mishra R. Spreading the information in complex networks: identifying a set of top-N influential nodes using network structure. Decis Support Syst (2021) 149:113608. doi:10.1016/j.dss.2021.113608
6. Buldyrev SV, Parshani R, Paul G, Stanley HE, Havlin S. Catastrophic cascade of failures in interdependent networks. Nature (2010) 464:1025–8. doi:10.1038/nature08932
7. Kinney R, Crucitti P, Albert R, Latora V. Modeling cascading failures in the North American power grid. Eur Phys J B (2005) 46:101–7. doi:10.1140/epjb/e2005-00237-9
8. Wang W, Liu Q-H, Liang J, Hu Y, Zhou T. Coevolution spreading in complex networks. Phys Rep (2019) 820:1–51. doi:10.1016/j.physrep.2019.07.001
9. Chaharborj SS, Nabi KN, Phang PS, Phang PS. Controlling COVID-19 transmission with isolation of influential nodes. Chaos Solitons and Fractals (2022) 159:112035. doi:10.1016/j.chaos.2022.112035
10. Zhao Y, Li S, Jin F. Identification of influential nodes in social networks with community structure based on label propagation. Neurocomputing (2016) 210:34–44. doi:10.1016/j.neucom.2015.11.125
11. Lü L, Chen D, Rend XL, Zhang QM, Zhang YC, Zhou T. Vital nodes identification in complex networks. Phys Rep (2016) 650:1–63. doi:10.1016/j.physrep.2016.06.007
12. Chen D, Lü L, Shang MS, Zhang YC, Zhou T. Identifying influential nodes in complex networks. Physica A (2012) 391(4):1777–87. doi:10.1016/j.physa.2011.09.017
13. Freeman LC. Centrality in social networks conceptual clarification. Social Networks (1978) 1(3):215–39. doi:10.1016/0378-8733(78)90021-7
14. Wittenbaum GM, Hubbell AP, Zuckerman C. Mutual enhancement: toward an understanding of the collective preference for shared information. J Personal Soc Psychol (1999) 77:967–78. doi:10.1037//0022-3514.77.5.967
15. Brin S, Page L. The anatomy of A large-scale hypertextual web search engine. Computer Networks ISDN Syst (1998) 30:107–17. doi:10.1016/s0169-7552(98)00110-x
16. Kleinberg JM. Authoritative sources in a hyperlinked environment. J ACM (1999) 46:604–32. doi:10.1145/324133.324140
17. Xu S, Wang P. Identifying important nodes by adaptive LeaderRank. Physica A (2017) 469:654–64. doi:10.1016/j.physa.2016.11.034
18. Liu B, Jiang S, Zou Q. HITS-PR-HHblits: protein remote homology detection by combining PageRank and hyperlink-induced topic search. Brief Bioinformatics (2020) 21(1):298–308. doi:10.1093/bib/bby104
19. Pan W, Ming H, Chang CK, Yang Z, Kim DK. ElementRank: ranking java software classes and packages using a multilayer complex network-based approach. IEEE Trans Softw Eng (2019) 47(10):2272–95. doi:10.1109/tse.2019.2946357
20. Freeman LC. A set of measures of centrality based on betweenness. Sociometry (1977) 40:35–41. doi:10.2307/3033543
21. Kitsak M, Gallos LK, Havlin S, Liljeros F, Muchnik L, Stanley HE, et al. Identification of influential spreaders in complex networks. Nat Phys (2010) 6(11):888–93. doi:10.1038/nphys1746
22. Chen B-L, Jiang W-X, Chen Y-X, Chen L, Wang RJ, Han S, et al. Influence blocking maximization on networks: models, methods and applications. Phys Rep (2022) 976:1–54. doi:10.1016/j.physrep.2022.05.003
23. Maji G, Namtirtha A, Dutta A, Malta MC. Influential spreaders identification in complex networks with improved k-shell hybrid method. Expert Syst Appl (2020) 144:113092. doi:10.1016/j.eswa.2019.113092
24. Namtirtha A, Dutta A, Dutta B. Identifying influential spreaders in complex networks based on kshell hybrid method. Physica A (2018) 499:310–24. doi:10.1016/j.physa.2018.02.016
25. Wang M, Li W, Guo Y, Peng X, Li Y. Identifying influential spreaders in complex networks based on improved k-shell method. Physica A (2020) 554:124229. doi:10.1016/j.physa.2020.124229
26. Kempe D, Kleinberg J, Tardos E. Maximizing the spread of in uence through a social network. In: Proceedings of the 9th ACM SIGKDD international conference on knowledge discovery and data mining. Washington DC, USA (2003). p. 137–46.
27. Mugisha S, Zhou HJ. Identifying optimal targets of network attack by belief propagation. Phys Rev E (2016) 94(1):012305. doi:10.1103/physreve.94.012305
28. Li T. Network dismantling on factor graphs: break long loops and spare local structures. New J Phys (2021) 23(10):103014. doi:10.1088/1367-2630/ac28ca
29. Berahmand K, Bouyer A, Samadi N. A new local and multidimensional ranking measure to detect spreaders in social networks. Computing (2019) 101:1711–33. doi:10.1007/s00607-018-0684-8
30. Namtirtha A, Dutta B, Dutta A. Semi-global triangular centrality measure for identifying the influential spreaders from undirected complex networks. Expert Syst Appl (2022) 206:117791. doi:10.1016/j.eswa.2022.117791
31. Wen T, Pelusi D, Deng Y. Vital spreaders identification in complex networks with multi-local dimension. Knowledge-Based Syst (2020) 195:105717. doi:10.1016/j.knosys.2020.105717
32. Qiu LQ, Zhang JY, Tian XB. Ranking influential nodes in complex networks based on local and global structures. Appl Intelligence (2021) 51:4394–407. doi:10.1007/s10489-020-02132-1
33. Ullah A, Wang B, Sheng J, Long J, Khan N, Sun Z. Identifying vital nodes from local and global perspectives in complex networks. Expert Syst Appl (2021) 186:115778. doi:10.1016/j.eswa.2021.115778
34. Morone F, Makse HA. Influence maximization in complex networks through optimal percolation. Nature (2015) 524:65–8. doi:10.1038/nature14604
35. Luan YY, Bao ZK, Zhang HF. Identifying influential spreaders in complex networks by considering the impact of the number of shortest paths. J Syst Sci and Complexity (2021) 34(6):2168–81. doi:10.1007/s11424-021-0111-7
36. Hu Y, Ji S, Jin Y, Feng L, Stanley HE, Havlin S. Local structure can identify and quantify influential global spreaders in large scale social networks. Proc Natl Acad Sci USA (2018) 115:7468–72. doi:10.1073/pnas.1710547115
37. Zhong S, Zhang H, Deng Y. Identification of influential nodes in complex networks: a local degree dimension approach. Inf Sci (2022) 610:994–1009. doi:10.1016/j.ins.2022.07.172
38. Li C, Wang L, Sun S, Xia C. Identification of influential spreaders based on classified neighbors in real-world complex networks. Appl Mathematics Comput (2018) 320:512–23. doi:10.1016/j.amc.2017.10.001
39. Namtirtha A, Dutta A, Dutta B, Sundararajan A, Simmhan Y. Best influential spreaders identification using network global structural properties. Scientific Rep (2021) 11:2254. doi:10.1038/s41598-021-81614-9
40. Sheng J, Dai J, Wang B, Duan G, Long J, Zhang J, et al. Identifying influential nodes in complex networks based on global and local structure. Physica A: Stat Mech its Appl (2020) 541:123262. doi:10.1016/j.physa.2019.123262
41. Yang JX, Zhang XD. Predicting missing links in complex networks based on common neighbors and distance. Scientific Rep (2016) 6:38208. doi:10.1038/srep38208
42. Zhou T, Lu LY, Zhang YC. Predicting missing links via local information. Eur Phys J B (2009) 71:623–30. doi:10.1140/epjb/e2009-00335-8
43. Kendall MG. The treatment of ties in ranking problems. Biometrika (1945) 33:239–51. doi:10.2307/2332303
Keywords: large-scale network, rankinig method, vital spreaders, common neighbors, SIR epidemic model
Citation: Zhu W, Meng X, Sheng J and Zhang D (2025) Identifying vital spreaders in large-scale networks based on neighbor multilayer contributions. Front. Phys. 13:1529904. doi: 10.3389/fphy.2025.1529904
Received: 18 November 2024; Accepted: 06 January 2025;
Published: 27 January 2025.
Edited by:
Hui-Jia Li, Nankai University, ChinaReviewed by:
Jinlong Ma, Hebei University of Science and Technology, ChinaGe Gao, Beijing Sport University, China
Copyright © 2025 Zhu, Meng, Sheng and Zhang. This is an open-access article distributed under the terms of the Creative Commons Attribution License (CC BY). The use, distribution or reproduction in other forums is permitted, provided the original author(s) and the copyright owner(s) are credited and that the original publication in this journal is cited, in accordance with accepted academic practice. No use, distribution or reproduction is permitted which does not comply with these terms.
*Correspondence: Weiwei Zhu, aGl0aWNjQDE2My5jb20=;