 Yunfeng Xia
 Qishuai Liang
95% of researchers rate our articles as excellent or good
Learn more about the work of our research integrity team to safeguard the quality of each article we publish.
Find out more
ORIGINAL RESEARCH article
Front. Phys. , 17 February 2025
Sec. Optics and Photonics
Volume 13 - 2025 | https://doi.org/10.3389/fphy.2025.1526356
This article is part of the Research Topic Advances in High-Power Lasers for Interdisciplinary Applications, Volume II View all 7 articles
Polycarbonate + Acrylonitrile-Butadiene-Styrene (PC + ABS) is a typical non-metallic material used for electric meter enclosures, characterized by its corrosion resistance, excellent insulation properties, and lightweight nature, making it widely applicable in power supply systems. However, prolonged exposure to outdoor environments often leads to performance degradation, which can affect normal usage. Therefore, developing rapid detection technologies to timely identify and rectify potential faults is particularly important. This not only ensures the stable operation of the power grid but also enhances the overall performance and efficiency of the power system. This study employs Laser-Induced Breakdown Spectroscopy (LIBS) technology and proposes a method for the rapid detection of PC + ABS materials by optimizing testing system parameters. The research utilizes LIBS data to classify different formulations of PC + ABS based on Support Vector Machine (SVM) and Self-Organizing Map (SOM) neural networks. The results indicate that the classification accuracy of SVM reached 98.4%, while the unsupervised classification through the SOM neural network maintained approximately 90% consistency among the three different samples. This method achieves rapid detection and classification of PC + ABS electric meter enclosures, providing new theoretical and practical foundations for enhancing the safety and stable operation of the power grid system.
In the era of swiftly progressing smart grid technology, non-metallic electric meter boxes have risen as quintessential elements within power systems. These components are instrumental in maintaining the stable operation of the power grid, a testament to their safety, reliability, and enduring durability. The construction of these meter boxes predominantly employs polycarbonate alloyed with acrylonitrile-butadiene-styrene (PC + ABS), a material celebrated for its superior insulating characteristics, robust resistance to chemical corrosion, and notable longevity [1–3]. In outdoor electric meter boxes, PC + ABS materials are primarily used for the enclosures of electric meters, which protect the meters from external environmental influences. Figure 1 shows a common outdoor electric meter box. However, there is considerable variation in the quality of products from domestic manufacturers, due to disparities in material selection and inconsistencies in manufacturing and quality control processes. This variation results in inconsistent product quality, necessitating extensive testing before integration into the grid to verify compliance with standards.
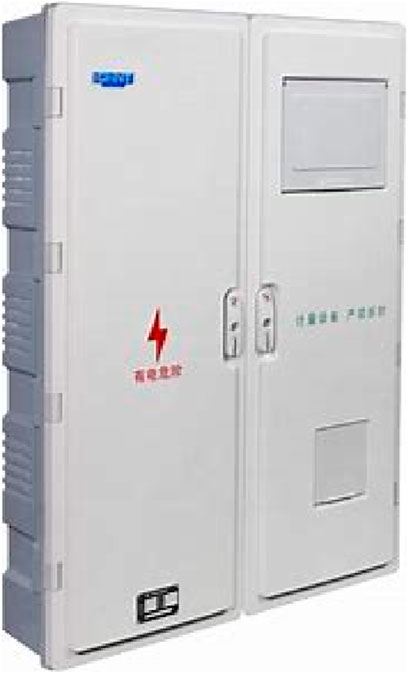
Figure 1. A outdoor electric meter box.
Additionally, since these meter boxes are generally installed outdoors, they are exposed to harsh environmental conditions that can lead to material degradation, performance issues, and faults over time, including exposure to ultraviolet radiation, humidity, and fluctuating temperatures. Statistical data indicate that the average lifespan of a metering box is 5–10 years, with about 30% of replacements due to material degradation. The degradation of PC + ABS materials can lead to a decrease in the insulation performance of meter boxes, increasing the risk of leakage and short circuits, thereby affecting the stable operation of the power grid. Therefore, timely detection and replacement of degraded meter boxes are crucial for ensuring the safe operation of the power grid. Consequently, research into rapid detection methods for non-metallic electric meter boxes is crucial for early identification of potential issues, fault prevention, and improved power grid operational efficiency.
Currently, the detection technologies employed for assessing electric energy meter boxes are characterized by low efficiency and inaccuracy, particularly lacking in methods suitable for both networked inspections and outdoor surveys. Traditional detection methods for electric meter boxes mainly include visual inspection, mechanical property testing, and chemical analysis. Visual inspection relies on manual observation, which is inefficient and prone to missed detections; mechanical property testing is destructive, time-consuming, and costly; chemical analysis requires complex sample preprocessing and is cumbersome to operate. In contrast, LIBS technology offers the advantages of being rapid, non-destructive, and capable of real-time analysis. It can quickly determine the elemental composition and performance status of electric meter box materials without destroying the samples, significantly improving detection efficiency and accuracy. Consequently, LIBS conserves labor and material resources while markedly enhancing the precision of measurements [4–6]. It is convenient for networked inspections and maintenance personnel to repair, which has important engineering significance and economic benefits for improving the reliability of the power grid supply.
LIBS is a cutting-edge technique for detecting material composition. A laser emitter directs high-energy pulses at the sample surface, ablating and exciting it to create plasma. Subsequently, a spectrometer captures the atomic emission spectrum of the plasma to identify the elemental composition of the sample, enabling material identification, classification, and qualitative and quantitative analysis [7, 8]. Over the past 40 years, the emergence of portable, low-cost lasers and higher-resolution spectrometers have propelled LIBS into prominence across diverse sectors, including extraterrestrial exploration [9, 10], cultural artifact identification [11, 12], life sciences [13, 14], and environmental monitoring [15, 16]. Figure 2 illustrates a portable remote LIBS system with an overall weight of 16 kg, utilizing a non-coaxial optical path, capable of performing remote detection of samples at a distance of 5 m.
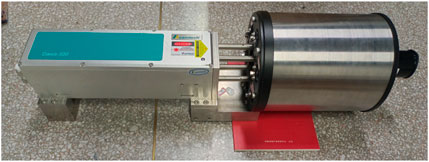
Figure 2. A remote LIBS system.
A standard LIBS detection system consists of the following parts: a laser emission module, an optical pathway assembly, a delay controller, a spectral data acquisition module, a spectrometer, and a computer [17]. Researchers use an optical lens to focus the pulsed laser emitted by the laser generator onto the surface of the sample. This interaction results in a localized area of the sample being rapidly heated, ablated, and ionized, giving rise to a plasma. After the pulsed laser stops, the plasma gradually cools and expands. The atoms and ions within it transition from a high energy level to lower energy levels, emitting photons that produce a characteristic spectrum. This spectrum’s wavelengths reveal the elemental constituents of the material, while the spectral lines’ intensities reflect the material’s elemental concentrations. Under the control of the delay controller, the spectrometer captures and relays the spectral data through an interface probe to the computer for detailed analysis. These data enable both qualitative and quantitative assessments of the sample’s composition [18–20].
The elemental composition and spectral line intensities identified through LIBS are subject to variation, dependent on the sample’s unique makeup. This variability is harnessed by researchers across disciplines such as soil science, agriculture, food analysis, and archaeology. By integrating LIBS with machine learning algorithms, they process spectral data to distinguish between samples that are typically challenging to categorize. Furthermore, this approach augments material quality assessments and aids in age determination studies [21].
Lukas et al. [22] utilized LIBS to analyze two typical structured synthetic polymer samples (two-dimensional structures and multi-layer systems). They performed imaging on five types of two-dimensional structured samples (Acrylonitrile-Butadiene-Styrene (ABS), Polylactic Acid (PLA), Polyethylene (PE), Polyacrylate (PAK), and Polyvinyl Chloride (PVC)) using Principal Component Analysis (PCA) and successfully classified the distribution of polymers through k-means clustering. The spatially resolved classification results were validated by comparing the distribution of the obtained two-dimensional structured samples with the elemental distribution of contaminants present within the synthetic polymers.
Michel et al. [23] compared the accuracy of four spectroscopic techniques: Attenuated Total Reflectance - Fourier Transform Infrared Spectroscopy (ATR-FTIR), Near-Infrared (NIR) reflectance spectroscopy, Laser-Induced Breakdown Spectroscopy (LIBS), and X-ray Fluorescence (XRF) spectroscopy in identifying the types of consumer plastics and marine plastic debris (MPD). Using machine learning classifiers, the success rates for identifying consumer plastic types with ATR-FTIR, NIR reflectance spectroscopy, LIBS, and XRF were 99%, 91%, 97%, and 70%, respectively. The classification success rates for MPD were similar or lower, at 99%, 81%, 76%, and 66%, respectively.
Costa et al. [24] achieved rapid identification of high-density polyethylene (HDPE) and low-density polyethylene (LDPE) used in toy manufacturing using LIBS. Multivariate data analysis was performed using Principal Component Analysis (PCA) to classify 10 LDPE samples, 10 HDPE samples, and 10 recycled HDPE samples. The data analysis clearly indicated that the elemental and molecular information obtained from LIBS is effective for identifying the three types of polyethylene.
In recent years, the combination of LIBS technology and machine learning algorithms has made significant progress in material classification. For example, Erik et al. [25] trained a simple convolutional neural network for classifying the dataset collected by the ChemCam LIBS instrument of the Curiosity Mars rover, and interpreted the relationship between the eigenvalues in the classification model and the original spectral emission lines.
This study utilized LIBS technology to analyze a variety of PC + ABS composite samples, investigated the influence of test parameters on the spectral signals of the samples, and established an optimal set of parameters for LIBS analysis. Principal component analysis (PCA) was used to process the spectral data of different samples. Subsequently, SVMs and self-organizing map (SOM) neural networks were employed for the classification of materials with different formulations. This comprehensive approach enabled both material testing and the rapid classification of non-metallic electric energy meter boxes using LIBS.
As depicted in Figure 3, the LIBS apparatus comprises a laser, an optical path system, optical fibers, a spectrometer, a delay controller, and a computer. The laser emitter of the LIBS apparatus generates intense high-energy pulses, which traverse a precision reflector and an array of calibrated lenses designed to concentrate the laser’s energy onto the sample surface. This precise focusing results in the ablation of a minuscule sample portion, leading to excitation and the subsequent formation of a plasma. The plasma’s characteristic emission spectrum, which contains valuable elemental information, is captured and directed towards the spectrometer’s detection probe by a supplementary series of optical lenses. Thereafter, the captured spectral data is conveyed to a computer system for detailed subsequent analysis. A digital delay controller meticulously manages the temporal coordination between the laser emitter and the spectrometer, ensuring the synchronized functioning of these two critical components.

Figure 3. Physical diagram of LIBS device.
This experiment employs a nanosecond Nd: YAG laser (Nimma-900 model) from Lei Bao Optoelectronics. By switching, it can produce four different wavelengths: 1,064, 532, 355, and 266 nm. The 1,064 nm wavelength is selected for its superior energy stability and low atmospheric absorption, ensuring efficient transmission. This wavelength also aligns with the spectrometer’s measurement range, facilitating an unobstructed spectral acquisition. The spectrometer, an Avantes AVS-RACKMOUNT-USB2, spans a wavelength range of 200–640 nm with a resolution between 0.09 and 0.13 nm. The direction of the fiber optic probe used by the spectrometer to receive spectral signals is set at a 45° angle to where the sample is struck by the laser, to ensure that the spectral signals have a higher intensity. The laser passes through one reflector and a convex lens with a diameter of 2 cm and a focal length of 5 cm to focus on the sample surface. The spectrum generated by the sample excitation is focused onto the fiber optic probe by a convex lens with a diameter of 6 cm and a focal length of 15 cm, which is then captured by the spectrometer as raw spectral data. The collected data is then processed and stored using Avasoft 8.8 software. The signal delay generator, an eight-channel DG645, offers a delay resolution of 5 ps across all channels, with channel jitter under 25 ps and delay control accuracy at 1 ns. It sets the laser and spectrometer’s delay, triggers the laser’s Q-switch, and controls the spectrometer’s external trigger and timing.
The experimental parameters and sample test information set in this experiment are shown in Table 1. Three PC + ABS materials from different manufacturers (labeled 1, 2, and 3) were chosen for sampling and subjected to LIBS testing with each type consisting of 10 samples. It is presumed that materials from each manufacturer are formulated identically, while there are variations between different manufacturers. During the testing process, the laser beam was finely tuned to a diameter of 50 µm and operated at a repetition rate of 1 Hz to ensure consistent ablation. Each sample was analyzed at five distinct testing points, with 20 spectral readings recorded at each point, covering a total sampling area of 100 cm2 per sample. The testing points were strategically positioned to ensure even spatial representation across the entirety of each sample’s surface.
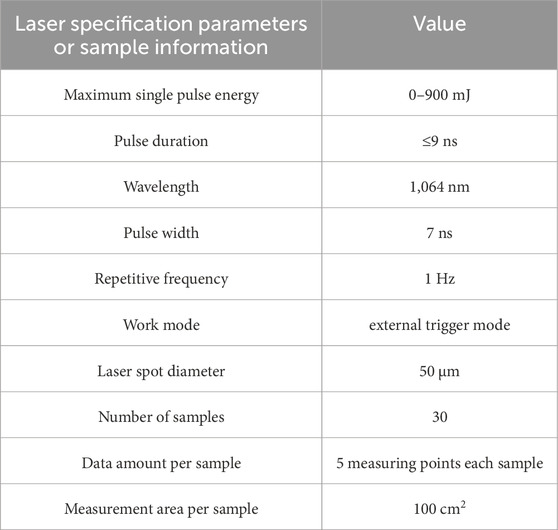
Table 1. Experimental conditions and sample information.
In the course of LIBS measurements, the raw spectra frequently exhibit elevated baseline and noise levels, attributable to sample attributes—such as surface roughness and hardness—as well as environmental factors like temperature, pressure, and lighting conditions. Additionally, the performance of the hardware, notably the consistency of the laser’s energy output and the spectrometer’s light collection resolution, plays a significant role. These elements can diminish the spectral signals’ integrity and obstruct the retrieval of valid spectral data, underscoring the necessity for spectral data pre-processing prior to analysis. Given the distinct response profiles of the spectrometer’s channels, there are definitive transitions between the spectral data they capture, making spectral baseline correction an indispensable step. The presence of noise, encompassing both persistent background noise across the spectrum and intermittent high-frequency noise, further complicates the analysis and identification process. Selecting suitable acquisition delay times can effectively mitigate persistent background noise; however, intermittent high-frequency noise requires additional measures, including spectral smoothing and denoising, to bolster data quality.
The spectra’s valuable information is encoded within its spectral peaks, with each peak representing a distinct elemental spectral line. In contrast, interference is characterized by baseline fluctuations and sporadic high-frequency noise. When viewed through the lens of the frequency domain, the baseline is categorized within the low-frequency range, while both spectral peaks and high-frequency noise reside in the high-frequency range. Consequently, basic filtering, while effective for baseline noise, fails to distinguish between the spectral peaks and high-frequency noise. The application of Discrete Wavelet Transform (DWT) for spectral data processing adeptly addresses both baseline correction and noise reduction, enhancing the spectral data’s integrity.
In spectral data, baseline interference primarily occurs in the low-frequency range. Baseline correction can be achieved by zeroing out the low-frequency wavelet coefficients. For the high-frequency range, spectral peaks are concentrated in a few periods, corresponding to large wavelet coefficient amplitudes, while high-frequency random noise is distributed across all periods, corresponding to small amplitudes. Thus, threshold segmentation can be used to filter wavelet coefficients and eliminate high-frequency noise. Reconstruction of spectra using modified wavelet coefficients results in processed spectral data, facilitating elemental spectral line identification. The ridge line method, based on the Continuous Wavelet Transform, is chosen for spectral peak selection, considering the range of the spectrometer’s detected light intensity. With knowledge of the approximate elemental species in the sample, spectral peaks with relatively large intensity are selected, referencing data from the National Institute of Standards and Technology (NIST) atomic spectral database. This database includes information on elemental species, wavelengths, spectral line transition probabilities, and differences in upper and lower energy levels. This selection takes into account the spectrometer’s resolution and potential wavelength drift in spectral line centers, to ultimately determine the spectral peaks and their corresponding intensities for different elements.
The laser-induced plasma, energized by the pulsed source, exhibits a radiation mechanism that imparts distinctive features to the spectrum. The spectrum comprises both a continuous component and a line component. Compared to the continuous spectrum, the discrete spectrum is composed of emission spectra from atoms or ions of different elements, appearing as spectral lines of varying intensities. This is the type of spectral data required for the data analysis in this study, hence it is necessary to find a method to extract the discrete spectrum from the spectral information. As the plasma evolves, the continuous spectrum decays rapidly. Meanwhile, the line spectrum, emitted by the excited atoms, also decays over time, but at a slower rate and with a longer-lasting spectral line. Thus, by selecting an appropriate delay time, the signal of the characteristic spectrum can be maximized relative to the continuous spectrum signal, minimizing the negative impact of the continuous spectrum on sample detection as much as possible.
In the experiment, we optimized the delay time and laser energy parameters of the spectrometer to find the optimal combination of parameters. The selection of delay time depends on the radiation mechanism of the plasma, with the aim of maximizing the acquisition of characteristic spectral signals and reducing the negative impact of continuous spectra on sample detection. The choice of laser energy is based on the process of plasma generation, with the goal of producing clear spectral lines without damaging the sample.
The spectrometer’s delay time can be finely tuned via the signal generator across a range of 12 specific levels: 0.5, 1, 1.5, 2, 2.5, 3, 3.5, 4, 4.5, 5, 7, and 10 µs. The laser’s energy is maintained at 45 mJ, which is sufficient for ablating the sample and producing clear LIBS spectral lines. As depicted in Figure 2, five elemental characteristic spectral lines are identified (B II 317.9331 nm, Al I 396.1520 nm, Ca I 445.4781 nm, and Na I 588.9950 nm), allowing for the observation of each element’s spectral line relative intensity and the variations in the corresponding spectral signal-to-noise ratio at various delay times. To ensure the reliability of our measurements, the standard deviation, derived from multiple spectral data sets, is graphically represented as error bars alongside the figure.
According to pertinent theories, the spectral signal intensity diminishes exponentially as the delay time increases. Figure 4A illustrates that the behavior of the elemental spectral lines generally aligns with expectations, albeit with varying decay rates among the spectral lines. Considering the collective decay rates of all elements is essential. Upon evaluating the signal-to-background ratio (SBR) across various elements, it is observed that while the B II 317.9331 nm peaks at a 2 µs delay, the other three elemental lines show better SBR values when the delay is between 3 and 4.5 µs. Consequently, the optimal delay time range is established to be between 3 and 4.5 µs, with the optical collection delay set at 3.5 µs in this experiment.
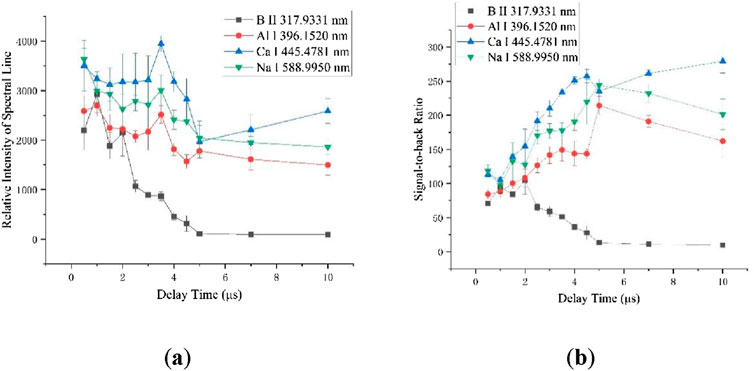
Figure 4. The variation of spectral characteristic quantities at different delay times: (A) Spectral line intensities at different delay times; (B) Signal-to-back ratios at different delay times.
The single-pulse laser energy significantly influences the LIBS plasma generation process. Insufficient energy may fall short of the sample’s breakdown threshold, hindering plasma formation. Conversely, excessively high laser energy leads to a shielding effect within the plasma, causing the spectral line intensity to plateau despite further energy increases. Moreover, too much laser energy can severely damage the sample surface. Thus, it is imperative to meticulously optimize the laser energy to align with the sample’s properties and the goals of the experiment.
The laser’s single-pulse energy levels were set at 15, 25, 35, 45, 55, 65, 75, 85, and 95 mJ, with a collection delay time of 3.5 µs. Figure 5 illustrates the observed changes in the relative intensities of the selected five elemental characteristic spectral lines and the corresponding spectral signal-to-noise ratios at varying single-pulse laser energies.
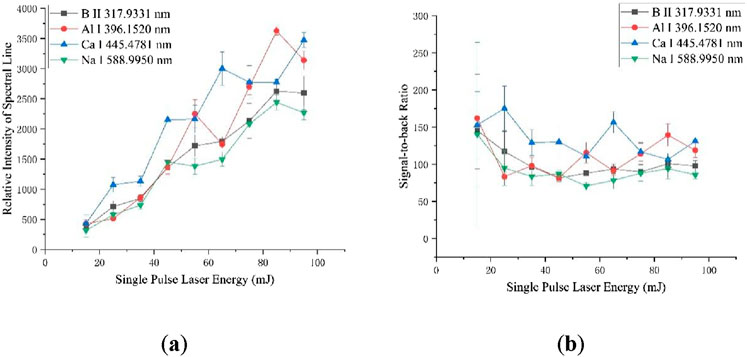
Figure 5. The variation of spectral characteristic quantities under different laser energies: (A) Spectral line intensities under different laser energies; (B) Signal-to-back ratios under different laser energies.
As depicted in Figures 5A, B, the intensities of the spectral lines for each element increase with the escalation in laser energy. However, the signal-to-background ratios (SBRs) for these elemental lines, when subjected to varying laser energies, lack a clear and consistent pattern. Consequently, the primary consideration in selecting the single-pulse laser energy for this experiment is the spectral intensity. A single-pulse laser energy of 55 mJ has been chosen for its optimal balance between producing intense spectral lines and minimizing sample damage. In Figure 5B, a significant measurement error in the signal-to-noise ratio of each elemental line is evident when the laser energy is 15 mJ. This is attributed to the laser energy being too low, resulting in minimal material ablation with each laser shot, thereby causing substantial fluctuations in the spectrum.
In summary, the determined test parameters are a collection delay time of 3.5 µs and a single-pulse laser energy of 55 mJ. Figure 6 displays the spectrum of PC + ABS under the chosen parameters and the identification results for certain elements.
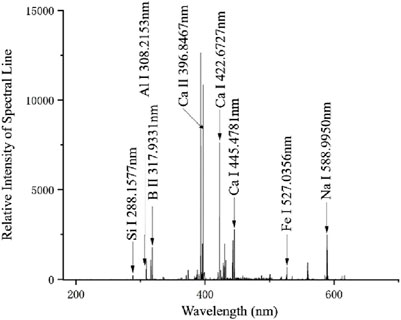
Figure 6. Identification results of PC + ABS spectrum and some elemental spectral lines.
During pulsed laser ablation, the energy imparted by each laser pulse defines the energy density across the focal spot, which in turn directly affects the degree of ablation, the penetration depth, and the dimensions of the ablation zone per pulse. The diameter of the laser’s focal spot is also a determining factor in the energy density at each point throughout a single ablation event. When the same spot is exposed to multiple pulses, an increase in the number of pulses leads to changes in the morphology and depth of the ablation zone. In this study, the diameter of the laser’s focal spot is kept constant, while variations in the energy of individual laser pulses and the frequency of continuous bombardments are explored to assess the impact of LIBS experimental parameters on the ablation process.
The ablation craters on the surface of PC + ABS material created by the high-energy pulsed laser are examined using scanning electron microscopy. Researchers observed the ablation morphology of the three samples under different experimental conditions and found that different samples have similar ablation characteristics. Figure 7 selects the ablation morphology of sample 1 under some experimental conditions as a representative for display. The morphology of the crater is usually not a regular circle, which is mainly due to the unevenness of the sample surface and the dynamic changes of the plasma during laser bombardment. During the laser bombardment process, different areas of the sample surface have different absorption and reflection characteristics, leading to irregular edges of the crater. Moreover, the protrusions within the crater may be formed due to the redistribution of impurities or structural inhomogeneities inside the sample during laser bombardment. Table 2 presents the maximum widths of the ablation craters for the samples shown in Figure 7. Considering that the ablation craters are not perfectly circular, the maximum width is used as an indicator to assess the extent of laser-induced damage to the material.
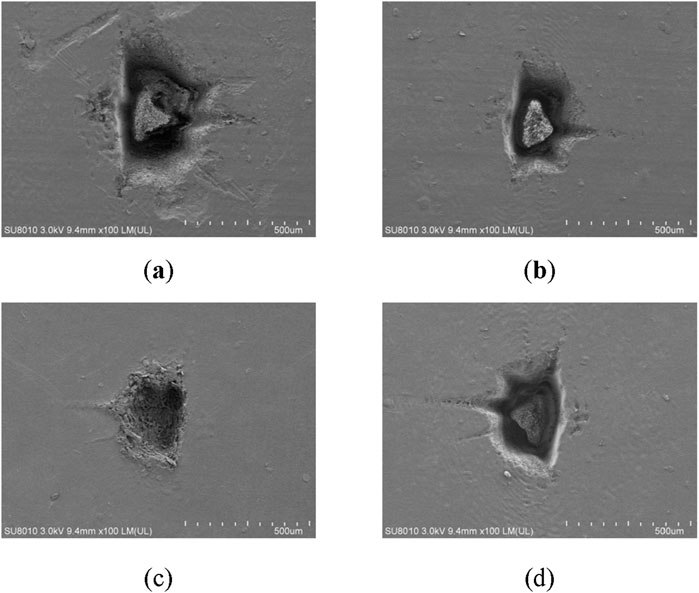
Figure 7. The ablation morphology of PC + ABS under different experimental parameters: (A) Laser continuous bombardment times: 100. Single-pulse laser energy: 35 mJ; (B) Laser continuous bombardment times: 100. Single-pulse laser energy: 95 mJ; (C) Laser continuous bombardment times: 10. Single-pulse laser energy: 75 mJ; (D) Laser continuous bombardment times: 150. Single-pulse laser energy: 75 mJ.
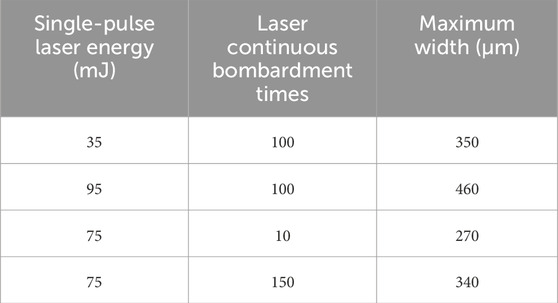
Table 2. Maximum width of sample ablation pits under different parameters.
According to Table 2, for the PC + ABS sample under the same number of bombardments, the maximum width of the ablation pit increases with the increase of laser energy density. Furthermore, at a constant energy density, the maximum width of the ablation pit also correlates positively with the number of bombardments, reaching widths of several hundred micrometers.
The three-dimensional structure of the ablation pits of the sample is observed using a confocal microscope, and the ablation depths are also be measured, as depicted in Figure 8. The specific instrument utilized is a CHOTEST VT600 confocal microscope, which boasts a z-axis resolution of 0.1 nm. Figure 9 demonstrates the change in ablation depth relative to the number of continuous laser bombardments, given a single-pulse laser energy of 75 mJ. When the single-pulse laser energy is fixed, within the range of 10–150 bombardments, the ablation depth of PC + ABS shows a linear relationship with the number of bombardments. The following equation represents the relationship between the ablation depth d (µm) and the number of bombardments n (times): d = 5.42749 × n + 119.61786. The coefficient of determination (R2) for this regression model is 0.9635.
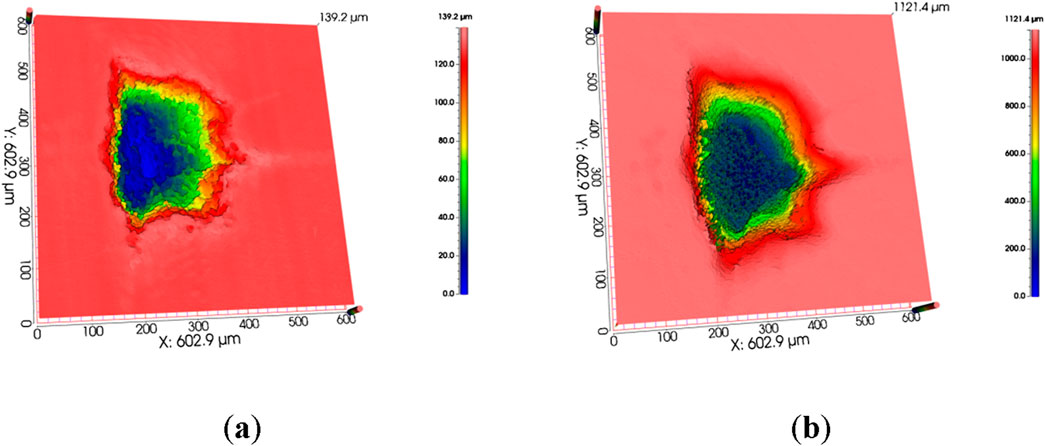
Figure 8. The ablation morphology and depth of PC + ABS under different experimental parameters: (A) Laser continuous bombardment times: 10. Single-pulse laser energy: 75 mJ; (B) Laser continuous bombardment times: 150. Single-pulse laser energy: 75 mJ.

Figure 9. The relationship between ablation depth and the number of consecutive laser bombardments.
LIBS enables rapid analysis of the elemental makeup of samples, with its spectral responses being highly sensitive to even minor fluctuations in both elemental composition and the physicochemical attributes of the samples. This sensitivity allows LIBS technology to effectively distinguish between materials based on their unique spectral signatures. Consequently, it provides a viable method for the qualitative classification and identification of non-metallic electric energy meter box materials with varying compositions.
LIBS tests were performed on samples 1, 2, and 3, each providing unique spectral data. Figure 10 shows the spectral diagrams of three different categories of PC + ABS materials. The elemental composition of the 3 samples is similar, and their spectral graphs also exhibit similar characteristics, making it difficult to distinguish them by visual inspection. This paper employs Principal Component Analysis (PCA), Support Vector Machine (SVM), and Self-Organizing Map (SOM) neural networks for the classification of PC + ABS samples. SVM algorithm has a strong classification capability in handling high-dimensional spectral data. It can find the optimal hyperplane to maximize the interval between different categories, thereby improving classification accuracy. SOM algorithm is an unsupervised learning algorithm that can map high-dimensional data to a low-dimensional topological structure, preserving the topological relationships in the input data, and is suitable for the classification and visualization of unlabeled data. The combination of these two algorithms provides us with a comprehensive classification solution.

Figure 10. The spectral diagrams of 3 types of PC + ABS samples.
The spectral data from a single laser bombardment comprises a total of 10,542 data points. Utilizing the entire spectrum directly for classification would lead to a high-dimensional dataset and an extensive computational load. Thus, it is crucial to reduce the dimensionality of spectral data while preserving as much of the original information as possible.
Due to the variability in the spectral data obtained from LIBS testing, when obtaining spectral data for classification, researchers averaged two adjacent spectra of the same sample to reduce the deviation between spectral data. Therefore, the dataset is composed of 1,500 spectral data. A principal components analysis was conducted on the 1,500 spectral data obtained from the LIBS test, resulting in the identification of principal components along with their individual and cumulative contribution rates to the variance, as depicted in Figure 11A. Figure 11A clearly shows that the first six principal components encompass 99.04% of the total variance, whereas the remaining components account for only about 0.96%. This suggests that the information content from the seventh principal component onwards is minimal, thereby justifying the selection of the first six principal components for further analysis and the exclusion of the subsequent components. Researchers then proceed to analyze the PC loadings to determine the contribution of the original variables to the principal components. Figure 11B illustrates the contribution of each original variable to the first two principal components. The analysis reveals that the variables with significant contributions to the principal components are the spectral peaks of the sample’s main elements. Some elemental spectral lines are labeled in Figure 11B. This demonstrates that principal component analysis retains the effective information in the original spectral data.
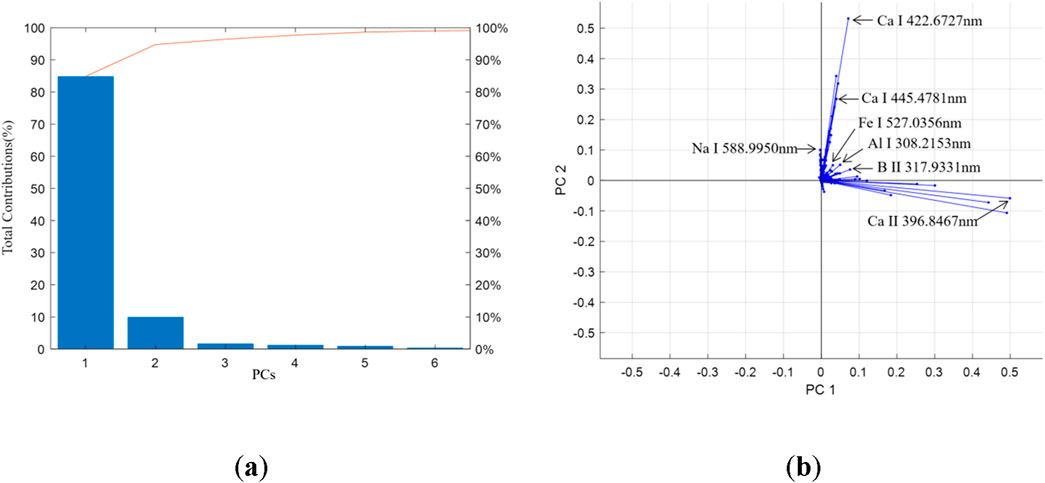
Figure 11. Principal component analysis results: (A) Principal component contribution rates; (B) Original variables’ contribution to the first two principal components.
This paper utilizes the SVM as the classification algorithm to categorize spectral data. The SVM is a supervised learning algorithm predominantly employed for classification and regression tasks. The core principle of the SVM involves the identification of an optimal hyperplane that serves as the decision boundary, adeptly separating data points from various categories in a multidimensional space. This hyperplane is calculated to maximize the margin between different classes, ensuring the highest possible accuracy in classification, which is particularly pertinent for distinguishing complex spectral data patterns [26].
The input variables for analysis are the principal components, with a linear Support Vector Machine (SVM) utilized for classification purposes. The dataset is composed of 500 sample data from each of the 3 types of samples, with each sample data containing 6 features. This study employs five-fold cross-validation. The dataset is randomly divided into five equal parts. In each iteration, the model is trained on four parts of the data, while the remaining part is used to test the model’s performance. This process is repeated five times, each time selecting a different part as the test set and the other four parts as the training set. By training and testing with different datasets multiple times, it can more accurately assess the model’s generalization ability, reduce the bias brought by choosing a specific test set, and make more effective use of the data. Figure 12 illustrates the classification outcomes, revealing that the overall classification accuracy of PC + ABS materials across various formulations achieves 98.4%. The average error of the classification results is 0.016.
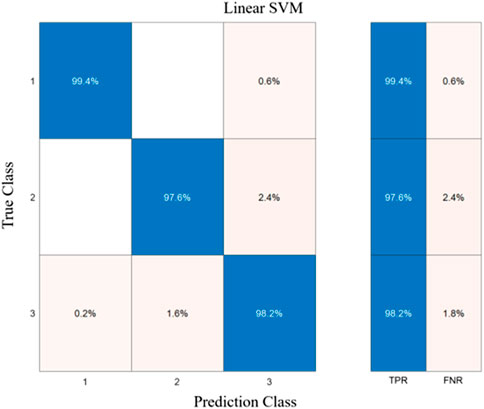
Figure 12. Linear SVM classification result of PC + ABS samples.
The classification algorithm mentioned previously is a supervised classification algorithm, requiring pre-existing knowledge of the categories within the training dataset. This algorithm trains the classification model, enabling it to classify unknown samples. However, practical scenarios often present cases where prior information is unavailable. In such instances, the use of unsupervised algorithms becomes indispensable, as they are capable of discerning patterns and categorizing data without the need for prior category knowledge.
The Self-Organizing Map (SOM) is an unsupervised learning algorithm that maps high-dimensional input data onto a typically two-dimensional topological structure. It employs competitive learning to preserve the topological relationships inherent in the input data. In SOM, the neurons of the neural network are arranged according to a specific geometric pattern, typically a grid. During the training phase, there is a competitive process among neurons, where the neuron with the highest similarity to the input data (the winning neuron) adjusts its weights. This adjustment is in response to the input data, and nearby neurons also undergo weight adjustments, albeit to a lesser extent. This mechanism allows the network to gradually develop a structured representation, ensuring that similar input data are clustered closely within the output space of the map [27].
The Self-Organizing Map (SOM) offers distinct advantages, particularly in visualizing complex high-dimensional data and effectively uncovering intrinsic clustering structures. Its robustness to initial conditions and parameter selection variability further enhances its utility. This has resulted in extensive applications of the SOM across various domains, including data visualization, cluster analysis, and feature extraction. The principal components serve as the input for the SOM neural network in cluster analysis tasks. After multiple tests, researchers found that setting the competitive layer neurons to a 3 × 3 network yields the best classification results. The number of training epochs for the neural network is set to 200, and the initial learning rate is set to 0.05. The clustering outcomes are illustrated in Figure 13.
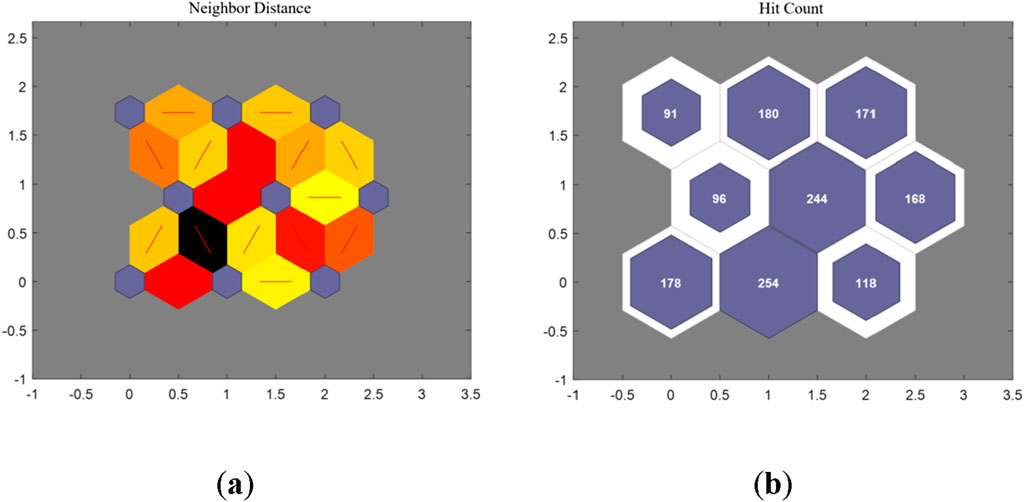
Figure 13. SOM neural network clustering results of PC + ABS with different formulations: (A) Neighbor Distance; (B) Hit Count.
Figure 13A illustrates the distance information between adjacent neurons, with darker colors indicating greater distances and lighter colors indicating closer distances. Figure 13B displays the hit count for each neuron. The neurons are systematically numbered from 1 to 9, arranged left to right and bottom to top. Upon reviewing the model’s output results, the distribution of each PC + ABS sample within each neuron is presented in Table 3. From this analysis, it is determined that neurons 6, 8, and 9 correspond to sample 1, neurons 2 and 5 correspond to sample 2, and neurons 1, 3, 4, and 7 correspond to sample 3. Consequently, the calculated classification accuracy rates are as follows: 88.4% for sample 1, 91.8% for sample 2, and 90.4% for sample 3. The average error of the classification results is 0.088.

Table 3. Distribution of PC + ABS samples in neural networks.
Using the Self-Organizing Map (SOM) algorithm, researchers successfully performed unsupervised classification of different formulations of PC + ABS materials, achieving a classification accuracy of 90%. This result demonstrates the great potential of unsupervised learning algorithms in LIBS data classification tasks and further proves the effectiveness and practicality of combining supervised and unsupervised learning algorithms in non-metallic material classification.
This research delves into an empirical methodology that harnesses Laser-Induced Breakdown Spectroscopy (LIBS) technology to detect PC + ABS composites within electric energy meter boxes. It also introduces a LIBS parameter optimization strategy for PC + ABS materials, scrutinizes the laser ablation effects on these composites, and qualitatively categorizes electric energy meter box materials of varying compositions. Initially, the spectral data are condensed through principal components analysis, followed by classification using a support vector machine and SOM neural network. The linear SVM achieves a supervised classification accuracy of 98.4%. Meanwhile, the unsupervised classification via the SOM neural network maintains consistent accuracy levels around 90% for the three distinct samples.
This research employs LIBS technology for the swift detection and categorization of PC + ABS composite materials, delving into the application of LIBS technology within electrical engineering and polymer analysis domains. The findings provide actionable technical guidance for both the initial network inspection and the ongoing maintenance of non-metallic electric meter boxes. Such recommendations are pivotal for bolstering the safety and operational management of power grid infrastructure, thereby enhancing the overall reliability and efficiency of power grid systems.
The data analyzed in this study is subject to the following licenses/restrictions: The raw data supporting the conclusion of this article will be made available by the authors, without undue reservation. Requests to access these datasets should be directed to eHlmMDcyNUAxNjMuY29t.
YX: Conceptualization, Data curation, Formal Analysis, Funding acquisition, Methodology, Project administration, Writing–original draft, Writing–review and editing. QL: Conceptualization, Data curation, Formal Analysis, Investigation, Software, Supervision, Validation, Visualization, Writing–original draft, Writing–review and editing. ZX: Formal Analysis, Investigation, Methodology, Validation, Visualization, Writing–original draft, Writing–review and editing. JeY: Formal Analysis, Investigation, Methodology, Software, Visualization, Writing–original draft, Writing–review and editing. JaY: Investigation, Resources, Software, Supervision, Validation, Visualization, Writing–original draft, Writing–review and editing.
The author(s) declare that financial support was received for the research, authorship, and/or publication of this article.
Authors YX, QL, ZX, JeY, and JaY were employed by China Southern Power Grid Co., Ltd.
The authors declare that this study received funding from the Transmission Operation & Maintenance Branch of Hainan Power Grid Corporation, China Southern Power Grid Co., Ltd., grant number 075700KC23100004. The funder had the following involvement in the study: sample collection, experimental design, and data processing work.
The author(s) declare that no Generative AI was used in the creation of this manuscript.
All claims expressed in this article are solely those of the authors and do not necessarily represent those of their affiliated organizations, or those of the publisher, the editors and the reviewers. Any product that may be evaluated in this article, or claim that may be made by its manufacturer, is not guaranteed or endorsed by the publisher.
1. Gong J. On the reliability of Weibull statistical analysis for fracture strength of ceramics. Adv Ceramics (2022) 43:335–52. doi:10.16253/j.cnki.37-1226/tq.2022.06.003
2. Zhang S, Wu L, Sun X, Sun H, Ai B, Yu F. Ultra-low thermal conductivity multilayer composites for insulation in low pressure environments. Adv Ceramics (2023) 44:442–50. doi:10.16253/j.cnki.37-1226/tq.2023.05.007
3. Dai Y, Hubálková J, Voigt C, Abendroth M, Liang X, Yan W, et al. Tensile strength and damage of open-cell ceramic foams under cylindrical splitting test. J Adv Ceram (2023) 12:2003–16. doi:10.26599/jac.2023.9220803220803
4. Afgan MS, Hou Z, Wang Z. Quantitative analysis of common elements in steel using a handheld μ-LIBS instrument. J Anal Spectrom (2017) 32:1905–15. doi:10.1039/c7ja00219j
5. Xie S, Xu T, Han X, Lin Q, Duan Y. Accuracy improvement of quantitative LIBS analysis using wavelet threshold de-noising. J Anal Spectrom (2017) 32:629–37. doi:10.1039/C6JA00403B
6. Chen T, Zhang T, Li H. Applications of laser-induced breakdown spectroscopy (LIBS) combined with machine learning in geochemical and environmental resources exploration. Trac-trend Anal Chem (2020) 133:116113. doi:10.1016/j.trac.2020.116113
7. Harmon RS, Senesi GS. Laser-Induced Breakdown Spectroscopy–A geochemical tool for the 21st century. Appl Geochem (2021) 128:104929. doi:10.1016/j.apgeochem.2021.104929
8. Pedarnig JD, Trautner S, Grünberger S, Giannakaris N, Eschlböck-Fuchs S, Hofstadler J. Review of element analysis of industrial materials by in-line laser—induced breakdown spectroscopy (LIBS). Appl Sci (2021) 11:9274. doi:10.3390/app11199274
9. Maurice S, Wiens R, Saccoccio M, Barraclough B, Gasnault O, Forni O, et al. The ChemCam instrument suite on the Mars Science Laboratory (MSL) rover: science objectives and mast unit description. Space Sci Rev (2012) 170:95–166. doi:10.1007/s11214-012-9912-2
10. Wiens RC, Maurice S, Barraclough B, Saccoccio M, Barkley WC, Bell JF, et al. The ChemCam instrument suite on the Mars Science Laboratory (MSL) rover: body unit and combined system tests. Space Sci Rev (2012) 170:167–227. doi:10.1007/s11214-012-9902-4
11. Bachler MO, Bišćan M, Kregar Z, Badovinac IJ, Dobrinić J, Milošević S. Analysis of antique bronze coins by laser induced breakdown spectroscopy and multivariate analysis. Spectrochim Acta B (2016) 123:163–70. doi:10.1016/j.sab.2016.08.010
12. Anglos D, Couris S, Fotakis C. Laser diagnostics of painted artworks: laser-induced breakdown spectroscopy in pigment identification. Appl Spectrosc (1997) 51:1025–30. doi:10.1366/0003702971941421
13. Gaudiuso R, Melikechi N, Abdel-Salam ZA, Harith MA, Palleschi V, Motto-Ros V, et al. Laser-induced breakdown spectroscopy for human and animal health: a review. Spectrochim Acta B (2019) 152:123–48. doi:10.1016/j.sab.2018.11.006
14. El-Hussein A, Kassem A, Ismail H, Harith M. Exploiting LIBS as a spectrochemical analytical technique in diagnosis of some types of human malignancies. Talanta (2010) 82:495–501. doi:10.1016/j.talanta.2010.04.064
15. Palacios M, Gomez M, Moldovan M, Morrison G, Rauch S, McLeod C, et al. Platinum-group elements: quantification in collected exhaust fumes and studies of catalyst surfaces. Sci Total Environ (2000) 257:1–15. doi:10.1016/S0048-9697(00)00464-2
16. Pandhija S, Rai N, Rai AK, Thakur SN. Contaminant concentration in environmental samples using LIBS and CF-LIBS. Appl Phys B (2010) 98:231–41. doi:10.1007/s00340-009-3763-x
17. Chen P, Wang X, Li X, Lyu Q, Wang N, Jia Z. A quick classifying method for tracking and erosion resistance of htv silicone rubber material via laser-induced breakdown spectroscopy. Sensors (2019) 19:1087. doi:10.3390/s19051087
18. Fabre C. Advances in Laser-Induced Breakdown Spectroscopy analysis for geology: a critical review. Spectrochim Acta B (2020) 166:105799. doi:10.1016/j.sab.2020.105799
19. Aberkane SM, Bendib A, Yahiaoui K, Boudjemai S, Abdelli-Messaci S, Kerdja T, et al. Correlation between Fe–V–C alloys surface hardness and plasma temperature via LIBS technique. Appl Surf Sci (2014) 301:225–9. doi:10.1016/j.sab.2020.105799
20. Sivakumar P, Taleh L, Markushin Y, Melikechi N. Packing density effects on the fluctuations of the emission lines in laser-induced breakdown spectroscopy. Spectrochim Acta B (2014) 92:84–9. doi:10.1016/j.sab.2013.10.007
21. Gu W, Yang B, Li D, Shang X, Zhou Z, Guo J. Accelerated design of lead-free high-performance piezoelectric ceramics with high accuracy via machine learning. J Adv Ceram (2023) 12:1389–405. doi:10.26599/JAC.2023.9220762
22. Brunnbauer L, Larisegger S, Lohninger H, Nelhiebel M, Limbeck A. Spatially resolved polymer classification using laser induced breakdown spectroscopy (LIBS) and multivariate statistics. Talanta (2020) 209:120572. doi:10.1016/j.talanta.2019.120572
23. Michel APM, Morrison AE, Preston VL, Marx CT, Colson BC, White HK. Rapid identification of marine plastic debris via spectroscopic techniques and machine learning classifier. ES&T (2020) 54(17):10630–7. doi:10.1021/acs.est.0c02099
24. Costa VC, Pereira FMV. Laser-induced breakdown spectroscopy applied to the rapid identification of different types of polyethylene used for toy manufacturing. J Chemometr (2020) 34(12):e3248. doi:10.1002/cem.3248
25. Képeš E, Vrábel J, Brázdil T, Holub P, Pořízka P, Kaiser J. Interpreting convolutional neural network classifiers applied to laser-induced breakdown optical emission spectra. Talanta (2024) 266:124946. doi:10.1016/j.talanta.2023.124946
26. Yu Y, Hao ZQ, Li CM, Guo LB, Li KH, Zeng QD, et al. Identification of plastics by laser-induced breakdown spectroscopy combined with support vector machine algorithm. Acta Phys Sin (2013) 62:215201. doi:10.7498/aps.62.215201
Keywords: PC + ABS composites, electric meter boxes, laser-induced breakdown spectroscopy, non-destructive testing, unsupervised classification
Citation: Xia Y, Liang Q, Xia Z, Yang J and Ye J (2025) Rapid detection and classification of PC + ABS meter box materials based on laser-induced breakdown spectroscopy. Front. Phys. 13:1526356. doi: 10.3389/fphy.2025.1526356
Received: 11 November 2024; Accepted: 28 January 2025;
Published: 17 February 2025.
Edited by:
Antonio Riveiro Rodriguez, University of Vigo, SpainReviewed by:
Yuzhu Liu, Nanjing University of Information Science and Technology, ChinaCopyright © 2025 Xia, Liang, Xia, Yang and Ye. This is an open-access article distributed under the terms of the Creative Commons Attribution License (CC BY). The use, distribution or reproduction in other forums is permitted, provided the original author(s) and the copyright owner(s) are credited and that the original publication in this journal is cited, in accordance with accepted academic practice. No use, distribution or reproduction is permitted which does not comply with these terms.
*Correspondence: Yunfeng Xia, eHlmMDcyNUAxNjMuY29t
Disclaimer: All claims expressed in this article are solely those of the authors and do not necessarily represent those of their affiliated organizations, or those of the publisher, the editors and the reviewers. Any product that may be evaluated in this article or claim that may be made by its manufacturer is not guaranteed or endorsed by the publisher.
Research integrity at Frontiers
Learn more about the work of our research integrity team to safeguard the quality of each article we publish.