- State Grid Fujian Electric Power Research Institute, FuZhou, China
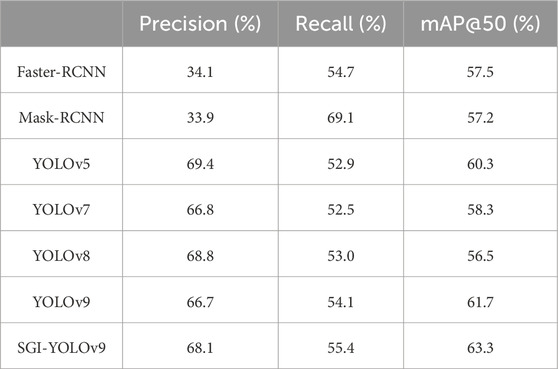
The detection of crucial components in the power distribution network is of great significance for ensuring the safe operation of the power grid. However, the challenges posed by complex environmental backgrounds and the difficulty of detecting small objects remain key obstacles for current technologies. Therefore, this paper proposes a detection method for crucial components in the power distribution network based on an improved YOLOv9 model, referred to as SGI-YOLOv9. This method effectively reduces the loss of fine-grained features and improves the accuracy of small objects detection by introducing the SPDConv++ downsampling module. Additionally, a global context fusion module is designed to model global information using a self-attention mechanism in both spatial and channel dimensions, significantly enhancing the detection robustness in complex backgrounds. Furthermore, this paper proposes the Inner-PIoU loss function, which combines the advantages of Powerful-IoU and Inner-IoU to improve the convergence speed and regression accuracy of bounding boxes. To verify the effectiveness of SGI-YOLOv9, extensive experiments are conducted on the CPDN dataset and the PASCAL VOC 2007 dataset. The experimental results demonstrate that SGI-YOLOv9 achieves a significant improvement in accuracy for small object detection tasks, with an mAP@50 of 79.1% on the CPDN dataset, representing an increase of 3.9% compared to the original YOLOv9. Furthermore, it achieves an mAP@50 of 63.3% on the PASCAL VOC 2007 dataset, outperforming the original YOLOv9 by 1.6%.
1 Introduction
With the continuous growth in electricity demand and the ongoing expansion of the power grid, the stability and reliability of the power distribution network, as a critical hub in the power system, have become increasingly important. The primary function of the power distribution network is to transmit electrical energy from high-voltage transmission networks to low-voltage consumer networks, and its reliability directly impacts the quality and safety of electricity supply to users. Crucial components of the power distribution network include insulators, arresters, transformers, and Cut-out Switches (COS), which must withstand harsh weather conditions, high mechanical stress, and extreme voltage, making them prone to damage [1]. Therefore, the detection and monitoring of these crucial components have become a central focus in the maintenance and management of the power distribution network.
The power distribution network cover vast areas, with numerous and complexly distributed equipment, making traditional manual inspection methods insufficient to meet the operational and maintenance demands of modern power grids. Manual inspections are not only labor-intensive and inefficient, but they are also susceptible to geographical constraints, resulting in risks of omission and false detections. With the rapid advancement of computer vision technology, image detection has gradually replaced traditional manual inspections as a non-contact detection method [2]. This technology enables comprehensive, multi-angle, and high-precision inspection of crucial components in the power distribution network, significantly enhancing the intelligence and automation of component monitoring.
In the early stages of image detection, traditional methods primarily relied on handcraft feature extraction, including characteristics such as shape, color, and texture, combined with machine learning algorithms for recognition. Murthy V S et al.utilized a combination of Support Vector Machine (SVM) and Multiresolution Analysis (MRA) to detect defects in transmission line insulators, where MRA was used to capture insulator images, and SVM was applied to detect their condition. Hao J et.at applied Canny edge detection and directional angle selection to process insulator images, followed by the Hough transform to extract linear features of the damaged sections of the insulator. Zhang K et al. [3] proposed a method based on k-means clustering and morphological techniques to segment insulator images. Yu Y et al. [4] introduced a model that uses iterative curve evolution based on texture features and shape priors to detect insulators, though this method requires pre-acquisition of shape priors, limiting its applicability and resulting in slow detection speed. Zhao Z et al. [5] proposed a method that uses orientation angle detection and binary shape priors to locate insulators at different angles. However, traditional methods generally depend on feature extraction and shallow learning classification, and some even require the support of prior knowledge. These limitations make it difficult for such methods to cope with significantly varying complex scenes and render them vulnerable to noise and background interference, leading to weak generalization capabilities. As a result, traditional methods are often suitable only for images with simple backgrounds or large objects.
Deep learning-based object detection techniques, on the other hand, offer promising new possibilities for identifying key components. Architectures like Convolutional Neural Networks (CNNs) are capable of automatically extracting image features through multiple layers, which greatly enhances detection accuracy and efficiency [6–8]. By leveraging training on large-scale datasets, these models can perform consistently across a range of complex scenarios, minimizing the need for manual intervention and reducing the risk of misjudgment. This improvement bolsters the reliability and safety of power systems, providing robust technical support for the advancement of smart grid technologies.
Deep learning-based object detection research can be generally categorized into two main approaches. The first approach includes two-stage detection models like R-CNN [9], Faster R-CNN [10], and Mask R-CNN [11], which use a region proposal network (RPN) to generate candidate object regions, followed by classification and regression to enhance detection accuracy. Such models are typically characterized by complex architectures and high detection accuracy but relatively slow processing speed. Zhao Z et al. [12] improved the anchor generation method of the Faster R-CNN model and optimized the non-maximum suppression (NMS) in the RPN, achieving improved insulator detection, particularly for insulators with varying aspect ratios, scales, and occlusions. However, the dataset utilized by this network contains almost no images of vertically oriented insulator strings. As a result, this method is incapable of detecting missing faults in images that include such types of insulator strings. Odo A et al. [13] utilized Mask R-CNN and RetinaNet to detect insulators and U-bolts on each tower. Dong C et al. [14] introduced an enhanced Cascade R-CNN that integrates Swin-v2 with a balanced feature pyramid to strengthen feature representation, while also incorporating side-aware boundary localization for greater precision in detecting small components in power transmission lines.
Another prominent category of algorithms comprises single-stage object detection models, such as the YOLO (You Only Look Once) series [15–21] and SSD [22]. These models bypass the need for region proposal networks, allowing them to directly execute classification and regression tasks following feature extraction by the backbone network [23]. This approach significantly reduces both training and inference time, enhancing efficiency. In practical engineering applications, due to the limitations of computational resources on devices, single-stage object detection algorithms are often preferred. Qi C et al. [24] enhanced the SSD model by using the lightweight SqueezeNet architecture and adding multiple convolutional layers and connection branches, thus improving feature extraction and enabling the detection of five types of electrical equipment in substations. Siddiqui et al. [25] developed an automated real-time system for detecting electrical equipment and analyzing faults, employing a CNN-based framework to identify insulators, arresters, and COS across different materials in complex settings. However, this method operates in a simplified environment with a single detection background and lacks interference from complex backgrounds. Liu Z et al. [26] created a large-scale dataset for transmission line component detection and optimized YOLOv4 by adding a prediction layer and refining the selection of positive and negative samples during training, thereby enhancing small object detection. Qiu Z et al. [27] preprocessed insulator images using the Laplacian sharpening method and improved the YOLOv4 model structure by incorporating the lightweight MobileNet convolutional neural network. However, its detection performance on blurry and small objects was suboptimal. Liu M et al. [28] improved YOLOv5 by incorporating diversified branch blocks (DBB), efficient channel attention (ECA), and an upgraded spatial pyramid pooling (SPP) module, with TensorRT utilized for accelerated edge detection of critical components. Liu C et al. [29] integrated a CBAM mixed attention module and Swin Transformer self-attention into YOLOv7, along with adding a dedicated small object detection layer to better identify small transmission line components. Chen B et al. [30] introduced innovative methods, including the Edge Detailed Shape Data Augmentation (EDSDA) and the Cross-Channel and Spatial Multi-Scale Attention (CCSMA) module, which enhanced the detection capability of insulator edge shapes and defect features. Additionally, the design of the Re-BiC module and the MPDIoU localization loss function optimized feature fusion and computational efficiency, leading to significant improvements in detection accuracy and speed. He M et al. [31] introduced an improved YOLOv8 model for detecting insulators and fault areas, using GhostNet and an asymmetric convolution-based feature extraction module to enhance recognition in complex environments, while the ResPANet module fused high-resolution feature maps with residual skip connections to mitigate information loss in small feature layers. However, this method fails to effectively extract the features of subtle defects, resulting in poor detection performance for small target defects.
In practical applications, the small size of most key components in the power distribution network, along with the cluttered backgrounds, makes their detection particularly challenging. This poses significant difficulties for traditional detection models, driving researchers to focus on small object detection techniques to improve both accuracy and reliability. Developing more robust and effective methods for identifying these components in complex environments remains a critical research challenge in the field. Zhu Z et al. [32] proposed a small object detection network with a multi-level perception parallel structure. This network addressed the issues of lacking global representation information and the dense distribution of small objects through a global multi-level perception module and a dynamic region aggregation module, respectively. Qi G et al. [33] introduced an improved YOLOv5 algorithm, which utilized an Adaptive Spatial Parallel Convolution module (ASPConv) to extract multi-scale local context information of small objects. Additionally, to enhance the detection performance of small objects, it employed nearest-neighbor interpolation and sub-pixel convolution algorithms to construct high-resolution feature maps with rich semantic features. Li Y et al. [34] presented a feature fusion module (CGAL) based on both global and local attention mechanisms and designed a decoupled detection framework featuring a four-head structure, thereby enabling efficient detection of small objects. Zhang T et al. [35] optimized the backbone of YOLOv5 by incorporating a Convolutional Block Attention Module (CBAM) to focus on key information for insulator and defect detection while suppressing non-essential information. Additionally, small object detection anchors and layers were added to improve the detection of small defects.
Although the aforementioned studies have made significant progress in object detection, most of the research has primarily focused on detecting high-voltage transmission lines using UAV aerial images, where the targets are relatively large and the backgrounds are comparatively simple. However, compared to high-voltage transmission lines, the detection of key components in the power distribution network presents more complex challenges. Power distribution networks are typically deployed in areas with dense human activity and diverse geographical and environmental conditions, making them prone to obstructions from trees, buildings, and other structures. Moreover, the components within the power distribution network are generally smaller, more densely distributed, and often have similar appearances, further complicating the detection task. Existing algorithms still struggle with handling the complex backgrounds typical of distribution network scenarios, and they fail to effectively address the issue of information loss for small components during the process of deep feature extraction, which significantly impairs detection accuracy. Therefore, there is an urgent need for more advanced methods that can overcome these challenges and improve detection performance in such complex environments.
To address the challenges of detecting crucial components in the power distribution network, we propose an innovative algorithm, SGI-YOLOv9. The main contributions of this paper are as follows.
2 Materials and methods
2.1 Dataset preparation and analysis
The dataset used in this study is provided by a private user on the Roboflow platform and has been named the Components of Power Distribution Network (CPDN) [36]. It contains 3,383 images and 25,185 instances, with each image having a resolution of
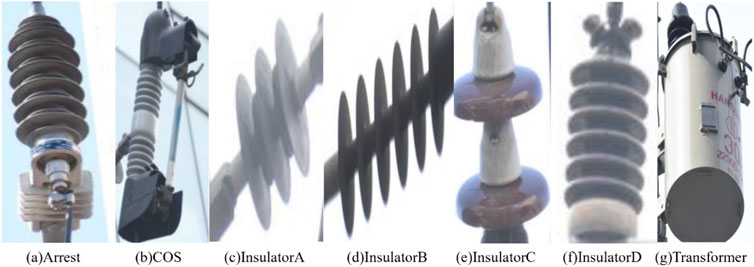
Figure 1. Illustration of crucial components in the power distribution network. (A) Arrester; (B) COS: Cut-out Switches; (C) Insulator (A) short polymer insulator; (D) Insulator (B) long polymer insulator; (E) Insulator (C) short porcelain insulator; (F) Insulator (D) long porcelain insulator; (G) Transformer.
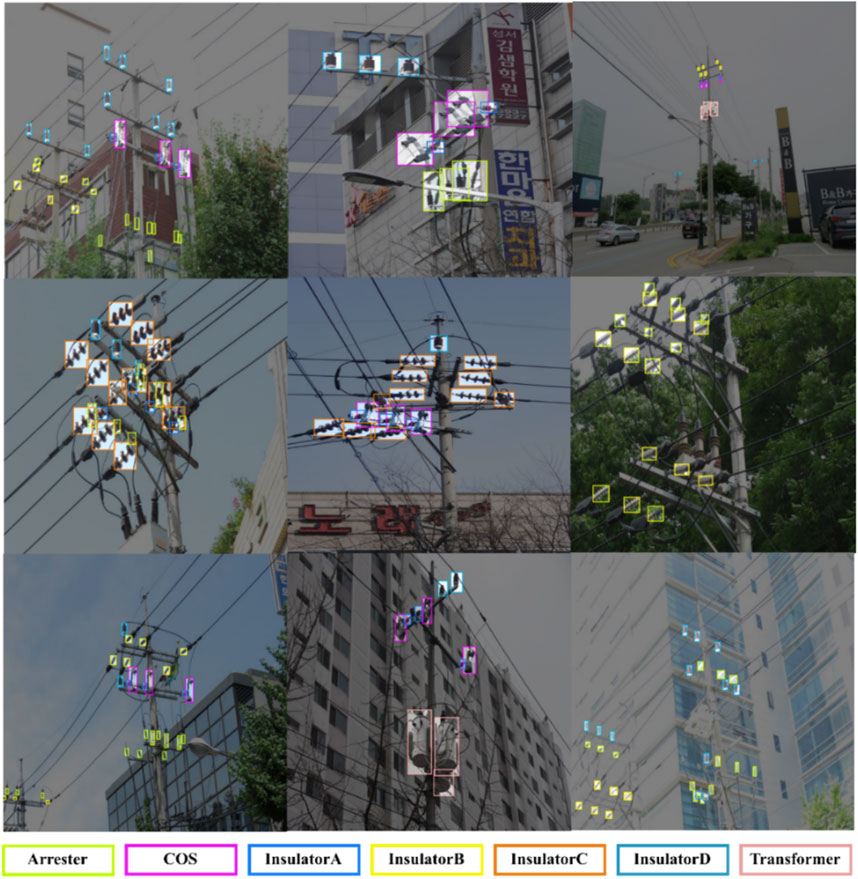
Figure 2 presents image samples from the CPDN dataset in various environments, with each crucial component marked with different colored boxes, illustrating their distribution and position within the power distribution network. It is evident that the backgrounds in the power distribution network images are highly complex, covering diverse scenes such as urban streets, residential areas, and green spaces. Due to the influence of different angles in capturing images, components in these scenes are often obscured by various objects, and there is significant overlap of targets. Additionally, it is clear from the images that the components occupy a relatively small portion of the overall frame, with targets often blending into the background or multiple components being closely arranged. These factors pose considerable challenges for detection algorithms. The small visual differences between similar components further increase the risk of misclassification.
In the CPDN dataset, the Insulator C and Transformer categories account for 7.7% and 7.2% of all instances, respectively, posing challenges related to class imbalance and small object detection. During training process, the model often assigns more weight to categories with a larger number of samples, which can lead to overfitting and reduce its ability to generalize to new datasets. To address this issue, we apply data augmentation techniques to mitigate the problem of class imbalance. Specifically, we use methods such as affine transformations, random noise, color jittering, and brightness adjustments [26] to generate diverse training samples. The augmented dataset is split into training, validation, and test sets with a 7:2:1 ratio.
2.2 Proposed method
In this study, we select YOLOv9 as the baseline model due to its various advantages. YOLOv9 introduces YOLOv9 introduces Programmable Gradient Information (PGI) in its architecture, which generates reliable gradient information through auxiliary reversible branches, solving the information bottleneck problem in deep network training and allowing the network to update weights more effectively. Meanwhile, a Generalized Efficient Layer Aggregation Network (GELAN) is proposed, which is based on gradient path planning and balances accuracy and inference speed.
However, in real-world transmission line applications, detecting crucial components presents multiple challenges. First, crucial components such as insulators are typically small objects, which places high demands on the model’s ability to extract fine-grained features. Second, the background of transmission lines is highly complex, with many interfering factors, and the components are often occluded by other objects. As a result, YOLOv9 tends to have a higher rate of missed and false detections in these complex scenarios, particularly when detecting small objects and occluded objects. To address these issues, this study will improve YOLOv9 by enhancing feature extraction, contextual information utilization, and model training to improve the detection accuracy of small targets and enhance their robustness in occluded scenes, in order to achieve high-precision detection of crucial components.
2.2.1 Overview of SGI-YOLOv9 network
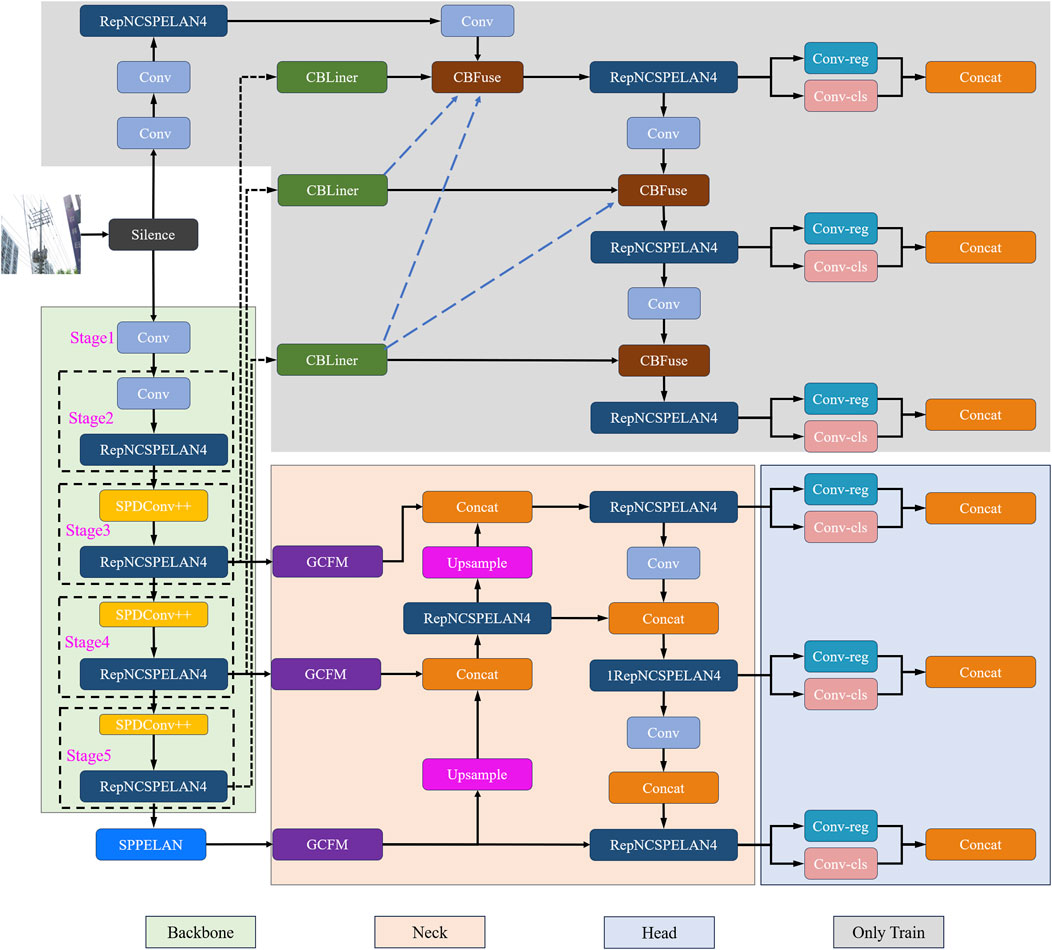
In this study, we propose an improved YOLOv9 method by optimizing two core modules in the original YOLOv9s model architecture. First, in the deep downsampling part of the backbone network, we design an SPDConv++ module to replace the original convolutional module. SPDConv++ spatially decomposes and reconstructs the input features, significantly reducing the loss of fine-grained feature information during downsampling and thereby improving the accuracy of small object detection. Second, in the neck part, we introduce a Global Context Fusion Module (GCFM), which combines spatial and channel self-attention mechanisms to model global contextual information. The GCF module effectively captures long-range contextual dependencies, enhancing robustness and detection accuracy in complex backgrounds and occluded scenarios. Additionally, during the training phase, we propose the Inner-PIoU loss function to improve convergence. The rest of the network structure and strategies remain consistent with the original YOLOv9s.
Based on the aforementioned improvements, we developed the final SGI-YOLOv9 algorithm, with the overall architecture shown in Figure 3. The following sections will provide a detailed explanation of the SGI-YOLOv9 method proposed in this paper.
2.2.2 SPDConv++ moule
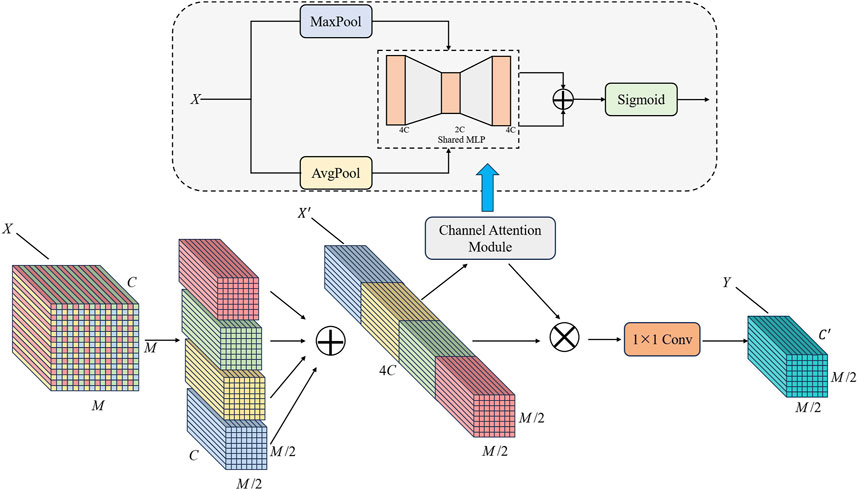
Small objects inherently possess limited feature information, making it essential to minimize information loss during feature extraction to maintain detection accuracy. In the original YOLOv9 architecture, a convolutional module with a stride of 2 is employed for downsampling, which inevitably results in the loss of fine-grained features, thereby impairing small object detection. To address this limitation and improve the model’s small object detection capability, inspired by SPD-Conv (space-to-depth convolution) [37], we propose the SPD++ convolutional module, as illustrated in Figure 4. Specifically, for the input feature
The sub-features
The channel attention module begins by performing global max pooling and global average pooling on the input feature map. By using a three-layer fully connected feedforward network to interact with different channels, a set of attention weights can be learned that can suppress redundant channels and highlight important channels. After the three-layer network, the resulting pooled vectors are then processed by a three-layer fully connected feedforward network. The outputs from both pooling operations are combined through element-wise addition, followed by the application of a sigmoid activation function to generate the channel attention weights. These weights are subsequently used to reweight the input features along the channel dimension, enhancing the model’s ability to focus on the most informative channels.
In the entire SPDConv++ module, we do not use convolutions with a stride greater than 1, ensuring that downsampling is performed with minimal loss of fine-grained feature information. Compared to the original SPD convolution, we introduce a channel attention mechanism to the concatenated sub-features to highlight the more discriminative channels. Since the number of channels in the concatenated sub-features is significantly higher than that of the original input features, some redundant features are inevitable. Therefore, incorporating a channel attention mechanism is essential to effectively reduce redundancy and enhance the model’s discriminative capability.
2.2.3 Global context fusion
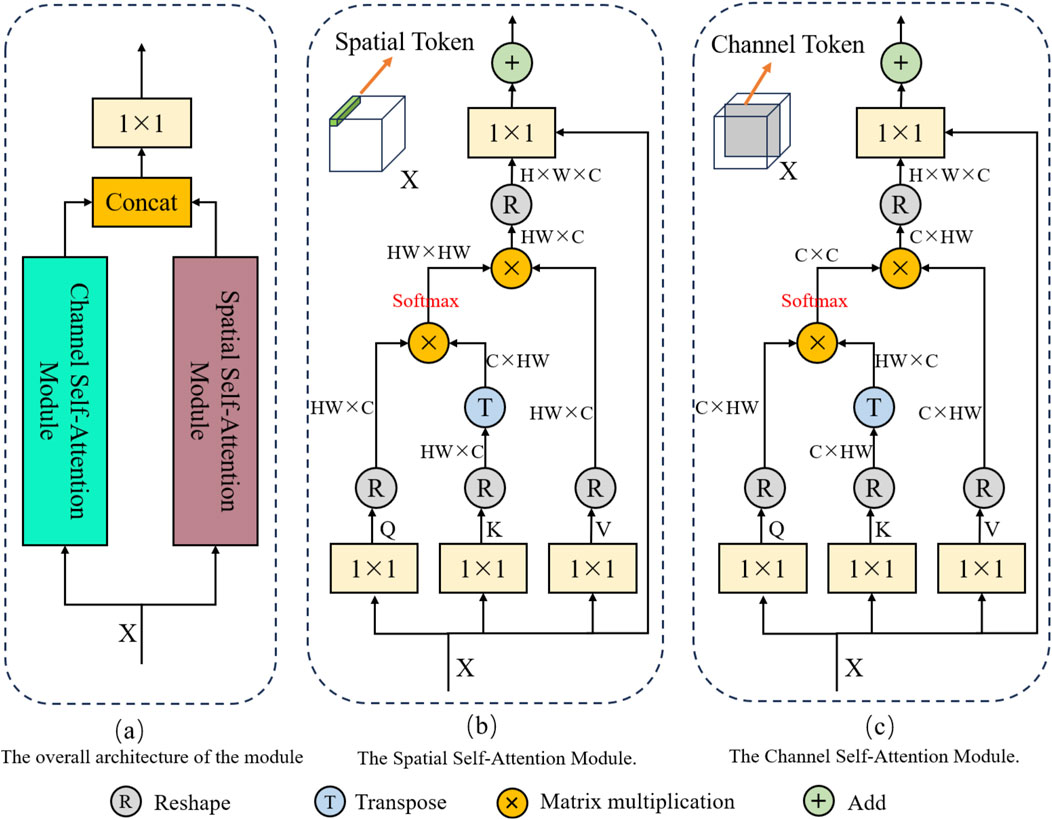
Contextual information is important for detecting small and occluded objects; however, traditional convolutional network architectures lack the ability to effectively integrate global contextual features. In recent years, self-attention mechanisms, due to their ability to establish long-range dependencies, have been widely used in visual tasks to fuse global contextual information [38, 39]. However, traditional visual self-attention mechanisms only perform computations in the spatial dimension, neglecting the modeling of information in the channel dimension. To more fully integrate global contextual information and further improve detection accuracy, this paper proposes a Global Context Fusion module. This module includes both spatial self-attention and channel self-attention mechanisms, which model global information from the spatial and channel dimensions, respectively, as shown in Figure 5A. The outputs of the spatial self-attention module and the channel self-attention module are concatenated along the channel dimension, and finally passed through a
Specifically, as shown in Figure 5B, in the spatial self-attention module, for the input feature
Additionally, The spatial self-attention module uses tokens corresponding to different spatial positions in the feature map as computing units to obtain contextual information from the spatial dimension, but ignores information modeling from the channel dimension. In deep networks, the feature maps of different channels focus on expressing different feature information, so it is equally important to fuse global contextual information from the channel dimension. Therefore, in the channel self-attention module designed in this paper, we treat each channel as an independent token for self-attention mechanism calculation. As shown in Figure 5C, in the channel self-attention module, each channel of the input feature
2.2.4 Inner-PIoU
Intersection over Union (IoU) is a fundamental metric for assessing the performance of object detection systems. In these tasks, IoU quantifies the overlap between the predicted bounding box and the ground truth box, specifically calculating the ratio of the intersection area to the union area of these boxes. An effectively designed IoU-based loss function promotes better alignment of the predicted bounding box with the ground truth, thereby enhancing model convergence speed. In YOLOv9, the Complete Intersection over Union (CIoU) metric is utilized, which considers not only the overlapping area but also the distance between the center points and the aspect ratio of the boxes [40]. However, CIoU has limitations; it does not fully account for shape differences and variations between anchor boxes and ground truth boxes, potentially leading to undesirable convergence behavior [41]. Furthermore, in scenarios where the anchor box and the ground truth box do not overlap, merely increasing the size of the anchor box can lead to a reduction in CIoU loss, which is an unreasonable outcome. Consequently, during model training, CIoU may fail to adequately represent the differences between bounding boxes, resulting in decreased model generalization and slower convergence rates. To address this limitation and improve detection accuracy, this study introduces Powerful-IoU (PIoU) for optimization [42]. The loss function for PIOU is defined as shown in Equations 6, 7.
In this equation,
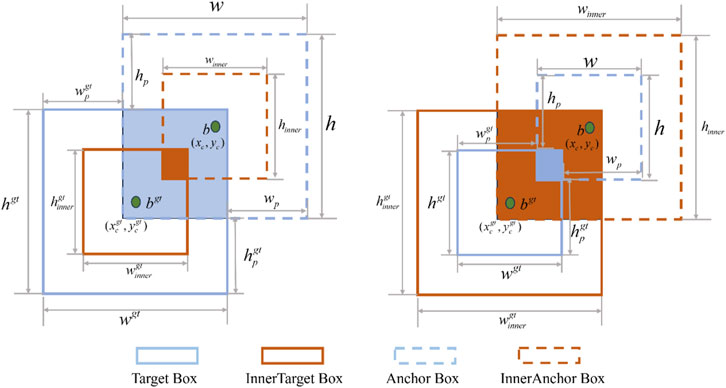
Although the new loss term in PIOU contributes to accelerating model convergence, it has inherent limitations in adapting to different types of detectors and detection tasks. To address these issues, we introduce Inner-IOU to mitigate the common problems of weak and slow convergence in various detection tasks. Inner-IOU, by utilizing additional scalable bounding boxes, effectively overcomes the shortcomings in generalization ability of existing methods, thereby enhancing the overall model performance [43]. The parameters and operational mechanism are shown in Figure 9. The calculation method for Inner-IOU is as shown in Equation 8.
The calculation methods for
The definitions of
The center point of the anchor box is
3 Experimental results
To evaluate the efficacy of the proposed SGI-YOLOv9 method, we performed training and testing using the CPDN dataset as well as the PASCAL VOC 2007 dataset, followed by a comparative analysis against other state-of-the-art object detection models. This chapter offers a comprehensive overview of the experimental procedures and implementation details.
3.1 Implementation details
3.1.1 Experimental environment
All experiments were conducted under a consistent computational environment. The system specifications used in our experiments are as follows: a 15-core Intel(R) Xeon(R) Platinum 8358P CPU operating at 2.60 GHz, and an NVIDIA GeForce RTX 3090 GPU. The system ran on Ubuntu 20.04 with PyTorch 1.11.0 and CUDA 11.3. The memory capacity was 24 GB, and Python version 3.8 was employed throughout the experiments.
3.1.2 Training and evaluation metric
3.1.2.1 Training
During the model training phase, we configured the momentum parameter to 0.9 and set the weight decay coefficient to 5e-4, employing stochastic gradient descent (SGD) as the optimization algorithm. The batch size was consistently maintained at 32, with a total of 200 training epochs and an initial learning rate of 0.01. Additionally, auxiliary training strategies were implemented during training; however, these strategies were not applied during the inference phase.
3.1.2.2 Evaluation Metric
This paper employs commonly used evaluation metrics in the field of object detection, including precision (P), recall (R), and mean average precision (mAP). These metrics are used to assess the effectiveness and accuracy of component detection in the power distribution network. Higher values indicate better model performance. The calculation of these metrics involves the following parameters: TP (true positives, where the prediction is positive and the actual label is also positive), FP (false positives, where the prediction is positive but the actual label is negative), and FN (false negatives, where the prediction is negative but the actual label is positive).
In object detection tasks, precision measures the degree of false positives produced by the algorithm. A higher precision indicates fewer false detections. The calculation formula is shown in Equation (16):
In object detection tasks, recall measures the degree of missed detections by the algorithm. A higher recall indicates fewer missed detections. The calculation formula is shown in Equation (17):
The evaluation of an object detection algorithm’s performance should encompass both precision and recall metrics. By varying the confidence thresholds, corresponding precision and recall values can be derived, which are subsequently plotted to create a Precision-Recall (PR) curve, with precision represented on the vertical axis and recall on the horizontal axis. The area enclosed by the PR curve and the coordinate axes indicates the Average Precision (AP). If we denote the function associated with this curve as
Mean Average Precision (mAP) is calculated by determining the AP values for all target categories and then computing their average. The formula for mAP is provided in Equation (19):
3.2 Ablation study
To determine the optimal ratio parameter for Inner-PIoU in detecting crucial components in the CPDN dataset, we conduct a series of experiments and compare the results with the CIoU used in original YOLOv9, as shown in Table 1. When the ratio is set to 1.0, indicating no auxiliary bounding box and only using Powerful-IoU, the results show a 0.6% increase in mAP@50, validating the effectiveness of Powerful-IoU in detecting crucial components in the power distribution network. When the ratio is set to 0.9, which introduces a smaller auxiliary bounding box, there is no significant improvement in mAP@50 compared to the ratio of 1.0. However, when the ratio exceeds 1.0, indicating the use of a larger auxiliary bounding box, the performance improves. Specifically, with ratio values of 1.1 and 1.2, mAP@50 increases by 0.6% and 0.3%, respectively, compared to a ratio of 1.0. Since most components in the CPDN dataset are considered small objects, further experiments demonstrate that when the ratio exceeds 1.0, the convergence of the model training for small object detection improves significantly. Consequently, this leads to a notable enhancement in detection accuracy. Therefore, we select a ratio of 1.1 for Inner-PIoU as the optimal parameter and use it as the default in subsequent experiments.
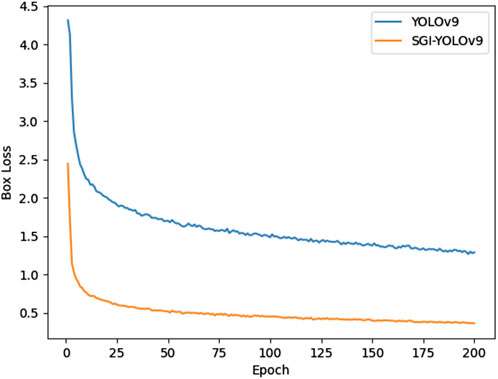
We further analyze and compare the box loss of the improved YOLOv9 with the original YOLOv9, as shown in Figure 7. The curve shows that the loss for the improved YOLOv9 is significantly lower than that of the original YOLOv9 during the initial training phase, indicating that the improved YOLOv9 adapts to the data more quickly. As the training epochs progress, both models exhibit a rapid decline in loss, but the improved YOLOv9 demonstrates a much faster decrease. This indicates that the improved YOLOv9 learns the positions of bounding boxes more efficiently and reduces the deviation between the predicted and actual boxes more effectively. After both models converge, the loss for the SGI-YOLOv9 consistently remains lower than that of the original YOLOv9. These findings confirm that the SGI-YOLOv9, with the incorporation of Inner-PIoU, adapts to the dataset faster, achieves lower loss values during training, and converges more quickly.
Next, we conduct ablation experiments on each of the proposed modules, as shown in Table 2. The results demonstrate that each module contributes to improving the accuracy of crucial components recognition in the power distribution network. Specifically, when the ratio is set to 1.1, Inner-PIoU improves accuracy by 1.2% on the CPDN test set, while SPDConv++ and GCFM contribute improvements of 1.6% and 1.1%, respectively. These findings further validate that the proposed methods enhance the accuracy of crucial components recognition in the power distribution network effectively.
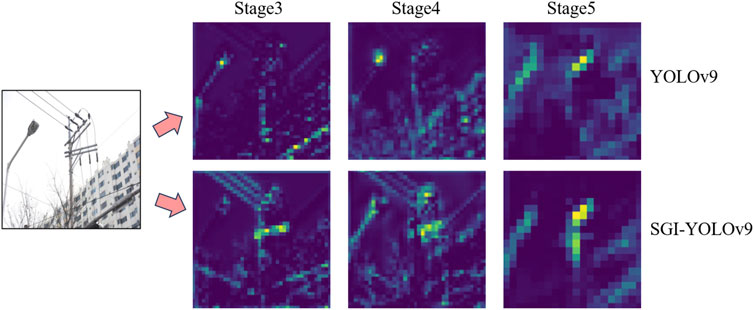
As shown in Figure 8, we compare the feature maps extracted at various stages of the backbone network between the original YOLOv9 model and the SGI-YOLOv9 model. Through feature map visualization, it is evident that after introducing the SPDConv++ method, the improved model exhibits a stronger response to edge information of crucial components in the power distribution network. Particularly in the Stage 3, Stage 4, and Stage 5 phases of the backbone network, the SGI-YOLOv9 model significantly reduces the loss of fine-grained features, preserving more detailed information. These results indicate that the SPDConv++ method effectively enhances the richness of fine-grained features in the backbone network output feature maps, further validating the effectiveness and robustness of this method in object detection from the perspective of feature visualization.
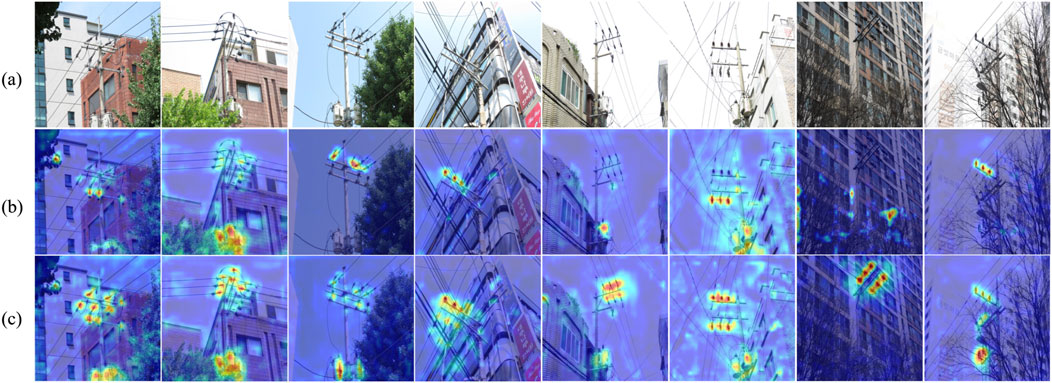
Additionally, we utilize XGrad-CAM [44] to perform a visual analysis of the attention heatmaps for both the original YOLOv9 and the SGI-YOLOv9 models, as shown in Figure 9. In this figure, (a) represents the input image, (b) shows the attention heatmap from the original YOLOv9 model, and (c) displays the attention heatmap from the SGI-YOLOv9 model. The visualization results clearly indicate that the SGI-YOLOv9 model significantly improves its focus on key components of the power transmission lines in complex backgrounds. This highlights the notable advantage of SGI-YOLOv9 in enhancing detection accuracy, particularly in complex scenes involving crucial components of the power distribution network, further validating its effectiveness and reliability in practical applications.
3.3 Compare with state-of-arts on CPDN dataset
To ensure a fair comparison between our proposed SGI-YOLOv9 method and other mainstream object detection methods on the CPDN dataset, we train all models without loading any pre-trained models. Table 3 presents the comparative experimental results of SGI-YOLOv9 and other mainstream object detection methods on the test set. As shown in the table, SGI-YOLOv9 achieves the highest scores across all evaluation metrics on the CPDN test set, with a mAP@50 of 79.1%, which is a 3.9% improvement over the original YOLOv9. This demonstrates that our SGI-YOLOv9 method offers a significant advantage in detecting crucial components within the complex background of the power distribution network.
To further evaluate the effectiveness of the SGI-YOLOv9 algorithm in detecting different types of components in the power distribution network, we record the AP@50 for seven component types in the dataset, as shown in Figure 10. It is evident that the SGI-YOLOv9 model consistently outperforms the original YOLOv9 in terms of overall AP@50. Specifically, SGI-YOLOv9 demonstrates stable performance improvements when detecting larger components such as COS and Transformers, with increases of 1.7% and 1.3%, respectively. For smaller components, such as Arresters and Insulators, the improvements are even more significant. Notably, SGI-YOLOv9 achieves a 6.1% increase in AP@50 for Arresters, marking the most substantial gain. Additionally, the mAP@50 for the four types of Insulators increases by 4.58%. These results confirm the significant improvement of SGI-YOLOv9 in detecting small objects, highlighting its enhanced ability to focus on and handle small objects in complex scenes.
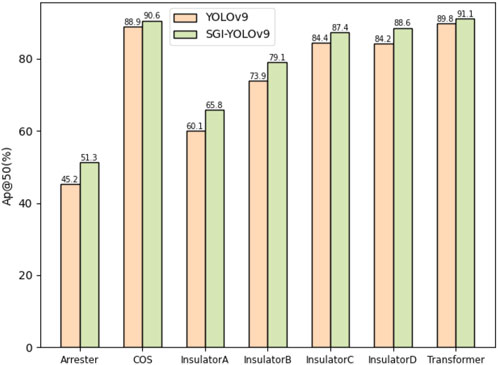
Figure 10. Comparison of QVBAMC41 for different categories between the original YOLOv9 and SGI-YOLOv9 on the CPDN dataset.
To comprehensively validate the effectiveness of the proposed SGI-YOLOv9 method, we compare its visualization results for crucial components detection with those of other mainstream object detection algorithms, as shown in Figure 11. It is evident that YOLOv5, YOLOv7, YOLOv8, and YOLOv9 all exhibit varying degrees of omission and false detections. This is especially pronounced when the crucial components are small or occluded, where other mainstream models demonstrate low confidence in their predicted bounding boxes, leading to numerous missed detections and false positives. In contrast, our SGI-YOLOv9 model shows higher detection accuracy when handling small and occluded crucial components. These findings demonstrate that SGI-YOLOv9 is highly effective for crucial component detection tasks in the complex environments of the power distribution network.
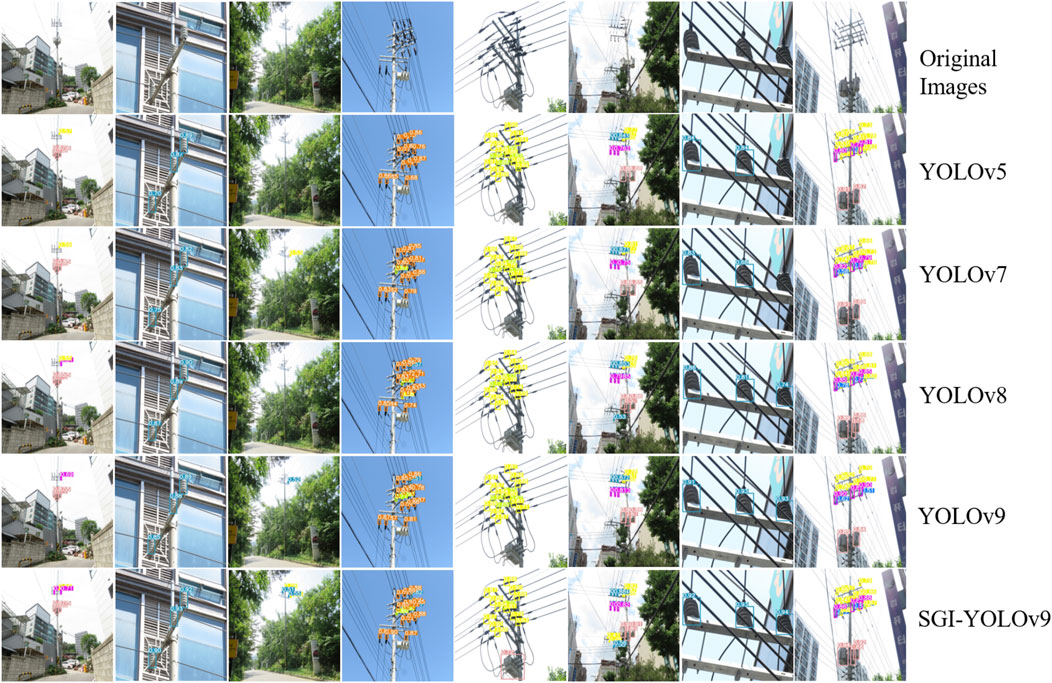
Figure 11. Results of various methods for crucial components detection in the power distribution network.
3.4 Compare with state-of-arts on the PASCAL VOC 2007 dataset
To further validate the effectiveness of the proposed SGI-YOLOv9 model in object detection tasks, we conducted training experiments on the PASCAL VOC 2007 dataset and systematically compared its performance on the test set with several mainstream object detection algorithms. Notably, all models utilized in the comparison were lightweight versions. As shown in Table 4, the SGI-YOLOv9 model achieved a significant performance improvement, attaining a mAP@50 value of 63.3%, which represents a 1.6% increase compared to the original YOLOv9. Additionally, the precision improved by 1.4%, and the recall increased by 1.3% over the original YOLOv9. These results demonstrate that SGI-YOLOv9 not only delivers superior accuracy in insulator defect detection tasks but also excels in general-purpose object detection tasks. This highlights the model’s robustness, algorithmic superiority, and strong generalization capability across diverse application scenarios.
4 Conclusion
This paper presents an improved method based on YOLOv9 to address the challenges of small objects detection and complex scenarios in the detection of crucial components in the power distribution network. By designing the SPDConv++ module, we reduce the loss of fine-grained feature information and improve the accuracy in detecting small objects. Simultaneously, the proposed global context fusion module models global information from both spatial and channel dimensions, effectively handling complex backgrounds and occlusion issues. Additionally, we optimized the loss function of IoU in YOLOv9 by proposing the Inner-PIoU method, which combines the advantages of Powerful-IoU and Inner-IoU to enhance the regression performance of the bounding boxes, thereby improving the model’s generalization ability and detection accuracy for crucial components in the power distribution network. Experimental results demonstrate the effectiveness of SGI-YOLOv9, achieving an mAP@50 of 79.1% on the CPDN dataset, an improvement of 3.9% over the original YOLOv9, and an mAP@50 of 63.3% on the PASCAL VOC 2007 dataset, surpassing YOLOv9 by 1.6%. The proposed method provides effective technical support for detecting crucial components in the power distribution network under complex scenarios, contributing to the safety and reliability of power grid. Future research may focus on further optimizing the model’s computational efficiency and applying it to more power system scenarios to promote the development of smart grids.
Data availability statement
The original contributions presented in the study are included in the article/supplementary material, further inquiries can be directed to the corresponding author.
Author contributions
MY: Conceptualization, Methodology, Writing–original draft. BC: Methodology, Software, Writing–original draft. CL: Validation, Writing–review and editing. WY: Funding acquisition, Writing–review and editing. YL: Visualization, Writing–review and editing.
Funding
The author(s) declare that financial support was received for the research, authorship, and/or publication of this article. The author(s) declare financial support was received for the research, authorship, and/or publication of this article. This work was supported by The State Grid Corporation Headquarters Science and Technology Project:Research on key Technologies of Aerial Vehicle Dock Replenishment for Transmission Line(5500-202321166A-1-1-ZN). The funder was not involved in the study design, collection, analysis, interpretation of data, the writing of this article, or the decision to submit it for publication.
Conflict of interest
Authors MY, BC, CL, WY and YL declare that they were employed by State Grid Corporation.
Generative AI statement
The author(s) declare that no Generative AI was used in the creation of this manuscript.
Publisher’s note
All claims expressed in this article are solely those of the authors and do not necessarily represent those of their affiliated organizations, or those of the publisher, the editors and the reviewers. Any product that may be evaluated in this article, or claim that may be made by its manufacturer, is not guaranteed or endorsed by the publisher.
References
1. Yang L, Fan J, Liu Y, Li E, Peng J, Liang Z. A review on state-of-the-art power line inspection techniques. IEEE Trans Instrumentation Meas (2020) 69:9350–65. doi:10.1109/tim.2020.3031194
2. Siddiqui ZA, Park U. A drone based transmission line components inspection system with deep learning technique. Energies (2020) 13:3348. doi:10.3390/en13133348
3. Zhang K, Yang L. Insulator segmentation algorithm based on k-means. Chinese Automation Congress CAC (2019) p. 4747–51.
4. Yu Y, Cao H, Wang Z, Li Y, Li K, Xie S. Texture-and-shape based active contour model for insulator segmentation. IEEE Access (2019) 7:78706–14. doi:10.1109/access.2019.2922257
5. Zhao Z, Liu N, Wang L. Localization of multiple insulators by orientation angle detection and binary shape prior knowledge. IEEE Trans Dielectrics Electr Insul (2015) 22:3421–8. doi:10.1109/tdei.2015.004741
6. He X, Qi G, Zhu Z, Li Y, Cong B, Bai L. Medical image segmentation method based on multi-feature interaction and fusion over cloud computing. Simulation Model Pract Theor (2023) 126:102769. doi:10.1016/j.simpat.2023.102769
7. Zhu Z, Wang S, Gu S, Li Y, Li J, Shuai L, et al. Driver distraction detection based on lightweight networks and tiny object detection. Math biosciences Eng (2023) 20:18248–66. doi:10.3934/mbe.2023811
8. Huang X, Wang S, Qi G, Zhu Z, Li Y, Shuai L, et al. Driver distraction detection based on cloud computing architecture and lightweight neural network. Mathematics (2023) 11:4862. doi:10.3390/math11234862
9. Girshick R, Donahue J, Darrell T, Malik J. Rich feature hierarchies for accurate object detection and semantic segmentation. In: Proceedings of the IEEE conference on computer vision and pattern recognition (2014) p. 580–7.
10. Ren S, He K, Girshick R, Sun J. Faster r-cnn: towards real-time object detection with region proposal networks. IEEE Trans pattern Anal machine intelligence (2016) 39:1137–49. doi:10.1109/tpami.2016.2577031
11. He K, Gkioxari G, Dollár P, Girshick R. Mask r-cnn. In: Proceedings of the IEEE international conference on computer vision (2017) p. 2961–9.
12. Zhao Z, Zhen Z, Zhang L, Qi Y, Kong Y, Zhang K. Insulator detection method in inspection image based on improved faster r-cnn. Energies (2019) 12:1204. doi:10.3390/en12071204
13. Odo A, McKenna S, Flynn D, Vorstius JB. Aerial image analysis using deep learning for electrical overhead line network asset management. IEEE Access (2021) 9:146281–95. doi:10.1109/access.2021.3123158
14. Dong C, Zhang K, Xie Z, Shi C. An improved cascade rcnn detection method for key components and defects of transmission lines. IET Generation, Transm & Distribution (2023) 17:4277–92. doi:10.1049/gtd2.12948
15. Redmon J. You only look once: unified, real-time object detection. In: Proceedings of the IEEE conference on computer vision and pattern recognition (2016).
17. Bochkovskiy A, Wang CY, Liao HYM. Yolov4: optimal speed and accuracy of object detection. arXiv preprint arXiv:2004.10934 (2020).
18. Wu W, Liu H, Li L, Long Y, Wang X, Wang Z, et al. Application of local fully convolutional neural network combined with yolo v5 algorithm in small target detection of remote sensing image. PloS one (2021) 16:e0259283. doi:10.1371/journal.pone.0259283
19. Wang CY, Bochkovskiy A, Liao HYM. Yolov7: trainable bag-of-freebies sets new state-of-the-art for real-time object detectors. In: Proceedings of the IEEE/CVF conference on computer vision and pattern recognition (2023) p. 7464–75.
20. Wang L, Zhang G, Wang W, Chen J, Jiang X, Yuan H A defect detection method for industrial aluminum sheet surface based on improved yolov8 algorithm. Front Phys(2024) 12:1419998. doi:10.3389/fphy.2024.1419998
21. Wang CY, Yeh IH, Liao HYM. Yolov9: learning what you want to learn using programmable gradient information. In: arXiv preprint arXiv:2402 (2024) p. 13616.
22. Liu W, Anguelov D, Erhan D, Szegedy C, Reed S, Fu CY, et al. Ssd: single shot multibox detector. In: Computer vision–ECCV 2016: 14th European conference, Amsterdam, The Netherlands, october 11–14, 2016, proceedings, Part I 14. Springer (2016) p. 21–37.
23. Lv H, Du Y, Ma Y, Yuan Y. Object detection and monocular stable distance estimation for road environments: a fusion architecture using yolo-redeca and abnormal jumping change filter. Electronics (2024) 13:3058. doi:10.3390/electronics13153058
24. Qi C, Chen Z, Chen X, Bao Y, He T, Hu S, et al. Efficient real-time detection of electrical equipment images using a lightweight detector model. Front Energy Res (2023) 11:1291382. doi:10.3389/fenrg.2023.1291382
25. Siddiqui ZA, Park U, Lee SW, Jung NJ, Choi M, Lim C, et al. Robust powerline equipment inspection system based on a convolutional neural network. Sensors (2018) 18:3837. doi:10.3390/s18113837
26. Liu Z, Wu G, He W, Fan F, Ye X. Key target and defect detection of high-voltage power transmission lines with deep learning. Int J Electr Power & Energy Syst (2022) 142:108277. doi:10.1016/j.ijepes.2022.108277
27. Qiu Z, Zhu X, Liao C, Shi D, Qu W. Detection of transmission line insulator defects based on an improved lightweight yolov4 model. Appl Sci (2022) 12:1207. doi:10.3390/app12031207
28. Liu M, Li Z, Li Y, Liu Y. A fast and accurate method of power line intelligent inspection based on edge computing. IEEE Trans Instrumentation Meas (2022) 71:1–12. doi:10.1109/tim.2022.3152855
29. Liu C, Ma L, Sui X, Guo N, Yang F, Yang X, et al. Yolo-csm-based component defect and foreign object detection in overhead transmission lines. Electronics (2023) 13:123. doi:10.3390/electronics13010123
30. Chen B, Zhang W, Wu W, Li Y, Chen Z, Li C. Id-yolov7: an efficient method for insulator defect detection in power distribution network. Front Neurorobotics (2024) 17:1331427. doi:10.3389/fnbot.2023.1331427
31. He M, Qin L, Deng X, Liu K. Mfi-yolo: multi-fault insulator detection based on an improved yolov8. IEEE Trans Power Deliv (2023) 39:168–79. doi:10.1109/tpwrd.2023.3328178
32. Zhu Z, Zheng R, Qi G, Li S, Li Y, Gao X. Small object detection method based on global multi-level perception and dynamic region aggregation. IEEE Trans Circuits Syst Video Technology (2024) 34:10011–22. doi:10.1109/tcsvt.2024.3402097
33. Qi G, Zhang Y, Wang K, Mazur N, Liu Y, Malaviya D. Small object detection method based on adaptive spatial parallel convolution and fast multi-scale fusion. Remote Sensing (2022) 14:420. doi:10.3390/rs14020420
34. Li Y, Zhou Z, Qi G, Hu G, Zhu Z, Huang X. Remote sensing micro-object detection under global and local attention mechanism. Remote Sensing (2024) 16:644. doi:10.3390/rs16040644
35. Zhang T, Zhang Y, Xin M, Liao J, Xie Q. A light-weight network for small insulator and defect detection using uav imaging based on improved yolov5. Sensors (2023) 23:5249. doi:10.3390/s23115249
36. University H. All image dataset (2023). Available from: https://universe.roboflow.com/hanshin-university/allimage (Accessed October 17, 2024).
37. Sunkara R, Luo T. No more strided convolutions or pooling: a new cnn building block for low-resolution images and small objects. In: Joint European conference on machine learning and knowledge discovery in databases. Springer (2022). p. 443–59.
39. Dosovitskiy A. An image is worth 16x16 words: transformers for image recognition at scale. arXiv preprint arXiv:2010.11929 (2020).
40. Zheng Z, Wang P, Liu W, Li J, Ye R, Ren D. Distance-iou loss: faster and better learning for bounding box regression. Proc AAAI Conf Artif intelligence (2020) 34:12993–3000. doi:10.1609/aaai.v34i07.6999
41. Zhang YF, Ren W, Zhang Z, Jia Z, Wang L, Tan T. Focal and efficient iou loss for accurate bounding box regression. Neurocomputing (2022) 506:146–57. doi:10.1016/j.neucom.2022.07.042
42. Liu C, Wang K, Li Q, Zhao F, Zhao K, Ma H. Powerful-iou: more straightforward and faster bounding box regression loss with a nonmonotonic focusing mechanism. Neural Networks (2024) 170:276–84. doi:10.1016/j.neunet.2023.11.041
43. Zhang H, Xu C, Zhang S. Inner-iou: more effective intersection over union loss with auxiliary bounding box. arXiv preprint arXiv:2311.02877 (2023).
Keywords: crucial component, smart grid, attention mechanism, YOLOv9, deep learning
Citation: Yang M, Chen B, Lin C, Yao W and Li Y (2024) SGI-YOLOv9: an effective method for crucial components detection in the power distribution network. Front. Phys. 12:1517177. doi: 10.3389/fphy.2024.1517177
Received: 25 October 2024; Accepted: 21 November 2024;
Published: 24 December 2024.
Edited by:
Zhiqin Zhu, Chongqing University of Posts and Telecommunications, ChinaReviewed by:
Guanqiu Qi, Buffalo State College, United StatesYimin Chen, University of Massachusetts Lowell, United States
Copyright © 2024 Yang, Chen, Lin, Yao and Li. This is an open-access article distributed under the terms of the Creative Commons Attribution License (CC BY). The use, distribution or reproduction in other forums is permitted, provided the original author(s) and the copyright owner(s) are credited and that the original publication in this journal is cited, in accordance with accepted academic practice. No use, distribution or reproduction is permitted which does not comply with these terms.
*Correspondence: Bojian Chen, Y2JqLmFuZHJvaWRAZ21haWwuY29t
 Mianfang Yang
 Bojian Chen