- 1School of Mathematics and Physics, Yancheng Institute of Technology, Yancheng, Jiangsu, China
- 2School of Mathematical Sciences, Jiangsu University, Zhenjiang, Jiangsu, China
This study focuses on obtaining differences in rock fracture surface morphology under various loading directions and speeds to infer rock damage mechanics by using micro-electro–mechanical system (MEMS) sensors, which can measure stress, strain, and displacement during loading accurately, providing detailed data for understanding the rock fracture mechanism for physics-informed statistics. Statistical variables analyze directional angle samples of the normal vector central line. The deviation normal distribution coefficient (DNDC) for rock fracture surface normal vectors is defined by the kurtosis coefficient. Brazilian splitting tests calculate the DNDC for Brazilian disk fracture surfaces. The variation in the DNDC with a measurement scale distinguishes morphological differences. Three results are obtained: the DNDC has a scale effect; loading the specimen in another direction before compression causes internal damage; and different loading speeds do not significantly change the DNDC. This research holds promise for a better understanding of rock fractures.
1 Introduction
Rock deformation and fracture commence with changes in nano/micro-scale morphology. Micro-electro–mechanical system (MEMS) sensors [1, 2] can be used to measure stress, strain, and displacement during the loading process, and they have ultra-sensitivity [3, 4]. This provides more detailed data on the behavior of rock and enables a more comprehensive understanding of the rock fracture mechanism. Additionally, MEMS sensors can be used to monitor the internal structure of rock in real-time, detecting any micro-cracks or damage that may occur before macroscopic fractures become visible [5]. This could assist in predicting rock failure and taking preventive measures to ensure safety in engineering applications.
Statistical methods can help determine the probability of rock fracture based on the sensor readings. For example, by analyzing the variance in stress measurements over time, it is possible to predict when a rock is approaching its breaking point. This combination of MEMS sensors and statistics produces a physics-informed statistical method.
In the process of Earth’s crustal movement, such as earthquakes, landslides, and mudslides, most processes are accompanied by rock deformation and fracture. For example, in construction projects such as mining, civil engineering, slopes, bridges, and tunnels, these processes are accompanied by rock deformation and fracture. Rock, as a geological mineral of building materials, is increasingly receiving widespread attention from industry professionals, thus forming the discipline of rock mechanics. Rock mechanics mainly studies the stress and fracture conditions of rocks from a mechanical perspective. Nowadays, more and more researchers are starting from the morphology of rock fracture surfaces to infer the mechanical mechanism of rock stress until fracture, also known as micro- and macro-rock mechanics.
In the study of rock fracture morphology, experts have proposed a series of methods, such as Mandlebrot’s theory [6–10] and the two-scale fractal geometry [11–15]. Due to the highly irregular and complex fractal characteristics of rock fracture surfaces, researchers have proposed that fractal dimension can be used to characterize the roughness of rock fracture surfaces, and the morphology of rock fracture surfaces can be quantified by roughness [16–19]. Heping Xie, Jingan Wang, and others accurately characterized the relationship between the roughness of the rock fracture surface and its singular indexes using multi-fractal spectra and drew a graph of function changes [20]. Hongwei Zhou, H. P. Xie, and others used power spectral density and cumulative power spectral density to describe the anisotropy of the profile line on rock fracture surfaces [21]. T. Belem, F. Homand-Etienne M. Souley discovered the joint roughness coefficient of rock joint, which divides the roughness of rock joint surfaces into 10 levels [22]. V. Rasouli and J.P.Harrison proposed using the Reimann statistical method to estimate the roughness of a rock fracture section with linear profiles [23, 24]. M. Borri-Brunetto, A. Carpinteri, S. Invernizzi, and M. Paggi researched the micro-variation of rough surfaces under cyclic tangential loading [25]. M. Borri Brunetto, B. Chiaia, S. studied the multi-fractal properties of rough rock interfaces under pressure and the porosity of the contact domain [26]. A. Carpinteri, B. Chiaia, S. Invernizzi studied the direct fractal measure of fracture surfaces [27]. A. Carpinteri, Chiaia B, Invernizzi S. studied the three-dimensional fractal analysis of the microstructure morphology of concrete [28].
This paper proposes a new experimental method and uses mathematical statistics to study the morphological differences of rock fracture surfaces under different loading directions and loading rates and attempts to infer the mechanical mechanism and mechanism of rock fracture. This physics-informed statistics is an emerging and powerful approach that combines principles from physics and statistics.
2 Experimental design and operation
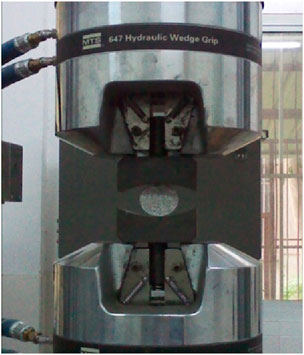
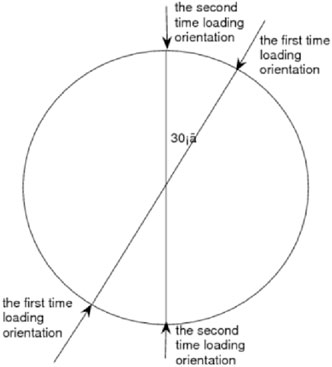
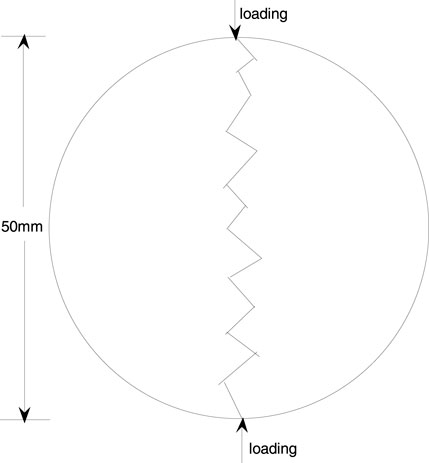
The experimental procedure is as follows: first, granite from Beishan, Gansu, was selected as the rock material as this material is relatively uniform. The ZS100 rock drilling machine used in engineering takes cylindrical rock cores with a diameter of 50 mm and a height of 120 mm and then cuts them into Brazilian disks with a diameter of 50 mm and a thickness of 20 mm using a cutting machine. The disks were polished into standard Brazilian disk specimens with a smooth surface using a polishing machine. The purpose of polishing was to ensure that the rock has a relatively uniform stress process as much as possible. Second, a mechanical test system (MTS) machine was used in the laboratory to load the disk vertically at different rates (as shown in Figure 1), with loading speeds of 0.01 mm/min, 0.1 mm/min, and 1 mm/min until the disk was fractured vertically. Moreover, the following experiments were taken. First, the MTS machine loaded the disk to 13 KN at a speed of 0.01 mm/min, which was approximately equal to 2/3 of the rock fracture threshold. Then, the upper and lower loading jaws of the MTS machine were released, the disk was rotated clockwise around the center by 30°, and it was loaded to fracture (as shown in Figure 2). Three sample specimens were prepared for each of the experiments for a total of 12 specimens. From the principle of rock mechanics, this experiment involved indirectly stretching the Brazilian disk specimen horizontally toward both sides until the disk fractured vertically from the middle (as shown in Figure 3). During the loading process, due to the brittle nature of the rock, the stress on the edges of the rock was uneven, and some specimens may have a small amount of rock debris falling off the edges. Therefore, relatively speaking, the stress on the inner layer of the rock was most uniform. In view of this, the 2-mm equidistant ends of the rectangular section were removed separately (as shown in Figure 4), and the center of the rock rectangular section was kept 46 mm long. This way, the measured data are most representative. Finally, a laser scanner was used to scan the fracture surface of the rock, with a spacing of 0.1 mm. A total of 461 sets of coordinate data were extracted. Before scanning, contrast imaging agents can be sprayed onto the fracture surface to prevent reflection of certain points on the fracture surface.
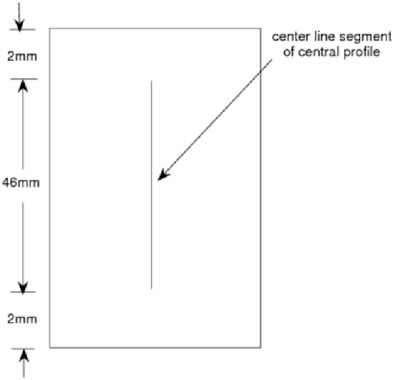
Figure 4. Schematic diagram of the central section along the middle line on the rectangular rock fracture surface.
3 Data acquisition, analysis, and the purpose of researching
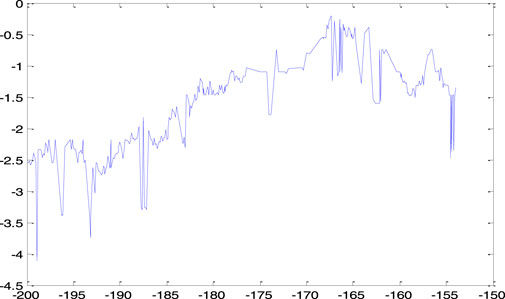
The coordinate data on a central section line were extracted along the loading direction on the rock fracture surface from the data obtained from the above scanning for research and analysis (as shown in Figure 4). In order to reduce errors, a linear interpolation method was used to fit the approximate two-dimensional curve image of this section line (as shown in Figure 5) because the error between the curve fitted by the linear interpolation method and the real curve was within the allowable range [29–31]. Two “peaks” with similar curve contours were connected using a straight line segment (hereafter referred to as the scale), the vector perpendicular to this scale and pointing upward was taken as the normal vector (as shown in Figure 6), and the angle at which the normal vector deviates from the vertical upward vector was measured [23]. Here, it was agreed that the angle of the vector pointing vertically upward was zero degrees, the angle of the vector deviating to the left was negative, and the angle of the vector deviating to the right was positive. These statistical degree data are referred to as the direction angle of the normal vector of the center section line on the fracture surface of each specimen (herein referred to as the direction angle of the specimen). The distribution of directional angles of each specimen at different scales is researched below. Through computer program operation, it was shown that the measurement scale from 1.1 to 0.7 mm is a relatively effective transition range for the directional angle distribution of most specimens from accepting normal distribution to rejecting normal distribution. Therefore, the above measurements were carried out at scales of 1.1, 1.0, 0.9, 0.8, and 0.7 mm to obtain sample data on the directional angle of each specimen. Finally, the sample data obtained by statistical methods were processed to calculate the statistical measures of the directional angles of each specimen at different scales (herein referred to as the statistical measures of the specimens). The above design ideas aimed to achieve three objectives: first, to compare the variation patterns of corresponding statistical quantities of the same specimen at different measurement scales; second, to compare corresponding statistics between specimens that were loaded to 2/3 of the fracture strength threshold at a loading rate of 0.01 mm/min and then rotated at a 30° angle before being crushed and specimens that were directly crushed without rotation; and finally, to reveal the effect and degree of the loading rate on the corresponding statistics of each specimen.
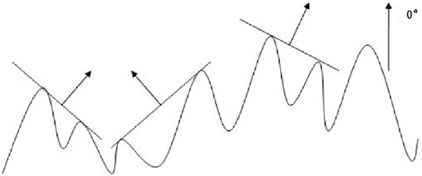
Figure 6. Schematic diagram of the normal vector curve graph of the central section line measurement of the scale connecting two peak points on a profile curve.
4 Using a statistical method to process the data on rock fracture surfaces
On one hand, we calculate the following statistics. Let
as the sample mean (herein referred to as the mean), which reflects the central tendency of the sample data. Denote
as sample variance (herein referred to as variance). Denote
as sample standard variance (herein referred to as standard variance). Variance and standard deviation are statistical measures used to describe the deviation trend of sample data from the mean. Denote
as the skewness coefficient. Denote
as the kurtosis coefficient.
Skewness and kurtosis are two statistical measures of describing the shape of sample data. The skewness coefficient reflects the symmetry of the distribution of the sample data. It is called right skewed when
On the other hand, a hypothesis test is conducted on the normal distribution of the input direction angle data. The angle data here are subjected to Jarque–Bera testing, with a default significance level. In each data table, “
(a) Process 1: Under the condition of a loading speed of 0.01 mm/min, first, the specimen is loaded to 13K N; the upper and lower jaws of the MTS machine are then released; and the specimen is then rotated clockwise at a 30° angle along the center of the disk, continuing to load it vertically until it fractures. Process 2: The loading speed remains at 0.01 mm/min, but the specimen did not rotate and is directly loaded until it fractures. The commonalities and differences in the statistical and directional angle distributions of each specimen in processes 1 and 2 are compared (reference Table 1).
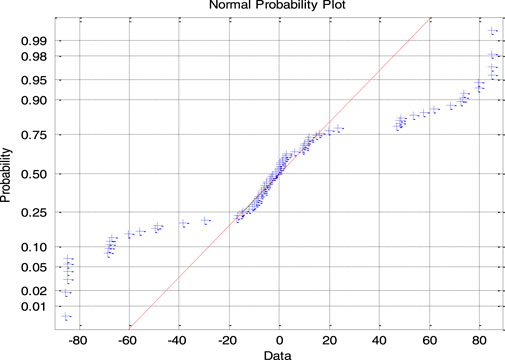
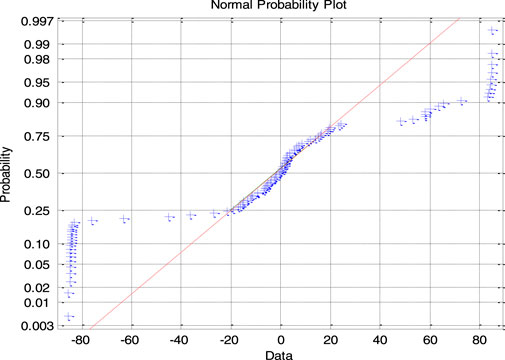
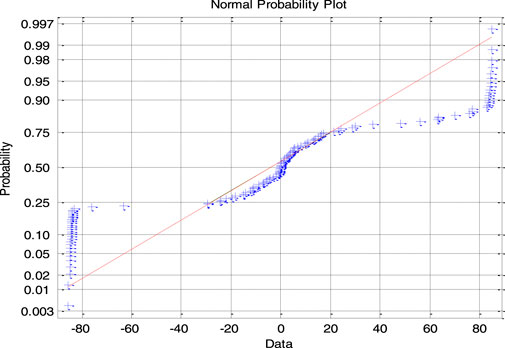
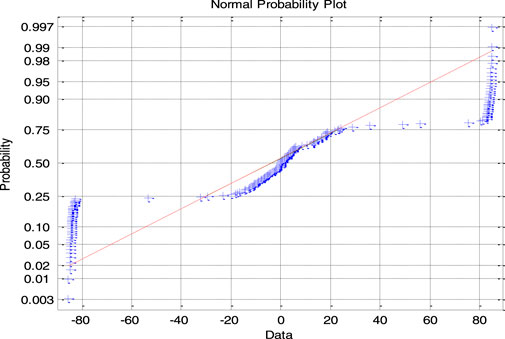
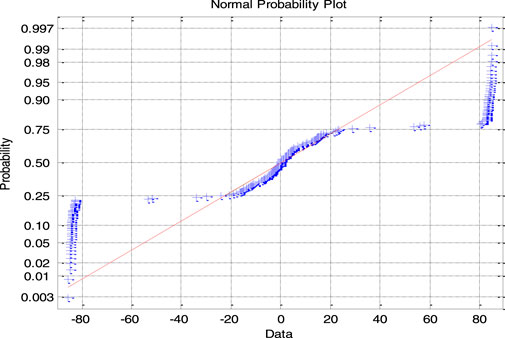
Table 1 shows that the measurement scale range is from 1.1 mm to 0.7 mm, and the commonality of the statistics between specimens rotated 30° and specimens not rotated is that as the measurement scale decreases, the distribution of directional angles of the specimens deviates more and more from the normal distribution. Therefore, if the measurement scale range is from 0.7 mm to 0.8 mm, the null hypothesis of normal distribution is completely denied. Taking sample specimen A1 (R) as an example, its probability distribution function diagrams are shown in Figures 7–11 within the scale range of 1.1 mm–0.7 mm. The figure shows that as the scale decreases, most of the points on the image deviate more from the “red dashed line,” indicating that the distribution of the normal vector deviates more from the normal distribution. Moreover, the variance and standard deviation further increase with the decrease in the measurement scale, indicating that as the scale decreases, the degree of deviation of the angle data from the mean increases. However, from the skewness coefficient being close to 0, it can be concluded that the degree of data dispersion on both sides of the mean is comparable, and other specimens also have similar commonalities. The difference is in statistical characteristics between specimens rotated 30° and those not rotated. From the variation patterns of
(b) The differences in directional angle distribution between specimens with loading speeds 0.01 mm/m and 0.1 mm/m are shown in Tables 1, 2.
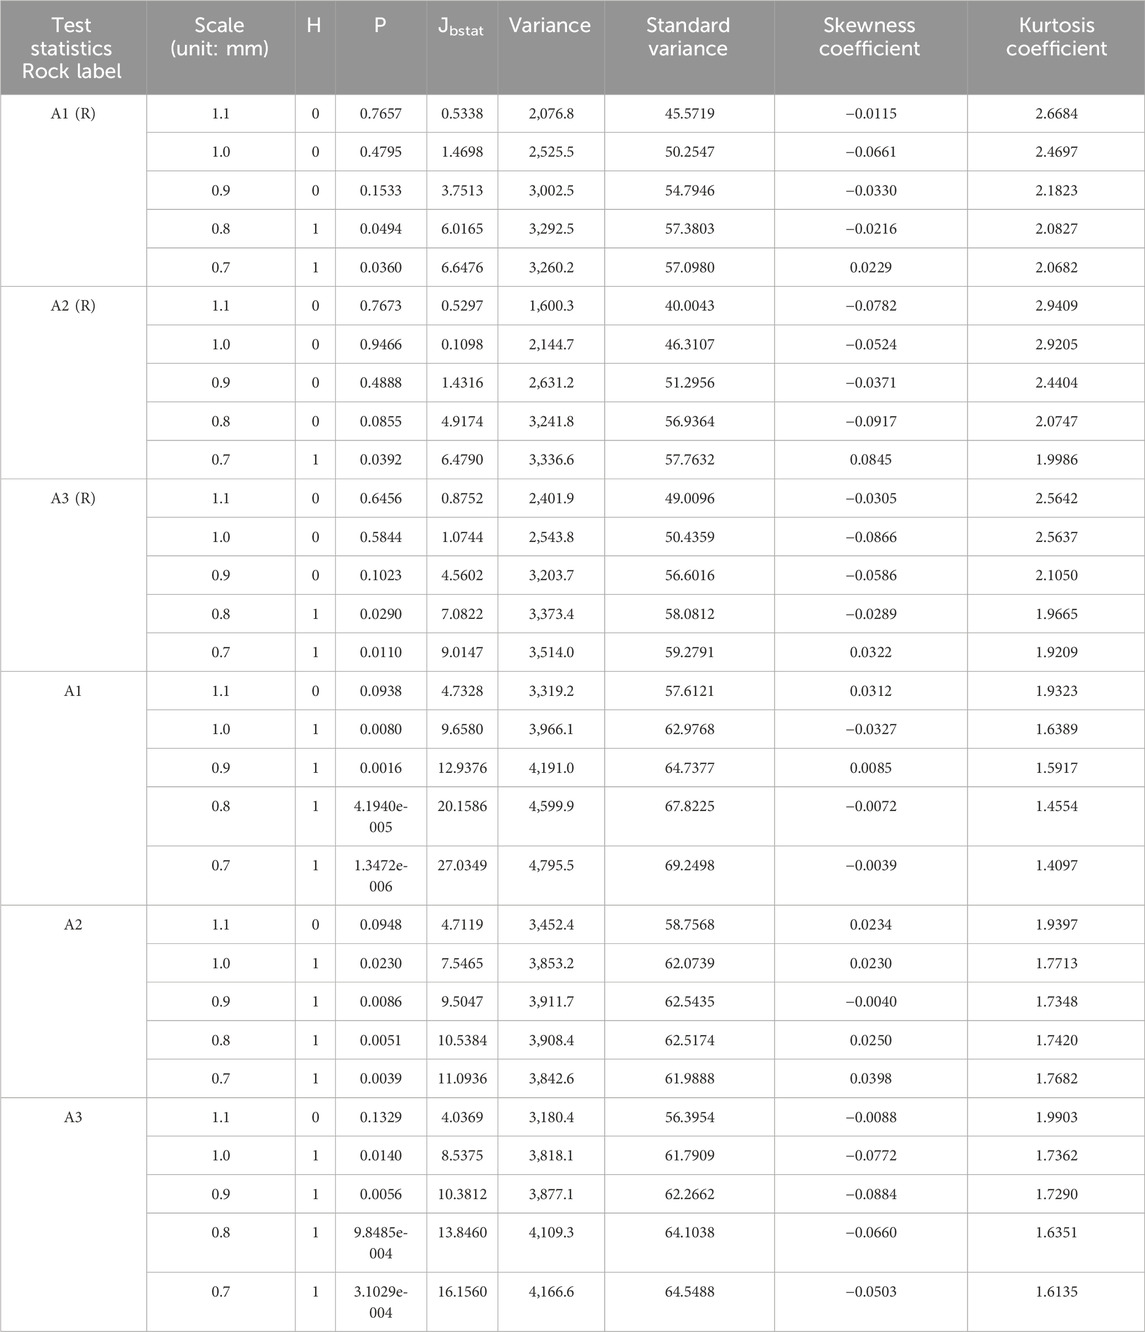
Table 1. Statistical values of specimens rotated 30° and not rotated (“A” represents a loading speed of 0.01 mm/min. “1, 2, and 3” represent the specimen number. “R” represents specimens rotated 30°).
Compared with the statistical values of specimens A1, A2, and A3 in Table 1, the difference between them is that for the first velocity A (0.01 mm/m), the three specimens can accept a normal distribution at a measurement scale of 1.1 mm, while for the second velocity B (0.1 mm/min), the variation patterns of
(c) The relationship and differences between the statistical values of the directional angle samples of each specimen under loading rate 0.01 mm/m and 1 mm/m are compared (refer to Tables 1–3).
After comparison, the statistical value of the directional angle data on the specimens under the third velocity C is similar to the corresponding statistical value under the first velocity A. Both are accepted as normal distributions at a measurement scale of 1.1 mm. However, overall, at a measurement scale of 1.1 mm, the average value of the statistical value P of the directional angles of the three specimens under the third velocity C is larger than that under the first velocity A. The average value of the test statistic
The mean value of the kurtosis coefficient is also higher than that of the first velocity A, indicating that under the condition of loading speed of 1 mm/min, the probability of the distribution of the specimen direction angle accepting the null hypothesis of normal distribution is greater than that under the condition of velocity of 0.01 mm/m. This indicates that there are differences in the fracture morphology of granite caused by these two different loading rates. On the other hand, under the conditions of a loading rate of 0.1 mm/m and a loading rate of 1 mm/m, comparing Tables 2, 3 showed that the faster the loading rate, the more deviated the degree distribution of the directional angle from the normal distribution. This is because under the condition of a loading rate of 1 mm/m, when the measurement scale is 1.1 mm, the distribution can accept the null hypothesis of normal distribution. However, when the loading rate is 0.1 mm/m, the null hypothesis of normal distribution cannot be accepted within the range of 1.1 mm–0.7 mm.
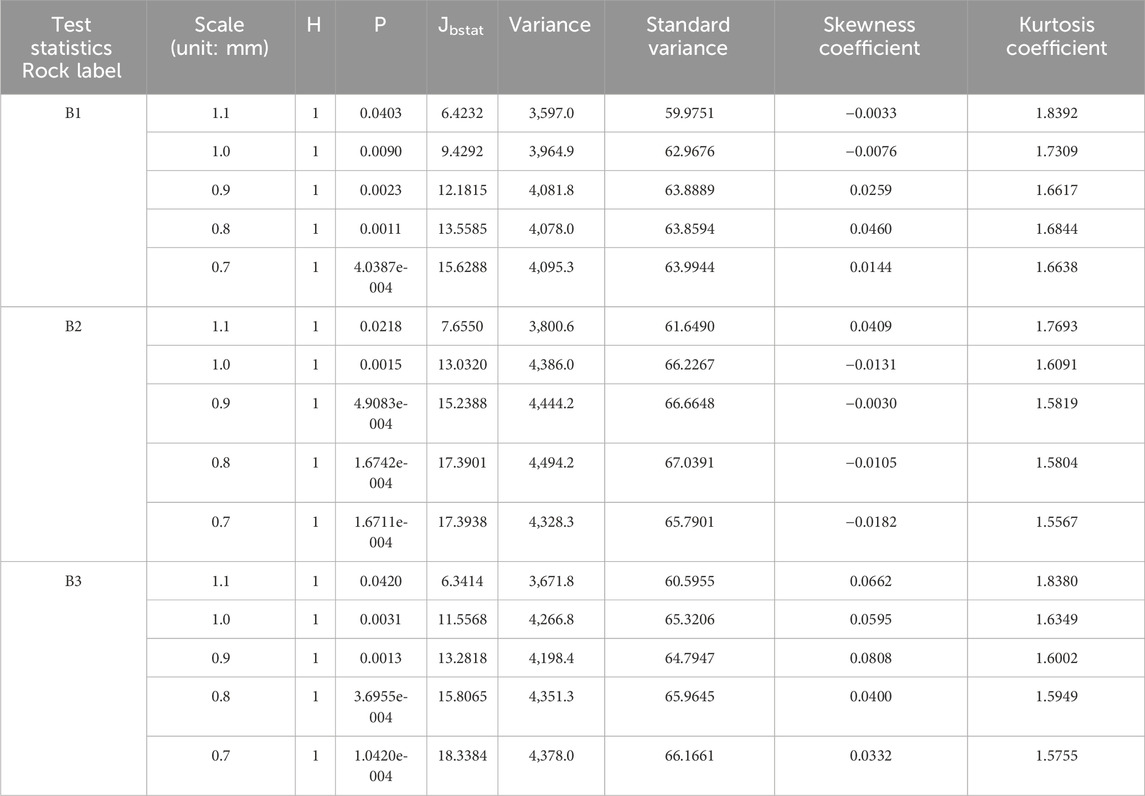
Table 2. Under the condition of loading speed 0.1 mm/m, statistical values of each specimen (“B” represents a loading speed of 0.01 mm/min. “1, 2, and 3” represent the specimen number).
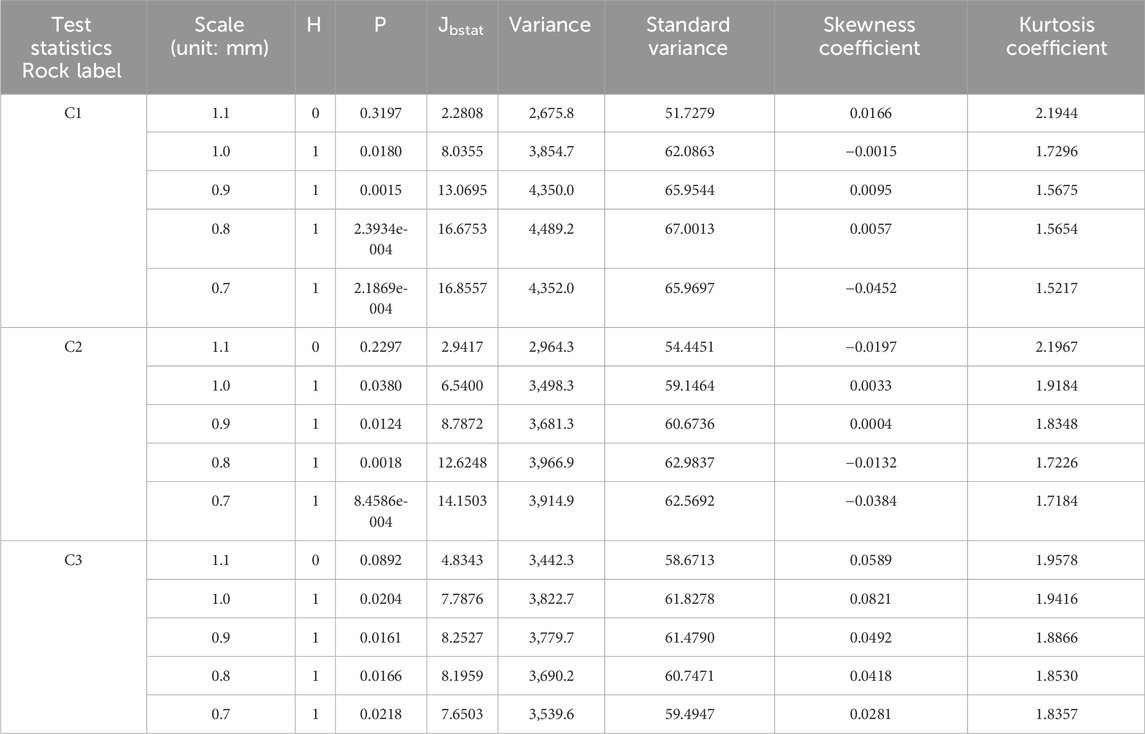
Table 3. Statistical values of directional angle data for each specimen under the condition of loading speed 1 mm/m (“C” represents a loading speed of 1 mm/m. “1, 2, and 3” represent specimen numbers).
5 Skewness coefficient
Based on the above analysis, for a kurtosis coefficient of 3, the sample of the direction angle of the normal vector of the center section on the fracture surface of the specimen follows a standard normal distribution (referred to as the sample of the direction angle of the specimen follows the standard normal distribution). Therefore, from the kurtosis coefficient of the direction angle of each specimen at different scales, the deviation normal distribution coefficient (DNDC) that varies with scale can be defined. The formula is defined as follows:
where
The content below is an analysis of the difference in the skewness coefficient of the normal vector of the central section line on the fracture surface of the specimen under different loading methods (referred to as the skewness coefficient of the specimen).
(i) The relationship between the skewness coefficient and scale of each specimen is revealed.
(ii) The difference in the skewness coefficient between specimens rotated
(iii) The differences in the skewness coefficients of specimens under different loading rates are revealed (the data are given in Table 4).
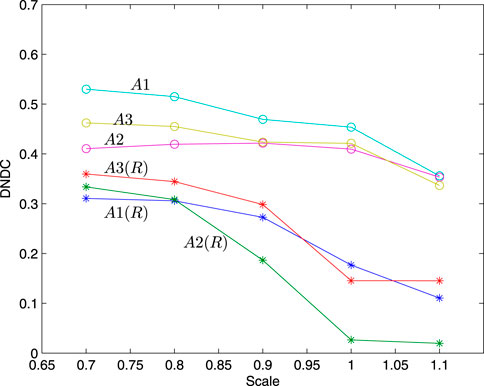
The overall conclusions could be obtained from Table 4. First, for each specimen, its skewness coefficient increases as the scale decreases (refer to Figures 12, 13). Second, for two kinds of specimens at loading speed 0.01 mm/m and the specimens rotated 30°, the variation range of their skewness coefficient is concentrated from 0.1105 to 0.3597, and as the scale decreases, differences in their skewness coefficient become larger and larger. However, for the not-rotated-specimens, their skewness coefficient is concentrated between 0.3534 and 0.5301; so, from Figure 12 and Figure 13, overall, the skewness coefficient of specimens without rotating angles is greater than that of specimens with rotating 30° angles, which shows that when the specimen is loaded to about 2/3 of the fracture threshold, the inside of the rock is indeed damaged. As mentioned above, the skewness coefficients of specimens with a loading rate of 0.01 mm/m are concentrated between 0.3534 and 0.5301, and its range is 0.1767. For the specimens of loading rate 0.1 mm/m, their skewness coefficients range from 0.3869 to 0.4811, with a range of 0.0942. For the specimens of loading rate 1 mm/m, their skewness coefficients are concentrated from 0.2678 to 0.4928, with a range of 0.225. From the range of skewness coefficients, the following conclusion can be obtained. Neither the faster the loading rate of the specimen, the greater the range of skewness coefficients, nor the slower the loading speed of the specimen, the larger the range of skewness coefficients (refer to Figure 13). The variable curves in Figure 12 and Figure 13 show that there is no significant change in the skewness coefficient under the above three loading rates. It indicates that the effects of the three loading rates on the rock fracture morphology of the specimens are not significantly different.
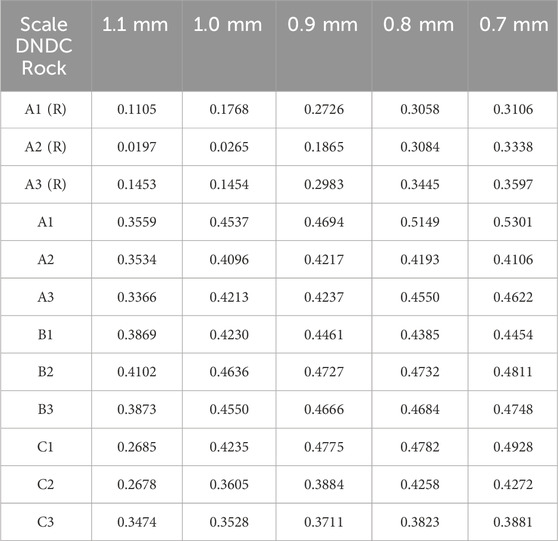
Table 4. Skewness coefficient values between specimens rotating 30° and not rotated (“A” represents loading speed 0.01 mm/m. “1, 2, and 3” represent specimen numbers. “R” represents the specimens of rotating 30°).
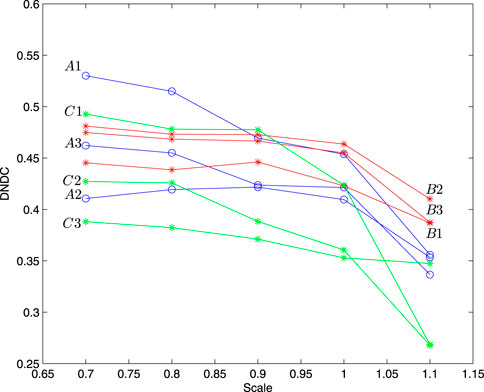
Figure 13. Skewness coefficients of Ai, Bi, and Ci as a function of scale (i = 1, 2, 3; blue, red, and green lines represent loading rates of 0.01 mm/min, 0.1 mm/min, and 1 mm/min, respectively).
6 Conclusion and outlook
MEMS sensors play a crucial role in understanding rock fracture. Coupled with statistical analysis, they offer a powerful approach to studying this complex phenomenon.
MEMS sensors can be strategically placed on or within rocks to measure parameters such as stress, strain, and vibration. These real-time measurements provide valuable data on the behavior of rocks under different conditions. Meanwhile, statistics comes into play by analyzing these data to identify patterns and trends.
In practical applications, this approach can be used in mining and construction industries to assess the stability of rock formations and plan safe operations. It can also aid in geologic research to better understand the processes that lead to rock fractures. By leveraging MEMS sensors and statistics, we can gain a deeper understanding of rock fracture and take proactive measures to ensure safety and stability.
The following conclusion can be obtained from the above rock testing and normal hypothesis testing analysis. First, the distribution status of normal vectors of the central profile on rock fracture surfaces has scale effects from the variable regularity of statistics and skewness coefficient. It indicates that the smaller the measurement scale, the more the distribution deviates from the normal distribution. Second, under the loading speed 0.01 mm and the same scale, there is obviously a difference in the directional angle statistics and skewness coefficient of specimens rotating 30° and not rotating 30° angles. Overall, it is more likely that the distribution of the direction angle of the specimen rotated by 30° is accepted as a normal distribution than that of the specimen without rotation, indicating that the 13-KN pressure applied before rotation caused some damage to the interior of the specimen. Finally, the differences in the above three loading rates in rock fracture surfaces morphology are not obvious. If conditions permit, larger loading rates can be used to analyze the differences in rock fracture surface morphology and identify its variation regularity.
Data availability statement
The original contributions presented in the study are included in the article/Supplementary Material; further inquiries can be directed to the corresponding author.
Author contributions
XP: data curation, funding acquisition, writing–original draft, writing–review and editing, and formal analysis. GD: investigation, software, and writing–review and editing.
Funding
The author(s) declare that financial support was received for the research, authorship, and/or publication of this article. This research was funded by “Funding for school-level research projects of Yancheng Institute of Technology,” project grant number “xjr2022041.” Fund Project: In 2023, the Research and Development Center for College Mathematics Teaching of the Ministry of Education approved the project “Research and Practice on the Reconstruction of Teaching Content and Innovation of Teaching Process for College Mathematics Courses Suitable for Online and Offline Integrated Teaching” (Project No. CMC20230304). The 2023 Jiangsu Province Higher Education Reform Project “New Empowerment of University Mathematics Curriculum Reform under Digital Expression”, with a focus on (Project No. 2023JSJG697).
Acknowledgments
The authors acknowledge the Mechanics Laboratory of Jiangsu University for providing experimental equipment and instruments.
Conflict of interest
The authors declare that the research was conducted in the absence of any commercial or financial relationships that could be construed as a potential conflict of interest.
Publisher’s note
All claims expressed in this article are solely those of the authors and do not necessarily represent those of their affiliated organizations, or those of the publisher, the editors, and the reviewers. Any product that may be evaluated in this article, or claim that may be made by its manufacturer, is not guaranteed or endorsed by the publisher.
References
1. Wang HH, Zou DK, Peng P, Yao GL, Ren JZ. A novel high-sensitivity MEMS pressure sensor for rock mass stress sensing. SENSORS (2022) 22(19):7593. doi:10.3390/s22197593
2. Karunasiri G, Alves F, Swan W. MEMS direction finding acoustic sensor. In: Proc. SPIE 10246, Smart Sensors, Actuators, and MEMS VIII; 8-11 May 2017; Barcelona, Spain, 10246 (2017). p. 102460I. doi:10.1117/12.2264952
3. Lee YC, Leeghim H, Lee CY. Micropatterning of metal-grid micro electro mechanical Systems (MEMS) sensor for crack detection using electrohydrodynamic printing system. J Nanoscience Nanotechnology (2020) 20(7):4385–9. doi:10.1166/jnn.2020.17601
4. He JH. Periodic solution of a micro-electromechanical system, Facta Universitatis. Ser Mech Eng (2024) 22(2):187–98. doi:10.22190/fume240603034h
5. He JH, He CH, Qian MY, Alsolami AA. Piezoelectric Biosensor based on ultrasensitive MEMS system. Sensors Actuators A: Phys (2024) 376:115664. doi:10.1016/j.sna.2024.115664
6. Mandelbrot BB, Ness JWV. Fractional Brownian motions, fractional noises and applications. SIAM Rev (1968) 10:422–37. doi:10.1137/1010093
7. Mandelbrot BB. The fractal geometry of nature. New York: Macmillan Press (1983). doi:10.2307/2981858
8. Mandelbrot BB, Passoja DE, Paulley AJ. Fractal character of fracture surfaces of metals. Nature (1984) 308:721–2. doi:10.1038/308721a0
9. Mandelbrot BB, Aizenman M. Fractals: form,chance, and dimension. Peking: Beijing World Publishing Corporation (1979). doi:10.1063/1.2995555
10. Kenneth F, Yang WG. Fractal geometry mathematical foundations and applications. 2nd ed. Beijing: Posts and Telecom Press (2007). doi:10.2307/3619861
11. He CH, Liu HW, Liu C. A fractal-based approach to the mechanical properties of recycled aggregate concretes, Facta Universitatis. Ser Mech Eng (2024) 22(2):329–42. doi:10.22190/fume240605035h
12. He CH, Liu C. Fractal dimensions of a porous concrete and its effect on the concrete’s strength. Facta Universitatis Ser Mech Eng (2023) 21(1):137–50. doi:10.22190/fume221215005h
13. Zhang YR, Anjum N, Tian D, Alsolami AA. Fast and accurate population forecasting with two-scale fractal population dynamics and its application to population economics. Fractals (2024) 32(5). doi:10.1142/S0218348X24500828
14. He JH, El-Dib YO. A tutorial introduction to the two-scale fractal calculus and its application to the fractal Zhiber-Shabat Oscillator. Fractals (2021) 29(08):2150268. doi:10.1142/s0218348x21502686
15. Mei Y, Tian XY, Gepreel K. Fractal space based dimensionless analysis of the surface settlement induced by the shield tunneling. Facta Universitatis Ser Mech Eng (2023) 21(4):737–49. doi:10.22190/fume230826048m
16. Xie H. Fractals in rock mechanics, A. Netherlands: Balkerma Publisher (1993). CNKI:SUN:KSYL.0.1995-01-017.
17. Xie HP, Sun HQ, Ju Y, Feng Z. Study on generation of rock fracture surfaces by using fractal interpolation. Int J Solid Struct (2001) 38(32-33):5765–87. doi:10.1016/S0020-7683(00)00390-5
18. Nasehnejad M, Nabiyouni G, Gholipour Shahraki M. Thin film growth by 3D multi-particle diffusion limited aggregation model: anomalous roughening and fractal analysis. Physica A: Stat Mech its Appl (2018) 493:135–47. doi:10.1016/j.physa.2017.09.099
19. Xie H, Wang J, Kwasniewski MA. Multifractal characterization of rock fracture surfaces. Int J Rock Mech Mining Sci (1999) 36:19–27. doi:10.1016/S0148-9062(98)00172-7
20. Zhou HW, Xie H. Anisotropic characterization of rock fracture surfaces subjected to profile analysis. Phys Lett A (2004) 325:355–62. doi:10.1016/j.physleta.2004.04.006
21. Belem T, Homand-Etienne F, Souley M. Quantitative parameters for rock joint surface roughness. Rock Mech Rock Eng (2000) 33(4):217–42. doi:10.1007/s006030070001
22. Rasouli V, Harrison JP. Assessment of rock fracture surface roughness using Riemannian statistics of linear profiles. Int J Rock Mech Mining Sci (2010) 47:940–8. doi:10.1016/j.ijrmms.2010.05.013
23. Rasouli V, Harrison JP. A comparison of linear profiling and an in-plane method for the analysis of rock surface geometry. Int J Rock Mech Mining Sci (2004) 3:133–8. doi:10.1016/j.ijrmms.2004.03.031
24. Borri-Brunetto M, Carpinteri A, Invernizzi S, Paggi M. Micro-slip of rough surfaces under cyclic tangential loading. In: P Wriggers, and U Nackenhorst, editors. Analysis and simulation of contact problems. Berlin-Heidelberg: Springer (2006). p. 333–40. doi:10.1007/3-540-31761-9_37
25. Soares F, Janela F, Pereira M, Seabra J, Freire MM. 3D lacunarity in multifractal analysis of breast tumor lesions in dynamic contrast-enhanced magnetic resonance imaging. IEEE Trans Image Process (2013) 22:4422–35. doi:10.1109/TIP.2013.2273669
26. Xie H, Wang J. Direct fractal measurement of fracture surfaces. Int J Sol structures (2000) 37:3073–84. doi:10.1016/S0020-7683(98)00141-3
27. Yadav RP, Dwivedi S, Mittal AK, Kumar M, Pandey AC. Fractal and multifractal analysis of LiF thin film surface. Appl Surf Sci (2012) 261:547–53. doi:10.1016/j.apsusc.2012.08.053
28. Feng ZG, Xie HP. On Stability of fractal interpolation. Fractals (1998) 6(3):269–73. doi:10.1142/S0218348X98000316
29. Kapoor GP, Chand AKB. Hidden variable bivariate fractal interpolation surfaces. Fractals (2003) 11(03):277–88. doi:10.1142/S0218348X03002129
30. Xie HP, Sun HQ. The theory of fractal interpolated surface and its applications. Appl Maths Mech (1998) 19:321–31. doi:10.1007/bf02457536
31. Liu XS. Probability and statistics. Chengdu: Sichuan University Press (2009). ISBN:978-7-5614-4207-4.
32. Wang XY, Li Z, Zhou BP. Mathematical modeling and experiment. Beijing: Science Press (2019). ISBN:9787030597458.
Keywords: micro-electromechanical system, physics-informed statistics, rock mechanics, rock fracture surface, kurtosis coefficient, normal distribution
Citation: Pan X and Dai G (2024) Harnessing MEMS sensors and statistics to unravel rock fracture. Front. Phys. 12:1497655. doi: 10.3389/fphy.2024.1497655
Received: 17 September 2024; Accepted: 17 October 2024;
Published: 30 October 2024.
Edited by:
Ji-Huan He, Soochow University, ChinaReviewed by:
Cesar Manchein, Santa Catarina State University, BrazilHaibin Li, Inner Mongolia University of Technology, China
Yun He, Inner Mongolia Agricultural University, China
Copyright © 2024 Pan and Dai. This is an open-access article distributed under the terms of the Creative Commons Attribution License (CC BY). The use, distribution or reproduction in other forums is permitted, provided the original author(s) and the copyright owner(s) are credited and that the original publication in this journal is cited, in accordance with accepted academic practice. No use, distribution or reproduction is permitted which does not comply with these terms.
*Correspondence: Guoxing Dai, MTAwMDAwODE5NkB1anMuZWR1LmNu
 Xuezai Pan
 Guoxing Dai2*