- 1College of Computer and Software Engineering, Huaiyin Institute of Technology, Huaian, China
- 2Laboratory for Internet of Things and Mobile Internet Technology of Jiangsu Province, Huaian, China
Introduction: In response to the challenges of small target size, slow detection speed, and large model parameters in PCB surface defect detection, LPCB-YOLO was designed. The goal was to ensure detection accuracy and comprehensiveness while significantly reducing model parameters and improving computational speed.
Method: First, the feature extraction networks consist of multiple CSPELAN modules for feature extraction of small target defects on PCBs. This allows for sufficient feature representation while greatly reducing the number of model parameters. Second, the C-SPPF module enables the fusion of high-level semantic expression with low-level feature layers to enhance global feature perception capability, improving the overall contextual expression of the backbone and thereby enhancing model performance. Finally, the C2f-GS module is designed to fuse high-level semantic features and low-level detail features to enhance the feature representation capability and model performance.
Results: The experimental results show that the LPCB-YOLO model reduces the model size by 24% compared to that of the YOLOv8 model while maintaining high precision and recall at 97.0%.
1 Introduction
In recent years, the field of computer vision has witnessed significant advancements in deep learning techniques and their extensive utilization [1, 2]. Deep learning has proven to be highly effective in image analysis within the medical domain. Notably, it has successfully been employed in tasks such as the automatic detection of knee joint synovial fluid [3] and the identification of human induced pluripotent stem cell-derived endothelial cells [4]. Similarly, in the realm of industrial automation, the detection of defects on workpiece surfaces using computer vision has emerged as a crucial research area that has garnered considerable attention. This technology significantly reduces manual labor costs and offers advantages such as stability, efficiency, and high accuracy compared to traditional manual detection methods. Due to the extremely limited size of tiny defects on PCBs (printed circuit board) and blurry pixel information, accurately and quickly identifying such defects poses a major challenge in industry [5]. To meet the real-time detection requirements of production lines while ensuring high accuracy and low computational costs, researchers have continuously explored and designed a series of efficient PCB defect detection algorithms.
[6] proposed the diagonal feature pyramid (DFP) [7] to enhance the accuracy of detecting tiny defects while reducing computational resource consumption. They designed a multiscale neck network and an adaptive localization loss function to optimize the detection performance. However, their model was large (69.3M), which increased the detection accuracy but also required substantial computational resources. Chen et al. [8] developed a Transformer-YOLO fusion network model. This algorithm uses an improved clustering algorithm to optimize anchor generation and adopts the Swin [9, 10] instead of convolutional neural networks to capture global dependencies. Moreover, it combines convolution and attention mechanisms [11] to adjust feature map channels to highlight key information. However, this algorithm, while improving accuracy, also has a large number of parameters. Liao et al. [12] proposed the YOLOv4-MN3 [13] algorithm for PCB defect detection. By specifically enhancing the core components of YOLOv4 (You Only Look Once) and training on a customized dataset, the researchers achieved specific optimizations in computational efficiency. However, there is still significant potential for parameter reduction and optimization in their approach, and further exploration is needed for deep optimization at the model architecture level.
Ling et al. [14] proposed an improved YOLOv8 model for identifying dense PCB components. By introducing the C2Focal module to enhance the backbone network, combining Ghost convolution to reduce computational costs, and employing the Sig-IoU loss function to improve bounding box regression, the model achieved a mean Average Precision (bUFQQDAuNQ==) of 87.7% in PCB component identification. Additionally, the model possesses real-time detection capabilities with a frame rate of 110 frames per second. Although the algorithm shows improvements in real-time performance, the decline in model performance is also noticeable. Joo et al. [15] proposed the SOIF-DN model to improve small object detection. By introducing the concept of centrality, the model enhances the accuracy of bounding box prediction and adopts an anchor-free approach to simplify the training process, thereby reducing computational costs. This model significantly improves the detection accuracy of small objects. However, it does not show a clear advantage in the task of detecting defects on PCB surfaces. Chen et al. [16] introduced the NHD-YOLO model, which optimizes YOLOv8 for product surface defect detection by incorporating a Selective Feature Pyramid Network (SFPN) and an Adaptive Decoupled Head (ADH). The improved model enhances feature transmission and classification-location alignment, making it particularly suitable for small object detection. However, the complex architecture increases both training and inference time.
The above studies either focused solely on improving accuracy leading to large model parameters or aimed at lightweight model designs resulting in performance degradation. Therefore, achieving high-precision detection while maintaining efficient inference speeds remains a pressing challenge. This article proposes a lightweight design based on the YOLOv8 model and introduces the Lightweight printed circuit board YOLO (LPCB-YOLO) model to enhance inference speed while maintaining model performance. The specific improvements are as follows:
1. The generalized efficient layer aggregation network (GELAN) architecture [17] with the CSPELAN (Cross Stage Partial Networks Generalized Efficient Layer Aggregation Network) module consisting of many cross-stage partial (CSP) modules [18, 19] reconstructs the feature extraction network to make a lightweight design. This module utilizes CSP’s ability to reduce redundant computations and efficient semantic feature utilization to reduce the model size of the backbone network while obtaining sufficient primary semantic information.
2. The contextual spatial pyramid pooling-faster (C-SPPF) module was designed. The module is designed to integrate rich contextual information captured by dynamic context matrix into the spatial pyramid pooling-faster (SPPF) [20] process. This integration guides and optimizes the learning process of the dynamic attention matrix, aiming to strengthen the ability of the backbone network to express and perceive global features. This enhancement significantly improves the feature extraction efficiency of the backbone network on input data, providing more precise and comprehensive feature representations for subsequent deep learning tasks.
3. The CSP layer with two convolutions (C2f) module is improved using ghost convolution [21] and self-similarity weights [22], creating the C2f-GS module. Ghost convolution’s resource efficient design approach helps maintain model performance while significantly reducing computational resource consumption and the number of model parameters, thereby reducing the number of parameters of the module. Additionally, self-similarity attention weights enhances the model’s focus on key regions by leveraging the correlation between neighboring pixels. These improvements enable the C2f module to achieve lightweight design while better integrating high-level semantic features, thereby assisting the model in better localization and classification tasks.
2 Algorithm description
2.1 YOLOv8 algorithm
YOLOv8 is a state-of-the-art (SOTA) model that builds on the historical versions of the YOLO series and introduces new features and improvement points to further enhance performance and flexibility, making it the best choice for tasks such as target detection, image segmentation, and pose estimation.
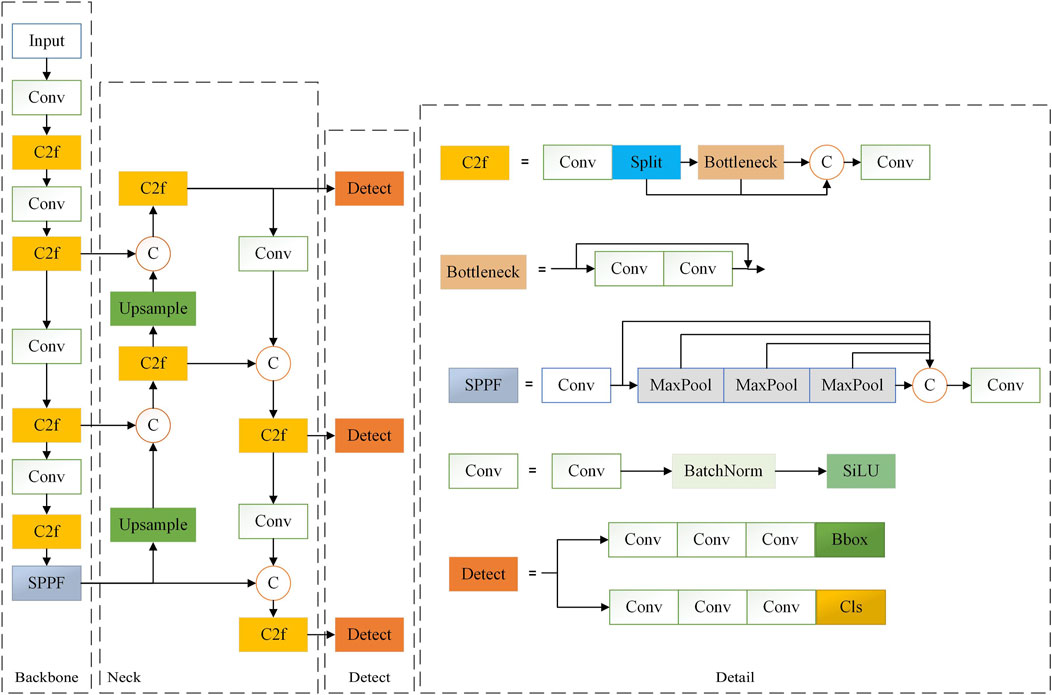
In the preprocessing stage, adaptive image scaling is utilized to resize input images, while mosaic data augmentation enhances the robustness of the model. The backbone network incorporates several key components: the CBS module, C2f module, and SPPF module. The CBS module stabilizes the model, accelerates convergence, and mitigates issues related to gradient vanishing. The C2f module includes skip connections and split operations, which improve gradient flow and information propagation. The SPPF module combines features through pooling and convolution, effectively integrating multi-scale feature information to enhance feature extraction. The neck utilizes the PAN [23] and FPN [24] structures to process features from the backbone network. These mechanisms enable comprehensive feature integration through cross-layer connections in both upward and downward pathways. For the head, a decoupled structure separates the detection and classification tasks, with positive and negative samples determined using scores weighted by classification and regression metrics. This approach significantly enhances detection accuracy. YOLOv8 significantly improves the detection of small targets and fine defects. This is especially important for the detection of defects on PCB surfaces.The structure diagram of the YOLOv8 model is shown in Figure 1.
2.2 Improved model
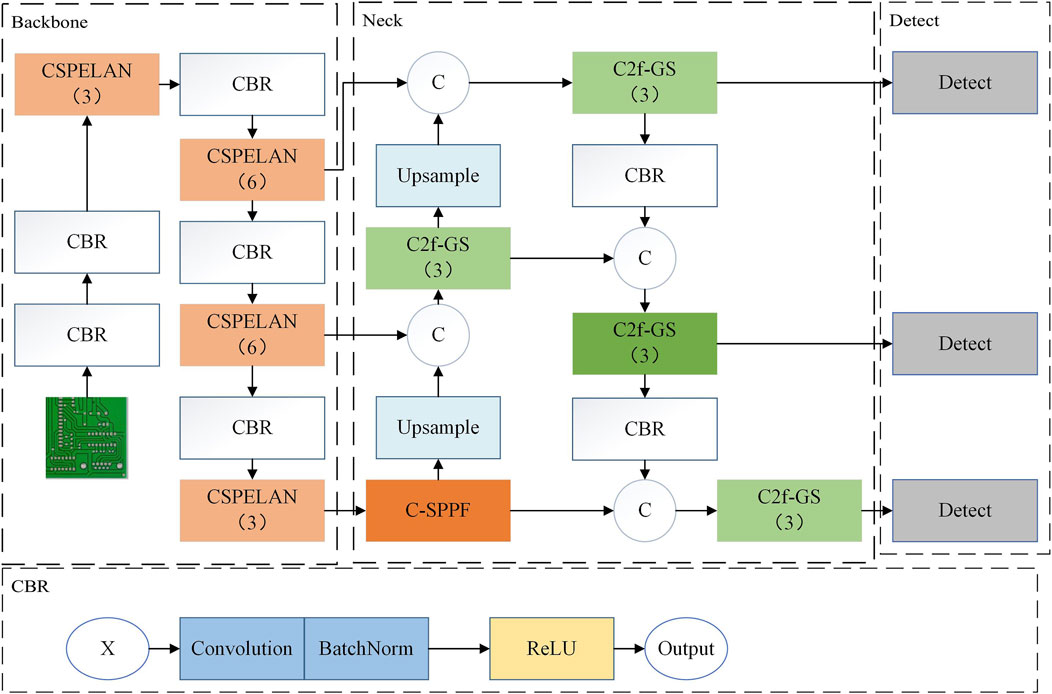
To address the issues of large model parameters and high computational resource consumption encountered during defect detection with the original model, this paper refines and improves the network structure to enhance algorithm processing speed and reduce computational costs. The overall network architecture of the LPCB-YOLO is illustrated in Figure 2.
First, to address the issue of large model parameters in the feature extraction part of YOLOv8, this paper introduces CSPELAN in the backbone section. By leveraging the ability of the GELAN to be insensitive to depth (where parameters, computations, and accuracy maintain a linear relationship) and to be lightweight, sufficient primary semantic information can be ensured while adhering to the goal of lightweight design. The specific design ideas and details of the backbone are detailed in Figure 2. Next, the dynamic context semantics is employed to enhance global context information using local features, assisting C-SPPF in extracting higher-level semantic features.
Simultaneously, it captures fine-grained details and coarse-grained contextual information in the image, aiding in improving the model’s ability to predict defect locations, sizes, and categories, thereby enhancing comprehensive defect detection. Finally, to reduce the computational cost, ghost convolution is used to reconstruct the C2f module to take advantage of its high resource utilization, and local self-similarity is used to enhance the feature focusing capability. This allows the C2f-GS module to focus more on salient features relevant to the target, assisting the algorithm in better attending to target areas and thereby improving defect detection accuracy.
2.3 Improved backbone
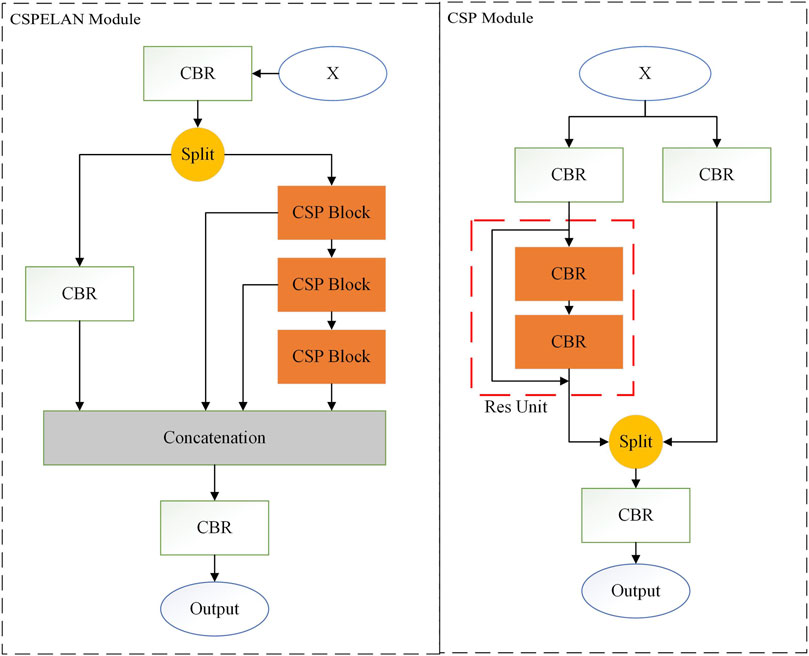
The backbone network is a core component in deep learning models used to extract image features, aiming to find more global and abstract primary semantic information in image data. In the YOLOv8 algorithm, the backbone network centers around the C2f module and is designed following the construction approach of CSPDarkNet, which balances model performance, efficiency, and flexibility but overlooks parameter and computational requirements. Therefore, this paper reconstructs the backbone network using the CSPELAN module as a key building element to address these issues. The specific details of the module are illustrated in Figure 3.
The ELAN module enhances the backbone network by controlling the shortest and longest gradient paths, allowing it to learn more comprehensive primary semantic information. By employing dense residual structures, the algorithm can delve deeper to extract more detailed feature representations, providing the model with greater optimization potential. GELAN extends and enhances ELAN by redesigning the internal structure to smooth internal gradients and expending ELAN [25,26] to be embeddable in any module, thereby increasing its flexibility and offering more design choices for the backbone. This paper aims to design a lightweight, high-precision PCB defect detection model. Considering parameter and computational constraints, this study combines the CPS module with the GELAN structure to achieve lightweight feature extraction in the network.
This study aims to develop a lightweight, high-precision, comprehensive PCB defect detection model. Considering the critical importance of controlling model parameters and computational complexity for model performance and practical application [27], this paper integrates the CSP module into the GELAN structure. This integration aims to leverage the advantages of the CSP module in reducing computational redundancy and enhancing feature utilization, along with the strengths of the GELAN structure in capturing subtle defect features using local attention mechanisms [28, 29]. This approach ensures that the model combines compact size with efficient operational characteristics while accurately identifying surface defects on PCBs.
2.3.1 Improvement of the SPPF module
Spatial pyramid pooling (SPP) effectively avoids image distortion caused by image region cropping and scaling operations through multi-scale spatial pooling, thus avoiding the impact on the final detection results. The SPPF module is a variant of SPP that replaces multiple image scaling and forward propagation steps with pooling operations, significantly reducing computational complexity and time overhead. During this process, SPPF seamlessly integrates local detail feature representations with global context information, enhancing the model’s ability to precisely predict target locations, sizes, and categories.
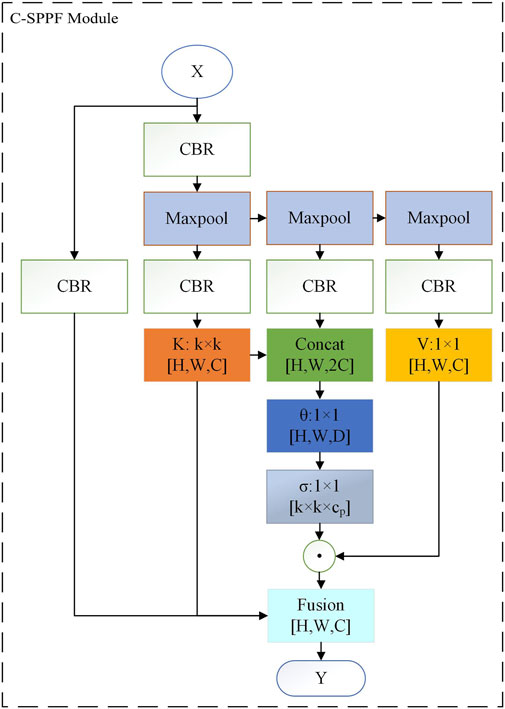
Both convolution and pooling operations have fixed-size receptive fields, meaning that they can only capture information from local regions matching the filter size. This limitation in the understanding of the global context of the SPPF module may restrict the model’s expressive power. Although this limitation can be addressed by increasing network depth or enlarging filter sizes to expand the receptive field, it does not fully solve the problem of global context understanding and can introduce additional computational overhead. To address this, the study uses dynamic context matrix, the core idea of the Contextual Transformer (CoT) module, to enhance the global context understanding capability of the SPPF module and improve its ability to represent global features, resulting in the C-SPPF module. The detailed architecture of this module is illustrated in Figure 4.
The dynamic context matrix is mainly derived from contextual transformer [30]. The contextual transformer integrates contextual mining between keys and self-attention learning on 2D feature maps within a single architecture, avoiding the need for additional contextual mining branches, and obtaining both global and local dynamic feature representations to form a dynamic and comprehensive feature representation. The contextual transformer utilizes a
By concatenating the encoded Key with the Query and applying two consecutive
Given an input
Based on the obtained context attention matrix
Despite the incorporation of supplementary context processing mechanisms, the efficient parallel computing properties inherent in the transformer architecture persist. This feature enables the module to maintain contextual sensitivity without markedly increasing computational complexity or compromising training velocity, facilitating expeditious training and inference.
The C-SPPF module organically integrates the dynamic context matrix with the SPPF module. Leveraging the strengths of the transformer structure in capturing contextual information between input keys and dynamic attention learning, as well as the SPPF module’s proficiency in extracting multi-scale features, it not only compensates for the deficiency of the SPPF module in global context perception but also promotes the fusion of local fine-grained features with global coarse-grained semantic representations. Consequently, this approach enhances the accuracy and comprehensiveness of the model in predicting the position, size, and category of defects.
2.4 Improving the C2f module
The C2f module draws inspiration from the C3 module, which divides the feature maps into two parts along the channel dimension. This design approach aids in enhancing the model’s nonlinear representation capability, thereby facilitating better handling of complex image features while ensuring reduced parameters and acquiring richer gradient flow information. One branch of the C2f module comprises multiple bottleneck blocks, each consisting of two convolutional layers. These layers transform the input feature maps to extract higher-level feature representations. The other branch solely utilizes convolutional layers to extract semantic information of higher granularity, rendering the semantic information of this branch relatively coarse and unable to focus on more meaningful feature representations.
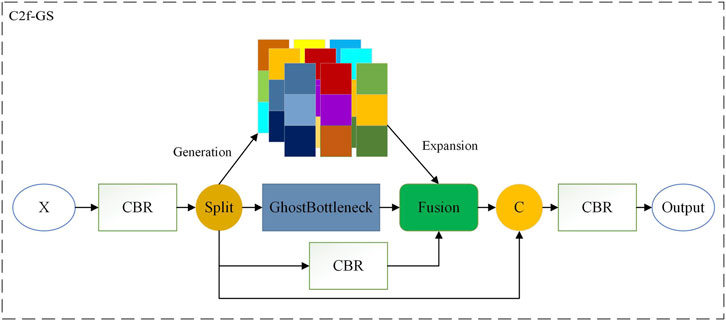
To balance the acquisition of high-level semantic information between the two branches, mitigate the risk of overfitting, and further alleviate the computational burden, this study introduces a novel C2f-GS module by redesigning the C2f module using SimAM and ghost convolution. The C2f-GS module employs only one bottleneck structure to extract features from one branch. Additionally, to reduce the number of parameters, the ordinary convolution in the bottleneck module is replaced with ghost convolution, which offers higher computational efficiency and fewer parameters. The other branch introduces self-similarity weights, which incurs relatively lower computational costs, to focus on higher-level feature representations from the feature matrix. The specific structure of C2f-GS is depicted in Figure 5.
The self-similarity weights are inspired by the Simple Attention Module (SimAM). SimAM computes an attention weight independently at each feature map location and then multiplies this weight with the original feature values to enhance or suppress certain features. It allows the model to pay more attention to significant local features, thus improving its overall performance. In this paper, we also use the self-similarity of features to compute the attention weights but multiply them with the Bottleneck branch and the residual branch to achieve the effect of focusing on high-level semantic features.
The ghost convolution module initially employs a small number of convolutional kernels to extract features from the input feature map. Subsequently, it further applies grouped convolution to this subset of feature maps. Finally, the identity transformation part is concatenated with the grouped convolution part to form the final feature map.
Assuming the input feature map is
Therefore, theoretically, ghost convolution reduces the computation time, inference time, and parameter count by a factor of
C2f-GS leverages the ghost convolution and self-similarity to redesign the C2f module, as depicted in Figure 5. On the one hand, it employs ghost convolution and SimAM to alleviate the computational burden of the module, achieving a lightweight design. On the other hand, it utilizes the outstanding feature-focusing capability of SimAM to precisely allocate attention based on the similarity between features, highlighting critical features for the task. In C2f-GS, self-similarity attention weights and GhostBottleneck are employed in different branches to enhance both branches’ local information extraction capability, thereby improving the model’s ability to locate and recognize targets. For small targets such as PCB defects, increased and higher-level local semantic expressions significantly enhance the detection accuracy.
3 Experiment
3.1 Data analysis
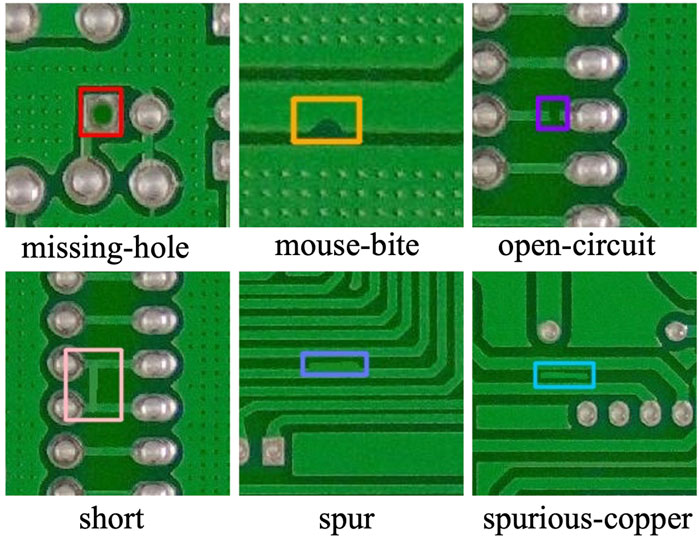
The Human-Computer Interaction Open Lab at Peking University has released a PCB defect dataset named PKU-Market-PCB, which was designed for object detection and classification tasks. The dataset aims to provide researchers and engineers in relevant fields with rich materials to promote the development of PCB defect detection technology. This dataset encompasses six typical defect categories, detailed as follows:
1. Missing hole: The described defect refers to the phenomenon where the positions intended for holes on the circuit board are left empty due to process errors or design flaws during manufacturing. Such defects may result in electrical discontinuity or difficulties in installation and fixation.
2. Mouse bite: The described defect pertains to circular or semicircular indentations and cracks that occur near the through-holes or solder pad edges of the circuit board due to mechanical stress, tool wear, or other factors during the manufacturing process. This minor damage may result in decreased solder joint reliability or abnormal signal transmission.
3. Open circuit: The described defect involves interruptions in conductive pathways due to factors such as loose connections, wire breakage, or poor soldering. These issues disrupt the expected flow of current, directly impacting the normal operation of the circuit.
4. Short: The described defect involves unintended electrical connections formed between circuit nodes that were not intended to be connected. This deviation from the intended current path may lead to short circuits, functional disruptions, and even safety hazards in devices.
5. Spur: The described defect refers to protrusions or raised portions formed on the surface of the circuit board due to material defects or processing issues. These protrusions, which should not exist, may interfere with component installation, affect the flatness of the circuit board, or even cause short circuits.
6. Spurious copper: The described defect arises from unintended copper impurity deposition during the manufacturing process due to errors in operation, chemical reactions, or environmental pollution. This includes unplanned copper conductive layer formation. These foreign substances may lead to abnormal circuit functionality or deteriorated electrical performance.
The PKU-Market-PCB dataset comprises a total of 1386 high-resolution images, each of which are meticulously annotated to precisely identify the specific locations and categories of the six aforementioned defects. To further enrich the diversity and practicality of model training, the original images underwent meticulous processing. They were cropped into
In Figure 6, the six categories of small target defects exhibit extremely high morphological similarity between certain defects. This similarity is so pronounced that even through visual observation, confusion easily arises, exacerbating the challenge of identification. Specifically, “mouse bite” and “spur” defects demonstrate significant similarities in edge details, making it difficult to clearly distinguish between subtle differences in their features. Similarly, the “open-circuit” and “short” defects exhibit high consistency in overall shape construction, further complicating defect recognition. Given this, the high similarity among these small target defect types poses a severe challenge to the accuracy and comprehensiveness of defect recognition by the model. These two characteristics are the key evaluation criteria for assessing the effectiveness of detection systems in industrial production processes.
This paper carefully analyzes the dataset to adjust the hyper-parameters and thus achieve better modeling results. Figure 7A shows that the samples are relatively evenly distributed there is no category imbalance. Figure 7C shows that the distribution of target locations is relatively uniform. The real targets in the sample are typically dominated by small targets (as shown in Figures 7B,D). These small targets make up a very small proportion of the image and are not only limited in expressing their own features, but also susceptible to interference from other irrelevant information in the background. This situation undoubtedly increases the difficulty of the algorithm in terms of classification and accurate localization. On one hand, small targets may be challenging to recognize correctly due to their inconspicuous features. On the other hand, the complex background environment may introduce noise, which interferes with the algorithm’s accurate judgment and localization of the target, thereby further reducing the performance of detection and classification.
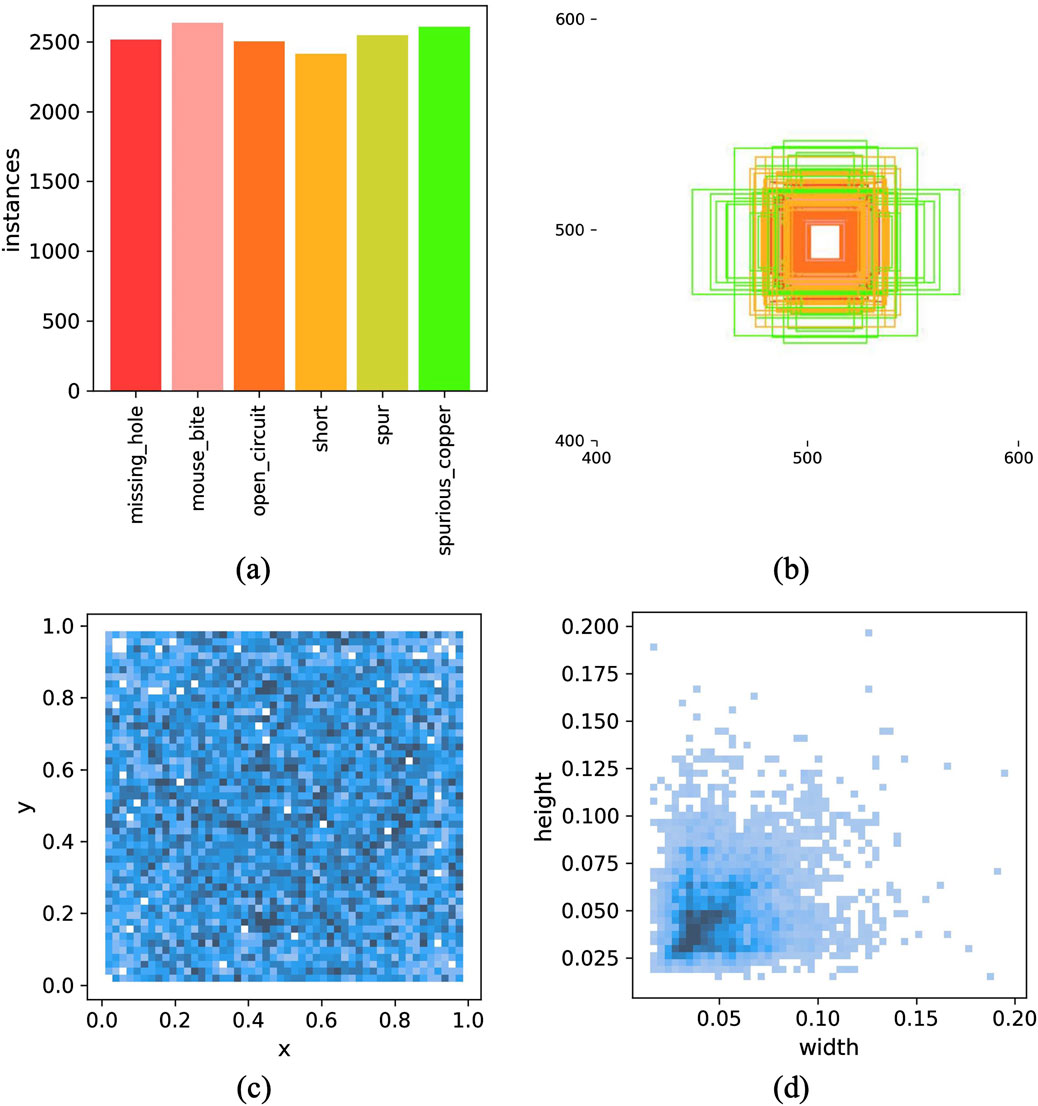
Figure 7. Distribution of dataset labels; (A) Statistical plot of the amount of data for the 6 types of defects. (B) Distribution plot of the target detection frame size. (C) Distribution plot of the position of the target detection frame relative to the whole figure. (D) Scale distribution graph of the target frame relative to the whole diagram.
Based on the analysis above, which reveals that the defect image distribution is uniform but that there is a potential need for enhancement, the following strategies were implemented:
1. Random rotation was applied to 30% of the images to cover different perspectives of the defects.
2. MaxUp augmentation was applied to 30% of the images to reinforce the model’s ability to learn complex and easily misjudged samples.
3. Considering the phenomenon of edge aggregation of detection boxes, translation augmentation was performed with a probability of 35% to eliminate position bias.
4. Due to the small and concentrated size of the cropped images, 35% of the images were enlarged to enrich the model’s understanding of defects at different scales.
These targeted data augmentation techniques aim to increase data diversity, prevent overfitting, and enhance the accuracy and stability of defect recognition in various practical scenarios.
3.2 Model training
This study utilized a combined approach of Grid Search and Bayesian Optimization for the purpose of hyperparameter tuning. The focus was on key parameters such as initial learning rate, weight decay, and data augmentation strategies. The hyperparameter space was defined by considering other models and prior knowledge in order to efficiently search for optimal combinations of parameters. To ensure consistency in batch size across algorithms, the batch size was set to utilize approximately 50% of memory during training, with YOLOv8 serving as a reference. Additionally, a Cosine Annealing Schedule was implemented to adjust the learning rate, thereby promoting smoother training and preventing overfitting.
In terms of data augmentation, a staged dynamic strategy was employed. Basic augmentations were applied during the early training phase to enhance data diversity, while more complex augmentations were gradually reduced in later stages to allow the model to focus on critical features. These strategies had a significant positive impact on the model’s convergence, robustness, and ability to adapt to complex detection scenarios.
Specifically speaking, the experiment utilized an NVIDIA RTX 4090 graphics card equipped with 24 GB of memory and powerful single-precision (82.58 TFLOPS) and half-precision (165.2 Tensor TFLOPS) computing capabilities, providing a solid hardware foundation for deep learning tasks. In terms of training configuration, the learning rate was initialized to 0.001 to ensure that the model could sensitively capture complex data features in the early stages of training. The batch size was set to 256 to balance computational efficiency and model convergence speed, effectively utilizing GPU parallel computing while preventing excessive smoothing of gradient information. The AdamW optimizer was chosen, leveraging gradient smoothing to optimize the process and accelerate convergence while using weight decay to mitigate overfitting and enhance model generalization capabilities.
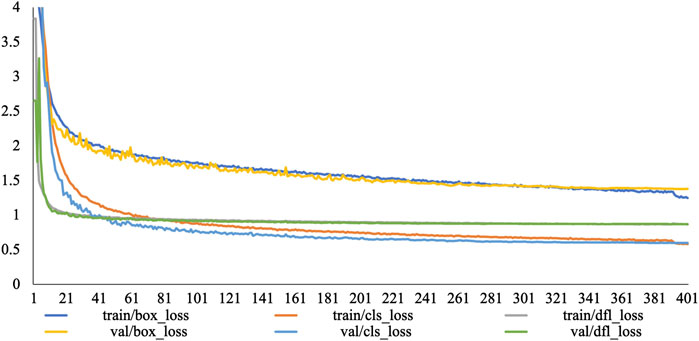
During the training process, the model underwent 400 iterations. The learning rate followed a predetermined strategy, increasing to 0.01, aimed at refining the model’s depiction of data details in the later stages to enhance performance, as shown in Figure 8. Here, “box_loss” represents the bounding box regression loss, “cls_loss” represents the classification loss, and “dfl_loss” [32] represents the focal loss, which is used to quickly focus the network on values near the labels, maximizing the probability density at the labels. After each iteration, the model underwent a performance evaluation using the current weights, and the best weights were continuously recorded and updated to ensure optimization along the optimal training trajectory. To enhance the model’s robustness and generalizability, all data augmentation operations were abandoned in the final 15 epochs of training. This encouraged the model to focus on a deep understanding of the intrinsic features of the original dataset, reducing its reliance on specific augmentation techniques and thereby enhancing model robustness. To avoid experimental randomness, multiple random seeds (0, 42, 10328) were selected, and each random seed underwent three experiments to avoid randomness. The experimental results were averaged over 9 experiments.
From Figure 8, it can be observed that when the number of epochs reaches approximately 300, the LPCB-YOLO model converges, and the losses tend to stabilize. Due to the small number of classes, the “cls_loss” converges more rapidly, stabilizing at approximately 170 epochs. Overall, all loss values remain stable without significant fluctuations, indicating that the model steadily learns useful feature representations from the dataset, gradually converges to the optimal solution during the training process, and thus acquires better generalizability. The stable convergence of the model eliminates the need for frequent parameter adjustments and retraining, significantly reducing computational resources and time costs.
3.3 Module ablation experiment
Module ablation experiments, as crucial experimental techniques, play an important role in machine learning and deep learning research. They involve systematically dissecting and analyzing a completed and functionally sound model or algorithm to delve deeper into the impact and interdependencies of individual modules on overall performance. To validate the effectiveness and importance of each improvement module and their impact on the PCB defect detection task, this paper conducted experiments, as shown in Table 1. The data for each item were controlled within a 0.6% error margin through multiple experiments.
In Table 1, the performance changes after three significant improvements were made to the baseline model are clearly displayed. After replacing the backbone network of the YOLOv8 model with the CSPELAN module, the F1 score decreased from 0.98 to 0.94. This module did not demonstrate effective performance improvement, but it significantly reduced the number of parameters in the backbone network. With the addition of the C-SPPF module to the backbone network, the precision and recall increased to 97.2% and 97.4%, respectively, and the mAP improved to 96.7%. The combination of C-SPPF with the new backbone network significantly enhanced the model’s performance. Finally, the C2f-GS module was added on top of the existing new backbone network and the C-SPPF module. Although the precision slightly decreased, the C2f-GS module improved the recall and mAP, bringing the model closer to the performance of the baseline YOLOv8. Therefore, C2f-GS has a positive impact on the overall performance of the LPCB-YOLO. Most importantly, recall remains at a high level, enabling the model to detect more comprehensive target information in PCB defect detection tasks and better adapt to industrial production.
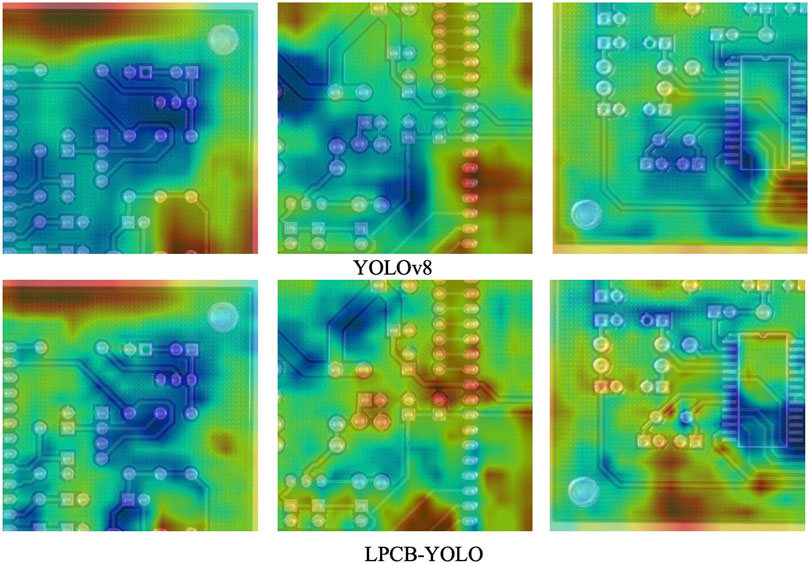
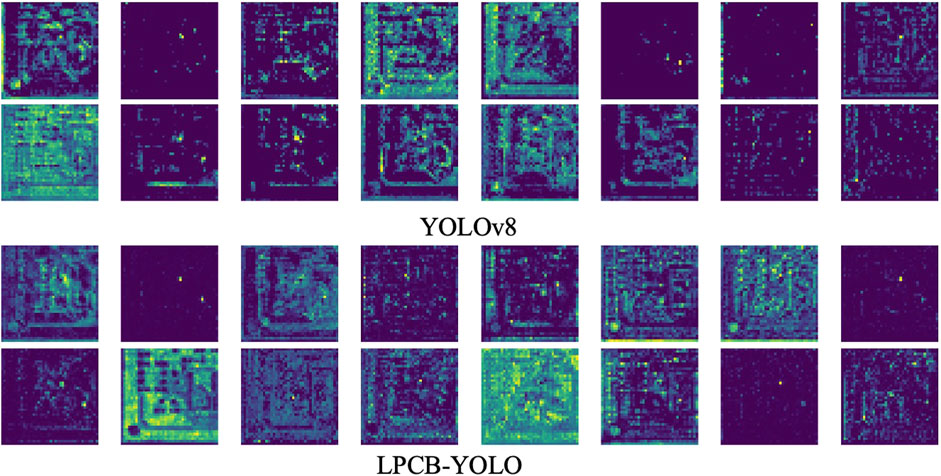
This paper improved the feature extraction network of the YOLOv8 model using the CSPELAN module and C-SPPF module, achieving a lightweight model design. To provide a clearer comparison of the feature extraction capabilities of the two backbone networks, this paper utilized Grad CAM [33] to generate heatmaps, visually demonstrating the differences in attention areas of the backbone networks for input images, as shown in Figure 9. After lightweighting by the CSPELAN module and enhancing global semantic attention by the C-SPPF module, the feature extraction network of LPCB-YOLO achieved a level of primary semantic acquisition capability close to that of the YOLOv8 backbone network. Although the attention levels of the two backbones may vary in certain areas, their focus areas are generally consistent. This allows both backbone networks to provide rich and comprehensive semantic representations for their respective models, laying a solid foundation for subsequent models to obtain higher-level semantic representations. Therefore, the new backbone constructed in this paper achieves the original design intent of lightweighting the model, improving network computational speed, and ensuring feature extraction.
From the perspective of lightweight modules, this paper designed and implemented the C2f-GS module based on the C2f module to enhance the feature fusion and feature focusing capabilities of the network’s Neck section. As shown in Figure 10, the C2f-GS module demonstrates stronger feature extraction capabilities. On the one hand, compared to the C2f module, the C2f-GS module can extract and utilize semantic information more delicately and comprehensively, enabling rapid classification and localization in PCB defect detection tasks. On the other hand, the features extracted by the C2f-GS module are more focused and contain more useful information, thereby further improving the overall performance of the LPCB-YOLO model.
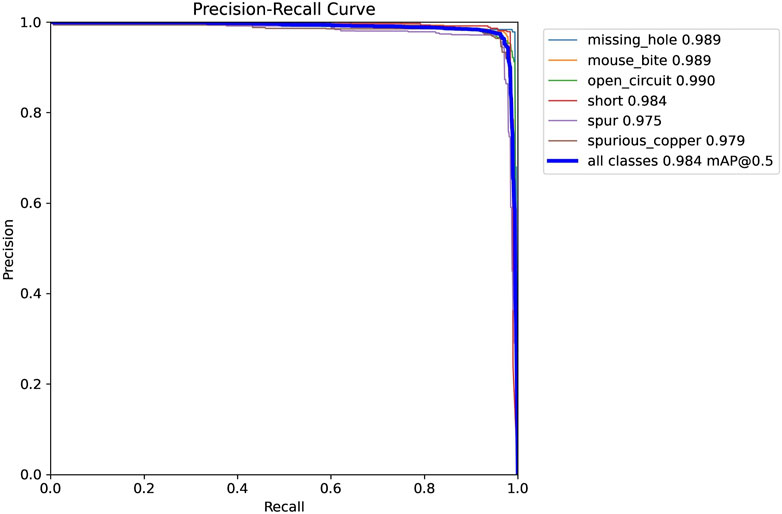
The precision-recall (PR) curve visualizes the relationship between precision and recall at different thresholds, providing a detailed assessment of the model’s overall performance. As shown in Figure 11, the LPCB-YOLO model maintains high precision while also maintaining a high recall rate. Therefore, the LPCB-YOLO model exhibits excellent performance and is capable of performing well in industrial PCB defect detection tasks, fully meeting the requirements of practical applications.
The paper achieves a significant reduction in model parameters and computational complexity by lightweighting and enhancing the backbone of the YOLOv8 model while preserving feature extraction capabilities. Additionally, it improves the feature fusion capability of the C2f module and appropriately reduces the model’s parameter count. These three improvements lead to a substantial reduction in model parameters and computational load, ensuring both detection performance and enhanced operational efficiency and deployment feasibility.
3.4 Performance comparison of mainstream algorithms
To validate the effectiveness and superiority of the LPCB-YOLO algorithm, this paper systematically compares a group of representative deep learning object detection algorithms (As shown in Table 2). Not only does it cover algorithms such as YOLOv8, YOLOv5 [34], YOLOv6 [35], YOLOv9 [36], and YOLOv10. Furthermore, in-depth analysis and objective evaluation of the performance of the LPCB-YOLO algorithm across various key performance indicators are conducted.
Comparative analysis of the performance of several algorithms with LPCB-YOLO shows that in Table, the number of parameters of LPCB-YOLO is only 8.5M, which is 47.9% less than the 16.3M of YOLOv5s, and 24.1% less than that of YOLOv8s, and it is one of the lesser among all the models. Meanwhile, the GFLOPs of LPCB-YOLO is 21.9, further emphasizing its lightweight design with minimal computational requirements. In addition, its memory usage is 272MB, second only to YOLOv10s′ 257MB, which is smaller than most algorithms, and its FPS reaches 208, which is slightly lower than the latest algorithms. Despite a marginally lower precision of 97.0%, the recall is 98.0%, tied with YOLOv8s for the highest. In terms of speed, LPCB-YOLO still falls slightly short of the YOLOv9s and YOLOv10 algorithms, but the YOLOv9s model is over-parameterized and similar to the YOLOv6s; the YOLOv10 model again falls a little short of the YOLOv10 model in terms of recall, which is 1.5% lower, and this highly impacts on the comprehensiveness of the detection of defects on the PCB surface.
The main advantages of LPCB-YOLO lie in its high recall rate, lightweight design, and fast processing speed, making it suitable for applications requiring efficient and rapid processing. To further enhance its performance, optimizing network architecture and hyper-parameters can better balance model depth and algorithm parameters and integration with hardware acceleration techniques can also achieve higher performance.
3.5 Algorithm robustness and generalization analysis
3.5.1 Robustness analysis
When evaluating and ensuring model performance, robustness is a critical factor. It refers to the model’s ability to maintain stable and accurate predictions when faced with abnormal inputs, extreme conditions, data biases, or environmental changes. This aspect is crucial not only for the reliability and generalization ability of the model in practical applications but also for distinguishing between robust and fragile models. Therefore, devising a rigorous and comprehensive testing scheme to improve the model’s robustness is an indispensable component of the model development and optimization strategy.
To validate the robustness of the algorithm, a test set comprising 1000 images has been prepared. Six sample images are shown in Figure 12. This set includes images captured under three specific conditions—Defocus, Underexposure, and Reflection—and three categories of synthesized PCB images. Defocus, Underexposure, and Reflection are common challenges encountered in real-world image acquisition. These issues typically arise due to prolonged instability of the light source or equipment vibrations, which can cause shifts in camera focus and angle.
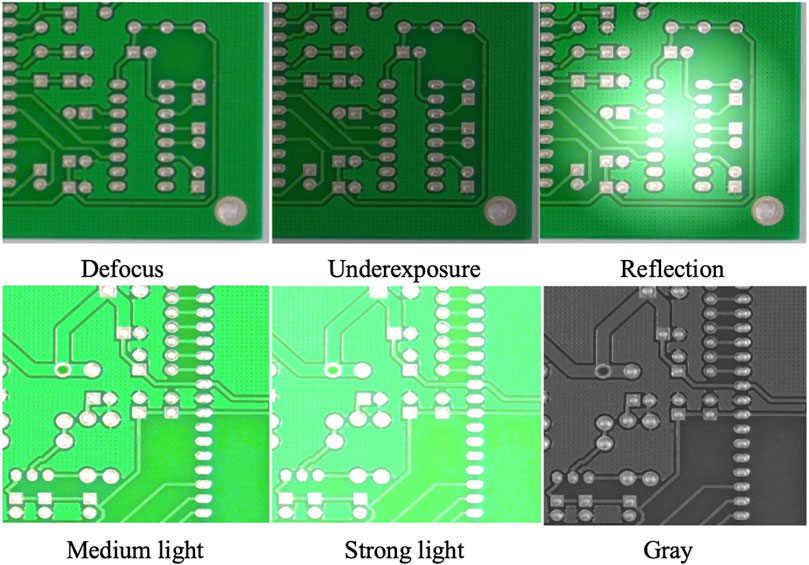
Figure 12. The test dataset includes 6 categories of image presentations. Defocus, Underexposure, and Reflection are actual captures; Medium light, High light, and Gray are composites.
Additionally, the test set includes three types of synthesized images—Medium light, High light, and Gray—designed to simulate diverse lighting conditions and background environments. Medium light images are generated by applying a linear offset of 50 to the original pixel values, while High light images use an offset of 100. Gray images, on the other hand, are designed to assess the impact of varying background colors on detection accuracy. This comprehensive test set ensures better representation of diverse scenarios encountered in real production environments.
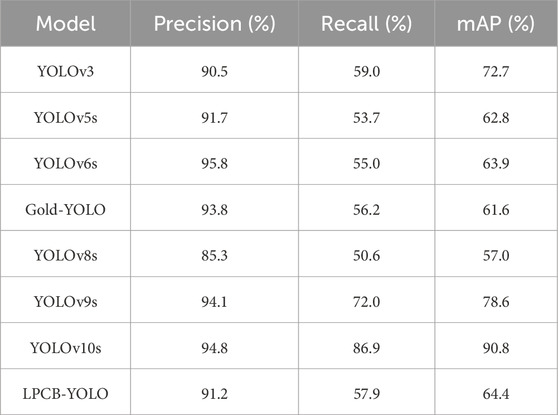
As depicted in Table 3, LPCB-YOLO exhibits a commendable balance of performance in terms of accuracy, mAP, and recall. With a precision rate of 91.2%, it performs admirably in scenarios involving intricate lighting variations and reflection scenes, effectively reducing false detections to a significant extent. Notably, it outperforms YOLOv3 (90.3%) and YOLOv8s (85.3%) in this regard. However, despite its high precision, LPCB-YOLO achieves a mAP of only 64.4%, which falls slightly short when compared to YOLOv10s (90.8%) and YOLOv9s (78.6%). This suggests that there is still room for improvement in terms of achieving a better balance between precision and recall.
In terms of recall, LPCB-YOLO achieves a rate of 57.9%, which is inferior to that of,YOLOv10s (86.9%) and YOLOv9s (72.0%) [37], but superior to that of Gold-YOLO (56.2%),YOLOv5s (53.7%) and YOLOv8s (50.6%). This indicates that LPCB-YOLO maintains better robustness in optimizing complex backgrounds (e.g., gray backgrounds), making it more adaptable and capable of effectively handling dynamic production environments.
LPCB-YOLO exhibits high accuracy and environmental adaptability, rendering it particularly suitable for deployment in settings characterized by unstable lighting conditions and complex backgrounds. However, while it excels in specific tasks, its mAP and recall rate still have potential for improvement when compared to top-performing models such as YOLOv10s and YOLOv9s. Additionally, it may not perform as well as other models in applications that demand extremely low leakage detection rates. Thus, LPCB-YOLO effectively balances performance and environmental adaptability, making it well-suited for coping with complex and variable production environments. However, there is still scope for enhancement in tasks that require very high accuracy.
In order to further enhance the adaptability of the algorithm in complex scenes, the following measures can be implemented: utilizing data augmentation to improve the resilience of the model, particularly by increasing the number of training samples for focus shift, underexposure, reflection enhancement, and other scene variations, to further explore the potential of LPCB-YOLO in specialized environments. Additionally, dynamic parameter tuning can be employed to adjust the detection threshold in real-time and dynamically optimize the model for changes in light intensity (such as highlights or a grey background), thereby enhancing the model’s performance under different lighting conditions. Furthermore, an integration approach can be adopted as another strategy to improve performance by combining LPCB-YOLO with other high-recall models (such as YOLOv10s) to form an integrated detection framework, which can ensure high precision and address the issue of leakage detection.
In conclusion, LPCB-YOLO, with its high precision and optimized design for complex backgrounds, is a reliable performer among the mainstream models, and is particularly suitable for real production environments that encounter variations in lighting and complex backgrounds. Although its recall and mAP may be slightly lower than those of the top models, LPCB-YOLO demonstrates excellent resilience and adaptability in changing light and background environments, making it a worthwhile subject for exploration and optimization in practical applications.
3.5.2 Generalization analysis
In order to verify the generalization of the LPCB-YOLO network for detecting PCB surface defects, the DeepPCB [38] dataset was also selected for testing in this paper. All images in this dataset were obtained from a linear-scan CCD (Charge-coupled Device) with a resolution of about 48 pixels per 1 mm. The original size of the template and test images was approximately
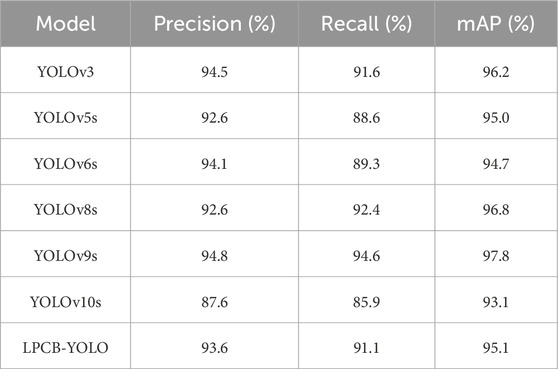
Similarly, to demonstrate the generalization performance of the improved algorithm in detecting small-sized objects, this study compares the LPCB-YOLO algorithm with YOLOv3, YOLOv6, YOLOv5, YOLOv8, YOLOv9, and YOLOv10. The comparison results are shown in Table 4.
Based on the experimental data presented in Table 4, LPCB-YOLO demonstrates a favorable trade-off between recall (91.1%) and precision (93.6%) when applied to various datasets, indicating a relatively low miss rate. Furthermore, its mAP of 95.1% remains consistent, comparable to YOLOv5s and YOLOv6s, thereby showcasing its strong overall detection capability. However, it should be noted that its generalization ability is slightly inferior to that of YOLOv9s and YOLOv3. As a lightweight model, LPCB-YOLO effectively balances detection performance and resource requirements, making it particularly suitable for deployment in resource-constrained industrial environments and scenarios that demand real-time processing and computational efficiency.
3.6 Comparison of experimental results
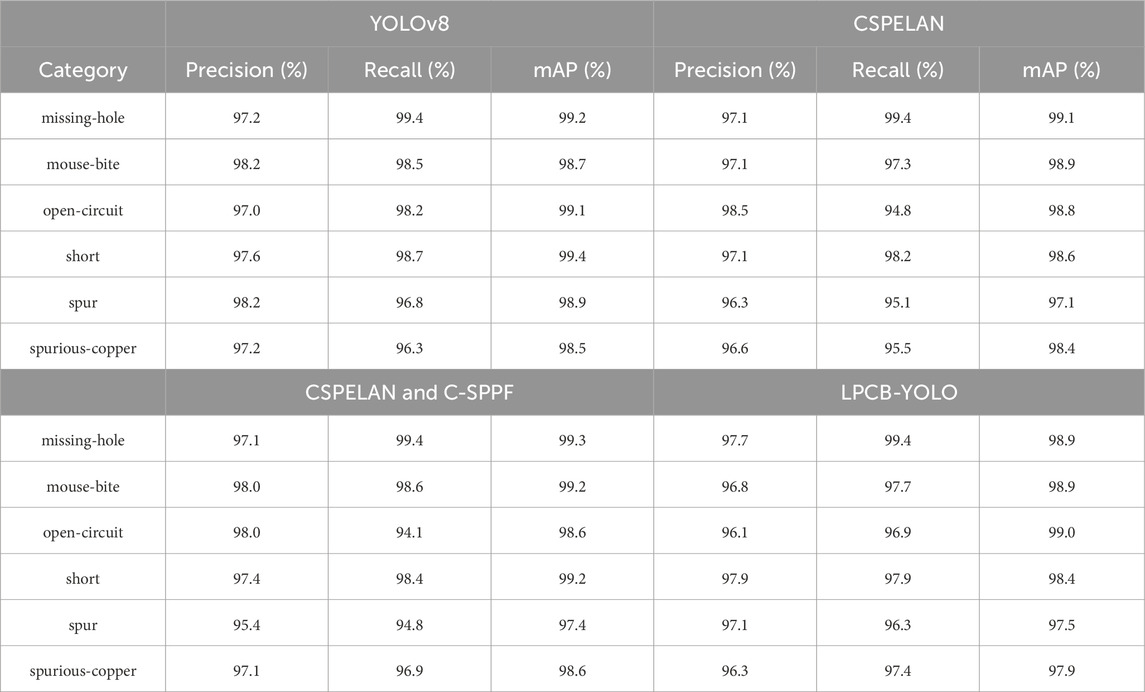
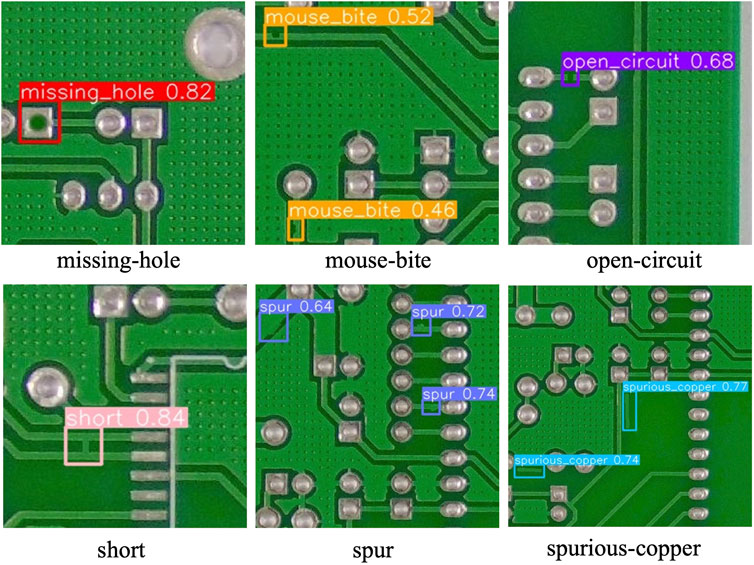
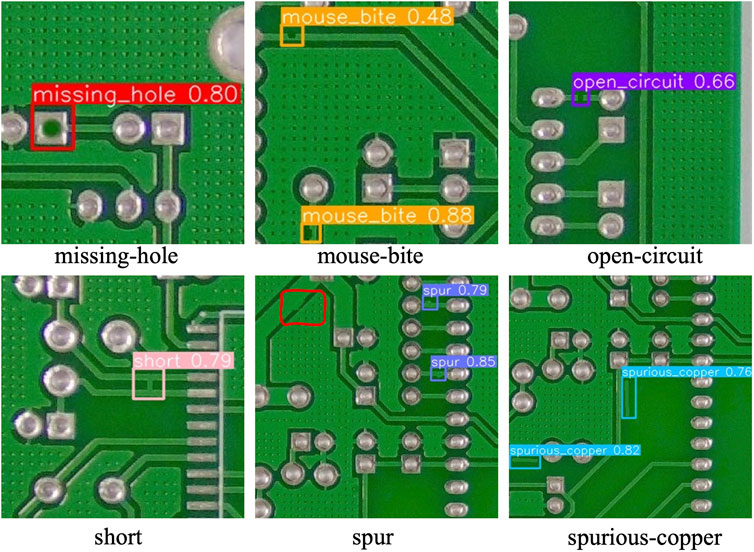
To validate the stability and adaptability of the LPCB-YOLO algorithm in practical applications, we selected an independent test set consisting of 2000 images to evaluate the detection performance of the new model. In that experiment, the improved model at each stage was carefully compared with the YOLOv8 algorithm in a variety of single-category defect detection tasks. The experimental results are shown in Table 5, where CSPELAN represents only the Backbone part was changed and the rest of the Backbone part was not changed in any way, CSPELAN and C-SPPF represents that the C-SPPF module was added on the basis of CSPELAN, and the actual detection results are depicted in Figures 13, 14. The aim is to reveal and quantify the superiority and improvement of the improved algorithm in the context of circuit board defect detection scenarios.
According to the performance evaluation results shown in Table 5, the LPCB-YOLO algorithm demonstrates outstanding performance. Particularly in the “missing-hole” and “short” categories, LPCB-YOLO exhibits precision and recall rates very close to those of YOLOv8, even reaching the same level of recall as YOLOv8 at 99.4% in the “missing-hole” and “spurious-copper” categories. Additionally, it demonstrates good balance in the “short” category. Although YOLOv8 has a slight advantage in terms of precision in the “mouse-bite” category, LPCB-YOLO has a relatively higher recall rate in the “spur” category, reflecting its strong ability to capture complex detail features. Overall, LPCB-YOLO achieves a performance comparable to or even surpassing YOLOv8 in most cases, especially in maintaining high recall rates to ensure no omission of defects while maintaining high precision, demonstrating its robustness in the field of circuit board defect detection.
Specifically, the algorithm’s overall detection performance does not significantly decrease after the introduction of the CSPELAN module. In the “mouse-bite” category, the mAP is increased to 98.9%, demonstrating its advantage in improving the extraction of small target features. However, in the “spur” category, the mAP is slightly lower than that of YOLOv8, indicating that the module still has room for improvement when dealing with complex texture defects. Subsequently, the algorithm’s overall performance slightly improves after the introduction of the C-SPPF module. This suggests that the C-SPPF module enhances the fusion of global context information, leading to more accurate detection of large defects. Finally, the introduction of the C2f-GS module to the algorithm achieves comprehensive optimization across multiple categories. In the “open-circuit” category, the mAP is increased to 99.0%, which is 0.4% higher than that of CSPELAN and C-SPPF alone. This indicates that the C2f-GS module further enhances the detection of local details.
The CSPELAN module reduces the number of model parameters primarily through lightweight design, while still maintaining high detection accuracy for most categories. The C-SPPF module enhances the capability of global feature fusion, resulting in some improvement in the detection of complex defects, but it may interfere with certain local details. The C2f-GS module optimizes the feature extraction process and improves adaptability to small targets and complex backgrounds. The LPCB-YOLO algorithm achieves an overall improvement in performance, making it suitable not only for real-time industrial inspection tasks, but also demonstrating better robustness and generalization ability while maintaining high accuracy.
From Figures 13, 14, it can be observed that the actual detection performance of the LPCB-YOLO algorithm is similar to that of YOLOv8. However, the confidence level of the LPCB-YOLO algorithm is slightly higher than that of YOLOv8, fully demonstrating the superiority of the algorithm in detecting small targets. In terms of multi-object detection, the actual performance of it is better than that of the original algorithm, although the confidence level is slightly lower. In particular, it exhibits better comprehensiveness, especially in detecting “spur” defects, where no missed detections occurred. Therefore, in terms of practical performance, the proposed the algorithm not only achieves a detection performance similar to that of the original algorithm but also surpasses it in terms of comprehensiveness.
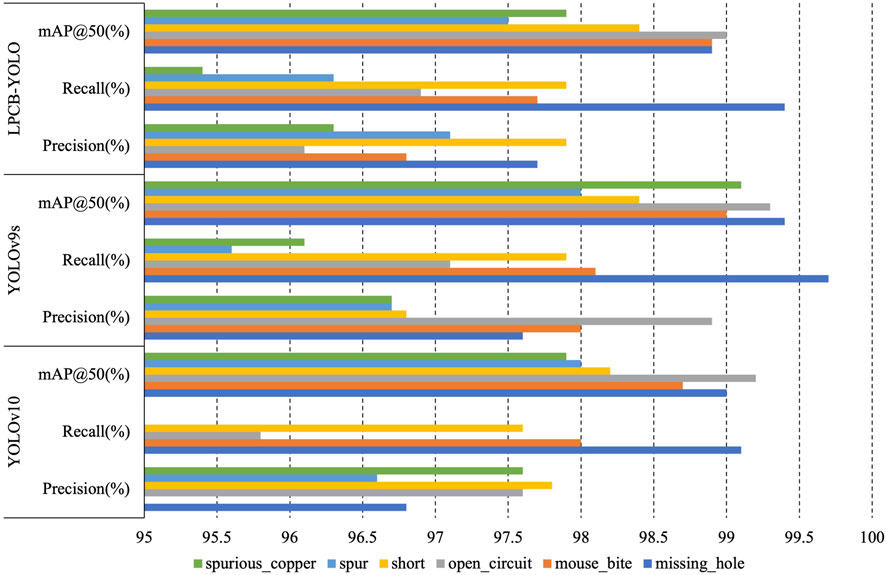
By comparing the model’s detection performance in a single category, it can be seen (as depicted in Figure 15) that LPCB-YOLO’s performance is relatively balanced across all categories, especially the combined performance of Precision and Recall in defect detection, which is more stable, and ensures the model’s reliability in multiple types of defect detection, even though there is a slight gap between the model and the other algorithms in a certain category. In contrast, YOLOv10 performs well in individual categories, but its apparent deficiency in the “mouse-bite” category is a short-coming. YOLOv9s performs very well overall but falls slightly short in individual categories. Taken together, LPCB-YOLO’s balanced performance in precision and recall makes it highly useful in practical applications.
3.7 Discussion of the experimental results
Many of the above experiments show that LPCB-YOLO exhibits notable advantages, particularly in industrial application scenarios. Through the incorporation of the CSPELAN and C-SPPF modules, the model parameters are reduced by 24% compared to YOLOv8. This reduction significantly decreases the computational complexity, resulting in a more lightweight model that is well-suited for resource-constrained environments. Additionally, the feature extraction network has been optimized using the C2f-GS module, and the integration of high-efficiency modules further enhances computational efficiency. These improvements enable LPCB-YOLO to achieve a harmonious balance between high accuracy and real-time performance, meeting the need for rapid processing in industrial scenarios.
In the task of detecting PCB defects, LPCB-YOLO exhibits excellent detection capability, particularly in detecting small targets. Its precision and recall are comparable to or even surpass YOLOv8. LPCB-YOLO achieves a balanced performance in terms of mAP, precision, recall, and other key metrics, ensuring reliable detection of a wide range of defect types. Additionally, LPCB-YOLO demonstrates strong robustness in complex imaging conditions and effectively addresses image quality issues in real production environments. Experiments conducted on the DeepPCB dataset further confirm its ability to generalize, as LPCB-YOLO maintains consistent detection performance across different datasets and application scenarios. These advantages establish LPCB-YOLO as an efficient and dependable solution for industrial automated inspection, with significant practical application value.
Despite the excellent performance of LPCB-YOLO in PCB defect detection, there are still some potential shortcomings that need further optimization. In the case of complex background interference, its detection performance may be slightly inferior to some of the top models (e.g., YOLOv9, YOLOv10), which limits its use in certain demanding application scenarios. Additionally, LPCB-YOLO has a slightly higher leakage rate in specific categories of defect detection, which can pose a challenge for applications with very high precision requirements. Furthermore, several innovative modules introduced by LPCB-YOLO improve the detection performance but also increase the complexity of the model, making debugging and optimization during the training process more difficult. To achieve optimal performance, LPCB-YOLO requires fine hyperparameter tuning, which places higher demands on experimental and time costs. Therefore, it is important to further improve its detection stability and optimization efficiency in future studies.
LPCB-YOLO offers notable benefits in terms of its lightweight design, accuracy, and robustness. However, it does have some limitations in terms of its detection capability and model complexity in certain extreme cases. These distinctive features and potential drawbacks present opportunities for future research to enhance and refine the performance of LPCB-YOLO.
4 Industrial deployment
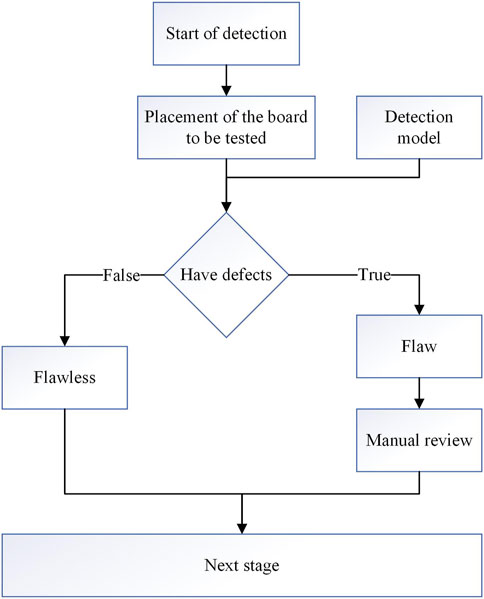
In this study, the LPCB-YOLO algorithm, which is based on deep learning, is utilized for the detection of defects in PCBs. The algorithm is implemented and tested in an industrial production environment. The system comprises a programmable logic controller (PLC) that operates a crawler to transport the PCBs through an industrial camera. The images captured by the camera are transmitted in real-time to the inspection unit. The inspection unit analyzes the images and provides feedback on the detection results to the PLC. The PLC then controls a robotic arm to sort the PCBs and outputs the coordinates and types of defects to the central control system. This process enables a highly efficient and automated defect detection and processing system.The flowchart of the detection system is shown in Figure 16.
To ensure that the captured images are free from distortion, the industrial camera is positioned at a fixed 45-degree angle on top of the track. One side of the camera is connected to the center console for capturing raw images, while the other side is connected to the inspection unit for the purpose of classifying and locating defects. The detection unit utilizes a development board that is equipped with an NPU (Neural Network Processing Unit). This NPU greatly enhances the inference speed and real-time performance of the deep learning model due to its CUDA (Compute Unified Device Architecture) acceleration capability. The NPU development board runs a pre-trained deep learning model that has been carefully trained using a large number of samples of specific defect types. This model is capable of achieving high-precision classification and localization. Furthermore, the acquired image data can be utilized to further optimize and refine the LPCB-YOLO model, thereby continuously improving its detection performance.
5 Conclusion
This paper proposes the LPCB-YOLO lightweight defect detection algorithm. The algorithm reconstructs the feature extraction network of the YOLOv8 model using the CSPELAN module and enhances the global contextual feature perception of the backbone using the C-SPPF model. Additionally, it redesigns the C2f module to propose the C2f-GS module, which is more conducive to feature fusion and multi-aspect feature focusing, aiding the model in more accurate classification and target localization within advanced semantic expressions. The experimental results demonstrate that the LPCB-YOLO algorithm exhibits performance comparable to that of the YOLOv8 algorithm in PCB defect detection tasks and even outperforms the YOLOv8 model in terms of comprehensiveness, while having fewer parameters and faster inference speed. Compared to other popular algorithms such as YOLOv5 and YOLOv6, it has significant advantages.
The proposed LPCB-YOLO algorithm achieves remarkable results in PCB defect detection tasks, realizing both lightweight model design and maintaining the original detection performance as much as possible. Although the model’s parameter count and computational speed have improved, its confidence in target recognition still needs enhancement. Future work will continue to explore improving the model’s recognition confidence and balancing the challenging issues of model parameter count and performance. To improve the transparency and reproducibility of scientific research, the analysis code for this study has been made available on GitHub (https://github.com/Yishilinyuan/LPCB-YOLO) under the Apache 2.0 license.
Data availability statement
The datasets presented in this study can be found in online repositories. The names of the repository/repositories and accession number(s) can be found in the article/supplementary material.
Author contributions
HZ: Writing–original draft, Writing–review and editing, Conceptualization, Methodology. YL: Writing–original draft, Writing–review and editing. DS: Writing–review and editing. ZS: Data curation, Writing–review and editing. YW: Conceptualization, Supervision, Validation, Writing–review and editing.
Funding
The author(s) declare that financial support was received for the research, authorship, and/or publication of this article. This work was supported by Ministry of Education Humanities and Social Science Research Project (No. 23YJAZH034), The Postgraduate Research and Practice Innovation Program of Jiangsu Province (No. SJCX_2147, SJCX_2148), National Computer Basic Education Research Project in Higher Education Institutions (Nos 2024-AFCEC-056 and 2024-AFCEC-057), Enterprise Collaboration Project (Nos Z421A22349, Z421A22304 and Z421A210045).
Acknowledgments
We thank the National Natural Science Foundation of China, Postgraduate Research and Practice Innovation Program of Jiangsu Province, and Enterprise Collaboration Project for supporting this paper.
Conflict of interest
The authors declare that the research was conducted in the absence of any commercial or financial relationships that could be construed as a potential conflict of interest.
Publisher’s note
All claims expressed in this article are solely those of the authors and do not necessarily represent those of their affiliated organizations, or those of the publisher, the editors and the reviewers. Any product that may be evaluated in this article, or claim that may be made by its manufacturer, is not guaranteed or endorsed by the publisher.
References
1. Dong J, Lv W, Bao X Research progress of the pcb surface defect detection method based on machine vision. J Zhejiang Sci-Tech Univ (2021) 45:379–89.
2. Hu K, Zhang E, Xia M, Wang H, Ye X, Lin H. Cross-dimensional feature attention aggregation network for cloud and snow recognition of high satellite images. Neural Comput Appl (2024) 36:7779–98. doi:10.1007/s00521-024-09477-5
3. Iqbal I, Ullah I, Peng T, Wang W, Ma N. An end-to-end deep convolutional neural network-based data-driven fusion framework for identification of human induced pluripotent stem cell-derived endothelial cells in photomicrographs. Eng Appl Artif Intelligence (2025) 139:109573. doi:10.1016/j.engappai.2024.109573
4. Iqbal I, Shahzad G, Rafiq N, Mustafa G, Ma J. Deep learning-based automated detection of human knee joint’s synovial fluid from magnetic resonance images with transfer learning. IET Image Process (2020) 14:1990–8. doi:10.1049/iet-ipr.2019.1646
5. Chen X, Wu Y, He X, Ming W. A comprehensive review of deep learning-based pcb defect detection. IEEE Access (2023) 11:139017–38. doi:10.1109/access.2023.3339561
6. Yu Z, Wu Y, Wei B, Ding Z, Luo F. A lightweight and efficient model for surface tiny defect detection. Appl Intelligence (2023) 53:6344–53. doi:10.1007/s10489-022-03633-x
7. Zeng N, Wu P, Wang Z, Li H, Liu W, Liu X. A small-sized object detection oriented multi-scale feature fusion approach with application to defect detection. IEEE Trans Instrumentation Meas (2022) 71:1–14. doi:10.1109/tim.2022.3153997
8. Chen W, Huang Z, Mu Q, Sun Y. Pcb defect detection method based on transformer-yolo. IEEE Access (2022) 10:129480–9. doi:10.1109/access.2022.3228206
9. Liu T, Cao G-Z, He Z, Xie S. Refined defect detector with deformable transformer and pyramid feature fusion for pcb detection. IEEE Trans Instrumentation Meas (2023) 73:1–11. doi:10.1109/tim.2023.3326460
10. Carion N, Massa F, Synnaeve G, Usunier N, Kirillov A, Zagoruyko S. End-to-end object detection with transformers. In: European conference on computer vision. Springer (2020) p. 213–29.
11. Vaswani A, Shazeer N, Parmar N, Uszkoreit J, Jones L, Gomez AN, et al. Attention is all you need. Adv Neural Inf Process Syst (2017) 30.
12. Liao X, Lv S, Li D, Luo Y, Zhu Z, Jiang C. Yolov4-mn3 for pcb surface defect detection. Appl Sci (2021) 11:11701. doi:10.3390/app112411701
13. Bochkovskiy A, Wang C-Y, Liao H-YM (2020). Yolov4: optimal speed and accuracy of object detection. arXiv preprint arXiv:2004.10934
14. Ling Q, Isa NAM, Asaari MSM. Precise detection for dense pcb components based on modified yolov8. IEEE Access (2023) 11:116545–60. doi:10.1109/access.2023.3325885
15. Joo I, Kim S, Kim G, Yoo K-H. Soif-dn: preserving small object information flow with improved deep learning model. IEEE Access (2023) 11:130391–405. doi:10.1109/access.2023.3333942
16. Chen F, Deng M, Gao H, Yang X, Zhang D. Nhd-yolo: improved yolov8 using optimized neck and head for product surface defect detection with data augmentation. IET Image Process (2024) 18:1915–26. doi:10.1049/ipr2.13073
17. Wang C-Y, Yeh I-H, Mark Liao H-Y. Yolov9: learning what you want to learn using programmable gradient information. In: European conference on computer vision. Springer (2025) p. 1–21.
18. Wang C-Y, Liao H-YM, Wu Y-H, Chen P-Y, Hsieh J-W, Yeh I-H. Cspnet: a new backbone that can enhance learning capability of cnn. In: Proceedings of the IEEE/CVF conference on computer vision and pattern recognition workshops (2020) p. 390–1.
19. Ding X, Zhang X, Ma N, Han J, Ding G, Sun J. Repvgg: making vgg-style convnets great again. In: Proceedings of the IEEE/CVF conference on computer vision and pattern recognition (2021) p. 13733–42.
20. He K, Zhang X, Ren S, Sun J. Spatial pyramid pooling in deep convolutional networks for visual recognition. IEEE Trans pattern Anal machine intelligence (2015) 37:1904–16. doi:10.1109/tpami.2015.2389824
21. Han K, Wang Y, Tian Q, Guo J, Xu C, Xu C. Ghostnet: more features from cheap operations. In: Proceedings of the IEEE/CVF conference on computer vision and pattern recognition (2020) p. 1580–9.
22. Yang L, Zhang R-Y, Li L, Xie X. Simam: a simple, parameter-free attention module for convolutional neural networks. In: International conference on machine learning and pattern recognition. PMLR (2021). p. 11863–74.
23. Liu S, Qi L, Qin H, Shi J, Jia J. Path aggregation network for instance segmentation. In: Proceedings of the IEEE conference on computer vision and pattern recognition (2018) p. 8759–68.
24. Lin T-Y, Dollár P, Girshick R, He K, Hariharan B, Belongie S. Feature pyramid networks for object detection. In: Proceedings of the IEEE conference on computer vision and pattern recognition (2017) p. 2117–25.
25. Wang C-Y, Liao H-YM, Yeh I-H. Designing network design strategies through gradient path analysis. arXiv preprint arXiv:2211.04800 (2022).
26. Wang C-Y, Bochkovskiy A, Liao H-YM. Yolov7: trainable bag-of-freebies sets new state-of-the-art for real-time object detectors. In: Proceedings of the IEEE/CVF conference on computer vision and pattern recognition (2023) p. 7464–75.
27. Xuan W, Jian-She G, Bo-Jie H, Zong-Shan W, Hong-Wei D, Jie W. A lightweight modified yolox network using coordinate attention mechanism for pcb surface defect detection. IEEE sensors J (2022) 22:20910–20. doi:10.1109/jsen.2022.3208580
28. Jiang W, Li T, Zhang S, Chen W, Yang J. Pcb defects target detection combining multi-scale and attention mechanism. Eng Appl Artif Intelligence (2023) 123:106359. doi:10.1016/j.engappai.2023.106359
29. Kim J, Ko J, Choi H, Kim H. Printed circuit board defect detection using deep learning via a skip-connected convolutional autoencoder. Sensors (2021) 21:4968. doi:10.3390/s21154968
30. Li Y, Yao T, Pan Y, Mei T. Contextual transformer networks for visual recognition. IEEE Trans Pattern Anal Machine Intelligence (2022) 45:1489–500. doi:10.1109/tpami.2022.3164083
31. Li X, Wang W, Hu X, Yang J. Selective kernel networks. In: Proceedings of the IEEE/CVF conference on computer vision and pattern recognition (2019) p. 510–9.
32. Li X, Wang W, Wu L, Chen S, Hu X, Li J, et al. Generalized focal loss: learning qualified and distributed bounding boxes for dense object detection. Adv Neural Inf Process Syst (2020) 33:21002–12.
33. Selvaraju RR, Cogswell M, Das A, Vedantam R, Parikh D, Batra D. Grad-cam: visual explanations from deep networks via gradient-based localization. In: Proceedings of the IEEE international conference on computer vision (2017) p. 618–26.
34. Du B, Wan F, Lei G, Xu L, Xu C, Xiong Y. Yolo-mbbi: pcb surface defect detection method based on enhanced yolov5. Electronics (2023) 12:2821. doi:10.3390/electronics12132821
35. Li C, Li L, Jiang H, Weng K, Geng Y, Li L, et al. Yolov6: a single-stage object detection framework for industrial applications. arXiv preprint arXiv:2209.02976 (2022).
36. Chang H-S, Wang C-Y, Wang RR, Chou G, Liao H-YM (2023) YOLOR-based multi-task learning. arXiv preprint arXiv:2309.16921
37. Wang C, He W, Nie Y, Guo J, Liu C, Wang Y, et al. Gold-yolo: efficient object detector via gather-and-distribute mechanism. Adv Neural Inf Process Syst (2024) 36.
Keywords: printed circuit board, lightweight network, ELAN, defects detection, tiny target detection
Citation: Zhang H, Li Y, Sharid Kayes DM, Song Z and Wang Y (2025) Research on PCB defect detection algorithm based on LPCB-YOLO. Front. Phys. 12:1472584. doi: 10.3389/fphy.2024.1472584
Received: 19 September 2024; Accepted: 02 December 2024;
Published: 03 January 2025.
Edited by:
Matteo Cirillo, University of Rome Tor Vergata, ItalyCopyright © 2025 Zhang, Li, Sharid Kayes, Song and Wang. This is an open-access article distributed under the terms of the Creative Commons Attribution License (CC BY). The use, distribution or reproduction in other forums is permitted, provided the original author(s) and the copyright owner(s) are credited and that the original publication in this journal is cited, in accordance with accepted academic practice. No use, distribution or reproduction is permitted which does not comply with these terms.
*Correspondence: Haiyan Zhang, emhhbmdoYWl5YW5AaHlpdC5lZHUuY24=
 Haiyan Zhang1,2*
 Yazhou Li