- 1Zhejiang Provincial Engineering Research Center for the Safety of Pressure Vessel and Pipeline, Ningbo University, Ningbo, Zhejiang, China
- 2Key Laboratory of Impact and Safety Enginnering, Ministry of Education, Ningbo University, Ningbo, China
Infrared thermography (IRT) is a non-destructive testing technique that can detect the internal defects of materials. In the detection of austenitic stainless-steel pipes with large curvature, image noise caused by uneven heating is difficult to avoid. Traditional image processing methods are less effective. According to previous works, a supervised neural network was proposed in this paper using Unet network and convolutional block attention module. Existing image processing method and networks were used to compare with the proposed method. The results show that the proposed method can remove the noise caused by uneven heating, and detect all subsurface defects in stainless-steel pipe.
1 Introduction
Austenitic stainless steel is widely used in aviation, petroleum, machinery manufacturing, chemical, new energy and other important parts of the industry because of excellent corrosion resistance, oxidation resistance and low temperature toughness. Due to the imperfection of the welding process and the harsh working environment, austenitic stainless-steel pipes are susceptible to defects such as inclusions, cracks and holes, which may cause a major safety hazard. Commonly non-destructive testing methods are radiographic testing [1], penetrant testing [2], eddy current testing [3] and ultrasonic testing [4]. Each of these techniques have its own advantages and limitations. In this context, infrared thermography (IRT) is used to detect the surface defects in the austenitic stainless-steel pipes.
Active thermal imaging technology based on infrared optical measurements has developed rapidly in recent years. Compared with traditional non-destructive testing (NDT) technology, this technology has the advantages of non-contact, wide application object, large detection area, etc. It allows the external excitation source to heat the sample and has received a lot of attention from scholars [5, 6]. Among them, Pulsed Thermography (PT) mainly adopts the method of externally applied optical excitation to raise the temperature of the material surface, and according to the thermal resistance effect at the defect [7], the detection and characterization of the defect are achieved through infrared thermography and image processing. However, the thermal conductivity of metallic materials is high and the lateral diffusion effect of temperature is more serious, which affects the detection effect of infrared thermography. For metal pipes with large curvature, it is difficult to ensure that the heating of the pipe surface is uniform in practical inspection. Setting up a uniformly heating source on the outside of the specimen without damaging or touching the specimen is expensive and not universally applicable.
Thermal image processing techniques are crucial for infrared NDT and can significantly reduce thermal signal noise, increase the depth of defect detection and improve the quality of thermal images. Unlike general image processing techniques, thermal image processing techniques are based on the principle of infrared thermography and analysis on the infrared temperature history during or after heating of the sample surface to extract the defect information. In recent years, scholars have developed a variety of infrared thermal imaging techniques for different heating methods and different materials under testing. They have integrated these techniques into infrared inspection post-processing software, enabling a large number of popular applications. For example, Maldague et al. [8] combined the advantages of lock-in thermography and pulsed thermography, and proposed a Fourier transform-based thermal image processing technique, namely, Pulsed Phase Thermography (PPT). Rajic [9] applied Principal Component Analysis (PCA) to thermal image processing and used the third principal component to reconstruct thermal images, which effectively improved the quality of thermal images. Moradi et al. [10] proposed a thermal signal area (TSA) method based on integration processing and combined it with wavelet transform to achieve infrared detection of debonding defects in composite materials. In recent years, image processing based on supervised learning method has been widely adopted in infrared thermography. Fang et al. [11] proposed a specific depth quantifying technique by employing the Gated Recurrent Units (GRUs) in composite material samples via pulsed thermography. In summary, thermal image processing techniques have unique advantages for different IR detection systems, material properties, and defect types [12–14]. Ronneberger et al. [15] proposed a network named Unet neural network, which has a structure of encode-decoder. He et al. [16] establishes the AG-UNet defect detection model based on spatial features and the 3D-Unet defect detection model based on spatio-temporal features for the extraction and segmentation of thermal imaging defect features. Luo et al. [17] used Unet network for infrared thermal defect detection. The results indicate that the Unet network significantly enhances contrast between defective and non-defective areas. Attention mechanism is one of the main means to solve the problem of information overload. It allocates the computing resources to more important tasks. Hu et al. [18] proposed a channel attention model (SENet). Woo et al. [19] expanded the SENet and proposed an attention module named “Convolutional Block Attention Module” (CBAM). Although these works have achieved some outstanding advances in the detection of flat materials containing defects. However, there is a lack of corresponding studies on uneven heating caused by the surface morphology of the sample, especially for the detection of large curvature pipes containing defects.
In this paper, we proposed an improved neural network, which combines the Unet network with the CBAM. Experiments and simulation were used to build the training dataset, and the other stainless-steel pipe with different defects were to build the prediction dataset. Both testing process and prediction process were presented to validate the advantage of the novel neural network. In addition, the proposed method in this paper was compared with the traditional method (including PCA, PPT, FOFD [13] and TSA) and other deep learning model (including PSPNet, DeepLabv3+) to verify the reliability of the proposed method in detecting defects.
2 Methodology
In this study, an improved neural network algorithm with CBAM is developed for infrared thermography. Raw data was collected from the IRT system and COMSOL software. Then, the common neural networks and traditional image processing methods for infrared thermography were used to process data. The proposed strategy for defect detection is shown in Figure 1. Details of the processing procedure are discussed in this section.
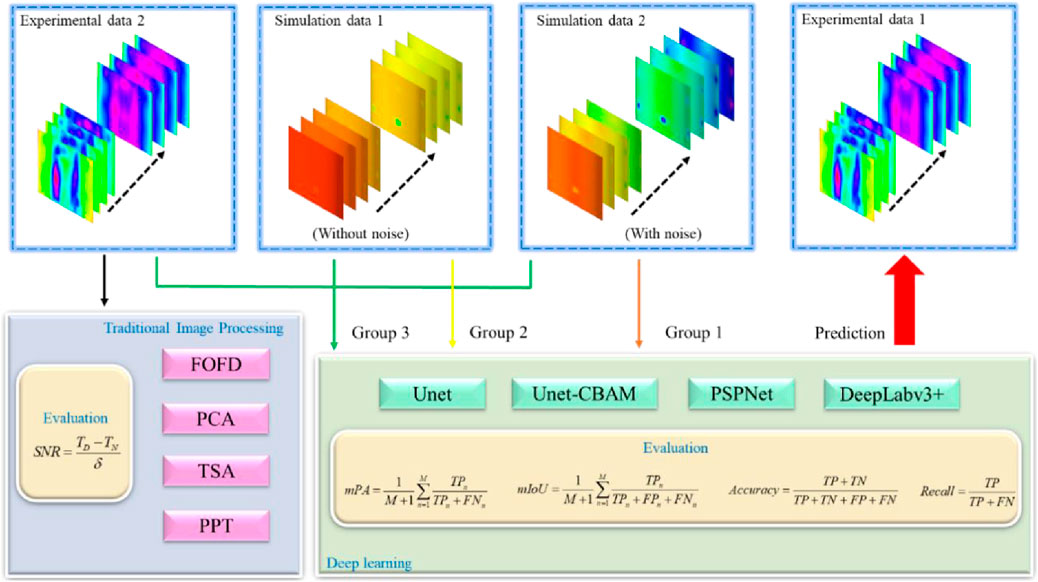
Figure 1. Proposed strategy for segmentation of defect detectability. Insets: the evaluation methods will be explained in Section 4.
2.1 Improved network
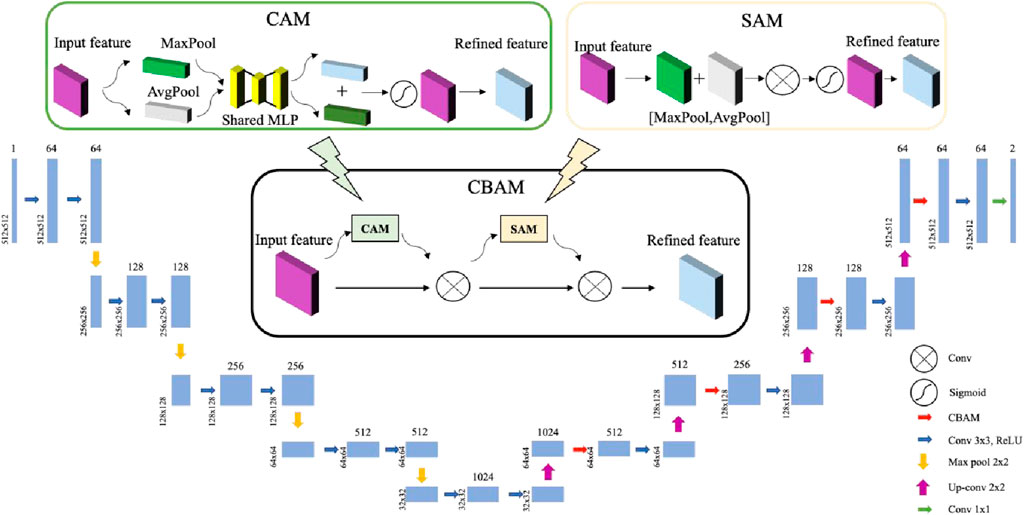
The Unet is one of the famous architectures in image segmentation. It was originally developed for biomedical image segmentation, as shown in Figure 2. The Unet can be divided into two parts: the first part is the contracting path that uses a typical CNN architecture. Each block in the contracting path consists of two successive 3 × 3 convolutions followed by a ReLU activation unit and a max-pooling layer. This arrangement is repeated several times. The novelty of Unet comes in the second part, called the expansive path, in which each stage upsamples the feature map using 2 × 2 up-convolution. Then, the feature map from the corresponding layer in the contracting path is cropped and concatenated onto the upsampled feature map. This is followed by two successive 3 × 3 convolutions and ReLU activation. At the final stage, an additional 1 × 1 convolution is applied to reduce the feature map to the required number of channels and produce the segmented image. The cropping is necessary since pixel features in the edges have the least amount of contextual information and therefore need to be discarded. This results in a network resembling a u-shape and, more importantly, propagates contextual information along the network, which allows it to segment objects in an area using context from a large overlapping area.
The energy function for the network is given by Equation 1:
where pk is the pixel-wise SoftMax function applied over the final feature map, defined as Equation 2:
and ak denotes the activation in channel k.
The CBAM consists of two parts, i.e., channel attention module and spatial attention module. In channel attention module, both average-pooling and max-pooling operations are used to aggregate spatial information of a feature map. And two different spatial context descriptors (
where σ denotes the sigmoed function,
In the spatial attention module, the spatial attention map is generated by utilizing the inter-spatial relationships of features. Unlike channel attention, the spatial attention focuses on ‘where’ is an informative part, complementing the channel attention. To compute the spatial attention, the average-pooling and max-pooling operations along the channel axis are applied and concatenated to generate an efficient feature descriptor. On the concatenated feature descriptor, the convolution layer is applied to generate a spatial attention map
where σ denotes the sigmoid function and f 7x7 represents a convolution operation with the filter size of 7 × 7.
The principle of CBAM is illustrated in Figure 2. Given an intermediate feature map F as input, CBAM sequentially infers a 1D channel attention map Mc and a 2D spatial attention map Ms. The overall attention process can be summarized as Equation 5:
where
2.2 Traditional infrared image processing method
In order to verify the effectiveness of the novel algorithm, traditional image processing methods were used for comparison in this paper. The principles of these methods are as follows.
On the surface of the sample, the temperature signal of each pixel varies with time. Due to uneven heating, uneven surface emissivity of the sample, and the surrounding environment, a lot of noise will be generated in the infrared thermal image, resulting in the reduction of image signal-to-noise ratio (SNR). This may lead to false or missed detection of defects. The thermal image was divided into two areas, namely, defect area and non-defect area. Each thermal sequence image and its adjacent thermal image were processed by using the first-order forward difference.
Pulse phase thermography [20–22] performs a discrete Fourier transform on each pixel in the thermal sequence image to obtain the amplitude sequence and phase sequence of the pixel. The amplitude and phase of all pixels in the thermal image constitute the amplitude and phase images.
Principal component analysis [23, 24] uses the idea of dimensionality reduction to extract the main components that can represent the defect information. The obtained principal components can reflect most of the original useful signal information, and the information vectors contained are unrelated. Before processing, the thermal images should be vectorized and transformed into a column vector matrix. Then, covariance matrix A with size M × N (M > N) is calculated. Singular value decomposition is performed on matrix A to obtain characteristic values, as detailed in Equation 6:
where U is the eigenvector matrix of dimension M × N, R is the diagonal matrix of N × N, and VT is the transpose of N × N matrix. The feature vector matrix U obtained by the solution is transformed into the inverse process of the quantization, and the feature vector Pi of each principal component image obtained by singular value decomposition can be obtained, can be expressed using Equation 7:
3 Material and experimental setup
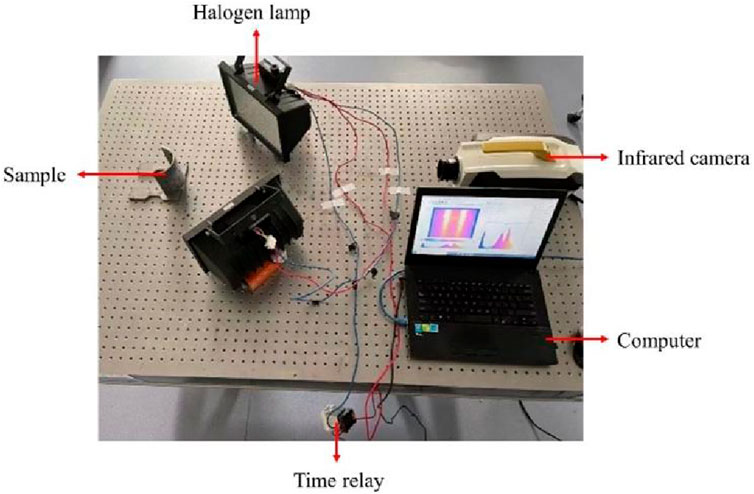
The experimental setup of the IRT system is shown in Figure 3. The infrared thermal camera (FAST M100K) was used to record the temperature profile. The camera spatial resolution was 640 × 512 pixels, and the maximum frame rate could reach 120,000 Hz. Two 1000 W halogen lamps were employed to generate square wave heating in this setup. A time relay was used to accurately control the heating time. The heating time was set at 10 s, and the cooling time was set to 15 s. The frame frequency of the infrared camera was set to 60 Hz.
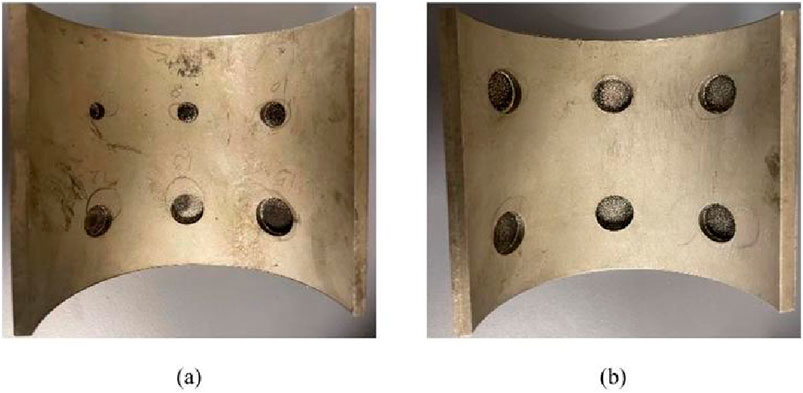
The samples are two 304 stainless-steel pipes. The outer diameter and thickness are 100 mm and 5 mm. As shown in Figure 4A, there are six holes on the Sample 1. The diameters of the defects are 3, 8, 10, 12, 13 and 15 mm. The distances from the inspected surface to the bottom of six holes are all 0.5 mm. As shown in Figure 4B, there are six holes on the Sample 2. The diameters of six holes are all 10 mm. The distances from the inspected surface to the bottom of six holes are 0.23, 0.51, 0.98, 1.21, 1.52 and 2.03 mm. The material properties of the samples are shown in Table 1. In order to improve the surface emissivity of the metallic pipe, a layer of black paint was sprayed to its surface.
In Comsol software, solid heat transfer module was used to simulate the infrared thermography. The simulation samples are the same as Sample 2. To expand the dataset for deep learning, the diameters of six holes were changed from 3 mm to 15 mm, and the depths of six holes were varied from 0.1 to 3 mm. Uniform heating mode and uneven heating mode were set to simulate ideal condition and actual condition, respectively. For uniform heating mode, heat flux was set to 2 × 10⁴ W/m2. For uneven heating mode, heat flux was set as Equation 8:
where ql is the heat flux load on the left surface of the sample, qr is the heat flux load on the right surface of the sample,
4 Methodology
4.1 Experimental results
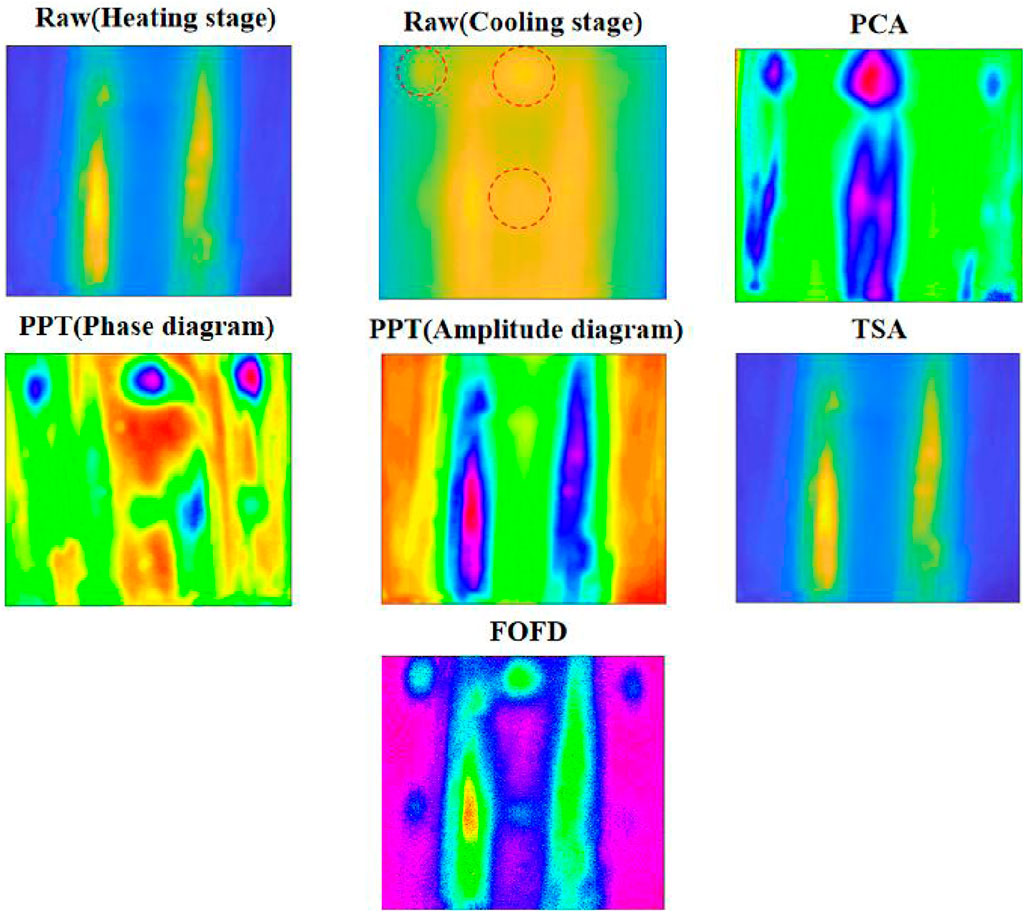
The thermal sequence images of the sample surface after long-pulse heating were acquired using an infrared camera. Figure 5 shows the thermal images of Sample 1 during heating and cooling, respectively. During the heating process, due to the large radius of curvature of the pipe, the two halogen lamps could not transfer heat uniformly to the surface of the pipe, resulting in a sharp increase in temperature at the location closest to the lamps. The uneven heating completely conceals the information about the defect location. During the cooling process, the temperature of sample surface drops sharply and a temperature difference between the defective and non-defective areas emerges due to different thermal resistances. However, the “light column” area concentrates a large amount of heat during heating. Even if the internal thermal resistances of defect area and non-defect area are different, it is difficult to make the heat to dissipate quickly. The heat flow transmits in three dimensions in space, and the lateral diffusion of temperature tends to interfere with the temperature signal in the defect area. In addition, metallic materials have high thermal conductivity, and their internal temperature changes rapidly. These factors lead to a temperature difference between the defect and non-defect areas for a short period of time. Therefore, it is crucial to find an image processing method that can attenuate the noise caused by uneven heating and improve the detection depth of infrared thermography.
4.2 Image processing
During the detection process, noise caused by uneven heating, uneven emissivity, and environmental effects is difficult to avoid. Yang et al. [25] categorized defects in infrared thermography and concluded that thermal noise is mainly classified into multiplicative noise (uneven emissivity on the sample surface) and additive noise (uneven heating, camera noise, environmental noise and random noise). Multiplicative noise can be reduced by spraying a black paint with high emissivity on the sample surface. To address additive noise, an aluminum box can be used to eliminate the ambient noise generated by reflections from other heating sources. The noise caused by uneven heating can be eliminated by image processing algorithms. Traditional image processing algorithms include principal component analysis, pulse phase thermography, and thermal signal area. In the experimental study of metallic pipes, the main noise comes from uneven heating. In this section, all image processing methods are applied to process the experimental results of sample 1.
Based on the original images shown in Figure 5, it can be observed that the detectability of all defects is relatively low. According to empirical rules, as the defect aspect ratio decreases, both thermal contrast and phase contrast decrease. However, due to the effects of uneven heating, the detection of smaller defects in the middle-lower positions is slightly better compared to the larger defects in the upper-right positions.
As shown in Figure 5, the principal component analysis enhances the contrast of the defective area and makes the three defects above the pipe clearer. In particular, the hole defect at the top right of the image could not be detected in the raw image, it could be detected in the fourth principal component of PCA. The location information of this defect is very clear after the processing of principal component analysis. However, for the three defects at the bottom of the image, the principal component analysis does not work well. Especially for the blue part in the middle position, it is easy to be mis-detected during the actual detection process. In addition, PCA did not reduce the noise on the surface of the sample, instead it contaminated the non-defective areas.
Pulse phase thermography reduces image noise. Three defects at the top of the image are fully visible. However, for the three defects at the bottom of the image, the pulse phase thermography does not play the role of image enhancement. It makes the defects that can be detected in the raw image disappear. This is easy to miss detection in the actual detection process, resulting in huge safety hazards. As shown in Figure 5, the amplitude diagram of PPT and TSA methods miss all the defect information. By using FOFD method, five defects can be detected. The location and size of all defects are almost identical to the real defect location and size. Therefore, the FOFD method has excellent results and simple operation procedures in dealing with the problem of large curvature stainless steel pipes containing defects. It can be applied to the detection of various engineering equipment, and even online monitoring. However, the FOFD method does not effectively eliminate the two “light columns” caused by uneven heating.
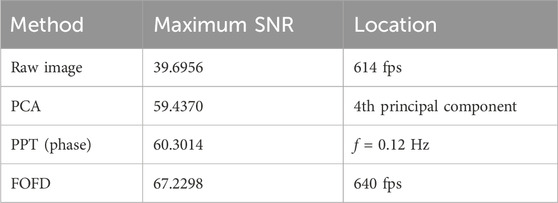
The processing effects of traditional methods are quantitatively analysed. The signal-to-noise ratio (SNR) is selected as the comparison criterion. The equation for the SNR is as Equation 9:
where TD is the average value of the pixels in defective area, TN is the average value of pixels in non-defective area, δ is the standard deviation of the pixels in non-defective area. Considering the difference of the image pixel units processed by different methods, each image was converted into JPG format for evaluation. A window of 15 × 15 pixels was selected to intercept the pixel values of the defective and non-defective areas in turn. The values of the maximum SNR in the images processed by each method were selected for comparison, as shown in Table 2. Among them, both the PCA and the PPT processed images improved the SNR of the raw image by 49.73% and 51.91%. The image processed by FOFD improved the SNR of the raw image by 69.36%. Although the FOFD method improves the defect detectability, it does not reduce the noise caused by uneven heating. This may lead to false detection in actual testing.
Deep learning is an effective image processing method in infrared thermography. Here we adopt the deep learning method to process the thermal sequences. All experimental training data were derived from sample 2, because prediction data should differ from training and testing data. The whole thermal image information is divided into two categories as the target input. The first category is the temperature of defective area (defined as 1). The second category is the temperature of non-defective area (defined as 0). Furthermore, there are three training sets used for training. The first training set was derived from simulation data without noise. The second training set was derived from simulation data with noise. The third training set was derived from the experimental data and the former two training sets. The training set and test set are divided 7 to 3.
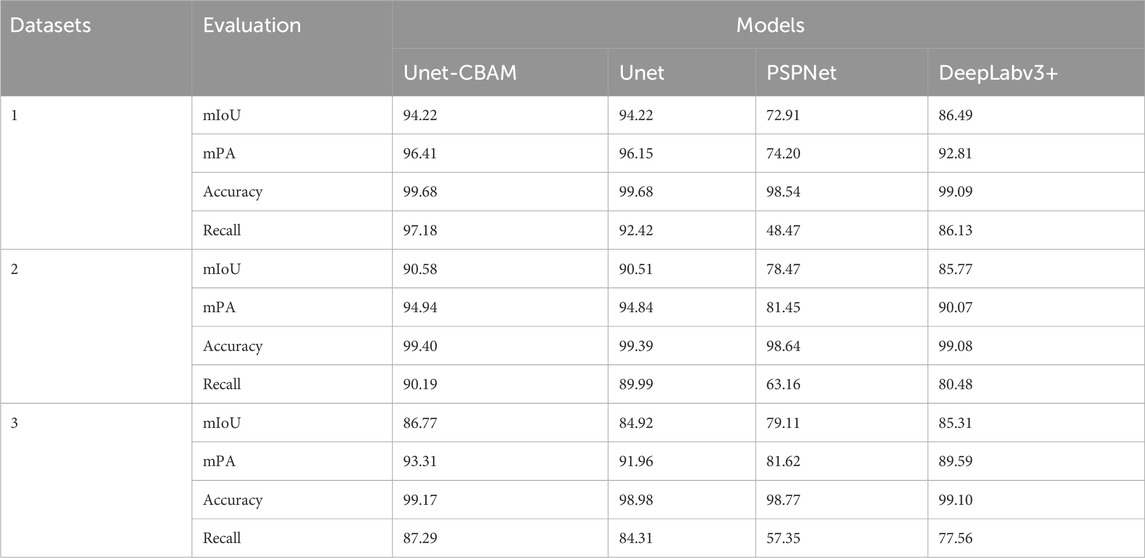
A model that can identify the defective and non-defective regions is constructed using the Unet neural network. Then, the Unet model is combined with the CBAM to improve the defect detectability. PSPNet and DeepLabv3+ neural networks are used to compare with the proposed Unet -CBAM model. To evaluate the performance of different neural networks, we adopted the mean Pixel Accuracy (mPA) and the mean Intersection over Union (mIoU), Accuracy and Recall as the evaluation indicators of the detection precision. They are formulated as Equations 10–13:
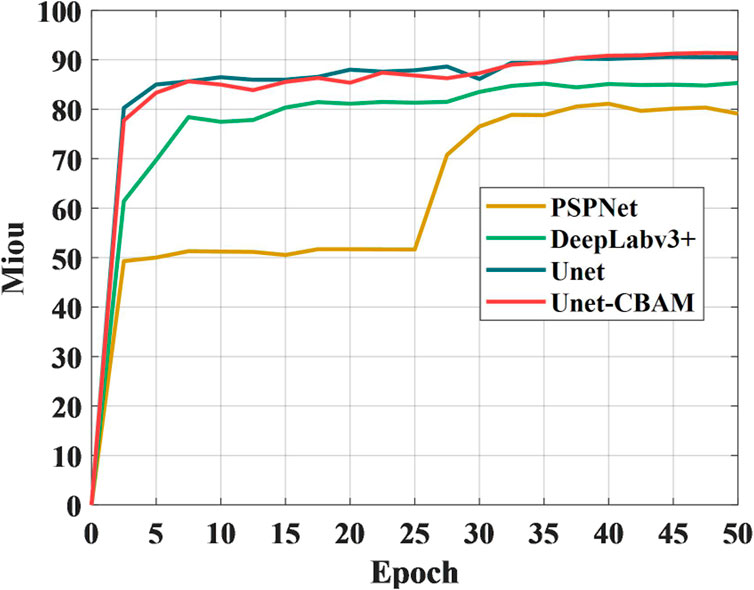
where TP, FP, TN and FN refer to true positive, false positive, true negative and false negative, M is the total number of defects. The evaluation indicators for different neural network are shown in Table 3. The Unet -CBAM not only improves prediction accuracy on the origin Unet model, but also has the highest indicators among all neural network and all training sets. Figure 6 shows the mIoU curves of four networks. It can be seen that both the Unet network and the Unet -CBAM network significantly enhances the detection precision of defects.
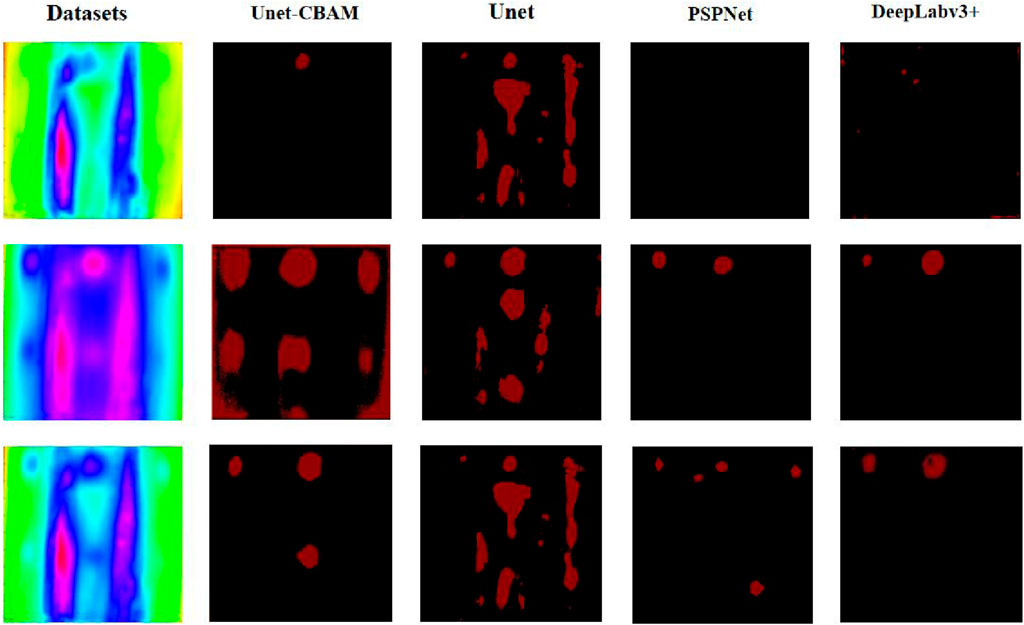
The trained models were used to predict the steel pipe with six known defects, i.e., sample 1. The results are shown in Figure 7. The image processed by Unet -CBAM model can completely eliminate the “light column” phenomenon caused by uneven heating. It can also identify all subsurface defects. However, there is still a small amount of noise in the image, especially around the image. The detection effects of other networks were bad. It can be seen that they either eliminate the noise while ignoring the defect information, or they predict the wrong defects. Compared with existing networks, the proposed network achieved the expected results.
5 Conclusion
The curvature effect of austenitic stainless-steel pipes has a strong interference effect on infrared nondestructive testing. The traditional image processing methods have poor processing effects and fail to remove image noise caused by uneven heating. In order to solve this problem, a novel image processing method based on Unet neural network and convolutional block attention module is proposed and applied to detect large curvature austenitic stainless-steel pipes containing defects. Three datasets were used to train the models. Furthermore, traditional image processing methods and existing networks were compared with the proposed method. The results demonstrate that the proposed network can significantly reduce the noise caused by uneven heating and improve the defect detectability.
Data availability statement
The raw data supporting the conclusions of this article will be made available by the authors, without undue reservation.
Author contributions
CW: Writing–original draft, Writing–review and editing. DW: Conceptualization, Data curation, Formal Analysis, Funding acquisition, Investigation, Methodology, Project administration, Resources, Software, Supervision, Validation, Visualization, Writing–review and editing. PZ: Data curation, Formal Analysis, Methodology, Project administration, Supervision, Validation, Writing–review and editing, Writing–original draft.
Funding
The author(s) declare that financial support was received for the research, authorship, and/or publication of this article. The authors are grateful to the financial support from the National Natural Science Foundation of China (Grant No. 11702151), Science and Technology Innovation 2025 Major Project of Ningbo City (Grant No. 2022Z209) and sponsored by K. C. Wong Magna Fund in Ningbo University.
Conflict of interest
The authors declare that the research was conducted in the absence of any commercial or financial relationships that could be construed as a potential conflict of interest.
Publisher’s note
All claims expressed in this article are solely those of the authors and do not necessarily represent those of their affiliated organizations, or those of the publisher, the editors and the reviewers. Any product that may be evaluated in this article, or claim that may be made by its manufacturer, is not guaranteed or endorsed by the publisher.
References
1. Da Silva RR, Siqueira MHS, de Souza MPV, Rebello JMA, Calôba LP. Estimated accuracy of classification of defects detected in welded joints by radiographic tests. Ndt and E Int (2005) 38:335–43. doi:10.1016/j.ndteint.2004.10.007
2. Kalinichenko NP, Kalinichenko AN, Lobanova IS, Borisov SS. Methods for the manufacture of nonmetallic reference specimens for liquid-penetrant inspection. Russ J Nondestructive Test (2013) 49:668–72. doi:10.1134/s1061830913110041
3. García-Martín J, Gómez-Gil J, Vázquez-Sánchez E. Non-destructive techniques based on eddy current testing. Sensors (2011) 11:2525–65. doi:10.3390/s110302525
4. Prada C, Kerbrat E, Cassereau D, Fink M. Time reversal techniques in ultrasonic nondestructive testing of scattering media. Inverse Probl (2002) 18:1761–73. doi:10.1088/0266-5611/18/6/320
5. Mandache C. Overview of non-destructive evaluation techniques for metal-based additive manufacturing. Mater Sci Technology (2019) 35:1007–15. doi:10.1080/02670836.2019.1596370
6. Usamentiaga R, Venegas P, Guerediaga J, Vega L, Molleda J, Bulnes FG. Infrared thermography for temperature measurement and non-destructive testing. Sensors (2014) 14:12305–48. doi:10.3390/s140712305
7. Qin YW, Bao NK. Infrared thermography and its application in the NDT of sandwich structures. Opt Lasers Eng (1996) 25:205–11. doi:10.1016/0143-8166(95)00066-6
8. Maldague X, Marinetti S. Pulse phase infrared thermography. J Appl Phys (1996) 79:2694–8. doi:10.1063/1.362662
9. Rajic N. Principal component thermography for flaw contrast enhancement and flaw depth characterisation in composite structures. Compos Structures (2002) 58:521–8. doi:10.1016/s0263-8223(02)00161-7
10. Moradi M, Safizadeh MS. Detection of edge debonding in composite patch using novel post processing method of thermography. Ndt and E Int (2019) 107:102153. doi:10.1016/j.ndteint.2019.102153
11. Fang Q, Maldague X. A method of defect depth estimation for simulated infrared thermography data with deep learning. Appl Sciences-Basel (2020) 10:6819. doi:10.3390/app11083451
12. Duan YX, Liu SC, Hu CQ, Hu JQ, Zhang H, Yan YQ, et al. Automated defect classification in infrared thermography based on a neural network. Ndt and E Int (2019) 107:102147. doi:10.1016/j.ndteint.2019.102147
13. Zhu PF, Wu D, Qian L. Detection of defects in metallic materials using an improved post-processing method of pulsed thermography. Opt Lasers Eng (2022) 151:106927. doi:10.1016/j.optlaseng.2021.106927
14. Zhu PF, Wu D, Yin LX, Han W. Quantitative detection of defect size based on infrared thermography: temperature integral method. Opt Express (2022) 30:9119–36. doi:10.1364/oe.454360
15. Nikolov S, Blackwell S, Zverovitch A, Mendes R, Livne M, De Fauw J, et al. Clinically applicable segmentation of head and neck anatomy for radiotherapy: deep learning algorithm development and validation study. J Med Internet Res (2021) 23:e26151. doi:10.2196/26151
16. He YZ, Mu XY, Wu JR, Ma Y, Yang RZ, Zhang H, et al. Intelligent detection algorithm based on 2D/3D-UNet for internal defects of carbon fiber composites. Nondestructive Test Eval (2024) 39:923–38. doi:10.1080/10589759.2023.2234548
17. Luo Q, Gao B, Woo WL, Yang Y. Temporal and spatial deep learning network for infrared thermal defect detection. Ndt and E Int (2019) 108:102164. doi:10.1016/j.ndteint.2019.102164
18. Hu JQ, Liu Y, Wu KS. Neural network pruning based on channel attention mechanism. Connect Sci (2022) 34:2201–18. doi:10.1080/09540091.2022.2111405
19. Woo S, Park J, Lee J-Y, Kweon IS. Cbam: convolutional block attention module. In: Proceedings of the Proceedings of the European conference on computer vision. Munich, Germany: ECCV (2018). p. 3–19.
20. Unnikrishnakurup S, Dash J, Ray S, Pesala B, Balasubramaniam K. Nondestructive evaluation of thermal barrier coating thickness degradation using pulsed IR thermography and THz-TDS measurements: a comparative study. Ndt and E Int (2020) 116:102367. doi:10.1016/j.ndteint.2020.102367
21. Maldague X, Galmiche F, Ziadi A. Advances in pulsed phase thermography. Infrared Phys and Technology (2002) 43:175–81. doi:10.1016/s1350-4495(02)00138-x
22. Dua G, Arora V, Mulaveesala R. Defect detection capabilities of pulse compression based infrared non-destructive testing and evaluation. Ieee Sensors J (2021) 21:7940–7. doi:10.1109/jsen.2020.3046320
23. Ahmed J, Gao B, Woo WL, Zhu YY. Ensemble joint sparse low-rank matrix decomposition for thermography diagnosis system. Ieee Trans Ind Electronics (2021) 68:2648–58. doi:10.1109/tie.2020.2975484
24. Saintey MB, Almond DP. An artificial neural network interpreter for transient thermography image data. Ndt and E Int (1997) 30:291–5. doi:10.1016/s0963-8695(96)00071-0
Keywords: infrared thermography, image processing, neural network, finite element analysis, pipeline
Citation: Wu C, Wu D and Zhu P (2024) Non-destructive testing based on Unet-CBAM network for pulsed thermography. Front. Phys. 12:1458194. doi: 10.3389/fphy.2024.1458194
Received: 02 July 2024; Accepted: 09 September 2024;
Published: 18 September 2024.
Edited by:
Ying Huang, North Dakota State University, United StatesReviewed by:
Xingyu Wang, North Dakota State University, United StatesYunze He, Hunan University, China
Copyright © 2024 Wu, Wu and Zhu. This is an open-access article distributed under the terms of the Creative Commons Attribution License (CC BY). The use, distribution or reproduction in other forums is permitted, provided the original author(s) and the copyright owner(s) are credited and that the original publication in this journal is cited, in accordance with accepted academic practice. No use, distribution or reproduction is permitted which does not comply with these terms.
*Correspondence: Dan Wu, d3VkYW5AbmJ1LmVkdS5jbg==
 Chenghao Wu
 Dan Wu
 Pengfei Zhu1,2