- Department of Physics and Astronomy, University of California - Los Angeles, Los Angeles, United States
Action potential generation underlies some of the most consequential dynamical systems on Earth, from brains to hearts. It is therefore interesting to develop synthetic cell-free systems, based on the same molecular mechanisms, which may allow for the exploration of parameter regions and phenomena not attainable, or not apparent, in the live cell. We previously constructed such a synthetic system, based on biological components, which fires action potentials. We call it “Artificial Axon”. The system is minimal in that it relies on a single ion channel species for its dynamics. Here we characterize the Artificial Axon as a dynamical system in time, using a simplified Hodgkin-Huxley model adapted to our experimental context. We construct a phase diagram in parameter space identifying regions corresponding to different temporal behavior, such as Action Potential (AP) trains, single shot APs, or damped oscillations. The main new result is the finding that our system with a single ion channel species, with inactivation, is dynamically equivalent to the system of two channel species without inactivation (the Morris-Lecar system), which exists in nature. We discuss the transitions and bifurcations occurring crossing phase boundaries in the phase diagram, and obtain criteria for the channels’ properties necessary to obtain the desired dynamical behavior. In the second part of the paper we present new experimental results obtained with a system of two AAs connected by excitatory and/or inhibitory electronic “synapses”. We discuss the feasibility of constructing an autonomous oscillator with this system.
1 Introduction
The physics of excitable media is largely concerned with the patterns in space and time created by nonlinear excitations. In this context, electrophysiological processes, and action potentials specifically, hold a unique place as some of the most consequential dynamical systems on earth. Action potentials (APs) play a vital role in biological computation, as sequences of APs encode information in a variety of ways [1].
We have recently introduced a minimal synthetic system, the “Artificial Axon” (AA) [2–4], which is capable of generating APs in time. The experimental system is based on a traditional suspended lipid bilayer (“black lipid membrane”) with embedded voltage gated potassium ion channels (KvAP). An ionic gradient maintained across the membrane provides the free energy source to elicit action potentials. Non-traditionally, the system is held in the off-equilibrium, excitable state by a modified voltage clamp (“Current Limited Voltage Clamp”: CLVC) which allows for voltage dynamics. The system is minimal in that it is built with one ion channel species only, yet it can support APs. The key is the dynamics of the channel, which includes inactivation. Previously we reported on the dynamics of firing APs in the AA. We showed that the threshold behavior of the system is the same as in real neurons [5], namely it is governed by a saddle node bifurcation [4].
Here we first discuss numerically the phase diagram for a single AA, identifying regions in parameter space which give rise to trains of APs, damped oscillations, or single shot APs. We propose a simplified version of the Hodgkin-Huxley model [6] for our system, based on the kinetics of our voltage gated ion channel KvAP [7]. The main new insight is that a system with one ion channel species, with inactivation, is dynamically equivalent to the (biological) system with two channel species, without inactivation (the Morris-Lecar system [8]). This latter system has been studied extensively in real biological contexts. In their seminal paper on the barnacle giant muscle fiber, Morris and Lecar display experimentally the variety of behavior the barnacle axon can produce, including AP trains and damped oscillations, and confirm that it is mainly due to two voltage dependent “conductances”, corresponding to
2 Theory
2.1 The artificial axon system
In the Artificial Axon, the phospholipid bilayer acts in essence as the dielectric of a parallel plates capacitance, sandwiched between two conducting media which are the electrolytes on either side. This capacitance is charged by two kinds of ionic currents: the current through the ion channels embedded in the membrane, and the current sourced by the clamp electrodes. The charge carriers for the former are K+ ions, for the latter Cl−, Ag+, and all other ions in solution. The voltage dynamics
where
The probability that channels are open,
where
this symmetric form being chosen once again to minimize the number of parameters [4, 8]. In the experimental system, the inactivation and recovery rates,
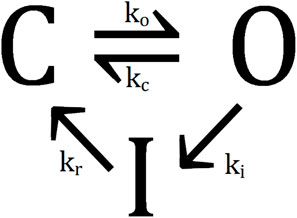
Figure 1. Simplified model for the KvAP channel dynamics. The three states are open (O), closed (C), and inactive (I). Adapted from [4], licensed under Creative Commons Attribution License (CC-BY 4.0), doi:10.1088/2399-6528/ac43d0.
In order to understand the requirements on channel dynamics to obtain various temporal patterns, in Section 2.2 we construct a diagram in parameter space of the dynamical behavior of the system (1), (2), representing a single AA. We refer to it as a “phase diagram” for short. The difficulty is that even in this minimal representation, the parameter space is still high dimensional. To make progress, we identify the most relevant parameters in relation to the experiments: the clamp voltage
2.2 Phase diagram
Figure 2A shows one representation of the phase diagram (in dimensional variables) for the system (1), (2) representing the AA, namely a cut through parameter space for constant
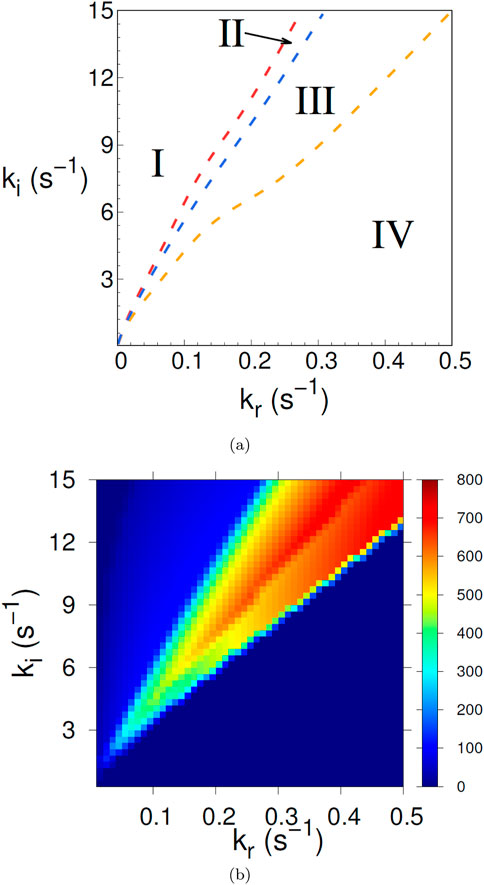
Figure 2. (A) Phase diagram of the dynamic behavior obtained from the model (1), (2), with voltage independent inactivation and recovery rates
We identify four regions of distinct behavior. In region I the dynamical system (1), (2) produces action potential trains (i.e. limit cycles). The firing rate increases for increasing
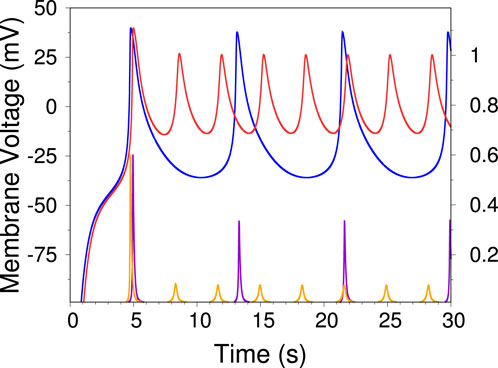
Figure 3. Two representative time traces of the voltage independent model, illustrating the sharp increase in frequency as one crosses from Region I to Region II in the phase diagram of Figure 2A. The blue trace has
Region III corresponds to damped oscillations, the damping increasing for increasing
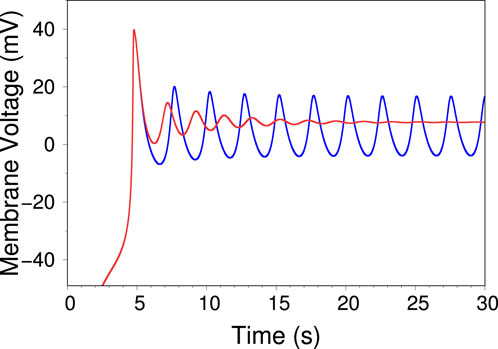
Figure 4. Two time traces of the voltage independent model, displaying the transition from region II to region III in the phase diagram of Figure 2A. The blue trace (
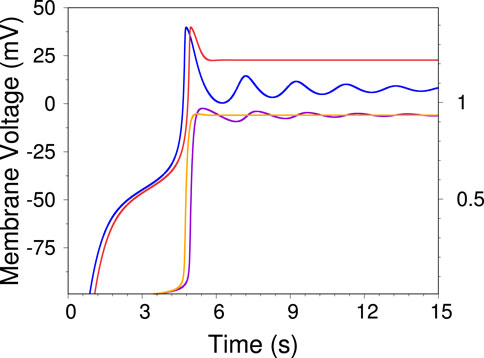
Figure 5. Two time traces of the voltage independent model, displaying damped oscillations and single shot AP. The blue trace (
The lines separating the different regions in Figure 2A were obtained by qualitative assessment of time traces long enough to determine, for example, whether oscillations are damped or not. A more quantitative measure is displayed in Figure 2B, where the color indicates the firing rate. The yellow-orange region corresponds to regions II and III, while the blue region on the upper left is region I and the deeper blue part on the lower right is region IV. To summarize, for the case that the inactivation and recovery rates (
To further characterize the nature of the transition between regions I and II of the phase diagram of Figure 2A, we look at the behavior of the firing rate across the transition. Figure 6A shows the firing rate vs.
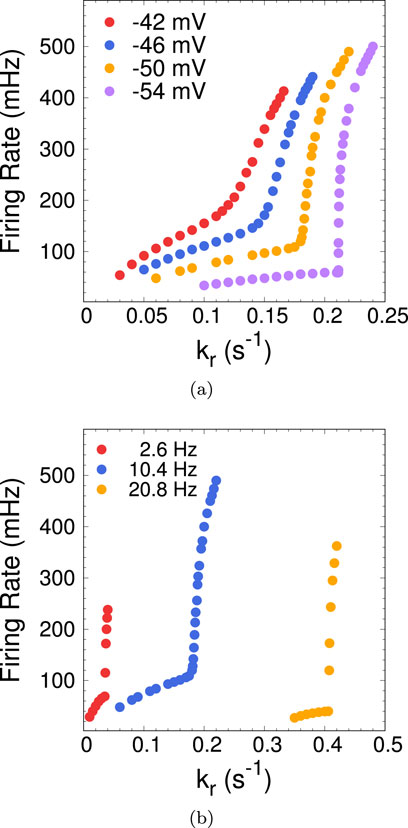
Figure 6. (A) Firing rate as a function of
The phase diagram of Figure 2A is a slice through a higher dimensional parameter space with
2.3 2D system and bifurcations
Displaying phase space trajectories often gives better insight into the nature of a bifurcation, however the dynamical system (1), (2) is 3D, which makes phase space representations cumbersome. We can make progress by noting that, in the regime
To reduce the system to 2D, we consider that interconversion between open and closed states of the channels is faster than all other time scales in the system; we may then assume that the balance
Writing the total channel conductance
where we have introduced dimensionless variables as mentioned above, dropping the tilde, so
In reducing the dynamical system from 3D to 2D, we used the general idea that “fast variables” can be considered to attain their “equilibrium value” for time scales over which the “slow variables” vary. This same procedure is used for example in [15], as well as by Morris and Lecar [8]. The assumption is that the reduction does not change the qualitative behavior of the system. While it is not easy to give a rigorous justification, below we show numerically that the 2D system indeed displays dynamic behavior corresponding to all four regions in the diagram of Figure 2A. Following [15], we show in Figure 7 time traces for the 3D and the 2D system, in Region I. As expected, there is qualitative similarity, but quantitative differences, in the amplitude and frequency of the oscillations, for the two models.
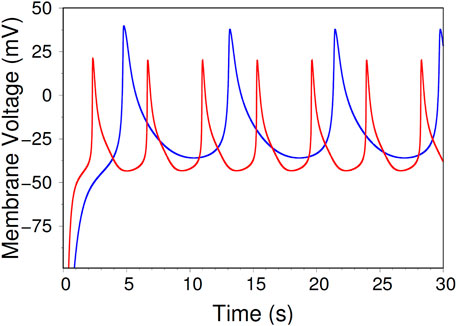
Figure 7. A visual comparison of AP trains in the 3D system (Equations 2, 3, blue) to AP trains in the 2D system (Equations 5, 6, red). The blue trace is the same as in Figure 3, while the red trace is generated by taking the same initial conditions as the blue trace (
Referring to the phase diagram of Figure 2A as a guide, let us explore the nature of the transitions as we move along a horizontal line in that phase diagram (i.e. we vary
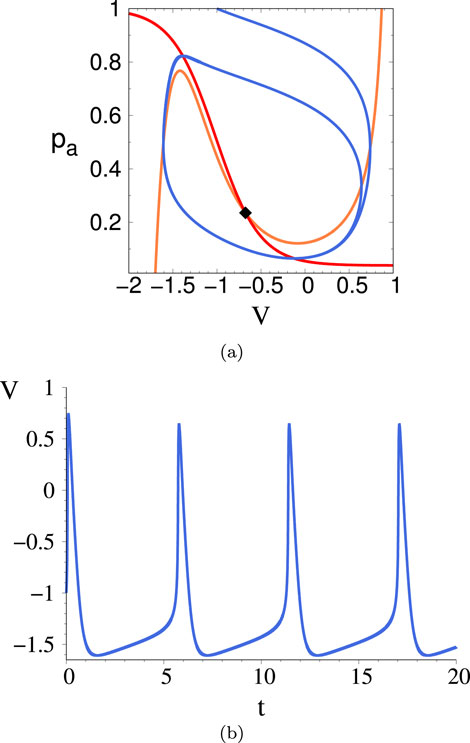
Figure 8. (A) Phase space trajectory (blue) in the
For
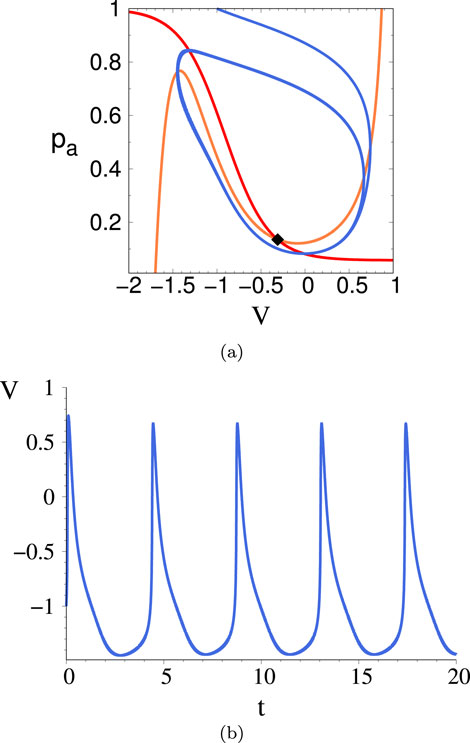
Figure 9. (A) Phase space trajectory displaying the limit cycle for
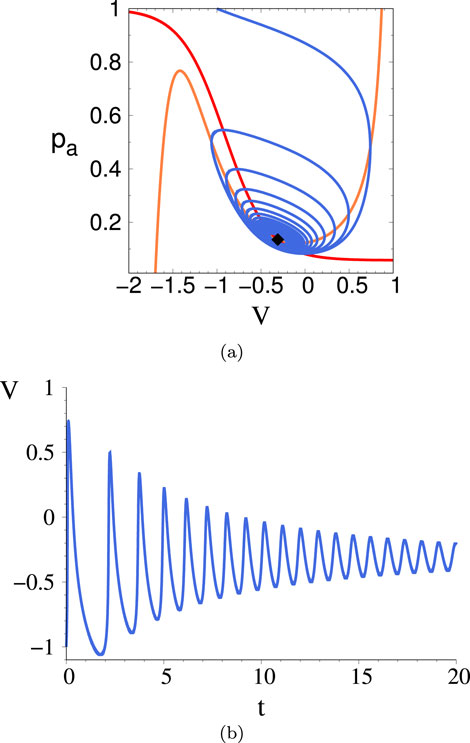
Figure 10. (A) Phase space trajectory for
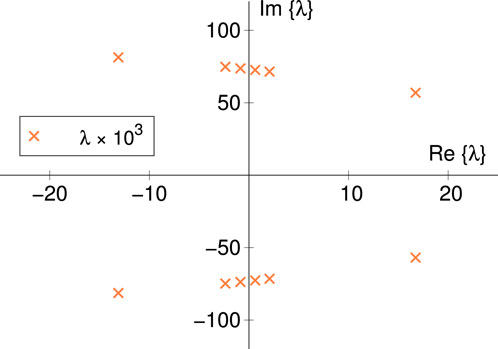
Figure 11. Eigenvalues
For
In general, the behavior of the system is independent of the choice of initial conditions. Since there is only one fixed point, for any starting point
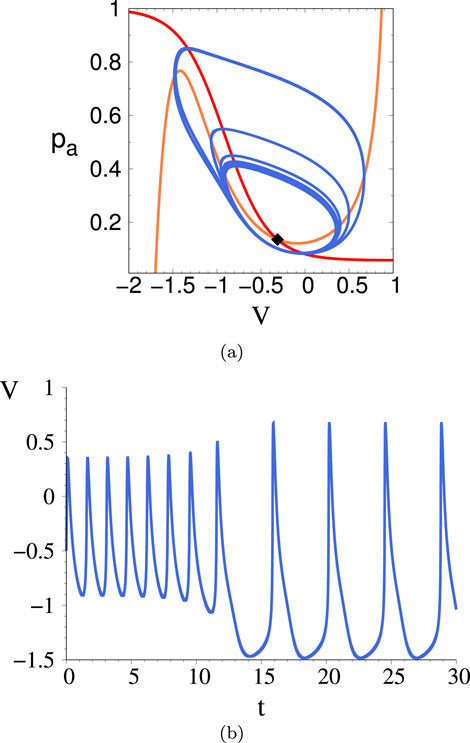
Figure 12. (A) Phase space trajectory for
Moving up in the phase diagram, i.e. increasing
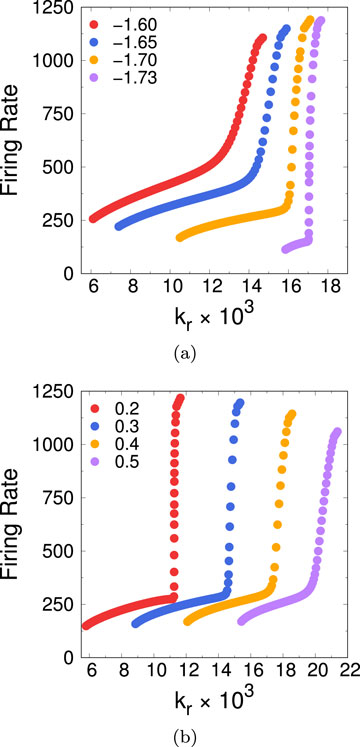
Figure 13. (A) Firing rate for the reduced 2D model as a function of
In Figures 14, 15 we show representative phase space trajectories and time traces across the Region I
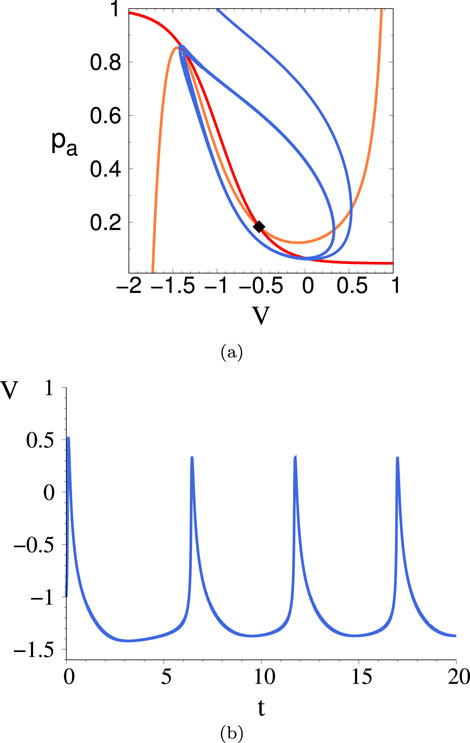
Figure 14. Phase space trajectory (A) and corresponding time trace (B) for the 2D system just prior to the I
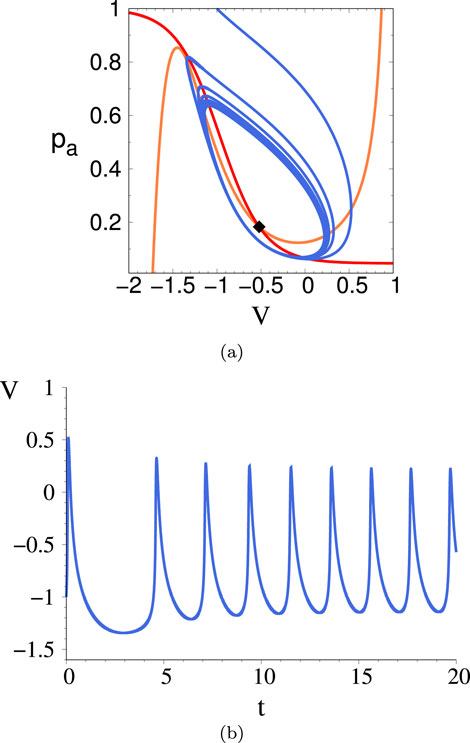
Figure 15. Phase space trajectory (A) and corresponding time trace (B) for the 2D system just after the I
In addition to the subcritical Hopf bifurcation, the system also contains a few other bifurcations which are similar to those of the Morris-Lecar system [12, 13]. Using
The transitions described above may of course be explored following different trajectories in parameter space. Since for the 2D system (5), (6) the control parameters which have to do with channel rates are
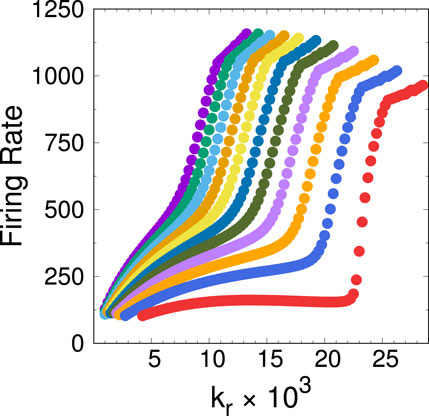
Figure 16. The transition from region I to region II in the 2D system, explored along trajectories with fixed
2.4 Analogy to the magnetization transition
The plots of Figures 6, 13 present a qualitative resemblance to a number of equilibrium phase transitions. In Figure 6A, the firing rate
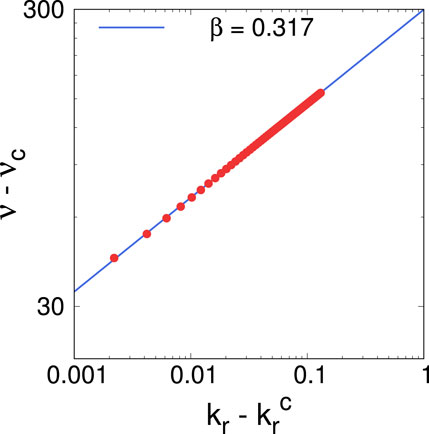
Figure 17. Scaling of the firing rate as a function of the recovery rate, for Region II of the purple curve in Figure 6A. The slope of the linear fit (blue line) gives a scaling exponent
For finite field
To investigate the occurrence of hysteresis in our model of the AA, we simulate the 2D voltage independent system in a slightly different way. We start the system in some initial state with
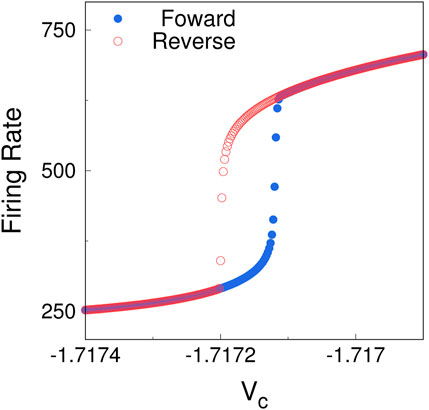
Figure 18. Hysteresis in the firing rate of the simulated 2D system (5), (6). Starting with
3 Experimental results
3.1 Measured rates
The purpose of mapping out the behavior of the AA dynamical system in parameter space is to provide guidance for the experiments in order to realize interesting dynamical behavior and understand the phenomenology. We are interested in knowing which of the dynamical phases can be accessed with the present experimental setup. Further, knowledge of the phase diagram in parameter space will guide the choice of alternative channels to improve the AA. To make progress, we need to know roughly where the present experimental system lies in the phase diagram described in Section 2. Though rates for the KvAP have been measured before [7], these measurements are not easily mapped onto our system, as they are more complex (higher dimensional in parameter space) in order to account for the physical gating properties of the channels; whereas our model only has the minimal complexity needed to retain the core dynamics.The equilibrium opening and closing rates of KvAP in the AA setting have been measured in a previous work [14], so we turn our attention to the inactivation and recovery rates
To measure
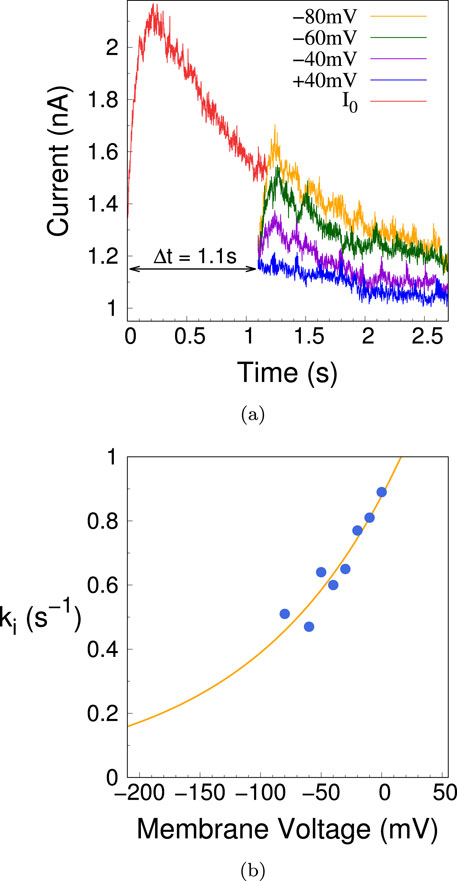
Figure 19. (A) Representative time traces of the current corresponding to the voltage clamp protocol used to measure the inactivation rate
To measure the recovery rate
From these measurements, the resulting effective rates for the model of Figure 1 are (in s-1;
These rates can be qualitatively compared to the voltage independent phase diagram of Figure 2A by considering the range of possible voltages of our system. Typical experimental conditions are bounded from below by the resting voltage and above by the Nernst potential: −200 mV
3.2 Connected AAs
In the future it will be interesting to build networks of interconnected AAs. As a first step, we connected two AAs through electronic “synapses”. Our synapse is a current clamp which takes as command voltage the voltage in the “pre-synaptic” axon and, if this voltage is above a set threshold, delivers a proportional current into the “post-synaptic” axon (similar to a much simplified version of the “dynamic clamp” used in some electrophysiology experiments [19]). Thus a synapse is characterized by two parameters: the threshold voltage
The simplest system that can be made with this setup consists of two AAs connected by a single “excitatory” synapse
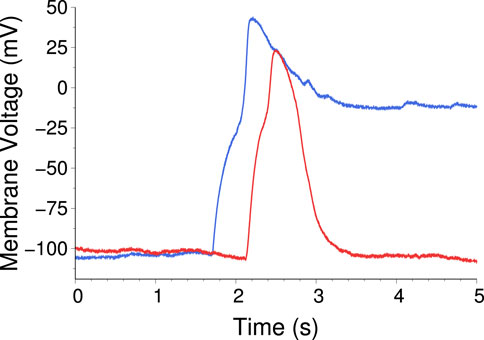
Figure 20. Time traces from two AAs connected by one excitatory synapse. Blue is
As shown in the previous section, as a result of the inactivation dynamics of the KvAP channel, a single AA does not sustain autonomous oscillations for a constant input current. Nevertheless, with two such AAs it is in principle possible to construct an oscillator. For this purpose we add a second synapse to the previous construction, providing inhibitory feedback. Now AA1 connects to AA2 through an excitatory synapse
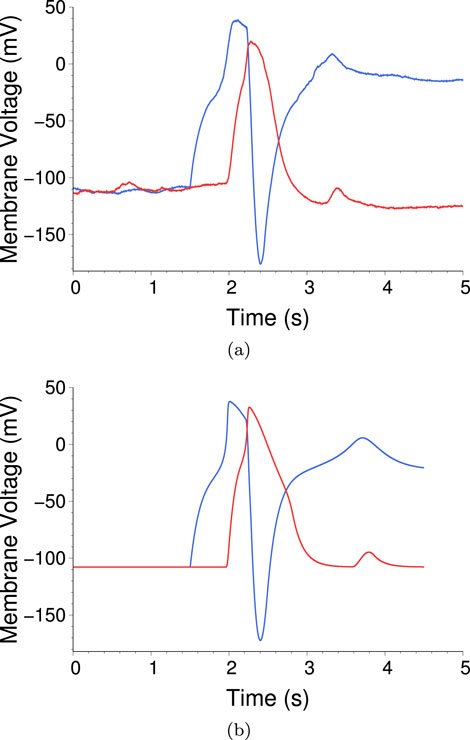
Figure 21. (A) Time traces of the voltage from two AAs connected by one excitatory and one inhibitory synapse, in a feedback loop. To initiate the process, CLVC1 is raised above threshold at
The rising part is similar to Figure 20, however now when
In Figure 21B we show time traces for
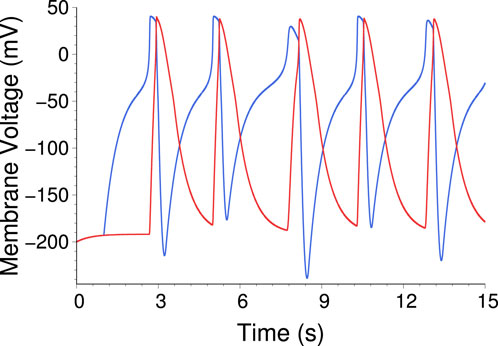
Figure 22. Time trace from a simulation of the two axon system, showing autonomous oscillations (AP trains). Blue trace is
4 Discussion
The dynamical system (1), (2), with voltage dependent rates, describes the dynamics of the physical AA well [4]. The voltage dependence of the rates is taken of the Arrhenius form,
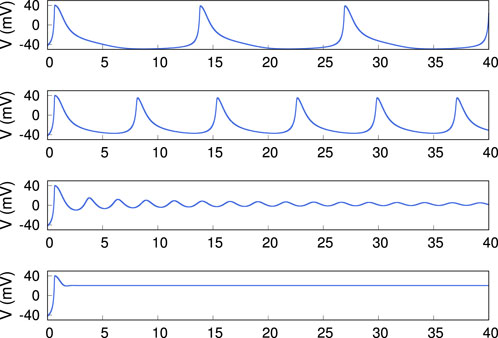
Figure 23. Representative time traces of the model with voltage dependent recovery and inactivation rates in the form of (3). The x-axis is time (s), and the traces from top to bottom are representative of regions I
The simplified Hodgkin-Huxley type model we use captures the dynamics of the experimental system quite well, with a minimum number of parameters. The reduced number of parameters in the model allows us to map out important features of the system’s phase diagram in parameter space (Figure 2A). The main conclusion is that the AA, a synthetic biology system consisting of one voltage gated channel species with inactivation, is dynamically equivalent to the biological system of two voltage gated channel species without inactivation (the Morris-Lecar system). Everything the Morris-Lecar system can do, the AA can do, in principle. This raises the question of whether action potentials dependent on a single gated channel species exist (or have existed) in nature. As far as we know, no such system has been identified thus far.
We have discussed in detail some of the bifurcations which take the system from one region of the phase diagram to another; these have a universal character, which therefore should be maintained across different systems, from the AA to the Morris-Lecar dynamical system to the barnacle muscle fiber to the rat neuron. Indeed, the Hopf bifurcation corresponding to the onset of AP trains, which here we discuss for the AA (Section 2.3), is well established for the neuron [9]. In general, Hopf bifurcations drive the onset of oscillatory behavior in a variety of dynamical systems. One example is protein expression networks [20]; while the mechanism underlying the oscillations varies, it is generally associated with negative feedback loops or time delays [21, 22]. Less established is the transition separating regions I and II in the phase diagram, in fact we do not find that it is discussed in the literature either in theory or experiments. Morris and Lecar mention “small” damped oscillations in their system [8], which may refer to the behavior across regions II and III.
A qualitative analogy with the magnetization transition prompted us to look for hysteresis, which is indeed present.
Hysteresis is an important characteristic of many dynamical systems. It is normally associated with discontinuous transitions; for example, a sequence of transitions in Taylor - Couette flow, associated with discontinuous jumps in the flow pattern, is hysteretic [23]. On the other hand, driven magnetic systems display continuous behavior and hysteresis, due to long relaxation times [24]. Hysteresis may be essential to confer robustness to biological clocks [15, 25].
We have discussed these bifurcations mainly as a function of the inactivation and recovery rates of the channels,
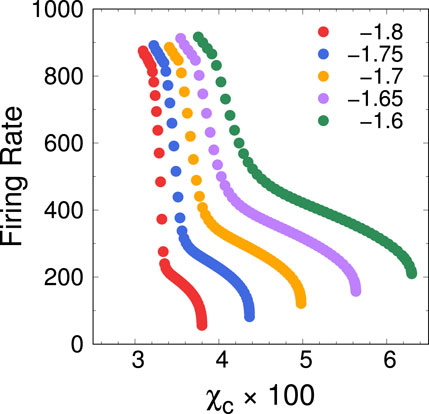
Figure 24. Firing rate of the AA as a function of the clamp conductance,
Finally, we present experiments where we connect two AAs through electronic “synapses” - a step towards constructing networks. In the configuration corresponding to Figure 20, a step perturbation of AA1 (the “input”) evokes a single shot AP in AA2 (the “output”). In terms of signal processing, suppose AA1 was a light sensitive channel, and the input consisted of a (slowly) blinking light. The system would encode each event of the light turning on into a single standardized AP (independent of the duration of the “on” phase), which could be further propagated down a network. By connecting two AAs in a feedback loop, it should be possible to construct an autonomous limit cycle oscillator. Figure 21A displays an attempt which was not quite successful, but indicates the feasibility of such a system. The difficulty lies in the fragility of the experimental system, which makes it difficult to tune parameters “on the fly”. Our plan going forward is to both demonstrate this oscillator and also improve robustness.
The parameters which are currently directly controlled in the experiments are the clamp voltage and clamp conductance. Though much more cumbersome, the inactivation and recovery rates for a given channel could in principle be modified as well. Previous work has shown that different compositions of the lipid membrane has an affect on the kinetics of the channel [7], the caveat being that there is no quantitive way of knowing how the rates will change in response to a change in membrane composition. Channel kinetics also change as a function of temperature [26], which could be another way to indirectly tune the system. A combination of such methods may be an effective strategy for exploring the parameter space experimentally. To expand the system beyond a two axon setup, further work is needed due to the difficulty in maintaining multiple functioning AAs, owing to the fragility of the lipid membrane setup. Possible strategies include using hydrogels to stabilize the system [27, 28], or perhaps moving from a suspended lipid system to a supported lipid system.
Data availability statement
The raw data supporting the conclusions of this article will be made available by the authors, without undue reservation.
Author contributions
ZP: Writing–original draft, Methodology, Investigation, Formal Analysis, Data curation, Conceptualization. GZ: Writing–review and editing, Writing–original draft, Supervision, Formal Analysis, Conceptualization.
Funding
The author(s) declare that financial support was received for the research, authorship, and/or publication of this article. The publication fee is paid by the Department of Physics and Astronomy, UCLA.
Conflict of interest
The authors declare that the research was conducted in the absence of any commercial or financial relationships that could be construed as a potential conflict of interest.
Publisher’s note
All claims expressed in this article are solely those of the authors and do not necessarily represent those of their affiliated organizations, or those of the publisher, the editors and the reviewers. Any product that may be evaluated in this article, or claim that may be made by its manufacturer, is not guaranteed or endorsed by the publisher.
Supplementary material
The Supplementary Material for this article can be found online at: https://www.frontiersin.org/articles/10.3389/fphy.2024.1452241/full#supplementary-material
References
1. Gerstner W, Kreiter AK, Markram H, Herz AVM, 94, 12740–1. doi:10.1073/pnas.94.24.127401997).Neural codes: firing rates and beyond, Proc Natl Acad Sci U S A,
2. Ariyaratne A, Zocchi G. Toward a minimal artificial axon. J Phys Chem B (2016) 120:6255–63. doi:10.1021/acs.jpcb.6b02578
3. Vasquez HG, Zocchi G. Coincidences with the artificial axon. EPL (2017) 119:48003. doi:10.1209/0295-5075/119/48003
4. Pi Z, Zocchi G. Critical behavior in the artificial axon. J Phys Commun (2021) 5:125013. doi:10.1088/2399-6528/ac43d0
5. Prescott SA, Koninck YD, Sejnowski TJ. Plos Comput Biol (2008) 4:e1000198. doi:10.1371/journal.pcbi.1000198
6. Hodgkin AL, Huxley AF. A quantitative description of membrane current and its application to conduction and excitation in nerve. J Physiol (Lond.) (1952) 117:500–44. doi:10.1113/jphysiol.1952.sp004764
7. Schmidt D, Cross SR, MacKinnon R. A gating model for the archeal voltage-dependent K+ channel KvAP in DPhPC and POPE:POPG decane lipid bilayers. J Mol Biol (2009) 390:902–12. doi:10.1016/j.jmb.2009.05.062
8. Morris C, Lecar H. Voltage oscillations in the barnacle giant muscle fiber. Biophys J (1981) 35:193–213. doi:10.1016/s0006-3495(81)84782-0
10. Ruta V, Jiang Y, Lee A, Chen J, MacKinnon R. Functional analysis of an archaebacterial voltage-dependent K+ channel. Nature (2003) 422:180–5. doi:10.1038/nature01473
11. Qi X, Zocchi G. Kink propagation in the artificial axon. EPL (2022) 137:12005. doi:10.1209/0295-5075/ac44e2
12. Tsumoto K, Kitajima H, Yoshinaga T, Aihara K, Kawakami H. Bifurcations in morris–lecar neuron model. Neurocomputing (2006) 69:293–316. doi:10.1016/j.neucom.2005.03.006
13. Liu C, Liu X, Liu S. Bifurcation analysis of a Morris–Lecar neuron model. Biol Cybernetics (2014) 108:75–84. doi:10.1007/s00422-013-0580-4
14. Ariyaratne A, Zocchi G. Nonlinearity of a voltage-gated potassium channel revealed by the mechanical susceptibility. PRX (2013) 3:011010. doi:10.1103/physrevx.3.011010
15. Vilar JMG, Kueh HY, Barkai N, Leibler S. Mechanisms of noise-resistance in genetic oscillators. PNAS (2002) 99:5988–92. doi:10.1073/pnas.092133899
16. Strogatz SH. Nonlinear dynamics and chaos. Westview Press, Boulder, Colorado: Westview Press (2015).
17. Goldenfeld N. Lectures on phase transitions and the renormalization group (frontiers in physics v. 85). CRC Press, Boca Raton, Florida: CRC Press (2018).
19. Wilders R. Dynamic clamp: a powerful tool in cardiac electrophysiology. The J Physiol (2006) 576:349–59. doi:10.1113/jphysiol.2006.115840
21. Lahav G, Rosenfeld N, Sigal A, Geva-Zatorsky N, Arnold J Levine AJ, Elowitz MB, et al. Dynamics of the p53-Mdm2 feedback loop in individual cells. Nat Genet (2004) 36:147–50. doi:10.1038/ng1293
22. Bar-Or RL, Maya R, Segel LA, Alon U, Levine AJ, Oren M. PNAS (2000) 97:11250. doi:10.1073/pnas.210171597
23. Coles D. Transition in circular Couette flow. J Fluid Mech (1965) 21:385–425. doi:10.1017/s0022112065000241
24. Chakrabarti BK, Acharyya M. Dynamic transitions and hysteresis. Rev Mod Phys (1999) 71:847–59. doi:10.1103/revmodphys.71.847
25. Barkai N, Leibler S. Circadian clocks limited by noise. Nature (1999) 403:267–8. doi:10.1038/35002258
26. Ranjan R, Logette E, Marani M, Herzog M, Tâche V, Scantamburlo E, et al. A kinetic map of the homomeric voltage-gated potassium channel (kv) family. Front Cell Neurosci (2019) 13:358. doi:10.3389/fncel.2019.00358
27. Jeon T-J, Malmstadt N, Schmidt JJ. Hydrogel-encapsulated lipid membranes. J Am Chem Soc (2006) 128:42–3. doi:10.1021/ja056901v
Keywords: action potential, ionics, excitable media, dynamical system, bioinspired
Citation: Pi Z and Zocchi G (2024) Action potentials in vitro: theory and experiment. Front. Phys. 12:1452241. doi: 10.3389/fphy.2024.1452241
Received: 20 June 2024; Accepted: 01 October 2024;
Published: 24 October 2024.
Edited by:
Sergio Alonso, Universitat Politecnica de Catalunya, SpainReviewed by:
BingKan Xue, University of Florida, United StatesNeelima Gupte, Indian Institute of Technology Madras, India
Copyright © 2024 Pi and Zocchi. This is an open-access article distributed under the terms of the Creative Commons Attribution License (CC BY). The use, distribution or reproduction in other forums is permitted, provided the original author(s) and the copyright owner(s) are credited and that the original publication in this journal is cited, in accordance with accepted academic practice. No use, distribution or reproduction is permitted which does not comply with these terms.
*Correspondence: Giovanni Zocchi, em9jY2hpQHBoeXNpY3MudWNsYS5lZHU=
 Ziqi Pi
 Giovanni Zocchi