- 1 Department of Printing and Packaging Engineering, Shanghai Publishing and Printing College, Shanghai, China
- 2 School of Optical-Electrical and computer Engineering, University of Shanghai for Science and Technology, Shanghai, China
In the process of color reproduction, the accurate prediction of color halftone images’ characteristics and the development of a spectral reflectance prediction model are pivotal for print image device characterization and quality control. Traditional models such as Murray-Davis, Clapper-Yule, Yule-Nielsen, and their modifications have been preferred for their high accuracy in color and spectral predictions. However, they overlook the role of black ink in CMYK printing, limiting their effectiveness in predicting the spectral properties of four-color inks and demonstrating notable in-accuracies in light color tones. A hybrid model combining a prior model based on physics with a deep neural network has been proposed. On the input side, the Neugebauer equation and the superposition of 4-color inks are considered, and the 4-color CMYK input is expanded to 16 Neugebauer primary colors. On the output side, the PCA dimensionality reduction algorithm extracts 7 principal components with a contribution of 99.99%. Finally, the Improved Whale Optimization Algorithm (IWOA) is employed to optimize the parameters of the deep neural network (DNN) model. The experimental results show that our model significantly outperforms traditional methods in reducing CIEDE2000 color differences, enabling the early prediction of spectral colors in printed images and improving print image quality. What is more, the proposed model does not need to take into account the effect of dot gain in the printing process.
1 Introduction
The advancement of digital imaging and printing technologies has notably broadened the scope of color management challenges associated with color image reproduction. The array of media types, ranging from different substrates like paper and plastic to a variety of ink formulations and printing techniques, presents a multifaceted interplay of elements affecting the final color outcome. Crucially, halftoning method, such as mutually rotated clustered dots and error diffusion, significantly impacts color representation. To maintain color accuracy across diverse printing systems, it is imperative to develop a sophisticated spectral prediction model that is rigorously calibrated using a select group of test samples.
Spectrum-based color management models offer a solution by using spectral data (400–700 nm) to provide a more detailed color description, including hue, saturation, and brightness, and to account for variations in lighting conditions. These models enable high-fidelity color reproduction, overcoming limitations of traditional methods and improving the accuracy of printed color under different lighting conditions. The goal of spectral reflectance prediction in printing is to optimize ink coverage for desired color, using models to predict final image color from control values like dot area coverage. Advancements in digital control technology have led to reduced color deviations and expanded research into spectrum reproduction for better color control in printing.
In 1953, Clapper and Yule proposed a method for color prediction of printed images by simulating the interaction between light and halftone images by means of physical optics [1]. It is worth noting that this model, in combination with the later method proposed by Hersch et al. that takes into account the dot gain of the ink, also provides good predictions, especially when halftone screening frequency is high [2–6]. It is important to note that these models require the printing of specific dot-area rates and the measurement of the corresponding spectral reflectance to calibrate the model. Since light refraction and refraction at the print-air interface are explicitly taken into account, the illumination and observation geometry chosen at the time of measurement are used as model parameters in the equations. Many scholars related to printing color have studied and improved the prediction accuracy and results of these models in various evaluations, which should be expected to yield the desired results. To address challenges in spectral color prediction, researchers have developed various models, initially grounded in optical principles such as the [7–9], Neugebauer [5, 6, 10], Clapper-Yule models [11–13], Kubelka-Munk theory [14–16], and the Yule-Nielsen modified spectral Neugebauer (YNSN) model [8, 17], along with their variations [18–22]. These models often incorporate an empirical factor to account for optical interactions, yet their practical application is hindered by the complexity of the printing process. To mitigate these limitations, subsequent approaches have integrated statistical methods, including regression analysis and artificial neural networks (ANN) [23], to adapt to various printing conditions.
Recent advancements in color prediction have been marked by several noteworthy contributions. Moon et al. proposed a deep neural network (DNN) model specifically designed for spot color prediction [24], which utilizes collected and preprocessed printing data. By training the model with the CIEDE2000 color difference formula as the loss function, they effectively enhanced the accuracy of color prediction in packaging printing. In another significant development, Chen and Urban constructed a multi-printer deep learning framework that harnesses data from various printers to refine optical printer models [25]. This approach successfully reduces the number of required training samples and improves output consistency across different printers, which is particularly important for high-precision applications in 3D printing. Akanuma et al. focused on enhancing color matching for coatings by integrating the Kubelka-Munk (K-M) model with machine learning techniques [26]. Their comparative experiments revealed that the Extreme Gradient Boosting (XGBoost) model outperformed others in correcting spectral reflectance predictions. Zhu et al. utilized a Pix2Pix Generative Adversarial Network (GAN) framework, training a model with data collected via the DigiEye system [27]. This model successfully enabled effective color prediction for digital printing on silk, providing a novel approach for managing color in silk printing applications. In particular, existing models exhibit limitations in accurately predicting the use of black ink in printers.
This study introduces a hybrid approach that combines Neugebauer primary colors with an optimized Whale Optimization Algorithm-Deep Neural Network (WOA-DNN) machine learning model to predict printed image reflection. By measuring spectral reflectance values with spectrophotometry and relating them to CMYK values through a deep neural network (DNN) model, this research represents a significant advancement in the field of color reflectance prediction. It addresses the limitations identified in recent studies and provides a foundation for more accurate and reliable color reproduction in printing technologies. The structure of the paper is as follows: The paper is organized as follows: Section 2 introduces the data standards and printing methods used for testing, printing conditions, and measurement conditions, describes the PCA dimensionality reduction algorithm, the improved whale optimization algorithm developed in this study, and the proposed DNN model. Section 3 covers model evaluation metrics, predictive result analysis, and discussion of result analysis. Section 4 summarizes the main findings of this study and suggests future directions for application.
2 Materials and methods
2.1 Data acquisition
In the experiment, an IT8.7/5 (TC1617x) printer test chart was utilized. The IT8.7/5 (TC1617x) Printer Test Chart is a recently developed target utilized to characterize CMYK printers. The IT8.7/5 (TC1617x) Printer Test Chart contains 1,617 patches, the same number as IT8.7/4. However, 29 duplicate patches have been removed and replaced by 29 patches from columns 4 and 5, which were not present in IT8.7/4. As a result, the IT8.7/5 (TC1617x) Printer Test Chart offers 1,617 different colors.
The IT8.7/5 test chart was printed on the XL75 four-color offset press, manufactured by Heidelberg, Germany. The machine was purchased in 2008. Heidelberg Supermaster, Germany, was used as the printing plate maker. 200 LPI AM screening was used, with a dot pattern for the square and round mesh. The screening resolution was 2,540 dpi. The test charts were printed on 157 g/m2 double-coated art paper from Asia Pulp & Paper Co., Ltd. (APP). The printing environment was maintained at a temperature of 23–25°C, with a humidity of 55% ± 5, a pH value of 4.8–5.3, an alcohol concentration of 10% by volume, and a dampening solution temperature set at 10–12°C.
The printing sequence used was black, cyan, magenta, and yellow. The printed target follows the ISO 15339-2-2015 CRPC6 standard, as shown in Table 1.
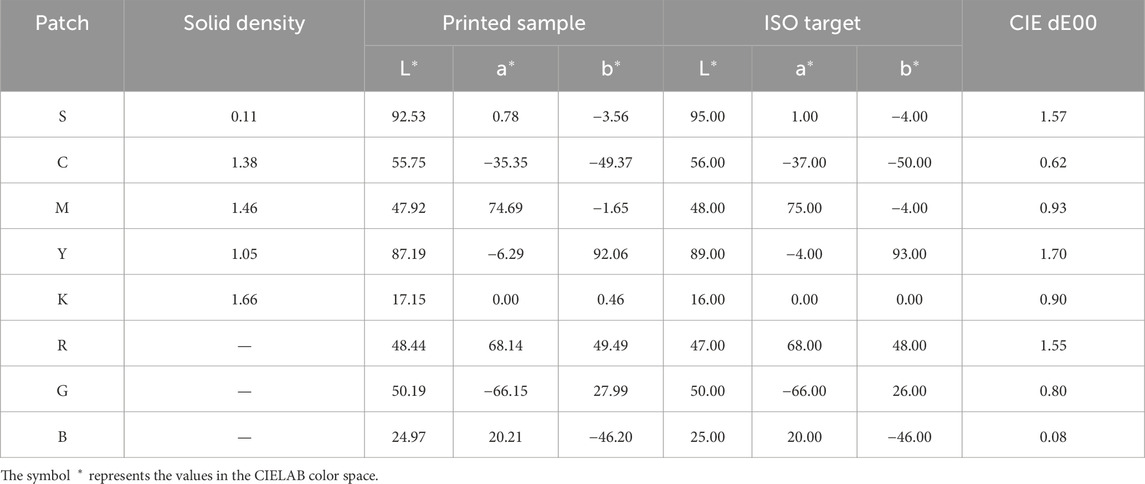
Table 1. The primaries color target and CIEDE00 color difference between printed samples and the ISO 15339-2 2015 CRPC6 standards.
The primaries color target and CIEDE00 color difference between printed samples and ISO 15339-2:2015 CRPC6 standards. In the table, S represents the paper substrate, and C,M,Y,K,R,G,B represent the solid colors cyan, magenta, yellow, black, red, green, blue, respectively.
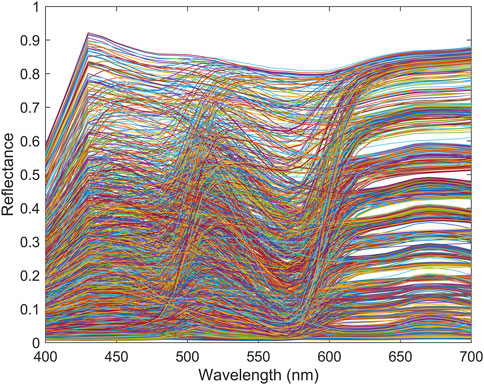
The printed paper was naturally dried for 1 hour prior to measurement to ensure that the colors were sufficiently dry. Each sheet was printed using the same target to ensure consistent results from print to print. The spectral reflectance measurements were carried out using an iSisXL2 spectrophotometer from xrite, United States, purchased in January 2023. The photometer of the measurement device has a 45/0 ring geometry and measures at 10 nm intervals in the range of 400–700 nm. Chromaticity values are generated according to D50 illumination and the CIE 1931 2° standard observer. Figure 1 displays the spectral reflectance of IT8.7/5 color patches from 400 nm to 700 nm.
2.2 Dimensionality reduction: PCA
The PCA method is a data dimensionality reduction algorithm, used as a preprocessing method for the prediction model. It explains most of the interpretation of the original sample through a few common key factors to reduce the computational complexity of the model. In the prediction model for printing image spectra, assuming that the original spectral data contain n-dimensional features, the PCA method maps the n-dimensional features described in the original data to the d-dimensional principal components. The d-dimensional principal components use fewer data indicators to describe most of the information contained in the original data, achieving the purpose of reducing the dimensionality of the data. Assuming that the number of samples is N, with n-dimensional features, the original data matrix X is described as in Equation 1.
where
Using the PCA method, the characteristics of dimensions n can be mapped in dimension d to obtain d new variables, where d ≤ n; the new variables obtained are called the dth principal component
where
2.3 Deep neural network (DNN)
Machine learning is a technique for making decisions by learning previous results and relying on patterns. Machine learning applications fall into classification or regression categories. DNN is a standard technique for developing regression models and is widely used for both discrete and continuous pattern recognition. DNN parameters analyze various patterns to ensure optimal performance. DNNs commonly comprise a fully connected feedforward architecture, which incorporates an input layer, a hidden layer, and an output layer [24–26]. The input layer receives instances from the data set. Instances from the input layer are transmitted through multiple neurons, and the information is processed through a series of weighted connections and biases. Several activation functions, including Sigmoid and Relu, are used to carry out activation in the hidden layer. The number of target classes determines the size of the output layer. The output layer in regression DNN is designed to predict the spectral reflectance or other continuous quantities of a printed image. The prediction process in regression DNN focuses on minimizing the difference between the network’s predicted values and the actual measurements.
2.4 Improved whale optimization algorithm (IWOA)
The Whale Optimization Algorithm (WOA) was introduced in 2016, drawing inspiration from the distinctive “bubble-net” feeding strategy observed in humpback whales in their natural habitat [28, 29]. In the framework of WOA, each whale’s position represents a viable solution within the problem space. During the collective feeding process, individual whales exhibit three key behaviors: pinpointing the location of prey and encircling it, herding the prey using a bubble net, and participating in random exploration for prey. Assuming the position X of each whale in an n-dimensional solution space is
Each whale randomly selects between encircling and herding the prey, with an equal probability for both behaviors (p = 50% for each). When encircling the prey (p < 0.5), the whale swims towards the individual with the optimal position to approachthe prey and its position update formula is shown in Equation 3.
where,
When driving prey (p ≥ 0.5), in order to form a bubble net, the whale swims toward the prey in a spiral motion and its positional update equation is shown in Equation 4.
where b is a constant used to define the shape of the helix; L is a random number distributed in [-1,1].
In addition, the whale randomly looks around for prey, randomly selecting an individual in the group and approaching it, with its position updated by the equation:
where
The discrepancy between Equations 3, 5 lies in the differing range of values for parameter A. Specifically, the decision of whether whales opt to encircle the prey or engage in random search depends on this magnitude. When a whale opts to encircle the prey, the whale collective contracts its search radius to target the prey, facilitating a localized search approach, albeit with slower convergence. Conversely, when whales embark on a random search for prey, the whale population expands its search radius to encompass a broader scope, allowing a global search approach, resulting in faster convergence. However, with a linear decrease in the control parameter a, the algorithm’s convergence process is not linear. This discrepancy underscores that a linearly decreasing control parameter a does not accurately depict the optimization process. Hence, this paper proposes a novel control parameter based on the variation of the cosine law. The modified expression for this control parameter is as follows Equation 6.
where,
The control parameter a exhibits a slow decrease during the initial iterations, thus prolonging its retention at a relatively high value for an extended duration. Consequently, this maintains a high value for parameter A over a longer period, thereby enhancing search efficiency. In contrast, in the later iterations, a decreases rapidly, facilitating its persistence at a relatively low value for an extended period. Consequently, this maintains A at a low value for a prolonged duration, thus improving the search accuracy. Thus, this method effectively balances the algorithm’s global and local search capabilities, ensuring search stability.
2.5 Proposed model
The spectral model of the printing press is characterized by inputting the four characteristic quantities of cyan (C), magenta (M), yellow (Y), and black (K) into the color reflectance prediction model (
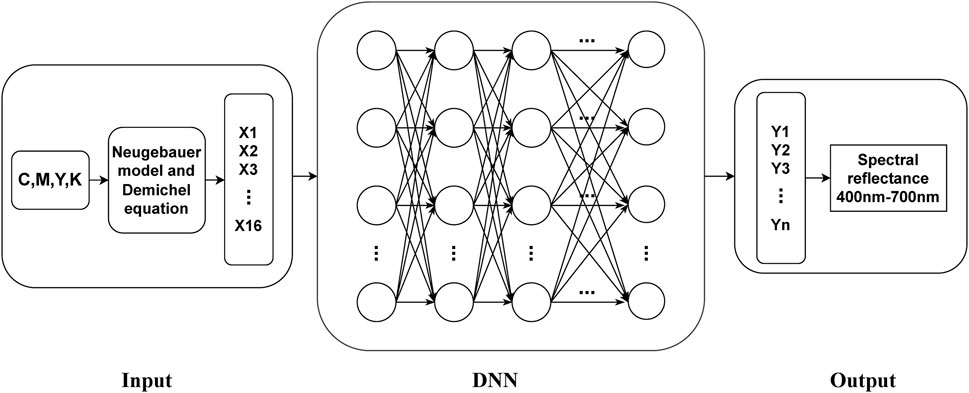
The proposed DNN model comprises an input layer, three to five hidden layers, and an output layer (Figure 2). The input layer includes neurons representing the sixteen input features, and the output layer includes seven neurons representing the seven principal components of the 31 spectral reflectance we want to predict.
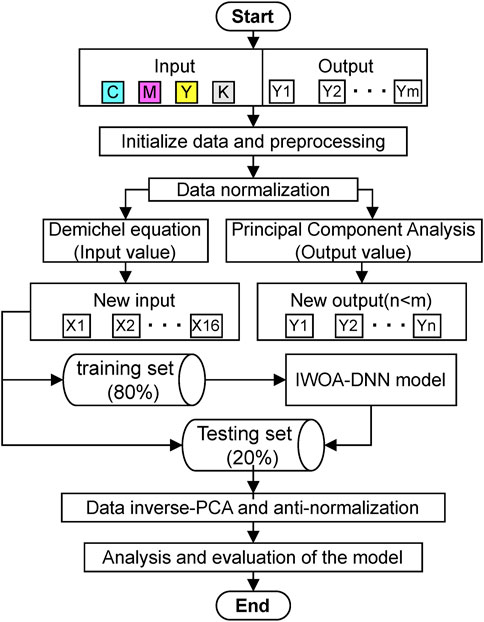
The framework of the proposed model for color reflectance is shown in Figure 3. The framework consists mainly of three parts. The first part is the preprocessing of the input data. This includes expanding the input data considering the ink overlay situation into 16 Neugebauer primary colors as new inputs based on the Demichel equation [30, 31]. The spectral dimension of the output data is then reduced by extracting principal components through PCA technology. The second part mainly involves training and testing the DNN model optimized by IWOA. The third part includes data denormalization, data analysis, and model evaluation.
The proposed model contains the following steps:
Step 1: Pre-processing of data. Before establishing the model, normalize all experimental data to [0, 1] using the Equation 7.
where
Step 2: Input data preparation. The process begins with the use of the IT8.7/5 (TC1617x) printer test chart, specifically designed to characterize CMYK printers. This chart facilitates the generation of a diverse range of printed colors by combining four basic inks in various proportions. The traditional CMYK inputs are expanded to encompass 16 Neugebauer primary colors. This expansion is based on the Neugebauer equation, which models the superposition of halftone inks with the objective of capturing more precise color interactions and improving prediction fidelity. For the four input data: cyan (C), magenta (M), yellow (Y) and black (K), 16 new input values are obtained according to the Neugebauer model and the Demichel Equation 8, which are calculated as follows:
Step 3: Data output processing. Given the high dimensionality of spectral data (31 dimensions), PCA is employed to reduce the dataset to 7 principal components. This reduction maintains 99.99% of the original information, effectively minimizing computational load while preserving essential spectral characteristics.
Step 4: DNN parameter optimization. The fundamental component of the prediction model is a deep neural network (DNN) that has been configured to learn the intricate relationships between the expanded Neugebauer primary colors and the corresponding spectral reflectance values. To further enhance the DNN’s performance, the Improved Whale Optimization Algorithm (IWOA) has been integrated to fine-tune the network’s hyperparameters. The IWOA optimizes the parameters of the hidden layers, thereby ensuring that the DNN achieves optimal predictive accuracy. Training sample data are taken from 80% of the data in the data set and the corresponding spectral data is taken as the model output. The IWOA optimization algorithm is applied to determine if the specified termination conditions are met, in order to obtain the optimal parameters that satisfy the conditions.
Step 5: Build the DNN regression model. The IWOA iteratively adjusts the DNN’s parameters based on a fitness function designed to minimize prediction errors (e.g., CIEDE2000 color differences). This optimization process ensures the model is precisely calibrated to the training data. The optimal parameters obtained in step [4] are used to establish the prediction model. The prediction model is then used to predict the samples of the test set.
Step 6: Model evaluation. Apply the hybrid PCA-IWOA-DNN model for prediction and perform inverse principal component processing and reverse normalization processing on the output results to obtain the RMSE and color difference for the test set and training set, respectively, to evaluate the model. The performance evaluation indicators for the prediction model are RMSE and CIE DE2000 [32].
3 Results and analysis
3.1 Chromaticity evaluation method for color difference
The CIELAB average color differences (ΔEab) is a colorimetric assessment metric that is appropriate to evaluate color under commonly used CIE illuminations, such as A, D50, and D65. This metric is derived from the CIELAB color difference and is critical to evaluating colorimetric precision [33]. The smaller the difference, the greater the precision. Color scientists have developed four commonly used color difference formulas, CIELAB, CMC (l:c), CIE94, and CIEDE2000, for evaluating color differences in the color field. Among them, CIEDE2000 is currently the color difference formula that best approximates the uniformity of human vision. In this paper, CIEDE2000 is employed as it represents the optimal approach for color control and evaluation of printed materials in the present era. The CIEDE2000 formula is shown in Equation 9.
where K L , K C , and K H are weighting coefficients for lightness, chroma, and hue, respectively. S L , S C , and S H are weighting functions for lightness, chroma, and hue, respectively. R T is the interaction term. K L = K C = K H = 1, as these specific values are recommended for printed images.
The color difference between the spectral predictions of the deep neural network (DNN) model and the measured spectral values was calculated using the CIEDE2000 formula. To train the model, the loss function employs the CIEDE2000 color difference formula, and the optimal weight coefficients are derived through the use of the improved WOA optimization algorithm, which is based on minimization of the color difference between the prediction and measurement sets.
3.2 Principal component analysis of data output processing
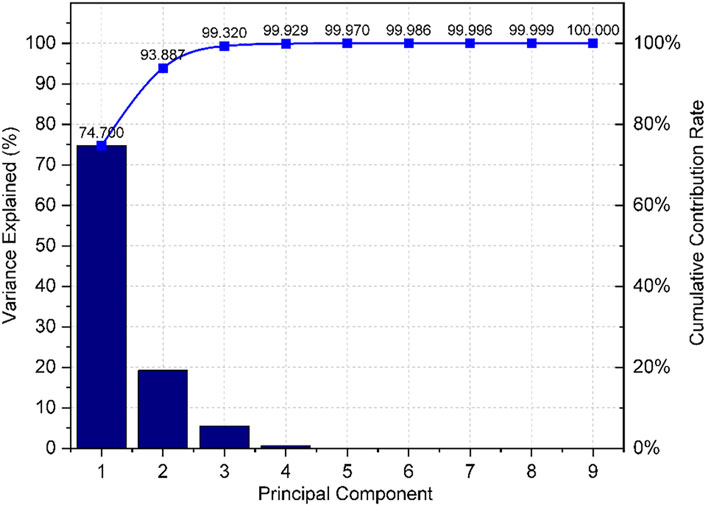
To reduce the 31 dimensions of the spectral data, PCA was performed to extract the principal components of the spectral dimensions while preserving most of the information from the original variables. It also reduces redundant data resulting from their cross-correlation. Table 2 presents the eigenvalues of the covariance matrix for the seven indicator variables, and Figure 4 illustrates the histogram that displays the principal components’ contribution. According to the analysis of Table 2; Figure 4, selecting 7 principal components results in a cumulative variance contribution rate of 99.99%. This indicates that these seven principal components capture the characteristic information of the 31 original variables. The use of PCA successfully reduces the dimensionality of the variable feature space compared to the 31 original output features of the sample data. The reduced- dimensional data retains most of the information from the original variables while reducing the data redundancy caused by their cross-correlation.
3.3 Model analysis
On the basis of the CMYK and spectral reflectance values acquired from the color target measured by the spectrophotometer, a hybrid PCA-IWOA-DNN model is established. The IT8.7/5 (TC1617x) test chart, consisting of 1,617 data samples, was used as training and validation sets. The color differences between the predicted and measured values of the sets were evaluated using two parameters: Root Mean Squared Error (RMSE) and CIEDE2000 (32). Colorimetric values were calculated for the illuminant A, D50, D65 and the CIE 1931 2° standard observer. With hidden layers set to [20 50 30], the prediction results are as shown in Table 3.
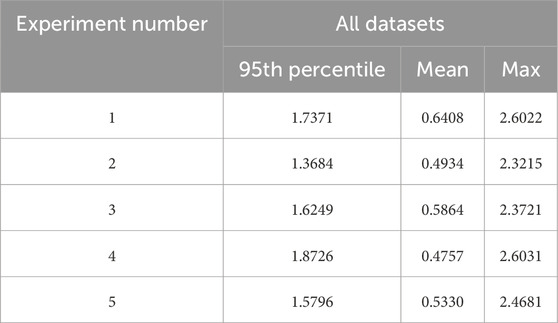
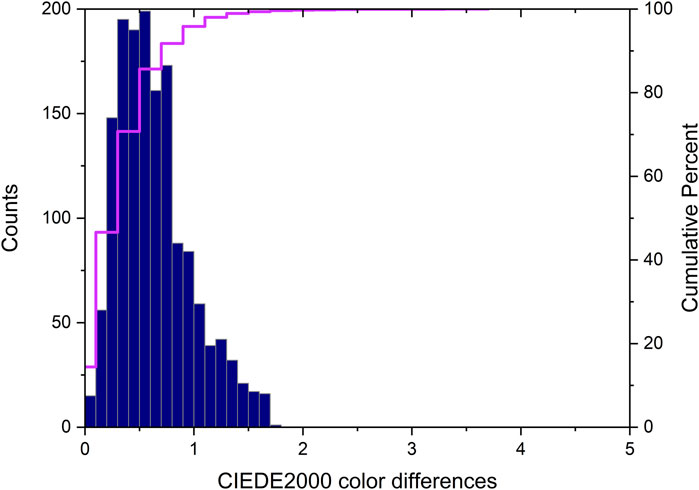
Table 3 shows that in five experiments under D50/2° illuminant, the minimum color difference is 0.0146, the optimal average color difference is 0.4757, and the optimal 95th percentile is 1.3684. The experimental results indicate that the overall color difference deviation is lower than the values reported in the literature. These color difference values are much lower than the common color difference requirements for the color reproduction of OK printed products in the printing industry. Figure 5 shows the distribution of the total CIEDE2000 color differences between the training and validation sets under a D50/2° light source in experiment 4. From Figure 5, it can be seen that the maximum color difference at the 95th percentile is 1.8726.
Figure 6 shows the comparison between the chromaticity coordinates of the test set and the chromaticity coordinates predicted by the proposed model. Through their coordinate distributions in the CIE1931xy chromaticity diagram, we can see that the predicted chromaticity coordinates and the actual chromaticity coordinates of the test set have a high degree of overlap, and better prediction results are obtained. The general overview of the mean and minimum color differences is shown in Table 3.
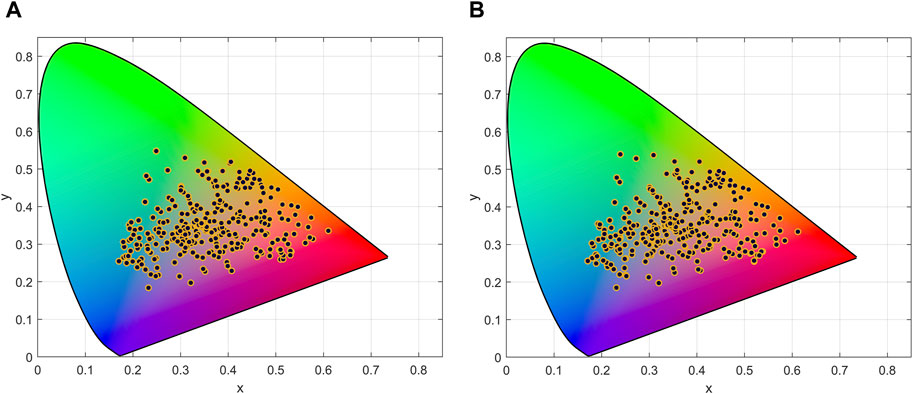
Figure 6. Chromaticity coordinates of the test set (A); Chromaticity coordinates predicted by the proposed model (B).
3.4 Comparison between the proposed model and other models
Compared to traditional Clapper-Yule and Williams-Clapper model [1, 11–13, 34], Yule-Nielson [9, 31, 35–38], ANN-BP neural networks [39], the hybrid PCA-IWOA-DNN model significantly improves the accuracy of fitting and the overall distribution of color differences while requiring fewer training samples. In Experiment 5, the prediction results of these models are shown in Table 4.
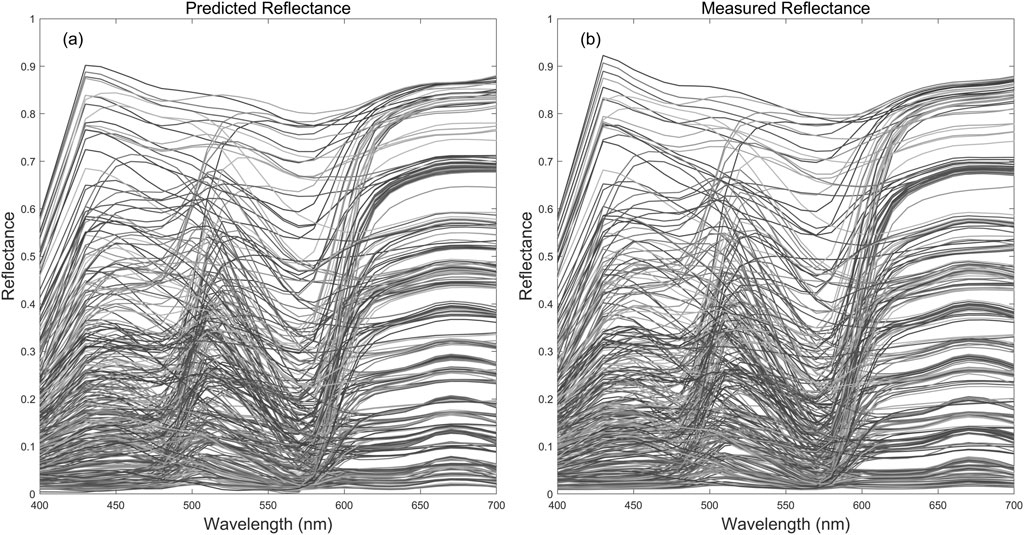
The method proposed in this study indicates the lowest color difference values under three common light sources, suggesting a potential improvement in color accuracy. Table 4 shows that the hybrid PCA-IWOA-DNN model effectively captures the complex relationships in the data, leading to improved accuracy in color difference prediction. The model uses an improved whale optimization algorithm for optimization and DNN for prediction. As shown in Figure 7, it compares the predicted spectral reflectance of the test set with the measured spectral reflectance.
Based on the results presented in Figure 7, our proposed models appear to outperform conventional models in predicting color reflectance and provide a better match between spectral predictions and actual measurements. The model performs exceptionally well in primary colors, light tones, and dark tones. The figure compares the predicted and actual reflectance values for various colors, including cyan, magenta, yellow, red, green, blue, black, and the corresponding halftone colors. The left side represents the model-predicted spectral reflectance, while the right side represents the actual spectral reflectance measured by the spectrophotometer. By comparing the color differences between the actual measurements and predicted values, the effectiveness of the prediction model can be validated, confirming its ability to predict the spectral reflectance characteristics of different shades of colors. As shown in the figure, the predicted reflectance values in the test set align well with the actual measured spectral reflectance values.
4 Conclusion
This study addresses the persistent challenges in colour prediction within the printing industry by developing an innovative hybrid spectral reflectance prediction model. The proposed model represents a significant advancement in the accuracy and reliability of colour reproduction in printed images through the synergistic combination of a physics-based prior model with an optimised Deep Neural Network (DNN) enhanced by the Improved Whale Optimization Algorithm (IWOA).
By conducting meticulously designed experiments with the IT8.7/5 (TC1617x) printer test chart, comprehensive datasets encompassing CMYK values and their corresponding spectral reflectance measurements were acquired. By employing principal component analysis (PCA) for dimensionality reduction, the 31-dimensional spectral data were effectively condensed into seven principal components, thereby retaining 99.99% of the original information. This reduction not only minimised data redundancy but also enhanced computational efficiency, thereby facilitating faster model training and prediction processes. The model exhibited remarkable performance when evaluated under the standardised D50/2° illuminant conditions. The minimum colour difference (CIEDE2000) observed was as low as 0.0146, with an optimal average ∆E00 of 0.4757 and a 95th percentile value of 1.3684. These results demonstrate that the proposed model exhibits superior accuracy compared to traditional models, including Clapper-Yule, Yule-Nielsen, and ANN-BP. The model’s capacity to predict spectral reflectance without accounting for dot gain further simplifies the printing process, making it both cost-effective and efficient, particularly in the context of CMYK printing, where black ink introduces significant complexity.
The objective of our future research is to expand the applicability of the model to a broader range of printing materials and techniques. This includes an evaluation of the model’s performance on specialized substrates, such as coated papers, plastic films, and various fabric types, as well as an integration of the model into high-resolution and hybrid printing systems. Furthermore, the model’s adaptability to evolving printing technologies will be enhanced by improving its computational efficiency, thereby enabling real-time color prediction and quality control. However, several challenges must be addressed, including the unique optical properties of different materials and the complex interactions of multiple printing parameters, such as ink viscosity, pressure, and speed. It is essential to ensure that the model remains robust against overfitting while maintaining high prediction accuracy across diverse data distributions.
Data availability statement
The raw data supporting the conclusions of this article will be made available by the authors, without undue reservation.
Author contributions
DT: Funding acquisition, Methodology, Project administration, Software, Validation, Writing–review and editing. JG: Conceptualization, Data curation, Investigation, Writing–review and editing. NS: Funding acquisition, Project administration, Supervision, Validation, Visualization, Writing–review and editing.
Funding
The author(s) declare that financial support was received for the research, authorship, and/or publication of this article. This research was funded by the Explorer Program of Shanghai (Grant Nos. 24TS1412400), the Natural Science Foundation of Shanghai (Grant Nos. 21ZR1422100), and the Natural Science Foundation of Jiangsu Province (Grant Nos. BK20210063). Their financial support, equipment and consumable donations are sincerely appreciated.
Conflict of interest
The authors declare that the research was conducted in the absence of any commercial or financial relationships that could be construed as a potential conflict of interest.
Publisher’s note
All claims expressed in this article are solely those of the authors and do not necessarily represent those of their affiliated organizations, or those of the publisher, the editors and the reviewers. Any product that may be evaluated in this article, or claim that may be made by its manufacturer, is not guaranteed or endorsed by the publisher.
References
1. Clapper FR, Yule JAC. The effect of multiple internal reflections on the densities of half-tone prints on paper. J Opt Soc America (1953) 43(7):600–3. doi:10.1364/JOSA.43.000600
2. RD Hersch, and AK Singla. An ink spreading model for dot-on-dot spectral prediction. Color and imaging conference. Springfield, USA: Society for Imaging Science and Technology (2006).
3. Brichon M, Bugnon T, Hebert M, Hersch R. Deducing ink spreading curves from reflection spectra acquired within printed color images. J Imaging Sci Technology (2009) 53(3):30502-1–7. doi:10.2352/J.ImagingSci.Technol.2009.53.3.030502
4. R Rossier, T Bugnon, and RD Hersch. Introducing ink spreading within the cellular yule-nielsen modified neugebauer model. Color and imaging conference. Springfield, USA: Society for Imaging Science and Technology (2010).
5. Bugnon T, Hersch RD. Recovering neugebauer colorant reflectances and ink-spreading curves from printed color images. Color Res and Appl (2014) 39(3):216–33. doi:10.1002/col.21800
6. Hersch RD. Spectral neugebauer-based color halftone prediction model accounting for paper fluorescence. Appl Opt (2014) 53(24):5380–90. doi:10.1364/AO.53.005380
7. M Hébert, and RD Hersch. Yule-nielsen approach for predicting the spectral transmittance of halftone prints. Color and imaging conference. Springfield, USA: Society for Imaging Science and Technology (2009).
8. R Rossier, and RD Hersch. Calibrating the ink spreading curves enhanced yule-nielsen modified spectral neugebauer model with the two-by-two dot centering printer model. Color imaging XIV: displaying, processing, hardcopy, and applications. California, United States: International Society for Optics and Photonics (2009).
9. Mazauric S, Hebert M, Fournel T. Revisited yule-nielsen model without fitting of the N parameter. J Opt Soc Am A Opt Image Sci Vis (2018) 35(2):244–55. doi:10.1364/JOSAA.35.000244
10. Sun B, Liu H, Zhou S, Cao C, Zheng Y. Modified spectral neugebauer model for printer characterization. Spectrosc Lett (2015) 48(9):660–8. doi:10.1080/00387010.2014.958243
11. Rogers G. A generalized clapper–yule model of halftone reflectance. Color Res and Appl (2000) 25(6):402–7. doi:10.1002/1520-6378(200012)25:6<402::aid-col4>3.3.co;2-y
12. Hebert M, Hersch RD. Extending the clapper-yule model to rough printing supports. J Opt Soc Am A Opt Image Sci Vis (2005) 22(9):1952–67. doi:10.1364/josaa.22.001952
13. Simonot L, Hebert M, Hersch RD. Extension of the williams-clapper model to stacked nondiffusing colored coatings with different refractive indices. J Opt Soc Am A Opt Image Sci Vis (2006) 23(6):1432–41. doi:10.1364/josaa.23.001432
14. Vargas WE, Niklasson GA. Applicability conditions of the kubelka-munk theory. Appl Opt (1997) 36(22):5580–6. doi:10.1364/ao.36.005580
15. MA Abebe, J Gerhardt, and JY Hardeberg. Kubelka-munk theory for efficient spectral printer modeling. California, United States: Electronic imaging (2011).
16. S Mourad, P Emmel, K Simon, and RD Hersch. Extending kubelka-munk's theory with lateral light scattering. NIP and digital fabrication conference. Springfield, USA: Society for Imaging Science and Technology (2001).
17. R Rossier, and RD Hersch. Ink-dependent N-factors for the yule-nielsen modified spectral neugebauer model. Conference on colour in graphics, imaging, and vision. Springfield, USA: Society for Imaging Science and Technology (2010).
18. Urban P, Grigat RR. Spectral-based color separation using linear regression iteration. Color Res Appl (2006) 31(3):229–38. doi:10.1002/col.20211
19. Guo JY, Xu HS, Luo MR. Novel Spectral Characterization Method for Color Printer Based on the Cellular Neugebauer Model. Chin Opt Lett (2010) 8(11):1106–9. doi:10.3788/col20100811.1106
20. Al-Anazi AF, Gates ID. Support vector regression to predict porosity and permeability: effect of sample size. Comput and Geosciences (2012) 39:64–76. doi:10.1016/j.cageo.2011.06.011
21. Deshpande K, Green P, Pointer MR. Characterisation of the N-colour printing process using the spot colour overprint model. Opt Express (2014) 22(26):31786–800. doi:10.1364/oe.22.031786
22. Liang J, Huang H, Lian YS, Ning SY, Sun L. Study of the multi-spectral characterization model for inkjet printing system and its application. Spectrosc Spect Anal (2018) 38(4):1213–8. doi:10.3964/j.issn.1000-0593(2018)04-1213-06
23. Liu Z, Liu Q, Gao GA, Li C. Optimized spectral reconstruction based on adaptive training set selection. Opt Express (2017) 25(11):12435–45. doi:10.1364/oe.25.012435
24. Moon J, Yang G, Tae H. A study on dnn-based practical model for predicting spot color. Appl Sci (2023) 13(24):13100. doi:10.3390/app132413100
25. Chen D, Urban P. Deep learning models for optically characterizing 3d printers. Opt Express (2021) 29(2):615–31. doi:10.1364/OE.410796
26. A Akanuma, D Stamate, and JM Bishop. Predicting colour reflectance with gradient boosting and deep learning. Artificial intelligence Applications and innovations . Cham: Springer Nature Switzerland (2023).
27. Zhu W, Wang Z, Li Q, Zhu C. A method of enhancing silk digital printing color prediction through Pix2pix Gan-based approaches. Appl Sci (2024) 14(1):11. doi:10.3390/app14010011
28. Mirjalili S, Lewis A. The whale optimization algorithm. Adv Eng Softw (2016) 95:51–67. doi:10.1016/j.advengsoft.2016.01.008
29. Guo H, Zhou J, Koopialipoor M, Jahed Armaghani D, Tahir MM. Deep neural network and whale optimization algorithm to assess flyrock induced by blasting. Eng Comput (2021) 37(1):173–86. doi:10.1007/s00366-019-00816-y
30. Demichel E. Le procédé. Société Française de Photographie (1924) 26:17–21. Available at: https://scholar.google.com/scholar_lookup?title=Le+Proc%C3%A9d%C3%A9&author=Demichel,+E.&publication_year=1924&journal=Soci%C3%A9t%C3%A9+Fran%C3%A7aise+de+Photographie&volume=26&pages=17%E2%80%9321
31. Garg N, Singla AK, Hersch RD. Calibrating the yule-nielsen modified spectral neugebauer model with ink spreading curves derived from digitized rgb calibration patch images. J Imaging Sci Technology (2008) 52:40908-1–5. doi:10.2352/j.imagingsci.technol.52:4(040908)
32. Luo MR, Cui G, Rigg B. The development of the cie 2000 colour-difference formula: ciede2000. Color Res and Appl (2001) 26(5):340–50. doi:10.1002/col.1049
33. Robertson AR. The cie 1976 color-difference formulae. Color Res and Appl (1977) 2(1):7–11. doi:10.1002/j.1520-6378.1977.tb00104.x
34. Shore JD, Spoonhower JP. Reflection density in photographic color prints: generalizations of the williams–clapper transform. J Imaging Sci Technology (2001) 45(5):484–8. doi:10.2352/j.imagingsci.technol.2001.45.5.art00010
35. Rogers G. Analysis of the yule-nielsen effect with the multiple-path point spread function in a frequency-modulated halftone. J Opt Soc Am A-opt Image Sci Vis (2018) 35(6):916–22. doi:10.1364/josaa.35.000916
36. Babaei V, Hersch R. Yule-nielsen based multi-angle reflectance Prediction of metallic halftones: SPIE (2015).
37. Rogers G. Analysis of the yule–nielsen effect with the multiple-path point spread function in a frequency-modulated halftone. J Opt Soc America A (2018) 35(6):916–22. doi:10.1364/JOSAA.35.000916
38. Serge M, Mathieu H, Thierry F. Revisited yule-nielsen model without fitting of the N parameter. In: Journal of the optical society of America A, optics, image science, and vision (2018).
Keywords: color prediction, spectral reflectance, color model, deep neural network, printed image
Citation: Tian D, Ge J and Su N (2024) A hybrid spectral prediction model for printed images based on whale-optimized deep neural network. Front. Phys. 12:1429621. doi: 10.3389/fphy.2024.1429621
Received: 08 May 2024; Accepted: 26 November 2024;
Published: 19 December 2024.
Edited by:
Andrew James Manning, HR Wallingford, United KingdomReviewed by:
Wei Ren, Xi’an University of Posts and Telecommunications, ChinaMeet Kumari, Chandigarh University, India
Copyright © 2024 Tian, Ge and Su. This is an open-access article distributed under the terms of the Creative Commons Attribution License (CC BY). The use, distribution or reproduction in other forums is permitted, provided the original author(s) and the copyright owner(s) are credited and that the original publication in this journal is cited, in accordance with accepted academic practice. No use, distribution or reproduction is permitted which does not comply with these terms.
*Correspondence: Dongwen Tian, ZHd0aWFuQHNwcGMuZWR1LmNu
 Dongwen Tian
 Jinghuan Ge
 Na Su1
