 Chenbo Fu
 Qiushun Che
 Zhanghao Li
 Fengyan Yuan
 Yong Min
- 1Institute of Cyberspace Security, Zhejiang University of Technology, Hangzhou, China
- 2College of Information Engineering, Zhejiang University of Technology, Hangzhou, China
- 3Computational Communication Research Center, Beijing Normal University, Zhuhai, China
- 4School of Journalism and Communication, Beijing Normal University, Beijing, China
Accelerated by technological advancements, while online platforms equipped with recommendation algorithms offer convenience to obtain information, it also brought algorithm bias, shaping the norms and behaviors of their users. The filter bubble, conceived as a negative consequence of algorithm bias, means the reduction of the diversity of users’ information consumption, garnering extensive attention. Previous research on filter bubbles typically used users’ self-reported or behavioral data independently. However, existing studies have disputed whether filter bubbles exist on the platform, possibly owing to variations in measurement methods. In our study, we took content category diversity to measure the filter bubbles and innovatively used a combination of participants’ self-reported and website behavioral data, examining filter bubbles on a single online video platform (Bilibili). We conducted a questionnaire survey among 337 college students and collected 3,22,324 browsing records with their informed authorization, constituting the dataset for research analysis. The existence of filter bubbles on Bilibli is found, such that diversity will decrease when viewing Game videos increases. Furthermore, we considered the factors that influence filter bubbles from the perspective of demographics and user behavior. In demographics, female and non-member users are more likely to be trapped in filter bubbles. In user behavior, results of feature importance analysis indicate that the diversity of information consumption of heavy users is higher than others, and both activity and fragmentation have an impact on the formation of filter bubbles, but in different directions. Finally, we discuss the reasons for these results and a theoretical explanation that the filter bubbles effect may be lower than we thought for both heavy and normal users on online platforms. Our conclusions provide valuable insights for understanding filter bubbles and platform management.
1 Introduction
With the increasing popularity of social media, the way people obtain information and form opinions has changed dramatically [1, 2]. Accelerated by technological advancements, online video platforms have become an essential channel for people to obtain news information with the emergence and rapid growth of participatory culture and collaborative consumption [3, 4]. An investigation by the Pew Research Center revealed that approximately one-third of U.S. adults (31%) receive news regularly through Facebook, whereas about one in five Americans (22%) report regularly obtaining news from YouTube [5]. The number of online video users in China has reached 1.044 billion [6]. Bilibili1 (NASDAQ: BILI), a YouTube-like UGC (User Generated Content) website, is an iconic brand of China’s younger generation and a leading UGC video community [7]. Most Bilibli users hold undergraduate degrees, endowing Bilibili with substantial influence within the realm of young, well-educated individuals [8].
The ubiquity of online video platforms facilitates fragmented audiences through content options and audience consumption [9]. Users can watch various types of video content at any time and place, which dramatically satisfies users’ needs for entertainment and knowledge. Some argue that the Internet and social media broaden diverse views, ideas, and opinions, resulting in a diverse information base [10, 11]. However, critics said that the algorithms employed by search engines and social networks limit users’ ability to engage with diverse content [12–14], thereby building filter bubbles and diminishing information diversity [15].
Filter bubbles, as intermediate structures in social networks inducing polarization and echo chambers, have become one of the most pressing issues in social media today [1]. In this environment, users may always only see the same opinions on political or moral issues but cannot be exposed to different ones [12, 15]. As a result, the cognitive quality of information and diversity of perspectives will be compromised, and the public sphere will be eroded [15]. The filter bubble effect is seen as the culprit to significant occurrences, including the dissemination of false information during the Brexit referendum and the 2016 U.S. presidential election [16–18] and anti-immigration protests in Europe [19]. In addition, the filter bubble is thought to be linked to measles outbreaks in 2014 and 2015 [20]. Therefore, filter bubbles are considered a threat to the well-functioning democratic institutions of modern societies [21].
The filter bubble phenomenon has been comprehensively and deeply studied in information science and communication studies [13, 15, 22–26]. However, there is no unanimous scientific consensus on the existence of filter bubbles. Some found evidence of echo chambers on social media such as Twitter [27–29]. The filter bubble is a phenomenon closely related to what Sunstein has called “echo chambers” [30]. Both echo chambers and filter bubbles describe situations in which individuals are exposed to narrow opinions and perspectives. However, other studies showed that the evidence on Facebook and search engines is relatively limited, showing little or only a slight filter bubble effect [13, 23, 24, 31, 32]. Therefore, filter bubbles may be overstated [33, 34]. Terren and Borge conducted a systematic analysis of 55 studies on social media and found that clear evidence of echo chambers on social media is based on studies with digital trace data, while those studies based on self-reported data found echo chamber was overstated [35]. It should be noted that the different approaches may have possible biases and that combining self-reported data with digital trace data has significant potential. In our study, using digital tracking data, we observe users may fall into filter bubbles as their consumption of the Game category increases. Then, we use a combination of self-reported and website behavioral data to examine the factors impacting filter bubbles, which is also the innovation of this study.
According to previous research, users with different demographics differ in frequency of website use [36, 37], interest in news [38–40], and the number of news consumption [41], and also significantly affects information diversity and perception of filter bubbles [42, 43]. Other potential factors related to filter bubbles are user behaviors. User behaviors on social media are divided into consumption, contribution, and creation [44]. Consumption, which mainly involves content viewing, represents the foundational level of user behavior and is the specific focus of our work. Metzger et al. examined the effects of profile browsing behavior on Chinese Facebook, Renren, on social capital via information propagation between users [45]. Chen et al. analyzed the video browsing behavior of users in online VoD systems and developed a user behavior model that can be used to improve the quality of users’ experiences and make the best use of system resources [46]. Nguyen et al. measured the filter bubble effect in the MovieLens recommender system at the individual level [26] and found that taking recommendations reduces the risk of filter bubbles and provides a better experience than not taking them. Fragmented information is prevalent in social media today [47], and we mainly focus on activity and fragmentation in user behavior. The relationship between user activity and inter-event time has been extensively studied in human dynamics [48–51], and there are differences in the extent and perception of filter bubbles at different activity levels [43, 52]. Research on fragmentation shows that it provides great conveniences to our daily lives but can harm our cognitive abilities [53]. Researchers have also explored filter bubbles on short video platforms in recent years with the rise of these platforms. Wang et al. [54] and Li et al. [55] explored the influencing factors of the user information cocoon effect of short video platforms. Sukiennik et al. compared the effects of explicit and implicit feedback on filter bubbles in a short video application [56]. In addition, Sheng and Zhang examined the process of information cocoon formation from three perspectives: user motivations, information behaviors, and strategies [57]. Given the interest in the correlation between demographics and user behavior with filter bubbles, our work analyzes the impact of filter bubbles from both perspectives. Our data provides user demographic and browsing behavior data to support relevant analysis.
We conducted an exploratory study with Bilibili to gain insights into filter bubbles. Our research combines self-report data and website historical data for analysis, allowing us to obtain and utilize more abundant data content. Through data-based exploration, we enrich our understanding of the filter bubble phenomenon. The paper is organized as follows: Section 2 introduces the datasets and methodology used in the study. Section 3 reports the results, including the existence of filter bubbles in different categories, the impact on the filter bubble from the perspectives of demographics and user behaviors, and the key factors influencing filter bubbles, and gives a discussion. Section 4 provides a conclusion of our entire research.
2 Materials and methods
2.1 Datasets description
We conducted research based on user browsing data recorded by Bilibili. Bilibili focuses on UGC (user-generated content) and PUGC (professional user-generated content), building communities around specific topics. The platform hosts videos varying in length from mere seconds to hours.
For user behavior data, we recruited students from the Zhejiang University of Technology (ZJUT) and Beijing Normal University (BNU) who were willing to provide browsing history records. We noted that Bilibili only officially provides no more than 1,200 history records within 3 months. Our study focused on users who watched over 200 videos to obtain information on users who frequently use Bilibili, and finally, a total of 337 users with a total of 3,22,324 historical records obtained. As shown in Table 1, each historical record includes the following elements: User ID (anonymized), Video ID, Video title, Video length (accurate to seconds), Category, Uploader, Video viewing length (accurate to seconds), Video viewing end time, and Device (mobile phone/web/tablet/TV).

Table 1. An example of the historical record.
2.2 Video category
We first quantified the filter bubble. The filter bubble is a phenomenon in which users are trapped into narrow content or viewpoints [12], and the degree of homogeneity of the content users view is an important measure [55]. Therefore, inspired by the work of Li et al. [55], we utilized diversity to quantify the filter bubbles based on video categories. Content creators determine the video category when uploading a video. There are twenty-one categories, including Life, Entertainment, Game, Movie, Cinephile, Knowledge, etc. For example, a Python tutorial may be labeled as Knowledge. The diversity of information consumption concerns the proportion of video categories users consume, and our work measured the diversity by calculating the information entropy. The diversity of information consumed by a user is as follows:
Where in Equation 1, C represents all 21 categories, and
Where in Equation 2,
To verify whether filter bubbles exist on the Bilibili, we investigated the correlation between changes in diversity and the proportion of watching a specific category. Specifically, We calculated the change in diversity and video consumption in a specific category between the first 2 weeks and the last 2 weeks. To calculate the correlation between changes in diversity and changes in the proportion of watching a specific category, we used Spearman’s rank correlation coefficient [58], as shown in Equation 3.
Where
2.3 Demographic
Typically, user groups with different demographics will have distinct preferences. This difference may impact the filter bubble in video consumption. To explore this, we studied the correlation between users’ self-reported demographics and filter bubbles. We anonymously collected users’ demographics, such as gender, age, education, income, university (ZJUT or BNU), and membership, by sending questionnaires. Table 2 shows samples of data. Detailed information regarding our questionnaire can be found in Supplementary Material.
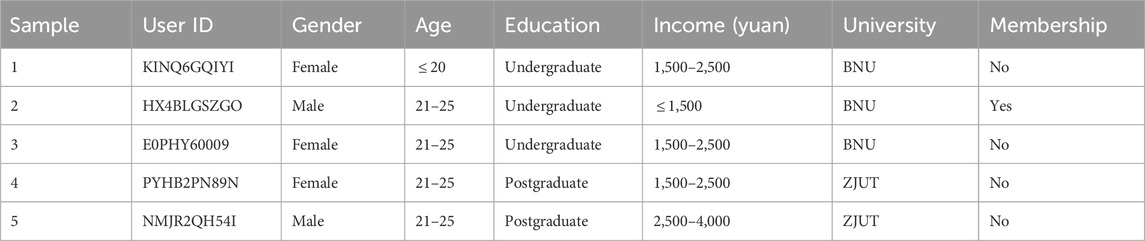
Table 2. Examples of user demographic attributes.
2.4 User behavior
In addition to demographics, user behaviors may also impact filter bubbles. We classified user behaviors into spontaneous behaviors unrelated to recommender systems, such as activity, fragmentation, and device type, and recommendation behaviors related to recommender systems, such as recommendation method and interaction. Below are definitions of these factors. The following are the definitions of these factors.
2.4.1 Activity
Activity measures the frequency of a user participating in the system [59]. In this work, denoting
2.4.2 Fragmentation
Fragmentation measures the dispersion degree of the user’s daily watching time distributed over twenty-four h. Our work is based on entropy to measure the degree of fragmentation of user behavior in a day [60]. Denoting
Where
Where in Equation 6,
2.4.3 Device type
Device type measures the proportion of users using mobile clients when watching videos. In our work, denoting
2.4.4 Recommendation method
Bilibili employs primarily two recommendation methods, i.e., homepage recommendation and related recommendation. The homepage recommendation
2.4.5 Interaction
Interactive behavior was measured by the sum of points from four questions. The questions include “When watching videos, you send bullet screen actively,” “When watching videos, you send comment actively,” “When watching videos, you share the video you like actively,” and “When watching videos, you click like, collect, and coin buttons actively,” and these actions are all important behaviors of interaction with the platform. Here, the Likert scale is used as well, and its reliability is 0.676, which is acceptable.
2.5 Feature importance
We incorporated all twelve features into the random forest algorithm to test the predictive ability of user demographic and behavior factors on diversity. Then, we employed three methods to indicate the importance of each predictive feature in the model, i.e., Mean Decrease Impurity importance, Mean Decrease Accuracy importance, and SHapley Additive exPlanations.
2.5.1 Mean decrease impurity importance (MDI)
Breiman [62] suggested a method to evaluate the importance of a variable
2.5.2 Mean decrease accuracy importance (MDA)
Besides MDI, Breiman [62] also suggested using mean reduction accuracy (MDA) to assess the importance of variable
2.5.3 SHapley additive exPlanations (SHAP)
Lundberg and Lee [64] proposed SHAP. It explains machine learning models by game theory, an important way to understand the underlying mechanism of machine learning models. The main idea of SHAP is to calculate the marginal contribution of features to the model output and then explain the black box model from the global and local levels. The advantage of SHAP is that it can reflect the influence of each feature of the sample on the final prediction, and at the same time, it can reflect the positive and negative properties of the sample.
3 Results and discussion
3.1 Filter bubble in video category
In this section, we only considered whether there are categories on the Bilibili that make users fall into or slip out of filter bubbles from the perspective of video content.
Figure 1 demonstrates three typical cases of the relationship between the change in diversity and video consumption in specific categories, where users who watch less than 3% of the category are filtered for they have little interest in the category. As shown in Figure 1A, users watch Life category demonstrate a positive correlation in diversity and proportion of video consumption changes (i.e., the Spearman coefficient is 0.280, Two-sided p < 0.01), which means watching more proportion of Life category, the diversity of video consumption will increase accordingly. As shown in Figure 1B, users watch Music category demonstrate irrelevant in diversity and proportion of video consumption changes (i.e., the Spearman coefficient is −0.000, Two-sided p = 0.999). Contrary to Life, as shown in Figure 1C, users watch Game category demonstrate a negative correlation in diversity and proportion of video consumption changes (i.e., the Spearman coefficient is −0.210, Two-sided p < 0.05), which means watching more proportion of Game category, the diversity of information consumption will decrease accordingly.
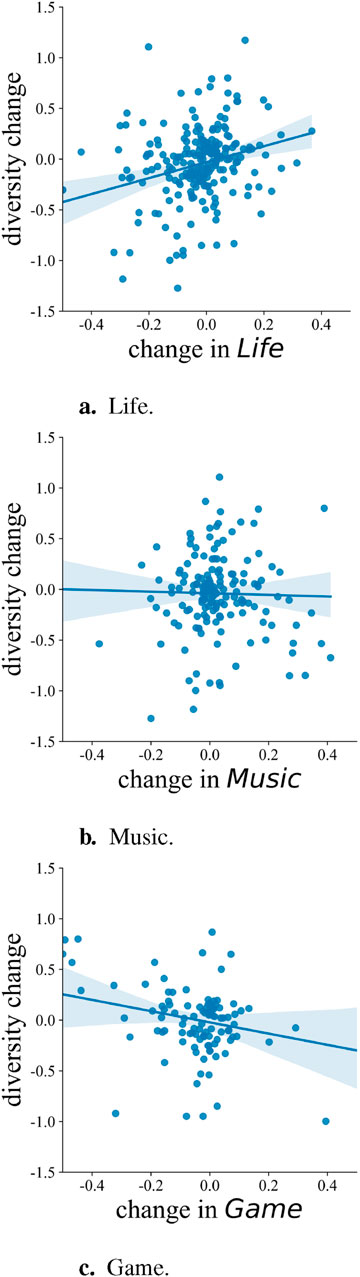
Figure 1. The correlation between the change in diversity and the consumption of video within specific categories. (A) Life. (B) Music. (C) Game.
Among the video categories accounting for more than 1%, we found that diversity changes showed a significant positive correlation with the changes in the proportion of Life, Cinephile, Fashion, and Information; irrelevant in Music Knowledge, Food, Sports, Technology, and Dance; and negative correlation in Game. Users may fall into filter bubbles only in the Game category, while the diversity was not significantly reduced when consuming other categories. It indicates relatively little competition between different video categories on Bilibili. The game business is one of Bilibili’s four significant businesses (mobile games, value-added services, advertising, and e-commerce), and the revenues from mobile games reached RMB5.0 billion in 2022 [65]. Bilibili has a large population of online game enthusiasts in their community [65], but Game videos are not the most consumed in our dataset (see Supplementary Figure S1), so a platform dominated by a specific category of videos does not necessarily lead to filter bubbles in that category’s content. Filter bubbles in the Game category may be related to the strategies adopted by the platform. The reasons and mechanisms for forming filter bubbles still need to be explored and improved. Overall, Bilibili provides users with various content covering different topics and fields and has gradually transformed from an ACG platform into a comprehensive UGC platform.
3.2 Demographic effect
In this section, we explored the correlation between users’ self-reported demographics and their diversity. Specifically, users were divided into groups based on gender, age, education, income, university (ZJUT or BNU), and membership. The empirical cumulative distribution function (eCDF) of the variation in watching diversity among different demographic user groups is shown in Figure 2. As shown in Figures 2A, F, different gender and membership groups have differences in the diversity distribution of video consumption, which suggests that male and membership users consume more diverse video content in our dataset. In contrast, female and non-member users are more prone to being trapped in filter bubbles among our student samples.
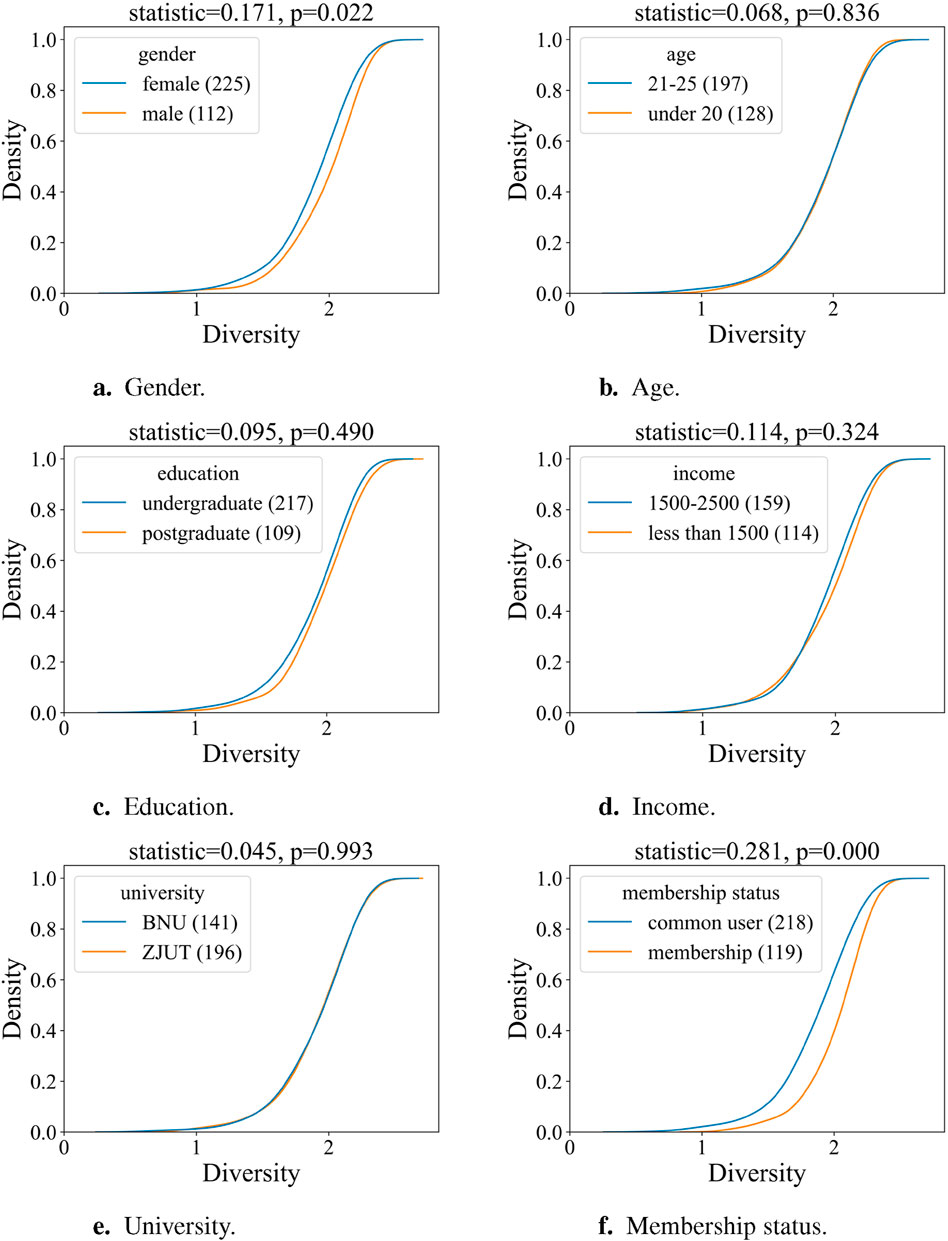
Figure 2. The empirical cumulative distribution function of the variation in watching diversity among different demographic user groups, where the two groups with the largest proportion are selected in each demographic for comparison. Numbers in the brackets means the number of people in the group. The statistic is KS test statistic, p is the two-tailed p-value, and p < 0.05 indicates that the two sets of data belong to different distributions, such as “gender” and “membership.” (A) Gender. (B) Age. (C) Education. (D) Income. (E) University. (F) Membership status.
3.3 User behavior effect
This section divided users into two groups based on user behavior metrics. For example, with an average daily watching of 60 videos as the threshold, users were divided into high- and low-activity user groups. The fragmentation and device type thresholds are 2.47 and 0.5, and users who choose “strongly agree” and “agree” are regarded as high-value users in the recommendation method and interaction. Figure 3 illustrates the empirical cumulative distribution function of the variation in watching diversity among different behavior user groups. As shown in Figure 3, factors such as activity and fragmentation show significant differences among different user groups, which suggests that the low-activity and low-fragmentation user groups exhibit more severe filter bubbles. In contrast, the high-metric user groups demonstrate more diverse consumption.
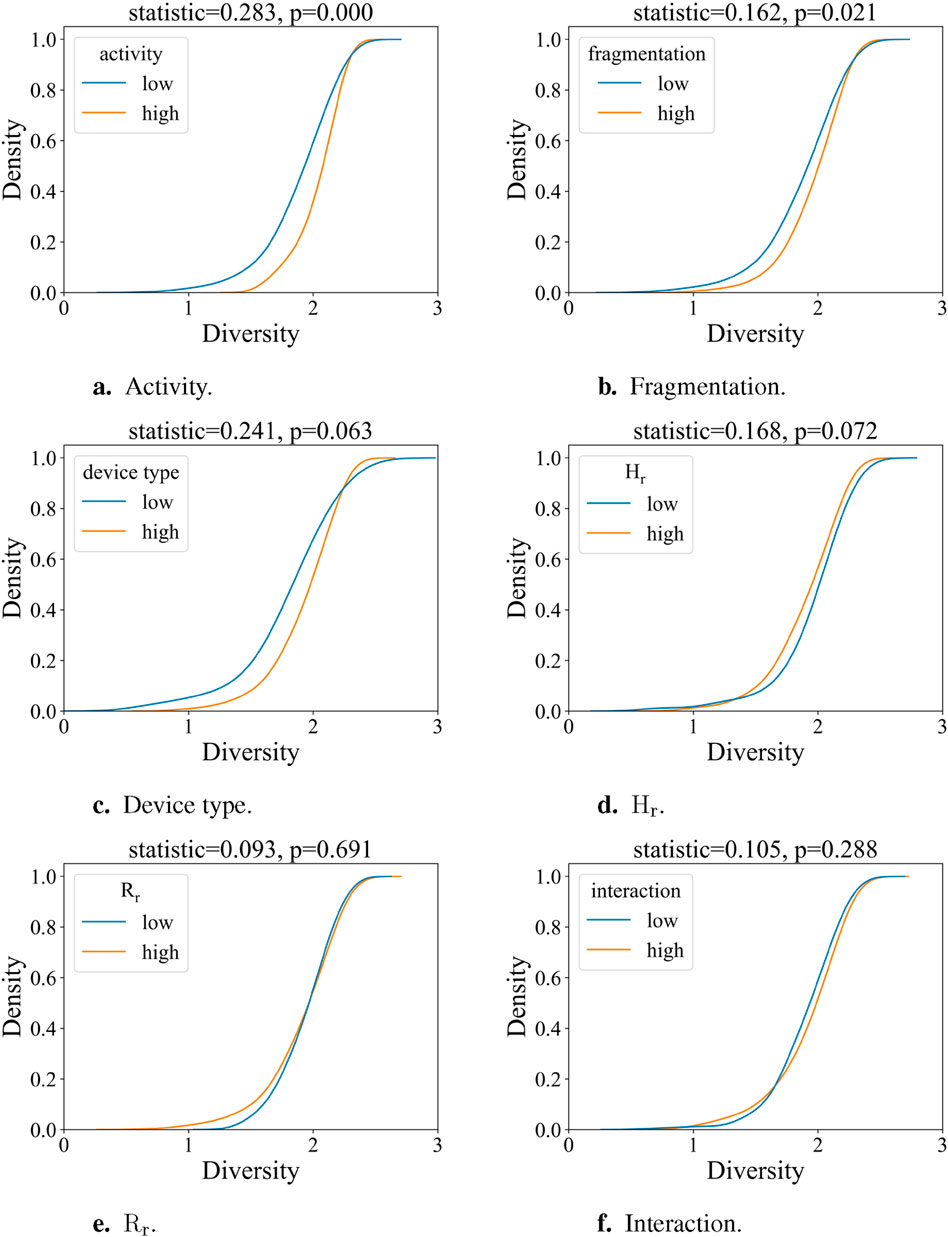
Figure 3. The empirical cumulative distribution function of the variation in watching diversity among different behavior user groups. (A) Activity. (B) Fragmentation. (C) Device type. (D)
3.4 Feature importance analysis
In previous sections, we explored potential factors that could influence filter bubbles. However, the contribution and significance of these factors still need to be clarified. Therefore, we used the linear, decision tree, and random forest models for regression and rank importance through feature importance analysis. The demographic and user behavior factors were all taken as input by models to predict the diversity of information consumption. Table 3 reports the results based on the models. Among the three models, random forest regression showed the best performance of all the metrics. Through the ranking results in Figure 4; Table 4, we can comprehensively evaluate the importance of each factor. Overall, user behavior factors emerged as stronger predictors, while demographic ones ranked lower in significance. Regardless of the feature importance analysis method, it consistently demonstrated that user activity is the most crucial factor. Figure 5A reveals a positive correlation between user activity and prediction results, indicating that increasing activity will increase the diversity of information consumption. The fragmentation in Figure 5B is negatively correlated with the SHAP value, which seems to contradict the fact that the high-fragmentation user group consumes more diverse video content in Section 3.3. This discrepancy can be attributed to the fact that when users were divided into high-fragmentation and low-fragmentation user groups, other factors were not controlled, influencing the results. However, the SHAP value for fragmentation was estimated by considering all possible sets with and without fragmentation. Therefore, after controlling for other factors, it reveals a negative independent contribution of fragmentation to diversity.
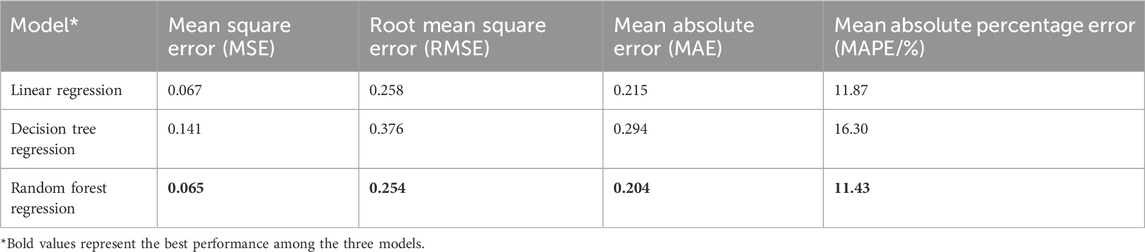
Table 3. Values of the statistical performance metrics for the testing data set of the Linear regression, Decision tree regression, and Random forest regression models.
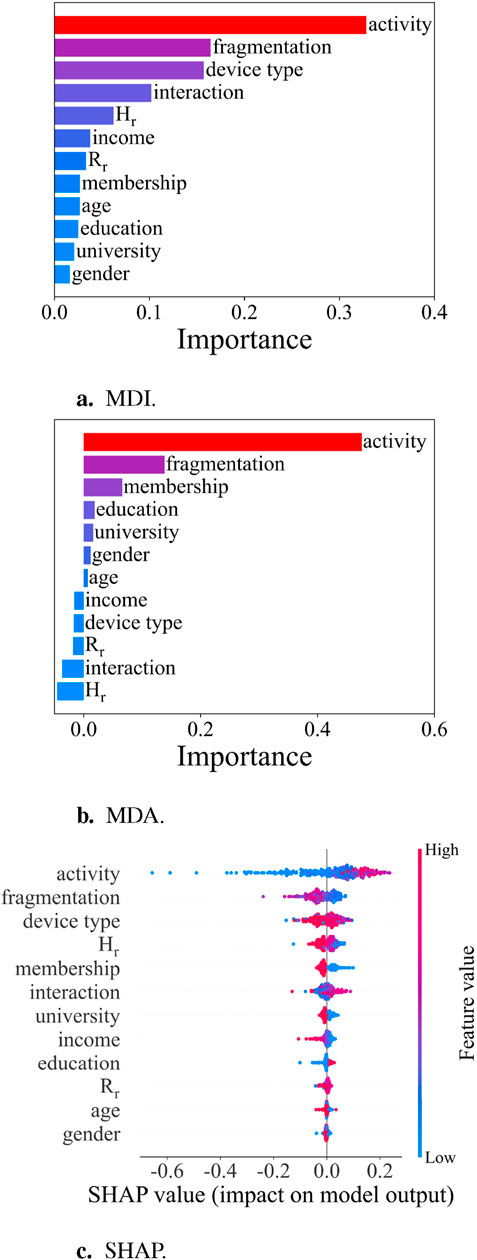
Figure 4. Importance of different variables based on MDI, MDA, and SHAP summary plots. (A) MDI. (B) MDA. (C) SHAP.
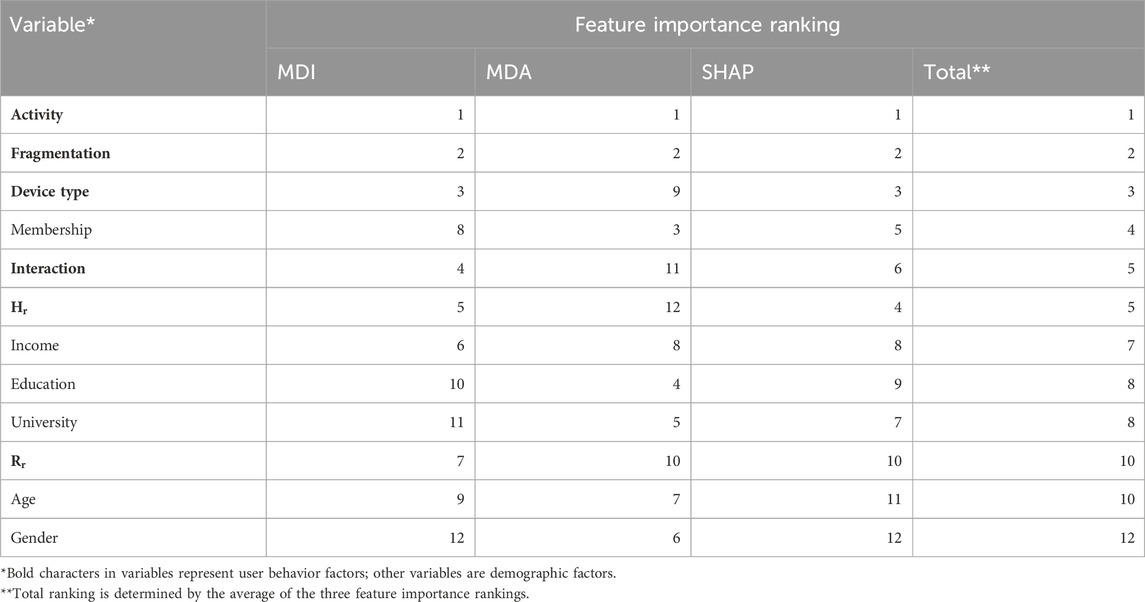
Table 4. Total ranking of feature importance.
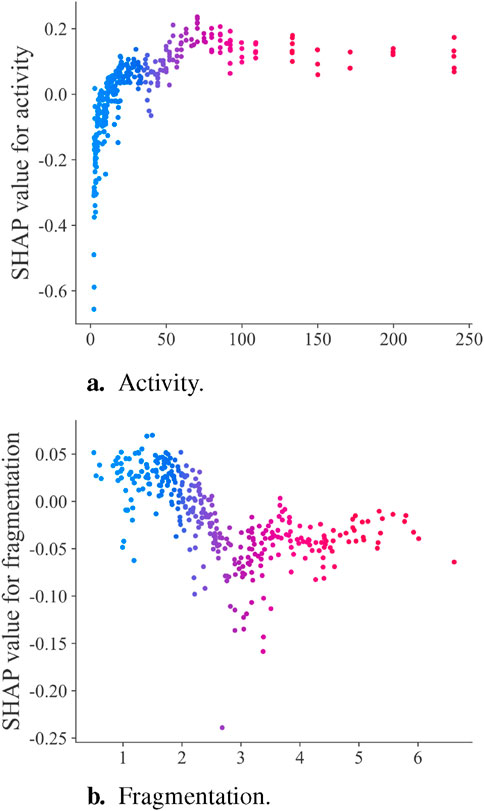
Figure 5. SHAP dependence plot. (A) Activity. (B) Fragmentation.
3.5 Discussion
By mining 3,22,324 historical records from 337 Bilibili users, this study examined the diversity of information consumption and identified variations associated with different demographic attributes and user behaviors. This section will discuss potential theoretical explanations that could lead to these findings. Ultimately, the comprehensive analysis of the entire study leads to the conclusion that individuals who heavily engage with a single platform do not necessarily encounter reduced diversity in their information consumption. Furthermore, it suggests that the extent of the filter bubble has been overstated in a high-choice media environment.
3.5.1 Filter bubble shows demographic difference
Although gender differences in computer and Internet use have become less pronounced in recent years [66–68], differences may persist in various online activities [69], such as consumption diversity. Male users show more diverse consumption in our study. The reasons may be that females are more inclined to utilize the Internet as a communication tool, while males predominantly use it as a source of information [70] in Bilibili. In addition, according to Fallows [66], females tend to have a more limited scope of topics when they surf online, focusing more on health and religion. In contrast, males tend to participate in a broader variety of activities. Similarly, research by Jones et al. [71] also showed that male students prefer to pursue a broad range of topics and activities.
Highly engaged users are more inclined to purchase memberships because they trust the website and can derive pleasure from membership services [72]. These users have high subjective initiative and choose to become members and enjoy related privileges and services. Whether it is to obtain exclusive content, participate in specific campaigns, or enjoy sales, membership users can get more choices and fun in consumption. Additionally, if users have an emotional connection with an online video site, this will increase the likelihood of their willingness to consume products or services on the site [72]. We speculated that the above reasons make paid members show richer diversity in video consumption.
3.5.2 One single platform dose not necessarily lead to filter bubble
Previous research has extensively examined the potential detrimental impacts associated with the excessive use of social media platforms [73, 74], particularly concerning the formation of filter bubbles and the subsequent narrowing of users’ perspectives [75, 76]. One single platform media usage is often considered the reason for the overestimation of filter bubbles [33]. However, our results showed that heavy users on Bilibili are less likely to be caught in filter bubbles, suggesting that excessive use of a single platform does not necessarily lead to filter bubbles. In the realm of online video platforms, pushing the preferred videos to users in time can always attract their attention and increase activity, which is the main reason why the recommendation algorithm is criticized for causing the filter bubble effect [26]. Actually, existing research found that users with higher consumption diversity have higher conversion and retention [77]. Therefore, considering diversity is beneficial rather than harmful to long-term user metrics for platforms. Advanced methods [78] have also been developed to ensure diversity in recommendations. These findings indicate that platforms could enhance user engagement by offering personalized content first and further expanding the diversity of their information consumption. This strategy is effective for the long-term development of the platform and helps maintain its healthy state. Many platforms have already considered diversity when recommending content [77], and our study demonstrated it.
From a user perspective, our research indicates that fragmented usage results in a lower diversity of information consumption, which differs from activity. This phenomenon may be attributed to users’ fear of missing out (FoMO) [79], a common psychological motivation underlying problematic phone use [80]. FoMO positively correlates with a negative impact on individuals’ daily lives and productivity, and it is linked with WhatsApp, Facebook, Instagram, and Snapchat Use Disorders [81], making it easier for users to immerse in the information recommended by these platform algorithms, thereby falling into the Filter Bubble. Furthermore, FoMO is positively associated with social media intensity but negatively associated with social connection [82]. The passive acceptance of fragmented information over a long period also weakens the ability to think deeply [83]. Therefore, a person with FoMO should learn to manage the desire to know information about others and the outside world and the anxiety caused by such desire [83]. Our results show that excessively fragmented watching Bilibili does not help obtain more diverse information. This finding corroborates Han’s assertion [84] that accelerated individuals are reduced to mere information processors, leading to a sense of emptiness due to the absence of narrative.
3.5.3 Filter bubble effect may be small in a high-choice media environment
Since everything is placed in an extremely rapidly changing context, there are no longer strict boundaries for how users move between media platforms [85]. Most users do not rely on only one single platform to receive information but actively utilize multiple platforms [43, 75]. According to our research, heavy users were less likely to be trapped in filter bubbles in Bilibili. Some would take Bilibili as only a specific content media channel, such as watching game commentaries, suggesting why Game content is negatively correlated with diversity while other categories are not. On one single platform, heavy users account for only a small part, while normal users account for the majority. For normal users, they may utilize other platforms to obtain the rest of the information. Thus, overall, for both heavy and normal users, the extent of the filter bubble may be milder than we thought [33, 34].
One possible explanation for sometimes feeling trapped in the filter bubble is that the user’s media repertoire is not abundant enough. Media repertoire refers to the collection of media a person frequently uses [86]. Faced with increasingly diversified media choices, feel-trapped users do not explore as many different media types as possible but instead limit their self-choices to a fixed set. The ability to be exposed to diverse viewpoints on social media often depends on the choices of individuals [23]. Therefore, our conclusion at least explains that within a single platform, even heavy users may not be trapped in filter bubbles. Previous studies blaming filter bubbles on a single platform’s recommendation algorithm may be reconsiderable.
4 Conclusion
In our work, we discovered that there is little competition between different video categories on Bilibili when it comes to changes in diversity and consumption. Then, we analyze the impact of demographics and user behaviors on filter bubbles. Finally, through feature importance analysis, two behavioral patterns – activity and fragmentation – were identified as the key factors affecting filter bubbles. This result casts a new light on the understanding that heavy users who watch a large number of videos on Bilibili are relatively less likely to be trapped in filter bubbles. We speculate that in a high-choice media environment, the degree of filter bubbles for both heavy users and normal users may be lower than we imagined.
We should point out that we obtained samples through recruitment and did not undergo strict sampling. Moreover, our research results are based on student samples and may not fully apply to all social groups. Hence, future research needs to expand the sample range to verify the applicability of these findings in a broader range of demographic characteristics. Finally, the research on users’ cross-platform still needs to be perfected. Further improvements and enhancements are necessary for our future research to fully explore the filter bubble phenomenon in the high-choice media environment.
Data availability statement
The datasets presented in this article are not readily available because they contain information that could compromise the privacy of research participants. Requests to access the datasets should be directed to Yong Min, bXlvbmdAYm51LmVkdS5jbg==.
Author contributions
CF: Conceptualization, Methodology, Writing–original draft. QC: Conceptualization, Data curation, Methodology, Resources, Writing–original draft. ZL: Conceptualization, Methodology, Writing–original draft. FY: Data curation, Resources, Writing–review and editing. YM: Conceptualization, Funding acquisition, Methodology, Writing–review and editing.
Funding
The author(s) declare that financial support was received for the research, authorship, and/or publication of this article. This work was supported by the Zhejiang Provincial Natural Science Foundation of China under Grant LGF21G010003 and Grant ZCLY24F0302.
Acknowledgments
The authors would like to thank the editors and reviewers for their efforts in supporting the publication of this paper.
Conflict of interest
The authors declare that the research was conducted in the absence of any commercial or financial relationships that could be construed as a potential conflict of interest.
Publisher’s note
All claims expressed in this article are solely those of the authors and do not necessarily represent those of their affiliated organizations, or those of the publisher, the editors and the reviewers. Any product that may be evaluated in this article, or claim that may be made by its manufacturer, is not guaranteed or endorsed by the publisher.
Supplementary material
The Supplementary Material for this article can be found online at: https://www.frontiersin.org/articles/10.3389/fphy.2024.1423851/full#supplementary-material
Footnotes
References
1. Min Y, Jiang T, Jin C, Li Q, Jin X. Endogenetic structure of filter bubble in social networks. R Soc open Sci (2019) 6:190868. doi:10.1098/rsos.190868
2. Cha J, Chan-Olmsted SM. Substitutability between online video platforms and television. Journalism and Mass Commun Q (2012) 89:261–78. doi:10.1177/1077699012439035
3. Chau C. YouTube as a participatory culture. New Dir Youth Development (2010) 2010:65–74. doi:10.1002/yd.376
4. Belk R. You are what you can access: sharing and collaborative consumption online. J Business Res (2014) 67:1595–600. doi:10.1016/j.jbusres.2013.10.001
5. Katerina EM, Andrew G. News consumption across social media in 2021 (2021). Available from: https://www.pewresearch.org/journalism/2021/09/20/news-consumption-across-social-media-in-2021/ (Accessed April 24, 2024).
6. CNNIC. The 52nd statistical report on China’s internet development status (2023). Available from: https://www.cnnic.net.cn/n4/2023/0828/c88-10829.html (Accessed April 24, 2024).
7. BilibiliInc. Annual report on form 20-F (2023). Available from: https://ir.bilibili.com/en/financial-information/?tab=quarterly-results#annual-and-interim-reports (Accessed April 24, 2024).
8. Han Q, Rong Y, Zeng R. The construction of Chinese internet culture in the era of new media-a case study of bilibili. In: Proceedings of the 2021 5th International Seminar on Education, Management and Social Sciences (ISEMSS 2021). Atlantis Press (2021). p. 925–9.
9. Riles JM, Pilny A, Tewksbury D. Media fragmentation in the context of bounded social networks: how far can it go? New Media and Soc (2018) 20:1415–32. doi:10.1177/1461444817696242
10. Bimber B. The internet and political fragmentation: Domestic perspectives on contemporary democracy. Champaign, Illinois: University of Illinois Press (2008). p. 155–170.
11. Papacharissi Z. The virtual sphere: the internet as a public sphere. New media and Soc (2002) 4:9–27. doi:10.1177/14614440222226244
12. Pariser E. The filter bubble: how the new personalized web is changing what we read and how we think. New York, NY: Penguin Books (2011).
13. Flaxman S, Goel S, Rao JM. Filter bubbles, echo chambers, and online news consumption. Public Opin Q (2016) 80:298–320. doi:10.1093/poq/nfw006
14. Zuiderveen Borgesius F, Trilling D, Möller J, Bodó B, De Vreese CH, Helberger N. Should we worry about filter bubbles? Internet Policy Rev J Internet Regul (2016) 5. doi:10.14763/2016.1.401
15. Bozdag E, Van Den Hoven J. Breaking the filter bubble: democracy and design. Ethics Inf Technol (2015) 17:249–65. doi:10.1007/s10676-015-9380-y
16. Jackson J. Eli pariser: activist whose filter bubble warnings presaged trump and brexit. The Guardian (2017). Available from: https://www.theguardian.com/media/2017/jan/08/eli-pariser-activist-whose-filter-bubble-warnings-presaged-trump-and-brexit (Accessed August 29, 2024).
17. Spohr D. Fake news and ideological polarization: filter bubbles and selective exposure on social media. Business Inf Rev (2017) 34:150–60. doi:10.1177/0266382117722446
18. Allcott H, Gentzkow M. Social media and fake news in the 2016 election. J Econ Perspect (2017) 31:211–36. doi:10.1257/jep.31.2.211
19. Geschke D, Lorenz J, Holtz P. The triple-filter bubble: using agent-based modelling to test a meta-theoretical framework for the emergence of filter bubbles and echo chambers. Br J Social Psychol (2019) 58:129–49. doi:10.1111/bjso.12286
20. Holone H. The filter bubble and its effect on online personal health information. Croat Med J (2016) 57:298–301. doi:10.3325/cmj.2016.57.298
21. Bozdag E. Bursting the filter bubble: democracy, design, and ethics. [Ph.D. thesis]. Netherlands: Delft University of Technology (2014).
22. Gottron T, Schwagereit F. The impact of the filter bubble–a simulation based framework for measuring personalisation macro effects in online communities. arXiv preprint arXiv:1612.06551 (2016).
23. Bakshy E, Messing S, Adamic LA. Exposure to ideologically diverse news and opinion on facebook. Science (2015) 348:1130–2. doi:10.1126/science.aaa1160
24. Hannak A, Sapiezynski P, Molavi Kakhki A, Krishnamurthy B, Lazer D, Mislove A, et al. Measuring personalization of web search. In: Proceedings of the 22nd international conference on World Wide Web; 2013 May 13–17; Rio de Janeiro, Brazil (2013). p. 527–538.
25. Liao QV, Fu WT. Beyond the filter bubble: interactive effects of perceived threat and topic involvement on selective exposure to information. Proc SIGCHI Conf Hum Factors Comput Syst (2013) 2359–2368. doi:10.1145/2470654.24813
26. Nguyen TT, Hui PM, Harper FM, Terveen L, Konstan JA. Exploring the filter bubble: the effect of using recommender systems on content diversity. In: Proceedings of the 23rd international conference on World wide web; 2014 April 7–11; Seoul Korea (2014). p. 677–86.
27. Barberá P, Jost JT, Nagler J, Tucker JA, Bonneau R. Tweeting from left to right: is online political communication more than an echo chamber? Psychol Sci (2015) 26:1531–42. doi:10.1177/0956797615594620
28. Conover M, Ratkiewicz J, Francisco M, Gonçalves B, Menczer F, Flammini A. Political polarization on twitter. Proc Int aaai Conf web Soc media (2011) 5:89–96. doi:10.1609/icwsm.v5i1.14126
29. Himelboim I, McCreery S, Smith M. Birds of a feather tweet together: integrating network and content analyses to examine cross-ideology exposure on twitter. J computer-mediated Commun (2013) 18:40–60. doi:10.1111/jcc4.12001
31. Haim M, Arendt F, Scherr S. Abyss or shelter? on google’s role when googling for suicide. Health Commun (2017) 32:253–8. doi:10.1080/10410236.2015.1113484
32. Feuz M, Fuller M, Stalder F. Personal web searching in the age of semantic capitalism: diagnosing the mechanisms of personalisation. First Monday (2011) 16. doi:10.5210/fm.v16i2.3344
33. Dubois E, Blank G. The echo chamber is overstated: the moderating effect of political interest and diverse media. Inf Commun and Soc (2018) 21:729–45. doi:10.1080/1369118x.2018.1428656
34. Haim M, Graefe A, Brosius HB. Burst of the filter bubble? effects of personalization on the diversity of google news. Digital journalism (2018) 6:330–43. doi:10.1080/21670811.2017.1338145
35. Terren L, Borge R. Echo chambers on social media: a systematic review of the literature. Review of Communication Research (2021) 9:99–118. doi:10.12840/ISSN.2255-4165.028
36. Brailovskaia J, Margraf J. Comparing facebook users and facebook non-users: relationship between personality traits and mental health variables–an exploratory study. PloS one (2016) 11:e0166999. doi:10.1371/journal.pone.0166999
37. Ryan T, Xenos S. Who uses facebook? an investigation into the relationship between the big five, shyness, narcissism, loneliness, and facebook usage. Comput Hum Behav (2011) 27:1658–64. doi:10.1016/j.chb.2011.02.004
38. Chyi HI, Lee AM. Online news consumption: a structural model linking preference, use, and paying intent. Digital journalism (2013) 1:194–211. doi:10.1080/21670811.2012.753299
39. Wonneberger A, Schoenbach K, van Meurs L. Staying tuned: tv news audiences in The Netherlands 1988–2010. J broadcasting and Electron media (2012) 56:55–74. doi:10.1080/08838151.2011.648684
40. Knobloch-Westerwick S, Alter S. The gender news use divide: Americans’ sex-typed selective exposure to online news topics. J Commun (2007) 57:739–58. doi:10.1111/j.1460-2466.2007.00366.x
41. Benesch C. An empirical analysis of the gender gap in news consumption. J Media Econ (2012) 25:147–67. doi:10.1080/08997764.2012.700976
42. Zhang L, Zheng L, Peng TQ. Structurally embedded news consumption on mobile news applications. Inf Process and Management (2017) 53:1242–53. doi:10.1016/j.ipm.2017.04.009
43. Klug K, Strang C. The filter bubble in social media communication: how users evaluate personalized information in the facebook newsfeed. Media Trust a Digital World Commun Crossroads (2019) 159–180. doi:10.1007/978-3-030-30774-5_12
44. Muntinga DG, Moorman M, Smit EG. Introducing cobras: exploring motivations for brand-related social media use. Int J advertising (2011) 30:13–46. doi:10.2501/ija-30-1-013-046
45. Metzger MJ, Wilson C, Zhao BY. Benefits of browsing? the prevalence, nature, and effects of profile consumption behavior in social network sites. J Computer-Mediated Commun (2018) 23:72–89. doi:10.1093/jcmc/zmx004
46. Chen L, Zhou Y, Chiu DM. Video browsing-a study of user behavior in online vod services. In: 2013 22nd international conference on computer communication and networks (icccn); 2013 July 30–August 02; Nassau, Bahamas. IEEE (2013). p. 1–7.
47. Liu Y, Gu X. Media multitasking, attention, and comprehension: a deep investigation into fragmented reading. Educ Technology Res Development (2020) 68:67–87. doi:10.1007/s11423-019-09667-2
48. Zhou T, Kiet HAT, Kim BJ, Wang BH, Holme P. Role of activity in human dynamics. Europhysics Lett (2008) 82:28002. doi:10.1209/0295-5075/82/28002
49. Radicchi F. Human activity in the web. Phys Rev E (2009) 80:026118. doi:10.1103/physreve.80.026118
50. Wang P, Xie XY, Yeung CH, Wang BH. Heterogenous scaling in the inter-event time of on-line bookmarking. Physica A: Stat Mech its Appl (2011) 390:2395–400. doi:10.1016/j.physa.2011.02.026
51. Yan DC, Wei ZW, Han XP, Wang BH. Empirical analysis on the human dynamics of blogging behavior on github. Physica A: Stat Mech its Appl (2017) 465:775–81. doi:10.1016/j.physa.2016.08.054
52. Grossetti Q, Du Mouza C, Travers N. Community-based recommendations on twitter: avoiding the filter bubble. In: Web Information Systems Engineering–WISE 2019: 20th International Conference; 2020 January 19–22; Hong Kong, China. Springer (2019). p. 212–27.
53. Feng J, Hu B, Sun J, Zhang J, Wang W, Cui G. Identifying fragmented reading and evaluating its influence on cognition based on single trial electroencephalogram. Front Hum Neurosci (2021) 15:753735. doi:10.3389/fnhum.2021.753735
54. Wang J, Zhang R. Research on the influencing factors of the user information cocoon effect of short video platforms based on personalized recommendation algorithms. In: 2022 2nd International Conference on Big Data Engineering and Education (BDEE); 2022 August 5–07; Chengdu, China. IEEE (2022). p. 53–60.
55. Li N, Gao C, Piao J, Huang X, Yue A, Zhou L, et al. An exploratory study of information cocoon on short-form video platform. In: Proceedings of the 31st ACM International Conference on Information and Knowledge Management; 2022 October 17–21; Atlanta, GA (2022). p. 4178–82.
56. Sukiennik N, Gao C, Li N. Uncovering the deep filter bubble: narrow exposure in short-video recommendation. In: Proceedings of the ACM on Web Conference 2024; 2024 May 13–17; Singapore (2024). p. 4727–35.
57. Sheng M, Zhang P. “how i form and escape information cocoons” an interview study of users on short video apps. In: International Conference on Information; 2024 April 15; Changchun, China. Springer (2024). p. 129–138.
58. Spearman C. The proof and measurement of association between two things. Stud individual differences: The search intelligence (1961) 45–58. doi:10.1037/11491-005
59. Ghoshal G, Holme P. Attractiveness and activity in internet communities. Physica A: Stat Mech its Appl (2006) 364:603–9. doi:10.1016/j.physa.2005.04.047
60. Liang H, Shen F. Birds of a schedule flock together: social networks, peer influence, and digital activity cycles. Comput Hum Behav (2018) 82:167–76. doi:10.1016/j.chb.2018.01.016
63. Pedregosa F, Varoquaux G, Gramfort A, Michel V, Thirion B, Grisel O, et al. Scikit-learn: machine learning in python. J machine Learn Res (2011) 12:2825–30. doi:10.5555/1953048.2078195
64. Lundberg SM, Lee SI. A unified approach to interpreting model predictions. Adv Neural Inf Process Syst (2017) 30. doi:10.48550/arXiv.1705.07874
65. BilibiliInc. Annual report (2023). Available from: https://ir.bilibili.com/en/financial-information/?tab=quarterly-results#hkex (Accessed August 16, 2024).
66. Fallows D. How women and men use the internet. J Urol (2005). Available from: https://www.pewresearch.org/internet/2005/12/28/how-women-and-men-use-the-internet/ (Accessed August 29, 2024).
67. Hargittai E, Shafer S. Differences in actual and perceived online skills: the role of gender. Social Sci Q (2006) 87:432–48. doi:10.1111/j.1540-6237.2006.00389.x
68. Broos A. Gender and information and communication technologies (ict) anxiety: male self-assurance and female hesitation. CyberPsychology and Behav (2005) 8:21–31. doi:10.1089/cpb.2005.8.21
69. Lim S, Kwon N. Gender differences in information behavior concerning wikipedia, an unorthodox information source? Libr and Inf Sci Res (2010) 32:212–20. doi:10.1016/j.lisr.2010.01.003
70. Jackson LA, Ervin KS, Gardner PD, Schmitt N. Gender and the internet: women communicating and men searching. Sex roles (2001) 44:363–79. doi:10.1023/A:1010937901821
71. Jones S, Johnson-Yale C, Millermaier S, Pérez FS. Us college students’ internet use: race, gender and digital divides. J Computer-Mediated Commun (2009) 14:244–64. doi:10.1111/j.1083-6101.2009.01439.x
72. Chen J, Xu W. A study on the impact of customer engagement on continued purchase intention for online video websites vip service. In: Proceedings of the Thirteenth International Conference on Management Science and Engineering Management; Berlin, Germany. Springer (2020). p. 668–82.
73. Bányai F, Zsila Á, Király O, Maraz A, Elekes Z, Griffiths MD, et al. Problematic social media use: results from a large-scale nationally representative adolescent sample. PloS one (2017) 12:e0169839. doi:10.1371/journal.pone.0169839
74. Wartberg L, Kriston L, Thomasius R. Internet gaming disorder and problematic social media use in a representative sample of German adolescents: prevalence estimates, comorbid depressive symptoms and related psychosocial aspects. Comput Hum Behav (2020) 103:31–6. doi:10.1016/j.chb.2019.09.014
75. Sindermann C, Elhai JD, Moshagen M, Montag C. Age, gender, personality, ideological attitudes and individual differences in a person’s news spectrum: how many and who might be prone to “filter bubbles” and “echo chambers” online? Heliyon (2020) 6:e03214. doi:10.1016/j.heliyon.2020.e03214
76. Montag C, Hegelich S. Understanding detrimental aspects of social media use: will the real culprits please stand up? Front Sociol (2020) 5:599270. doi:10.3389/fsoc.2020.599270
77. Anderson A, Maystre L, Anderson I, Mehrotra R, Lalmas M. Algorithmic effects on the diversity of consumption on spotify. In: Proceedings of the web conference 2020; 2020 April 20–24; Taipei. Association for Computing Machinery (2020). p. 2155–65.
78. Kunaver M, Požrl T. Diversity in recommender systems–a survey. Knowledge-based Syst (2017) 123:154–62. doi:10.1016/j.knosys.2017.02.009
79. Przybylski AK, Murayama K, DeHaan CR, Gladwell V. Motivational, emotional, and behavioral correlates of fear of missing out. Comput Hum Behav (2013) 29:1841–8. doi:10.1016/j.chb.2013.02.014
80. Coskun S, Karayagız Muslu G. Investigation of problematic mobile phones use and fear of missing out (FoMO) level in adolescents. Community Ment Health J (2019) 55:1004–14. doi:10.1007/s10597-019-00422-8
81. Rozgonjuk D, Sindermann C, Elhai JD, Montag C. Fear of missing out (fomo) and social media’s impact on daily-life and productivity at work: do whatsapp, facebook, instagram, and snapchat use disorders mediate that association? Addict behaviors (2020) 110:106487. doi:10.1016/j.addbeh.2020.106487
82. Roberts JA, David ME. The social media party: fear of missing out (fomo), social media intensity, connection, and well-being. Int J Human–Computer Interaction (2020) 36:386–92. doi:10.1080/10447318.2019.1646517
83. Li YX, Zhang YH, Yang R, Lian SL, Yan L, Zhu XM. Relationship between perceived social norms and phubbing: individual control and fear of missing out as mediators. Int J Ment Health Addict (2023) 21:1898–913. doi:10.1007/s11469-021-00696-8
85. Bentivegna S, Artieri GB. Rethinking public agenda in a time of high-choice media environment. Media Commun (2020) 8:6–15. doi:10.17645/mac.v8i4.3166
Keywords: filter bubble, online video platform, activity, fragmentation, diversity of information consumption
Citation: Fu C, Che Q, Li Z, Yuan F and Min Y (2024) Heavy users fail to fall into filter bubbles: evidence from a Chinese online video platform. Front. Phys. 12:1423851. doi: 10.3389/fphy.2024.1423851
Received: 26 April 2024; Accepted: 23 August 2024;
Published: 04 September 2024.
Edited by:
Takayuki Mizuno, National Institute of Informatics, JapanCopyright © 2024 Fu, Che, Li, Yuan and Min. This is an open-access article distributed under the terms of the Creative Commons Attribution License (CC BY). The use, distribution or reproduction in other forums is permitted, provided the original author(s) and the copyright owner(s) are credited and that the original publication in this journal is cited, in accordance with accepted academic practice. No use, distribution or reproduction is permitted which does not comply with these terms.
*Correspondence: Yong Min, bXlvbmdAYm51LmVkdS5jbg==