
ORIGINAL RESEARCH article

Front. Phys., 26 June 2024
Sec. Social Physics
This article is part of the Research Topic Network Learning and Propagation Dynamics Analysis View all 6 articles

Information propagation characteristic by individual hesitant-common trend on weighted network

Jianlin Jia
Jianlin Jia1*Yuwen HuangYuwen Huang1Wanting ZhangWanting Zhang1Yanyan ChenYanyan Chen2
  • 1Key Laboratory of Civil Engineering Structure and Mechanics, Inner Mongolia University of Technology, Hohhot, China
  • 2Beijing Key Laboratory of Traffic Engineering, Beijing University of Technology, Beijing, China

Within the context of contemporary society, the propagation of information is often subject to the influence of inter-individual connectivity, and individuals may exhibit divergent receptive attitudes towards identical information, a phenomenon denoted as the Hesitant-Common (HECO) trait. In light of this, the present study initially constructs a propagation network model devoid of correlation configurations to investigate the HECO characteristics within weighted social networks. Subsequently, the study employs a theoretical framework for edge partitioning, predicated on edge weights and HECO traits, to quantitatively analyze the mechanisms of individual information dissemination. Theoretical analyses and simulation outcomes consistently demonstrate that an augmentation in the proportion of common individuals facilitates both the diffusion and adoption of information. Concurrently, a phase transition crossover is observed, wherein the growth pattern of the ultimate adoption range, denoted as R(∞), transitions from a first-order discontinuous phase transition to a second-order continuous phase transition as the proportion of common individuals increases. An escalation in the weight distribution exponent is found to enhance information propagation. Furthermore, a reduction in the heterogeneity of degree distribution is conducive to the spread of information. Conversely, an increase in degree distribution heterogeneity and a diminution in the collective decision-making capacity can both exert inhibitory effects on the propagation of information.

1 Introduction

With the rapid development of social media platforms such as TikTok, WeChat, and Twitter, social networks have increasingly become integral to human life. These media facilitate the swift reception and dissemination of diverse information, greatly enhancing the convenience of people’s work and daily activities. The communication pathways within social media constitute a vast network for information dissemination, with the world’s largest social media platform, Facebook, boasting billions of active monthly users, and the monthly volume of information flow is incalculable [1]. However, this complexity of information interweaving also presents challenges: once harmful information spreads within the network, it can cause significant damage. Beyond the challenges of information dissemination, social networks also play a crucial role in various fields such as healthcare [2, 3], cultural education [4, 5], and commercial marketing [6, 7]. They are utilized for analyzing information, signals, and financial communication patterns, demonstrating their multifunctionality in modern society. Therefore, an in-depth analysis of the information dissemination patterns within social networks is of significant importance for understanding their impact, optimizing information management, preventing risks, and promoting development in various sectors.

In recent years, numerous scholars have conducted research on information propagation models, including those based on the Internet of Things with layered structures [8], models grounded in game theory [9], and models inspired by heat transfer [10]. Among these, game theory-based models are capable of simulating decision-making processes of individuals aimed at maximizing their self-interest. However, these models are predicated on the assumption of rationality of the individuals, which may not be applicable to all social network contexts. Meanwhile, research on information propagation based on complex network theory and topological structures has emerged as a significant topic within the field of complex network studies [1114]. There is an extensive body of research on the spread of epidemics across complex networks, and the modes of information propagation within social networks bear certain similarities to the spread of diseases in physically complex networks. Adopting and expanding the foundational models of epidemic propagation in complex networks can facilitate a better understanding of information dissemination in social networks. For instance, a modified Sub-Health-Healthy-Infection- Recovery (SHIR) model with time delays and nonlinear incidence rates has been established for two susceptible populations across different topological networks [15]. Guirui Liu and others developed the SIS-UAU model to describe the dynamics of epidemic and information propagation within overlay networks [16], by constructing a dual-layer network consisting of an epidemic dynamic evolution layer and an information propagation layer to study the dynamics of information and disease spread in superimposed networks. Furthermore, some scholars have described information propagation in complex networks using more refined models. Guan Gui and others formulated a SIR model with time delays, forced silence functions, and forgetting mechanisms in both homogeneous and heterogeneous networks to describe the dynamic mechanisms of rumor propagation [17]. To investigate the propagation trends of network rumors, the authors in [18] detailed the dynamic behavior of a delayed S2IS rumor propagation model with a saturation conversion function. Rumor propagation, as a hot topic in information propagation research [1921], is also a category within social network dissemination, and such research aids various researchers in uncovering the underlying mechanisms of information propagation in social networks.

One of the primary mechanisms for information dissemination within social networks is through the interconnections among users [22]. Upon the inception of a piece of information, the originator initiates its propagation. It is possible that during the initial dissemination, multiple recipients receive the information simultaneously. Should a recipient successfully adopt the information, they then assume the role of a subsequent disseminator. Concurrently, this process may yield adopters who do not further propagate the information, as well as non-adopters. Ultimately, however, the information evolves into a shared resource among a majority of the network’s participants.

Taking into account the various factors that influence information propagation, user behavior on social networks exhibits diversity and heterogeneity, thereby giving rise to distinct patterns of information dissemination. In real-world social networks, interactions are more likely to occur among individuals with similar interests or preferences, and generally, individuals prefer to receive and share information that aligns with their interests and preferences. Temporal thematic analysis of mobile communication systems has revealed homophily characteristics in social interactions, where communication between individuals with similar attributes (such as gender and age) tends to be more frequent [23]. Bakshy et al., based on Facebook data, observed ideological homophily within friendship networks, where both conservatives and liberals are more likely to associate with friends of similar political affiliations [24].

Numerous systems within contemporary society can be characterized as networks, where the constituent elements are represented as nodes. If the interactions between nodes are quantifiable, the interconnecting edges can be assigned weights, thus forming a weighted network. Consequently, the edge weights within a weighted network typically serve to denote the individual relationships between nodes. For instance, in transaction networks, these weights can signify the proportion of transactions between financial institutions [25], while in transportation networks, they may represent the percentage of tourists utilizing different travel routes [26]. Social networks exhibit complex topological structures with significant heterogeneity in connection strength and capacity. Constructing the inter-individual connections as edges with heterogeneous weight distributions is conducive to uncovering the impact of edge weight heterogeneity on information propagation.

Existing research has demonstrated that individual heterogeneity in adoption manifests as varying receptive attitudes towards the same information, and individuals’ attitudes may change as they acquire different amounts of information [27, 28]. In their research presented in Ref. [29], Iyengar R. examined the propagation of obesity through social networking platforms, emphasizing the significance of group heterogeneity in the dissemination of health-related information. Golub B. investigated the learning processes predicated on individual heterogeneity within these networks and the subsequent influence on the collective intelligence of the group [30]. Furthermore, Lerman K. conducted empirical analyses on the dissemination of news across social media platforms, including Digg and Twitter, with a particular focus on the heterogeneity of user behaviors [31]. However, studies on information propagation in complex networks that consider group adoption heterogeneity are relatively scarce. Due to the distinct personalities of each individual in real-world social networks, the degree of information adoption varies. Based on the psychology of information adoption, this study categorizes the population within social networks into two types: common individuals and hesitant individuals, collectively referred to as the Hesitant-Common (HECO) model. Common individuals maintain a liberal attitude towards received information or behaviors and can adopt them at varying speeds, with an increased willingness to adopt as more information is received. In contrast, hesitant individuals experience a period of deliberation regarding whether to adopt, repeatedly verifying the information before reaching a decision to adopt, facilitated by the acquisition of more information. For example, when a trending piece of information emerges on the internet, common individuals are more likely to discover and disseminate it. Among similar common individuals, the adoption rate is higher, leading to faster propagation of the trending information and a quicker approach to relative saturation in the adoption range. On the other hand, hesitant individuals often receive trending information through common individuals, adopt it after thorough verification, and thus propagate it more slowly, with the adoption range reaching relative saturation after a period of time. Therefore, categorizing the population in social networks based on adoption heterogeneity can contribute to a deeper understanding of the propagation mechanisms within social networks.

In consideration of the factors previously discussed, this study investigates the influence of group adoption heterogeneity on information dissemination within social networks on weighted networks and explores the HECO characteristics in the context of information propagation. A model of the information adoption function is proposed to explain the HECO characteristics. Subsequently, a set of partitioning principles based on edge weight and HECO characteristics is formulated to quantify and analyze the mechanisms of individual information propagation. The impact of information propagation on group heterogeneity is validated through simulation results, which are consistent with theoretical analysis. The structure of the remainder of this paper is as follows: In the second section, an information propagation model based on group heterogeneity is established on weighted networks. The third section presents a theoretical analysis of edge partitioning based on edge weight and HECO characteristics. The fourth section examines the simulation results, confirming the propagation process of individual information in line with theoretical analysis. Finally, a summary is provided in the fifth section.

2 Information propagation model with hesitant-common trend

This section aims to construct a two-layer propagation network model based on an uncorrelated configuration model to investigate the impact of differences in HECO characteristics among populations on information dissemination within weighted social networks. In this model, the network consists of N nodes with a degree distribution P(k), and the propagation model follows the susceptible-adopted-recovered (SAR) paradigm. At any given moment, each node is in one of three states: susceptible state (S), adopted state (A), or recovered state (R). S-state nodes have not yet adopted the information and can receive information from neighboring nodes. A-state nodes have adopted the information and will pass it on to neighboring nodes. R-state nodes have lost interest in the information and no longer participate in the subsequent propagation process (i.e., they will neither adopt nor disseminate the information). The propagation mechanism is depicted in Figure 1A. In the weighted social network model presented in this study, an edge weight distribution is introduced to represent the degree of interaction between individuals, with different weight distributions reflecting the heterogeneity in information reception and dissemination among node connections. The edge weight between adjacent nodes i and j is denoted as εij, and the weight distribution function is denoted as fε. When a node i in state A sends information to a node j in state S, the probability of node j receiving the information is given by Eq. 1:

βε=βεij=11λεij(1)

Figure 1
www.frontiersin.org

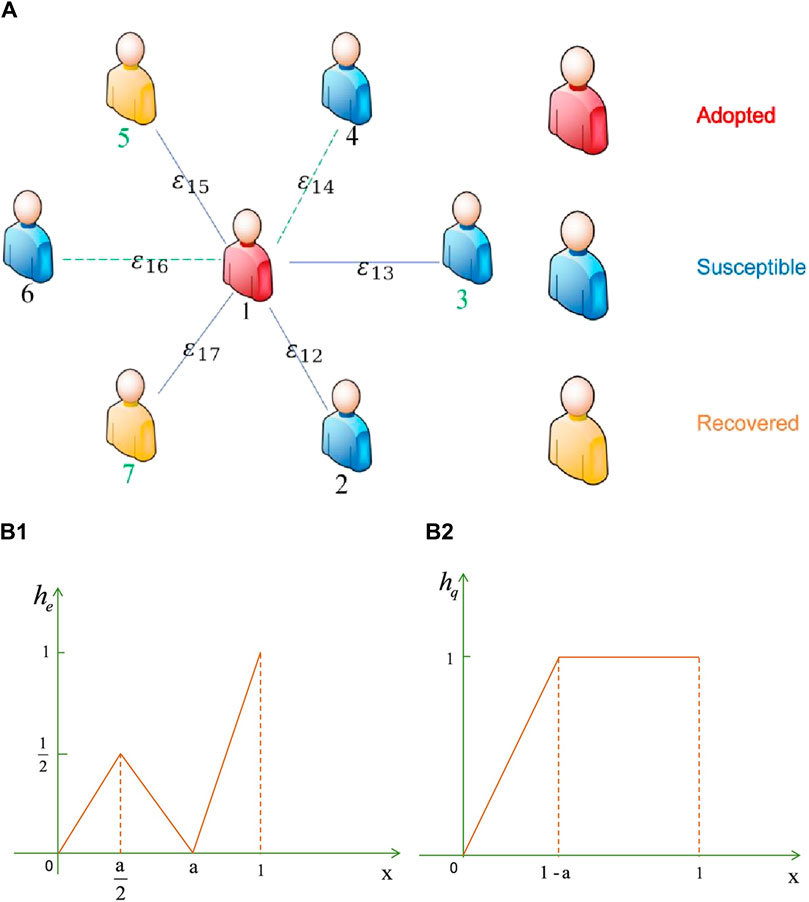
Figure 1. Subfigure (A) illustrates the schematic of the weighted social network propagation model. Different numerical labels with colors represent various types of populations, with black denoting the common population, such as 1, 2, 4, and 6. Green represents the hesitant population, such as 3, 5, and 7. The symbol ε represents the edge weight, which signifies the degree of interaction between two individuals. Blue solid lines indicate that information has not been disseminated through the connected edge, while green dashed lines signify that information has already been propagated through this edge and cannot be transmitted further via the same edge. Subfigures 1 (B1,B2) represent the information adoption functions for the hesitant and ordinary populations, respectively, where x is the ratio of the number of information units received by a node to its degree.

Where λ is the propagation probability of information unit, and βε gradually monotonically increases with the increase of εij. When βε=1, βε=λ, that is, the weight value has no effect on information transmission.

Let m denote the total number of successfully received information units by a node in state S. Initially, in the weighted social network, there is no information propagation, meaning that for a node j in state S, mj=0. Subsequently, at each propagation time step, if node j successfully receives information transmitted via an edge from a neighboring node i in state A, then the count of adopted information units by node j increases by 1, such that m becomes mjmj+1.

To characterize the decision-making capacity of a population, this study introduces a hesitancy parameter, denoted as a. A larger value of a indicates a stronger hesitancy, which corresponds to a weaker decision-making ability, and conversely, a smaller a signifies a stronger decision-making ability. Furthermore, to represent the impact of group adoption heterogeneity on information propagation, two functions are introduced to illustrate individual information adoption decision-making capabilities, as depicted in Figure 1B. The hesitant population, initially exhibit a phase of active adoption during the early stages of information dissemination. The propensity for active adoption increases with the acquisition of more information. However, due to their hesitancy, they subsequently enter a phase of passive adoption. When the number of acquired information units reaches the optimal decision-making capacity for adoption, they revert to an active mindset and remain unchanged thereafter. Eq. 2 represents the information adoption function for the hesitant population:

hex,a=xa,0<xa2x+aa,a2xaxa1a,ax1(2)

For the general population, there exists a normative reception and assimilation of information, wherein an increase in the quantity of information acquired further enhances the adoption of information by this demographic. Eq. 3 delineates the information adoption function of the general population:

hqx,a=x1a,0<x1a1,x1a(3)

In the aforementioned equations, e and q represent the hesitant and common populations, respectively. The variable x represents the ratio of the total number m of successfully received messages to the degree for nodes in state S, which is used to characterize the collective information reception degree within a network. A higher value of x indicates a greater quantity of information successfully accepted by the network. When x = 1, the total number of successfully received messages is equal to the degree, implying that all nodes in state S have successfully received the information.

The simulation of information propagation in a weighted social network is depicted in Figure 2: A complex network with N nodes is constructed, where the edges between nodes are randomly generated according to the predefined network model, and all nodes are initially set to the S-state. A proportion q0 of the nodes in the network is randomly selected to be common nodes, while the remaining proportion e0 of nodes are designated as hesitant nodes (from which it follows that e0+q0=1). Subsequently, a fraction ρ0 of the total nodes is randomly chosen to be in the A-state, with the remaining nodes defaulting to the S-state. During information propagation, a node i in state A transmits information to an adjacent node j in state S via the corresponding edge with weight εij. The probability that node j successfully receives the information is βεij, and upon successful reception, the count of adopted information units for node j becomes mjmj+1. Due to the non-redundancy of information propagation, the information will not be disseminated through this edge again. For the group heterogeneity of node j, the probabilities of adopting information while in the hesitant and common states are hex,a and hqx,a, respectively, where x=mj/kj. A node j that successfully adopts the information transitions to state A; if unsuccessful, it remains in state S. A node i that has completed the propagation process may lose interest in the information with a recovery probability γ and transition to the R-state. The aforementioned propagation process is repeated until no nodes remain in state A, at which point the information propagation concludes.

Figure 2
www.frontiersin.org

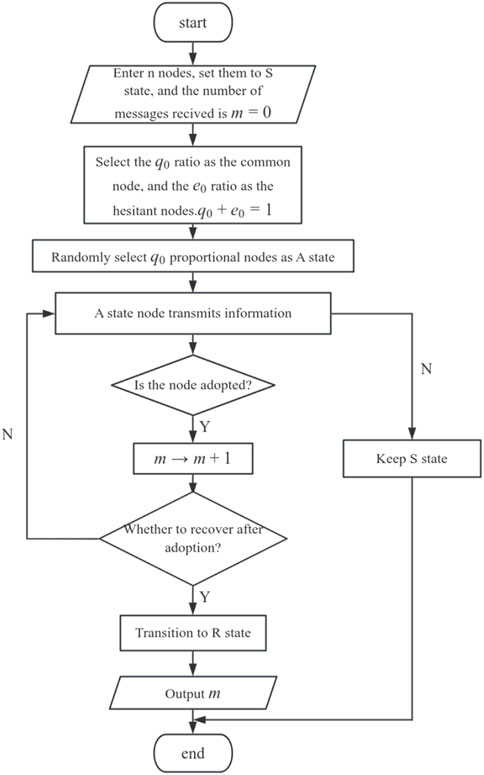
Figure 2. Simulated information dissemination process under weighted social network.

3 Theory analysis

Building upon the literature [14, 32], this study examines the propagation of non-redundant information with group adoption heterogeneity on weighted networks. On this foundation, the paper proposes a theory of edge partitioning based on edge weight and HECO characteristics, thereby analyzing the information propagation mechanisms of the model. The study introduces nodes in a cavity state [33], which are capable of receiving information from neighbors but are unable to transmit information to other nodes. Assuming that edge weights are randomly distributed, the probability that a node has not received information from its neighbors by time t is characterized by Eq. 4:

θt=εfεθεt(4)

Where θεt is the probability that the A-state node does not propagate information to the neighboring nodes in S-state through the edge with the weight of ε by time t.

By time t, a node i in state S with degree ki has received m pieces of information from its neighbors, an occurrence that can be represented as in Eq. 5:

φki,m,t=kimθtkim1θtm(5)

Based on group heterogeneity, differences in HECO characteristics, and the information adoption function, if node i is a hesitant node in state S, and after time t, it has received mm>aki pieces of information cumulatively but has not adopted the information and remains in state S, the probability is articulated by Eq. 6:

ϕeki,m,t,a=r=0mφki,r,tl=0r1helki,a=r=0aki2φki,r,tl=0r1laki2+r=aki2akiφki,n,tl=0aki21laki2l=aki2r1alkia+n=akimφki,n,tl=0aki21laki2l=aki2aki1alkial=akin1lkia1a(6)

Similarly, when the received information m satisfies the conditions m<aki2 and aki2<m<aki, the probability of not having adopted the information and still being in state S is expressed by Eqs 7, 8:

ϕeki,m,t,a=r=0mφki,r,tl=0r1helki,a=r=0mφki,r,tl=0r1laki2(7)
ϕeki,m,t,a=r=0mφki,r,tl=0n1helki,a=r=0aki2φki,r,tl=0r1laki2+r=aki2mφki,r,tl=0aki21laki2l=aki2r1alkia(8)

Then, for any hesitant node in state S, Eq. 9 can represent the probability that such nodes have not yet adopted the information by time t is:

τe=kiPkiϕeki,m,t,a(9)

Similarly, if node i is an common node in state S, and after time t, it has received m pieces of information cumulatively but has not adopted the information and remains in state S, the probability is articulated by Eqs 10, 11:

ϕqki,m,t,a=r=0mφki,n,tl=0r1hqlki,a=r=01akiφki,n,tl=0r1l1akia1a,m>1aki(10)
ϕqki,m,t,a=r=0mφki,r,tl=0r1hqlki,a=r=0mφki,r,tl=0r1l1akia1a,m<1aki(11)

For any common node in state S, the probability of not adopting the information at the cut-off time t is:

τq=kiPkiϕki,m,t,a(12)

Consequently, the probability that node i in state S, after time t, remains in state S after having cumulatively received m pieces of information is given by Eq. 13:

ϕki,m,t,a=1ρ0e0ϕeki,m,t,a+q0ϕqki,m,t,a(13)

Then, in this weighted network, the proportion of S-state nodes at time t is delineated by Eq. 14:

Φm,t,a=kPkϕk,m,t,a=1ρ0e0τe+q0τq(14)

Due to the three states in the SAR model, this study introduces the term θεt for calculation purposes. Initially, θεt can be denoted using Eq. 15 as follows:

θεt=ηS,εt+ηA,εt+ηR,εt(15)

Where ηA,εt represents the probability that a node i in state S, by time t, has interacted with an adjacent node j in state A via an edge with weight ε but has not successfully adopted the information. ηS,εt and ηR,εt are the probabilities that a node i in state S interacts with an adjacent node j in state S (or R) via an edge with weight ε.

Initially, the cavity node theory is introduced to calculate ηS,εt. A node i in the cavity state is unable to transmit information to other nodes. Thus, a node j in state S with degree kj can receive information from the other kj1 adjacent nodes. Hence, the probability that node j has cumulatively received n pieces of information from its neighboring nodes by time t is articulated by Eq. 16:

φkj1,n,t=kj1nθtkj2n1θtn(16)

Based on the differences in HECO characteristics and the information adoption function of the population, if node j is a hesitant node in state S, and after time t, it has received nn>akj1 pieces of information cumulatively but has not adopted the information and remains in state S, the probability is represented as:

ψkj,n,t,a=r=0nφkj1,r,tl=0r1helkj,a=r=0akj12φkj1,r,tl=0r1lakj12+r=akj12akj1φkj1,r,tl=0akj121lakj12l=akj12r1alkj1a+r=akj1nφkj1,n,tl=0akj121lakj12×l=akj12akj11alkj1al=akj1r1lkj1a1a(17)

Similarly, when the received information m satisfies the conditions n<akj12 and akj12<n<akj1, the probability of not having adopted the information and still being in state S is represented as:

ψkj,n,t,a=r=0nφkj1,r,tl=0r1helkj,a=r=0akj12φkj1,r,tl=0r1lakj12+r=akj12nφkj1,r,tl=0akj121lakj12l=akj12r1alkj1a(18)
ψkj,n,t,a=r=0nφkj1,r,tl=0r1helkj,a=r=0nφkj1,r,tl=0r1lakj12(19)

When node j is a common node in state S, and after time t, it has received n pieces of information cumulatively but has not adopted the information and remains in state S, the probability is represented as:

ψkj,n,t,a=r=0nφkj1,r,tl=0r1hqlkj1,a=r=01akj1φkj,r,tl=0r1l1akj1a1a,n>1akj1(20)
ψkj,n,t,a=r=0nφkj1,r,tl=0n1hqlkj1,a=r=0nφkj,r,tl=0r1l1akj1a1a,n1akj1(21)

Consequently, the probability that a node j in state S remains in state S after cumulatively receiving n pieces of information by time t is given by Eq. 22:

ψkj,n,t,a=1ρ0e0ψekj,n,t,a+q0ψqkj,n,t,a(22)

The probability that a node i in state S can interact with a node j in state S via an edge with weight ε is:

ηS,εt=kjkjPkjψkj,n,t,ak(23)

Where kjPkjk represents the probability of contact between node i and node j whose degree is kj, and k is the network average degree.

Subsequently, analyze ηA,εt and ηR,εt. Given that the probability of a node i in state S successfully adopting information from an adjacent node j in state A via an edge with weight ε is βε, then the probability θεt can be further evolved as:

dθεtdt=βεηA,εt(24)

In addition, a node in state A may lose interest in information transmission with probability γ and change to the state R, and ηR,εt can evolve into:

dηR,εtdt=γηA,εt1βε(25)

By combining the initial conditions θε0=1 and ηR,ε0=0, Eqs 18, 19 allows for the derivation of Eq. 26:

ηR,εt=γ1θεt1βε1(26)

By substituting Eqs 17, 20 into Eq. 12, one arrives at Eq. 27:

ηA,εt=θεtηS,εtηR,εt=θεtkjkjPkjψkj,n,t,akγ1θεt1βε1(27)

Substituting Eq. 21 into Eq. 18, θεt evolves accordingly, as detailed in Eq. 28:

dθεtdt=θεtkjkjPkjψkj,n,t,akγ1θεt1βε1=βεkjkjPkjψkj,n,t,ak+γ1βεγ+βε1γθεt(28)

In the whole network, the density changes of each state can be represented by Eqs 29, 30:

dRtdt=γAt(29)
dAtdt=dStdtγAt(30)

Therefore, the formula 11, 23, 24 can be iterated together to obtain each state density St, At and Rt at any time step.

When t, the status of nodes in the network does not change, and there are only S-state nodes and R-state nodes in the network. That is, when dθεtdt|t=0, R is the final information adoption size. At this time, the probability that the edge with the weight of ε does not propagate information is articulated by Eq. 31:

θε=βεkjkjPkjψkj,n,,a+kγ1βεkγ+1γβεk(31)

By combining the formula 11 and 25, the combinatorial iteration results in S and R.

Next, focus on the analysis of critical propagation probability, leading to the introduction of Eq. 32:

Θβε,ρ0,a,γ,λ=βεkjkjPkjψkj,n,,a+kγ1βεkγ+1γβεk+γ1βεγ+1γβεβε(32)

θεc is used to represent the critical probability point of θεt. Under the unit critical propagation probability, when t, information cannot propagate to node j through the corresponding edge. At the critical value of θεc, Θβε,ρ0,a,γ,λ is tangent to the horizontal axis. Thus, the critical condition can be delineated as shown in Eq. 33:

dΘdθε|θεc=0(33)

4 Simulation and discussion

To validate the theoretical analysis mentioned above, we conducted numerical simulations and theoretical analysis based on weighted Erdos-Renyi (ER) networks [34] and weighted Scale-Free (SF) networks [35].

Firstly, a more comprehensive introduction to the Erdos-Renyi (ER) network and the Scale-Free (SF) network is provided. The ER network model is one of the most fundamental models in the study of complex network theory and holds significant importance for understanding randomness in networks and stochastic phenomena within networks. The construction rules are as follows: (1) There is a fixed number of nodes within the network; (2) Each pair of nodes is randomly connected with the same probability p, meaning that the existence of an edge (link) between any two nodes is independent, and this probability is identical for all node pairs; (3) The ER network model typically refers to an undirected graph, where edges have no direction; (4) The network contains no self-loops (nodes connecting to themselves) and multiple edges (more than one edge between the same pair of nodes) [36]. The ER network has practical applications, including: the ER model can be used to simulate random friendship formation in social networks [37], in bioinformatics, it is utilized to model the randomness of gene regulatory networks or protein interaction networks [38], and it can also be applied in transportation networks to simulate random route selection in urban traffic networks [39].

The SF network is a network model characterized by a power-law distribution in the connectivity degree of its nodes. The basic steps for constructing an SF network are as follows: (1) Initial Network: Start with a small network, typically consisting of a few nodes and the connections between them; (2) Growth: Over time, the network grows by adding new nodes. Each new node comes with several edges that connect to certain nodes in the existing network; (3) Preferential Attachment: The probability that a new node connects to an existing node is proportional to its degree (i.e., the number of connections of the existing node). This means that the more connections a node has, the higher the likelihood it will attract new connections; (4) Network Topology: In this manner, the network’s topology evolves over time, developing a special degree distribution known as a power-law distribution, which is one of the characteristics of SF networks; (5) No Self-Loops and Multiple Edges: Self-loops (nodes connecting to themselves) and multiple edges (more than one edge between two nodes) are generally not allowed during the construction process; (6) Network Size: Nodes and edges can continue to be added until the network reaches the desired scale [40]. Related instances of SF networks include: Protein interaction networks and metabolic networks in biological systems are often modeled as SF networks [41]. Certain parts of power transmission networks can be modeled as SF networks to study their robustness and vulnerability [42]. In financial markets, the network of transaction relationships between companies also exhibits characteristics of SF networks [43].

In the weighted ER network and SF network, 10,000 independent nodes are set in the network, the average degree of the network k=10, the weight distribution is fXεεαε, εmax1/αε1, and the average weight ε=8. In addition, the probability of the A-state node returning to the R-state is γ=1.0.

In this paper, the relative variance X is used to illustrate the critical unit propagation probability and critical conditions in the simulation, and is articulated by Eq. 34 as follows:

κ=NR2R2R(34)

Where ... is the set mean, and the maximum value of κ is the critical point of the final adoption scale.

The analysis of information dissemination models within this study relies on the thermodynamic classification of phase transitions. Phase transitions are categorized based on the mathematical characteristics—continuous or discontinuous—of the partial derivatives of free energy with respect to temperature and pressure at the transition point. This categorization includes first-order, second-order, and higher-order phase transitions, with the focus of this study being on the first two types. In the context of thermodynamics, a first-order phase transition is characterized by equal chemical potentials between the new and old phases, yet differing first-order partial derivatives. This type of transition is associated with a discontinuous change in both entropy and volume. A second-order phase transition is distinguished by equal chemical potentials and first-order partial derivatives between phases, but with second-order partial derivatives that are not equal, resulting in no change in entropy or volume. The phase transition model is employed to describe the growth rate of the dissemination range during the process of information dissemination. A rapid growth in the dissemination range with the unit dissemination probability, marked by a discontinuous change, is classified as a first-order discontinuous phase transition. In contrast, a slow growth exhibiting a continuous change is classified as a second-order continuous phase transition.

In this section, to conduct a more nuanced examination of the influence of the HECO characteristic on the propagation of information within social networks, we focus on two parameters that are most representative of the HECO trait: the proportion of the common population q0 and the hesitation parameter a. Consequently, this section predominantly employs these two parameters, q0 and a, in our simulation analysis to explore the distinct dissemination patterns of information across various proportions of hesitant and common populations within the network, as well as under different levels of individual decisiveness.

4.1 The propagation process of weighted ER network

In this paper, the propagation of information on weighted ER network is discussed first. The nodes in ER network obey Poisson distribution, that is, Pk=ekkk/k!.

Figure 3 describes the impact of the unitary propagation probability λ on the ultimate propagation range R in a weighted ER network when the decision-making ability of the hesitant population is relatively strong (hesitancy parameter a=0.2), under different proportions of the hesitant population. The initial proportion of nodes in state A, ρ0=0.001. Subfigures 3(a1) and 3(b1) indicate that as λ increases, the ultimate adoption range R gradually enlarges. It can also be observed that at higher values of λ (λ>0.5), where the change in the ultimate propagation range with λ is minimal, the larger the proportion of the common population, the greater the ultimate adoption range R at equilibrium. When the proportion of the common population q0 is large (q0=0.8), the information propagation exhibits a first-order discontinuous phase transition, whereas for smaller or half proportions of the common population (q0=0.2 and q0=0.5), it exhibits a second-order continuous phase transition. Subfigures 3(a2) and 3(b2) present the statistical calculations of the relative standard deviation for both theoretical analysis and simulation values, as well as the critical points derived from subfigures 3(a1) and 3(b1). As the proportion of the common population increases, the growth in information adoption and the onset of the adoption explosion threshold are delayed. However, this delay results in a more rapid attainment of a global adoption state. This suggests that when the hesitant population possesses a strong decision-making ability, a smaller proportion of the common population results in faster propagation and an earlier onset, although the rate of propagation range growth with unitary propagation probability remains relatively slow. Conversely, when the proportion of the common population is large, the onset of information propagation is further delayed. Yet, the rate of propagation range growth with unitary propagation probability is more rapid, potentially leading to a discontinuous phase transition and a swifter achievement of a global adoption state. Moreover, in comparison to Figures 3A, B, an increase in the weighted distribution exponent is shown to advance the adoption explosion point. However, variations in the weight distribution do not impact the phase transition mode.

Figure 3
www.frontiersin.org

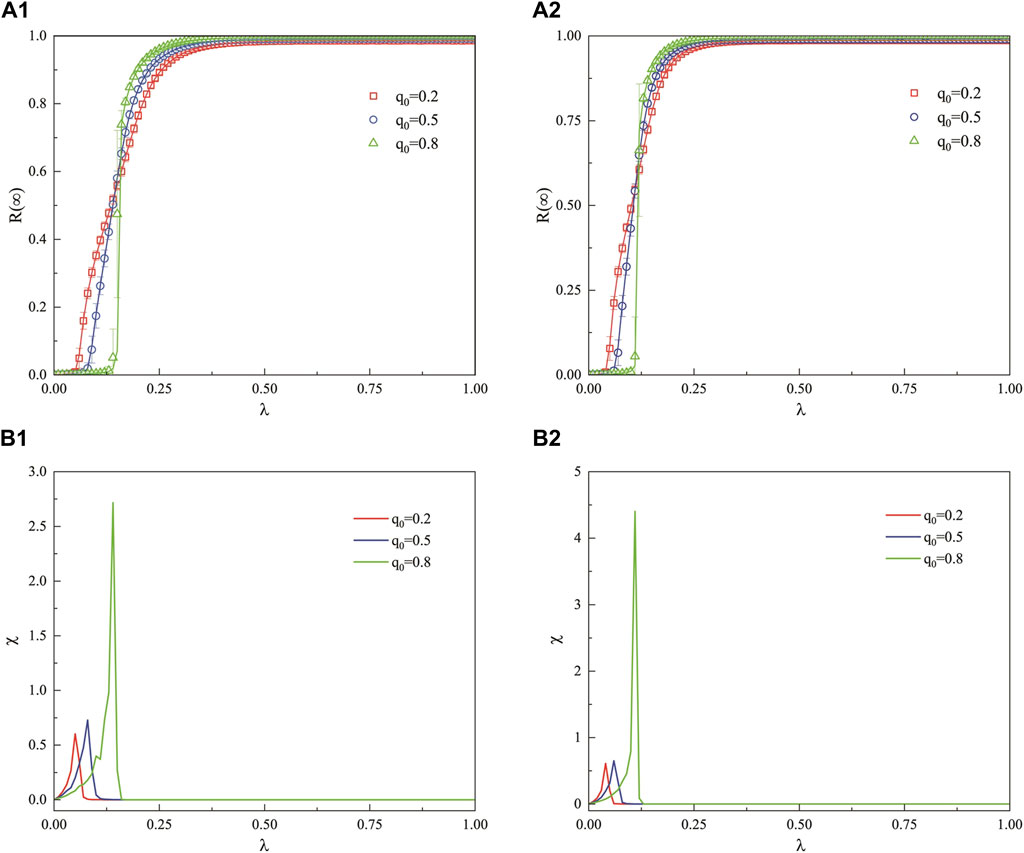
Figure 3. In the weighted ER network, when the decision-making ability of the hesitant population is relatively strong, the variation of the final propagation range for both adopting populations under different proportions q0 as a function of the propagation probability λ is depicted. Subfigures (A1,B1) illustrate the impact of different edge weights (ε=25 and ε=35) on the propagation patterns, respectively. Subfigures 3 (A2,B2) represent the distribution of the relative standard deviation of the simulation results and the critical points of the propagation threshold in subfigures 3(a1) and 3(b1), respectively. Other parameters are set to ρ0=0.001 and a=0.2.

Figure 4 illustrates the impact of the unit propagation probability λ on the ultimate propagation range in a weighted ER network when the decision-making ability of the hesitant population is moderate (a=0.5), across various proportions of the hesitant population q0. Subfigures 4(a1) and 4(b1) indicate that under different weight distributions, the proportion of the ordinary population q0 does not significantly affect the propagation pattern of information; that is, the adoption outbreak points are essentially consistent, and both exhibit a first-order discontinuous phase transition. However, when the information propagation outbreak occurs, it is observed that a larger proportion of the ordinary population q0 results in a larger ultimate adoption range R at equilibrium. Subfigures 4(a2) and 4(b2) present the relative standard deviation calculated from the statistical simulation values and the critical threshold for the propagation outbreak as shown in subfigures 4(a1) and 4(b1), respectively. As the proportion of the common population increases, information propagation can reach equilibrium at a relatively lower unit propagation probability λ in the early stages. These observations suggest that under moderate decision-making ability, regardless of the proportion of the common population, the outbreak threshold for information propagation remains the same, but a larger proportion of the common population leads to a greater jump in the adoption range during the outbreak and a more rapid achievement of the global adoption state. Similarly, when the proportion of the common population q0 is small, the jump in the adoption range during the outbreak and the ultimate adoption range at equilibrium are also relatively smaller, failing to reach global propagation. Additionally, compared to Figure 4A, with Figure 4B, an increase in the weighted distribution index advances the adoption outbreak point, but changes in the weight distribution do not affect the phase transition pattern of propagation.

Figure 4
www.frontiersin.org

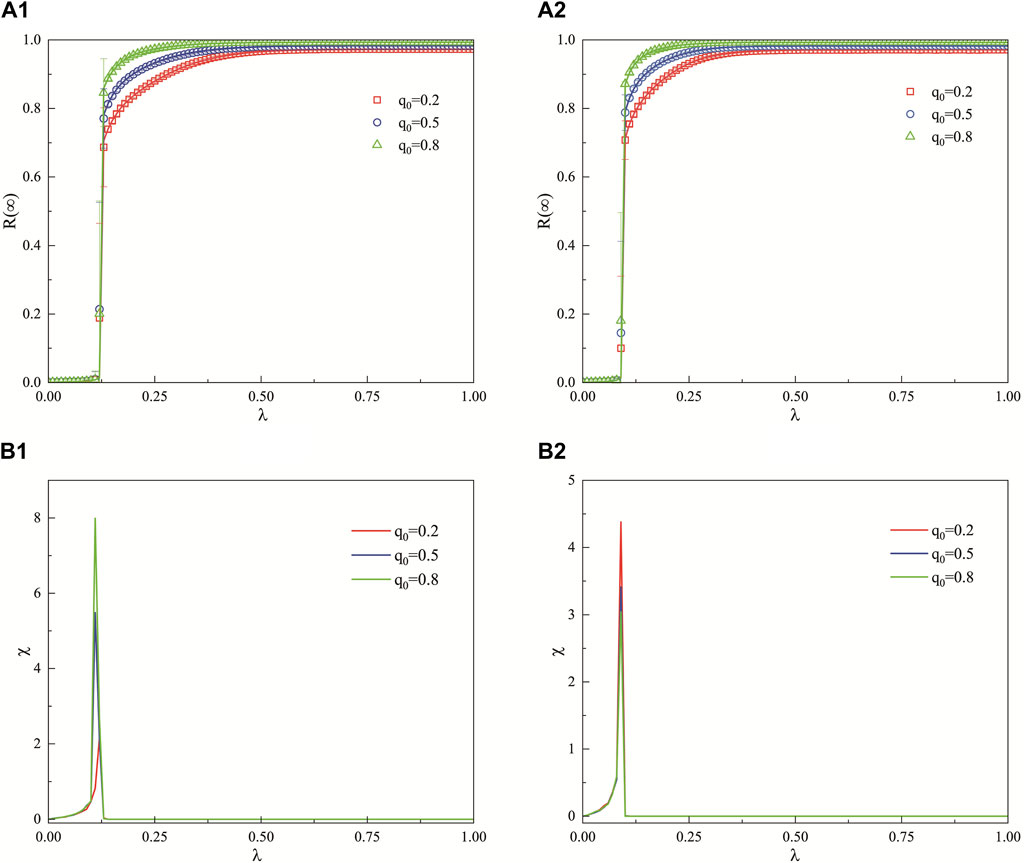
Figure 4. In the context of a weighted ER network, where the decision-making capacity of the hesitant population is moderate, this figure examines the effect of the unit propagation probability λ on the ultimate propagation range across various proportions of the common population q0. Subfigures 4 (A1,B1) depict the influence of weight distribution variations (ε=25 and ε=35) on the propagation patterns. Subfigures 4 (A2,B2) present the statistical computation of the relative standard deviation of the simulated values and the critical threshold for propagation outbreak as indicated in subfigures 4(a1) and 4(b1), respectively. Additional parameters are fixed at ρ0=0.001 and a=0.5.

From Figures 5A1, B1, it can be observed that as the unit propagation probability λ increases, the ultimate adoption range R gradually enlarges, and the larger the proportion q0 of the common population, the greater the ultimate adoption range R at equilibrium. At q0=0.8 and q0=0.5, the propagation pattern of the ultimate adoption range exhibits a second-order continuous phase transition, while at q0=0.2, it shows a first-order discontinuous phase transition. Figures 5A2, B2 indicate that the larger the proportion q0 of the common population, the smaller the unit propagation probability threshold at the time of adoption outbreak. Figures 5A, B demonstrate that when the decision-making ability of the hesitant population is low, a larger proportion of the common population can reach the information adoption outbreak point at a smaller unit propagation probability λ, and the ultimate adoption range at equilibrium is larger. Conversely, when there is a smaller proportion of the ordinary population, the outbreak threshold for information propagation is higher, and the ultimate adoption range at equilibrium is relatively smaller. Additionally, compared to Figure 5A, with Figure 5B, the adoption outbreak point advances with an increase in the weighted distribution index, but changes in the weight distribution do not alter the phase transition pattern of propagation.

Figure 5
www.frontiersin.org

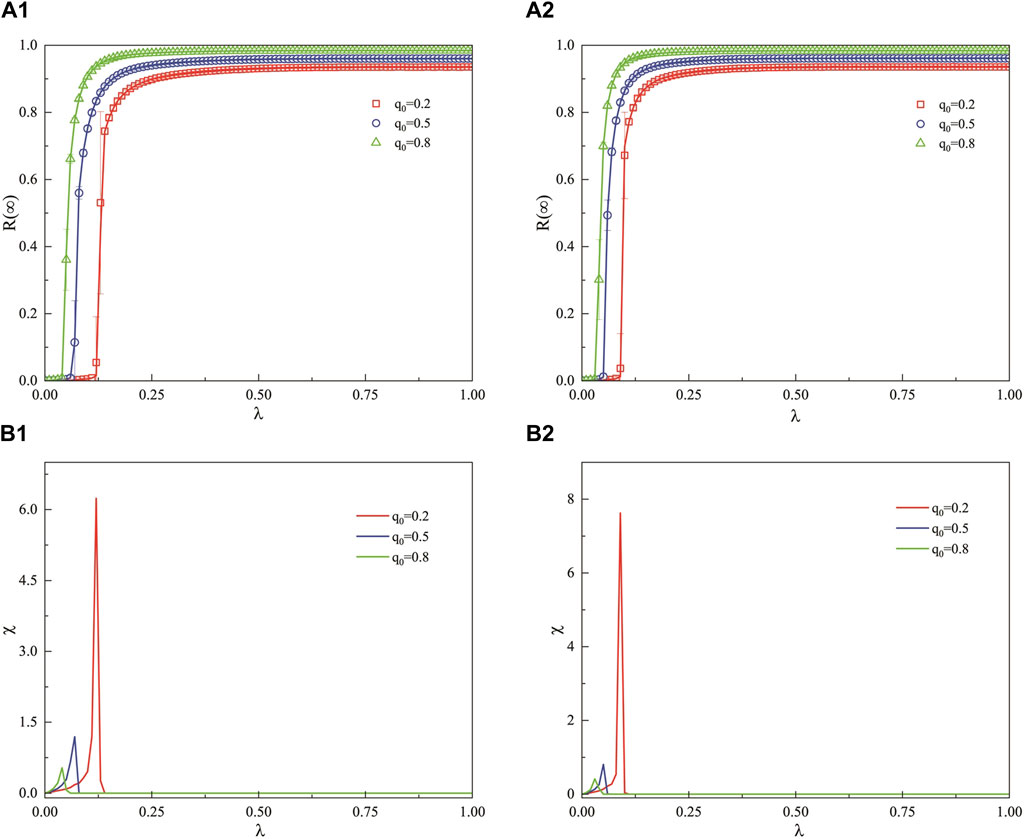
Figure 5. Under the weighted ER network, this figure presents the influence of the unit propagation probability λ on the ultimate adoption range across different proportions of the common population q0 when the decision-making ability of the hesitant population is relatively weak. Subfigures (A1,B1) demonstrate the effects of changes in weight distribution (ε=25 and ε=35) on the propagation patterns. Subfigures 5 (A2,B2) represent the statistical computation of the relative standard deviation of the simulated values and the critical threshold for the information outbreak as indicated in subfigures 5(a1) and 5(b1). Other parameters are set to ρ0=0.001 and a=0.8.

Figure 6 describes the joint effect of the unit propagation probability λ and the hesitancy parameter a on the ultimate adoption range R in a weighted ER network when the proportions of the hesitant and common populations are equal (q0=0.5), under different weight distributions (subfigure 6(a) with ε=25 and subfigure 6(b) with ε=35). The initial proportion of nodes in state A, ρ0=0.001. The joint effect plane is divided into four regions based on different propagation patterns of information, Region I: With the increase in the unit propagation probability λ and the hesitation parameter a, the color temperature remains unchanged and is at its lowest, indicating that no information propagation phenomenon has occurred. Regions II and IV: With the increase in the unit propagation probability λ and the hesitation parameter a, there is a distinct stage of continuous color temperature change in the color temperature map, signifying that a second-order continuous phase transition has occurred in these areas. Region III: Upon With the increase in the unit propagation probability λ and the hesitation parameter a, there is a distinct moment of abrupt color temperature change in the color temperature map, indicating that a first-order discontinuous phase transition has occurred in this area. In Region I, where the hesitancy parameter is very small, indicating a very strong decision-making ability of the hesitant population, no information propagation outbreak occurs. This is because the hesitant population, with strong decision-making ability, inhibits the spread of information. In Region II, as the hesitancy parameter increases (indicating a weakening decision-making ability), the growth of the ultimate adoption range R exhibits a second-order continuous phase transition. This is due to the hesitant population dominating in the early stages of information propagation when the decision-making ability is relatively strong, leading to an outbreak. Subsequently, as λ increases, the common population continues the propagation on the basis of the hesitant population. In Region III, with a further increase in the hesitancy parameter and a continued weakening of decision-making ability, the growth of the ultimate adoption range R exhibits a first-order discontinuous phase transition. In this region, the decision-making ability of the hesitant population is moderate, and the adoption capabilities of the hesitant and common populations are similar, with no dominant side. Both sides have similar outbreak thresholds and outbreak simultaneously during the propagation process, leading to a first-order discontinuous phase transition. In Region IV, where the hesitancy parameter is large and the decision-making ability of the population is very low, the growth of the ultimate adoption range R exhibits a second-order continuous phase transition. This is the result of the common population dominating the propagation when the decision-making ability of the hesitant population is low, hence the outbreak threshold for this second-order continuous propagation is smaller than that in Region II. This also illustrates that the common population has a stronger promoting effect on the outbreak of information propagation than the hesitant population. Furthermore, compared to Figures 6A, B indicates that an increase in the weighted distribution index can promote the adoption of information.

Figure 6
www.frontiersin.org

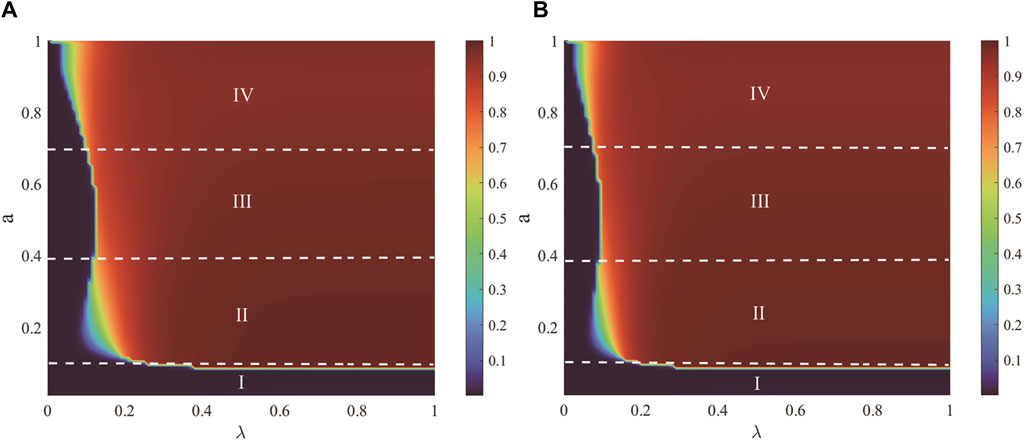
Figure 6. The joint effect of the unit propagation probability λ and the hesitancy parameter a on the ultimate adoption range R in a weighted ER network. Under different weight distributions, subfigure 6 (A) (ε=25) and subfigure (B) (ε=35) illustrate the occurrence of information stagnation propagation, first-order continuous phase transition, second-order continuous phase transition, and first-order discontinuous phase transition phenomena in regions I, II, III, and IV, respectively. All other parameters are set to ρ0=0.001 and q0=0.5.

Figure 7 illustrates the joint effect of the unit propagation probability λ and the proportion of the common population q0 on the ultimate adoption range R in a weighted ER network, under different decision-making abilities of the hesitant population with a constant weight distribution index. The initial proportion of nodes in state A, ρ0=0.001, with hesitancy parameters a being 0.2 for subfigure 7(a), 0.5 for subfigure 7(b), and 0.8 for subfigure 7(c). In subfigure 7(a), where the hesitant population has a strong decision-making ability (a=0.2), the figure can be divided into two regions based on the phase transition patterns. As the proportion of the common population q0 increases, there is a transition from a second-order continuous phase transition in Region I to a first-order discontinuous phase transition in Region II. Region I: With the increase in the unit propagation probability λ and the proportion of the common population q0, there is a distinct stage of continuous color temperature change in the color temperature map, signifying that a second-order continuous phase transition has occurred in these areas. Regions II: With the increase in the unit propagation probability λ and the proportion of the common population q0, there is a distinct moment of abrupt color temperature change in the color temperature map, indicating that a first-order discontinuous phase transition has occurred in this area. In Region I (q0<0.8), the proportion of the hesitant population gradually decreases with increasing q0, causing a delay in the outbreak of information propagation. However, the phase transition mode of propagation shifts from continuous to discontinuous. This is because the hesitant population, which is dominant at this stage, determines the outbreak of information propagation. Therefore, the more the hesitant population, the easier the outbreak, but due to their slower propagation speed, the growth of propagation is initially slow until the threshold of the common population is reached, after which the propagation range grows rapidly. In Region II (0.8<q01), where the common population is in the majority, the proportion of the hesitant population decreases with increasing q0, insufficient to support an outbreak of propagation. The outbreak of information propagation becomes more delayed and approaches an outbreak that would occur if only the common population were present, leading to a first-order discontinuous propagation pattern that reaches a global adoption state. Observing horizontally at lower unit propagation probabilities (λ<0.2), Region I has already reached global adoption, while Region II has not yet begun to propagate, confirming the above conclusions. In subfigure 7(b), the growth pattern of R is a first-order discontinuous phase transition across all regions. Upon With the increase in the unit propagation probability λ and the proportion of the common population q0, The color temperature map exhibits an abrupt change in color temperature at a fixed unit propagation probability ‘a', indicating the occurrence of a first-order discontinuous phase transition in that region. When the decision-making ability of the hesitant population is moderate (a=0.5), the common and hesitant populations have equal dominance. The proportion of the common population q0 does not affect the outbreak of information propagation; all propagation outbreaks have consistent thresholds as shown in the figure. Despite the consistent thresholds across different proportions, the different adoption phenomena of the hesitant and common populations lead to an increase in the ultimate adoption range R at the time of propagation outbreak as the proportion of the common population q0 increases. This is because the common population has a stronger promoting effect on the propagation process than the hesitant population. Therefore, when there is a larger common population, the adoption rate during the propagation outbreak is faster, resulting in a larger adoption range. Subfigure 7(c) is divided into two regions based on the phase transition patterns, Region I: As the unit propagation probability λ and the proportion of the common population q0 increase, the color temperature map exhibits a distinct moment of abrupt color temperature change, transitioning from the lowest to the highest color temperature, indicating that a first-order discontinuous phase transition has occurred in this region. Region II: With the increase in the unit propagation probability λ and the proportion of the common population q0, the color temperature map displays a less pronounced continuous change in color temperature, showing a gradual transition from the lowest to the highest color temperature as compared to Region 1, signifying that a second-order continuous phase transition has taken place in this region. When the decision-making ability of the hesitant population is weak (a=0.8), the adoption phenomenon of the common population dominates. In Region I (q0<0.2), where the proportion of the common population is small, there is insufficient dominant population to guide the outbreak of propagation, making the propagation more closely aligned with the outbreak threshold of the hesitant population and exhibiting a discontinuous propagation pattern. As the proportion of the common population q0 increases and enters Region II (0.2<qo1), the common population takes the lead in propagation, with the common population initiating the outbreak first, followed by the hesitant population, showing continuous characteristics. However, due to the promoting effect of the common population on information propagation, the continuous features are not as strong as those when the hesitant population is dominant in subfigure 7(a). Nevertheless, it can be observed from subfigure 7(c) that as the proportion of the common population increases, the ultimate propagation range at equilibrium also becomes larger.

Figure 7
www.frontiersin.org

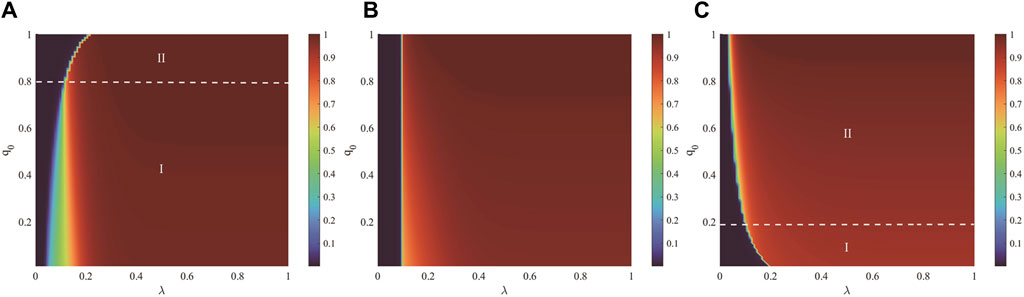
Figure 7. The joint effect of the unit propagation probability λ and the proportion of the common population q0 on the ultimate adoption range R in a weighted ER network is depicted. Subfigures 7 (A) (a=0.2), (B) (a=0.5), and (C) (a=0.8) represent the influence of λ and q0 on the ultimate adoption range under different decision-making abilities of the hesitant population. In subfigure 7 (A), Region I exhibits a second-order continuous phase transition, and Region II exhibits a first-order discontinuous phase transition; in subfigure 7 (B), the entire region shows a first-order discontinuous phase transition; in subfigure 7 (C), Region I exhibits a first-order discontinuous phase transition, and Region II exhibits a second-order continuous phase transition. All other parameters are set to ρ0=0.001 and a=0.5.

4.2 The propagation process of weighted SF network

In the weighted SF network, the degree distribution heterogeneity of nodes is negatively correlated with the degree index ν, the degree of nodes follows the power distribution Pk=ξkν, ξ=1/kkν, and the parameter ν represents the degree index of SF network.

Figure 8 demonstrates the impact of the unit propagation probability λ on the ultimate adoption range R for different proportions of the common population q0 in a weighted SF network, when the decision-making ability of the hesitant population is strong (hesitancy parameter a=0.2). Subfigures 8(a1) and 8(b1) show the effects of different degree indices ν=2.1 and ν=4 on the propagation patterns, respectively. The initial proportion of nodes in state A, ρ0=0.001, and the edge weight is taken as ε=25. It can be observed from subfigures 8(a1) and 8(b1) that as λ increases, R gradually enlarges. However, in subfigure 8(a1), an increase in the proportion of the common population enhances the ultimate adoption range at equilibrium, while in subfigure 8(b1), the ultimate propagation reaches global propagation at equilibrium. It is also noticeable that when the proportion q0 is small (q0=0.2), indicating a larger number of hesitant individuals, the propagation outbreak threshold occurs earlier compared to when the proportion is larger (q0=0.5 and q0=0.8). This is attributed to the stronger decision-making ability of the hesitant population, which takes the leading role. Therefore, when the dominant population is larger, it facilitates the outbreak of information propagation, aligning with the propagation phenomena and theories observed in weighted ER networks. Additionally, it is found that the propagation patterns during the outbreak differ; when q0=0.2 and q0=0.5, a second-order continuous propagation phenomenon is exhibited, but there is a change in the slope of the propagation trend line, due to the initial outbreak being dominated by the hesitant population followed by the inclusion of the common population, leading to a change in the propagation speed. Furthermore, as the degree index ν increases (indicating a decrease in degree distribution heterogeneity), making the degrees of individuals in the network more similar, the propagation outbreak threshold does not change significantly. However, the ultimate adoption range at equilibrium increases, and the propagation rate becomes faster, eventually reaching global adoption. Thus, when the decision-making ability of the hesitant population is strong, reducing the degree distribution heterogeneity can promote a larger ultimate adoption range and even global propagation at equilibrium. Subfigures 8(a2) and 8(b2) represent the relative standard deviation computed from the statistical analysis of the simulation values and the critical threshold for the propagation outbreak as indicated in subfigures 8(a1) and 8(b1), respectively. Moreover, the theoretical analysis (curves) matches well with the simulation values (symbols), indicating a good fit.

Figure 8
www.frontiersin.org

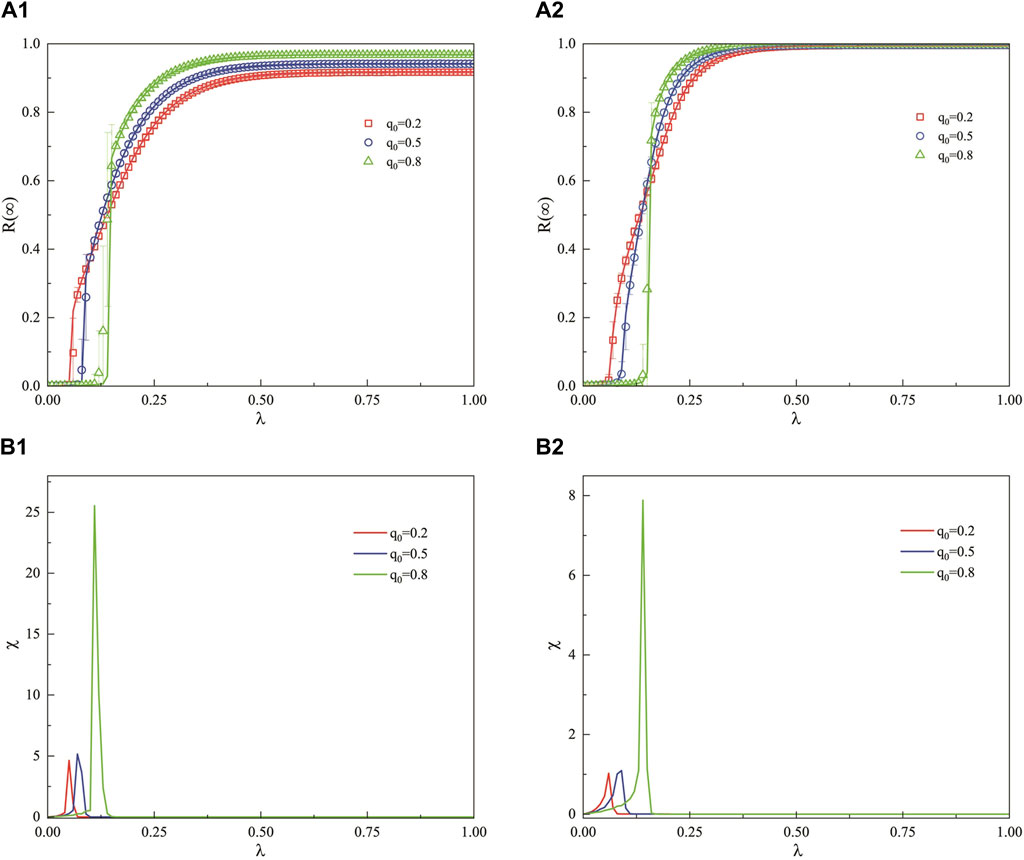
Figure 8. In a weighted SF network, when the decision-making ability of the hesitant population is relatively strong, this figure illustrates the impact of the unit propagation probability λ on the ultimate propagation range across different proportions of the common population q0. Subfigures 8 (A1) (ν=2.1) and 8 (B1) (ν=4) describe the influence of different degree indices on the propagation patterns. Subfigures 8 (A2,B2) represent the statistical computation of the relative standard deviation of the simulated values and the critical threshold for propagation outbreak as indicated in subfigures 8(a1) and 8(b1), respectively. The remaining parameters are fixed at ρ0=0.001, a=0.2, and ε=25.

Figure 9 depicts the influence of the unit propagation probability λ on the ultimate adoption range in a weighted SF network when the decision-making ability of the hesitant population is moderate, across different proportions q0 of the common population. Subfigures 9(a1) and 9(b1) showcase the effects of different degree indices (ν=2.1 and ν=4) on the propagation patterns. The initial proportion of nodes in state A, ρ0=0.001, with an edge weight value of ε=25. As λ increases, R gradually enlarges, and the proportion q0 of the common population has no significant effect on the outbreak point of propagation. This is because, at this time, the adoption thresholds of both hesitant and common individuals are essentially the same, consistent with the propagation phenomena observed in the aforementioned ER networks. However, the larger the proportion of the common population, the greater the ultimate adoption range R achieved during the propagation outbreak. Additionally, as the degree heterogeneity index ν increases (indicating a decrease in degree distribution heterogeneity), making the degrees of individuals in the network more similar, the outbreak threshold for information propagation does not change significantly. However, the ultimate adoption range at equilibrium increases, and the propagation rate becomes faster, reaching global adoption at equilibrium. Subfigures 9(a2) and 9(b2) present the statistical computation of the relative standard deviation of the simulated values and the critical threshold for the propagation outbreak as indicated in subfigures 9(a1) and 9(b1), respectively. When the decision-making ability of the hesitant population is moderate, the growth pattern of the adoption range R is discontinuous for different proportions of the common population q0 and different degree indices ν. Therefore, reducing the degree distribution heterogeneity can promote a larger ultimate adoption range in information propagation when the decision-making ability of the hesitant population is moderate. Moreover, the theoretical analysis (curves) matches well with the simulation values (symbols), indicating a good fit.

Figure 9
www.frontiersin.org

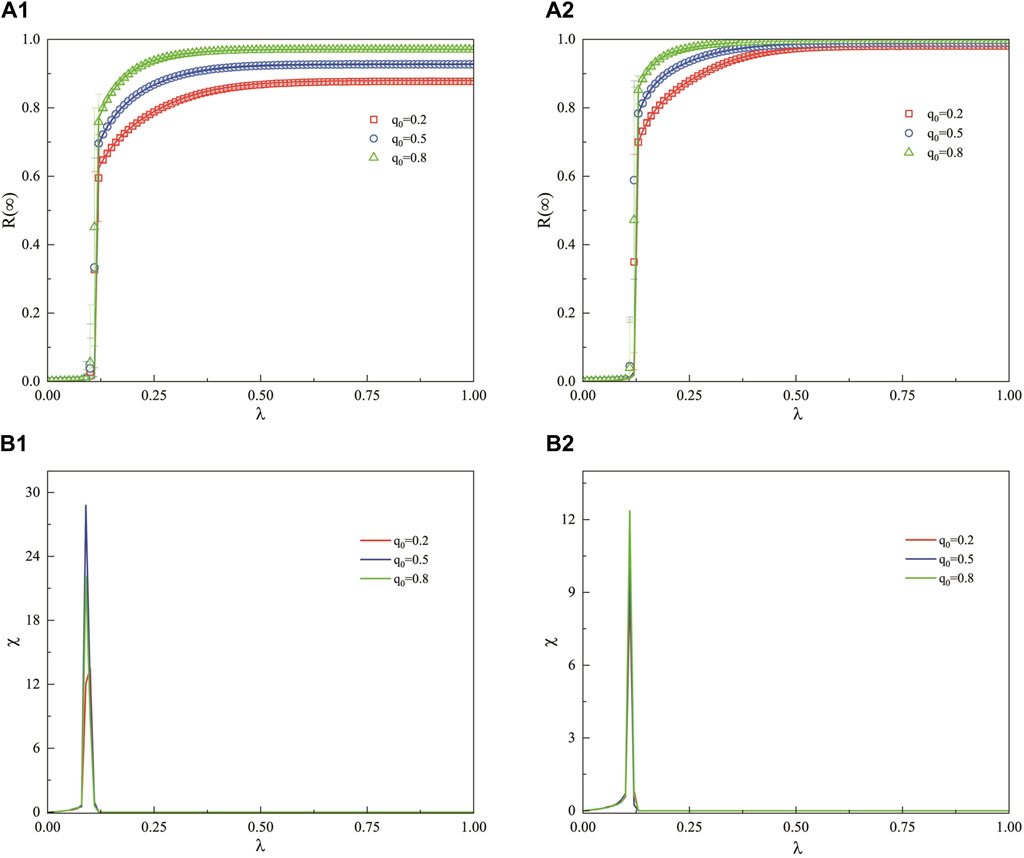
Figure 9. In a weighted SF network, this figure examines the influence of the unit propagation probability λ on the propagation range under different proportions of the common population q0 when the decision-making ability of the hesitant population is moderate. Subfigures 9 (A1) with degree exponent ν=2.1 and 9 (B1) with ν=4 illustrate the effects of different degree indices on the propagation patterns. Subfigures 9 (A2,B2) depict the statistical computation of the relative standard deviation of the simulated values and the critical threshold for the propagation outbreak as indicated in subfigures 9(a1) and 9(b1), respectively. All other parameters are set to ρ0=0.001, a=0.2, and ε=25.

Figures 10A1, B1 present the influence of different degree indices (ν=2.1 and ν=4) on the propagation patterns, with an initial proportion of nodes in state A (ρ0=0.001) and an edge weight value (ε=25). As the unit propagation probability λ increases, the ultimate adoption range R gradually enlarges. From Figure 10A1, it can be observed that when q0=0.8, indicating that the majority of the population is in the common state, the outbreak threshold for propagation occurs earlier compared to when q0=0.2 and q0=0.5. This is attributed to the weaker decision-making ability of the hesitant population, where the common population takes a dominant role in propagation. Furthermore, due to the promoting effect of the common population on propagation, a higher proportion of the common population leads to a larger ultimate propagation range at equilibrium. These conclusions and phenomena are consistent with the theories and observations derived from weighted ER networks. Comparing Figures 10A1, B1, it is noted that as the degree heterogeneity index ν increases (indicating a reduction in degree distribution heterogeneity) and the degrees of individuals in the network become more similar, the ultimate adoption range in Figure 10B1 is larger at equilibrium compared to that in Figure 10A1, although the outbreak threshold for propagation does not change. Figures 10A2, B2 provide the statistical computation of the relative standard deviation of the simulated values and the critical threshold for the propagation outbreak as indicated in Figures 10A1, B1, respectively. It can be seen from the figures that when the decision-making ability of the hesitant population is weak, reducing the degree distribution heterogeneity can increase the ultimate adoption range at equilibrium for information propagation. Moreover, the theoretical analysis values (curves) match well with the simulation values (symbols), indicating a good fit.

Figure 10
www.frontiersin.org

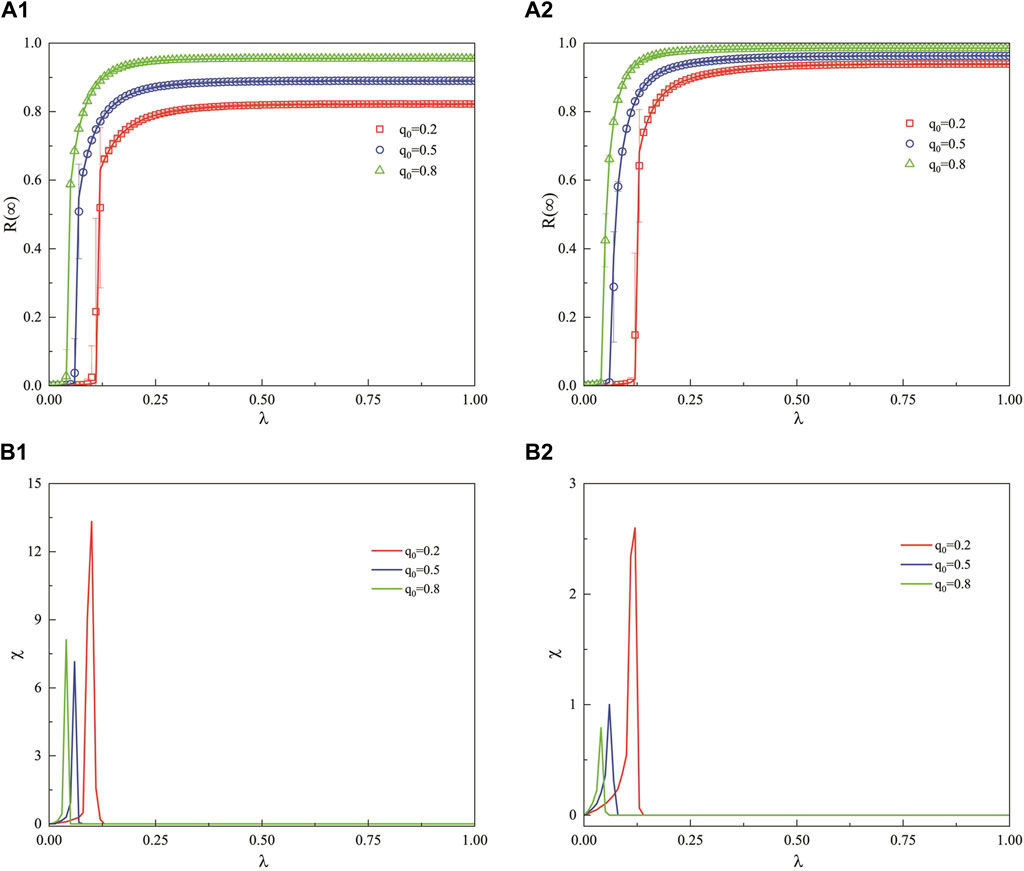
Figure 10. In a weighted SF network, this figure examines the impact of the unit propagation probability λ on the ultimate propagation range under different proportions q0 of the common population when the decision-making ability of the hesitant population is relatively weak. Subfigures 10 (A1) with degree index ν=2.1 and 10 (B1) with ν=4 illustrate the effects of different degree indices on the propagation patterns. Subfigures 10 (A2,B2) provide the statistical computation of the relative standard deviation of the simulated values and the critical threshold for the propagation outbreak as indicated in subfigures 10(a1) and 10(b1), respectively. The remaining parameters are set to ρ0=0.001, a=0.8, and ε=25.

Figure 11 illustrates the combined effect of the unit propagation probability λ and the hesitancy parameter a on the ultimate adoption range R in a weighted SF network with a high degree of heterogeneity in the degree distribution. The initial proportion of nodes in state A, ρ0=0.001, with an edge weight value of ε=25 and a degree exponent v=2.1. Figure 11A (q0=0.2), 11(b) (q0=0.5), and 11(c) (q0=0.8) are each divided into three regions, the regional division of information propagation patterns is analogous to that in ER networks, where the delineation is based on the continuous and discontinuous changes in color temperature. Transitioning from Region I, representing the second-order continuous phase transition stage, to Region II, the first-order discontinuous phase transition stage, and finally to Region III, another second-order continuous phase transition stage. In Figure 11A, where the proportion of the common population is small (q0=0.2), the outbreak threshold for information propagation initially increases and then decreases with the weakening of the population’s decision-making ability, and the propagation rate follows a similar pattern. This suggests that in networks with high degree distribution heterogeneity and a larger hesitant population, the weakening of decision-making ability initially leads to a suppressive effect of the hesitant population on the outbreak of information propagation. Subsequently, as the common population becomes dominant, the rate of information propagation accelerates. When the decision-making ability is very weak (a0.8), the suppressive effect of the hesitant population on information propagation is more pronounced, leading to a slower propagation rate. Figures 11B, C correspond to scenarios where the proportions of the common and hesitant populations are equal (q0=0.5) and where the common population has a larger share (q0=0.8), respectively. As the decision-making ability weakens, the propagation mechanism is similar to that when the proportion of the common population is small in Figure 11A, with the distinction that the dividing lines between Regions I and II in Figures 11B, C occur at a=0.4 and a=0.2, respectively. This indicates that when there is a smaller hesitant population with stronger decision-making ability, there is a promotional effect on information propagation.

Figure 11
www.frontiersin.org

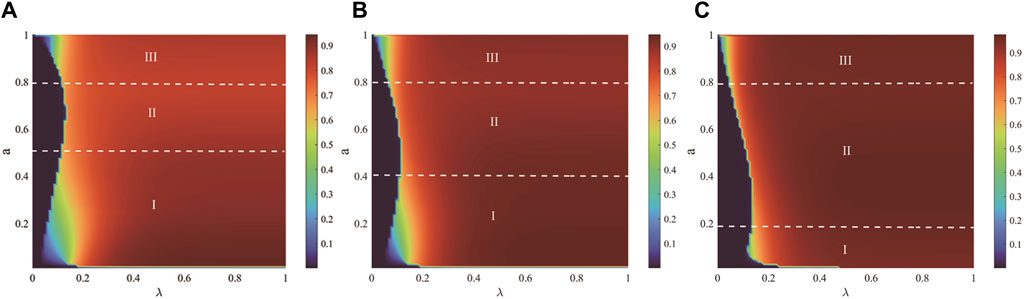
Figure 11. This figure illustrates the combined effect of the unit propagation probability λ and the hesitancy parameter a on the ultimate adoption range R in a weighted SF network. Subfigures 11 (A–C) correspond to different proportions of the coomon population, with (A) for q0=0.2, (B) for q0=0.5, and (C) for q0=0.8. Each of these subfigures is divided into three distinct regions: Region I represents the second-order continuous phase transition stage, Region II the first-order discontinuous phase transition stage, and Region III the second-order continuous phase transition stage. The remaining parameters are set to ρ0=0.001, ε=25, and v=2.1.

Figure 12: This figure represents the combined effect of the unit propagation probability λ and the hesitancy parameter a on the ultimate adoption range R in a weighted SF network, where the degree distribution exhibits a relatively lower degree of heterogeneity. The initial proportion of nodes in state A, ρ0=0.001, with an edge weight value of ε=25 and a degree index ν=4. Figure 12A (q0=0.2) and 12(b) (q0=0.5) are each divided into four regions, the regional division of information propagation patterns is analogous to that in ER networks, where the delineation is based on the continuous and discontinuous changes in color temperature. Reflecting the transition of information propagation from non-propagation to discontinuous propagation, then to continuous propagation, back to discontinuous propagation, and finally to continuous propagation as the decision-making ability of the population weakens. When the network has a relatively low degree of heterogeneity and the population has a very strong decision-making ability (a0.1), but the proportion of the hesitant population is large or moderate, information propagation is challenging, transitioning from non-propagation to gradual propagation. As the decision-making ability decreases, the propagation mechanisms in regions II, III, and IV of Figures 12A, B are similar to those in Figures 11A, B. Figure 12C (q0=0.8) is divided into two regions. When the common population constitutes a larger proportion of the network, the unit propagation probability at the outbreak threshold for information propagation decreases, and the propagation shifts from discontinuous to continuous as the decision-making ability of the population weakens. Due to the dominant role of the common population, which promotes propagation, the outbreak threshold decreases. However, when the decision-making ability of the hesitant population is very weak (a0.8), there is a suppressive effect on information propagation, but since the hesitant population is small, there is a brief phase of continuous propagation.

Figure 12
www.frontiersin.org

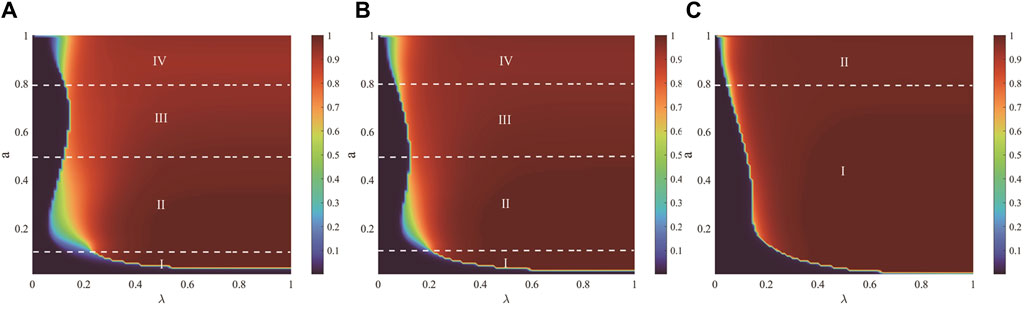
Figure 12. The joint effect of the unit propagation probability λ and the hesitancy parameter a on the ultimate adoption range R in a weighted SF network is depicted. Subfigures 12 (A–C) represent different proportions of the common population, with (A) for q0=0.2 and (B) for q0=0.5 each divided into four regions: Region I, the first-order discontinuous phase transition stage; Region II, the second-order continuous phase transition stage; Region III, another first-order discontinuous phase transition stage; and Region IV, the second-order continuous phase transition stage. (C) for q0=0.8 is divided into two regions: Region I, the first-order discontinuous phase transition stage, and Region II, the second-order continuous phase transition stage. All other parameters are set to ρ0=0.001, ε=25, and ν=4.

Figure 13 illustrates the combined effect of the unit propagation probability λ and the proportion of the common population q0 on the ultimate adoption range R in a weighted SF network. Subfigures 13(a) and 13(b) depict the impact of λ and q0 on the ultimate adoption range under different degree indices, with ν=2.1 and ν=4, respectively. The propagation patterns in Figures 13A, B are similar; when the population’s decision-making ability is moderate, an increase in the proportion of the common population q0 does not significantly affect the information propagation threshold. However, the larger the degree index ν, indicating less degree distribution heterogeneity, the greater the ultimate adoption range at equilibrium, and the faster the propagation rate, eventually leading to global adoption. Conversely, when the degree index is smaller (ν=2.1), it is only as q0 increases, and the network is predominantly composed of common individuals, that information can achieve global adoption. Thus, a lower degree of distribution heterogeneity more effectively facilitates information propagation to reach a larger adoption range.

Figure 13
www.frontiersin.org

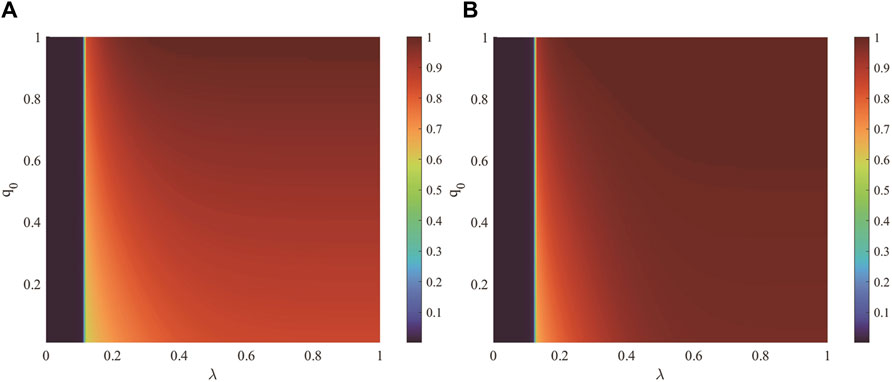
Figure 13. This figure delineates the joint impact of the unit propagation probability λ and the proportion of the common population q0 on the ultimate adoption range R within a weighted SF network. Subfigures 13 (A,B) respectively illustrate the influence of λ and q0 on the ultimate adoption range under different degree indices ν=2.1 and ν=4. All other parameters are held constant at ρ0=0.001, a=0.5, and ε=25.

5 Conclusion

This study investigates the propagation of information in social networks within weighted networks, considering the heterogeneity in group adoption characteristics. The heterogeneity is characterized by distinct Hesitant-Common (HECO) traits in information adoption across different populations. The paper proposes two information adoption functions to elucidate the impact of group heterogeneity on information propagation. For common individuals, their adoption probability increases with the accumulation of received information. However, for hesitant individuals, the adoption probability initially increases similarly to that of common individuals but then declines as more information is received, eventually stabilizing and no longer changing once the optimal decision-making capacity is reached. The study randomly selects a proportion q0 of the population as common individuals, with the remaining proportion e0 designated as hesitant individuals. Interactions among individuals are modeled as edge weights in the social network, leading to the development of a social network information propagation model based on edge weights and HECO characteristics. This model is validated within both ER and SF networks.

Through simulation analysis, this study explores the information adoption behaviors of different types of individuals (hesitant and common), and investigates how these behaviors impact the speed and extent of information dissemination. It also observes phase transition phenomena during the information propagation process, particularly the correlation between the pattern of change in the ultimate adoption range and the proportion of common individuals. The study examines the impact of variations in the weight distribution index on the speed and efficiency of information propagation. It discusses how the heterogeneity in the degree distribution of nodes within the network affects information dissemination and how this heterogeneity interacts with the phase transition patterns of information propagation. The influence of decision-making ability on propagation is a focal point of consideration. Findings align with theoretical analysis, indicating that common individuals facilitate the spread and adoption of information. Furthermore, a phase transition crossover phenomenon is observed, where the growth pattern of R shifts from a first-order discontinuous phase transition to a second-order continuous phase transition as the value of q0 increases. An increase in the weight distribution exponent promotes information propagation. Furthermore, a decrease in degree distribution heterogeneity enhances the spread of information, while an increase in degree distribution heterogeneity, coupled with a weakening of the population’s decision-making ability, inhibits information propagation.

The heterogeneity of groups within social networks plays a pivotal role in the propagation of information, yet there is a paucity of related research. This paper, through rigorous modeling and analysis, reveals the significant impact of the Hesitant-Common (HECO) attributes based on group heterogeneity on information dissemination. Furthermore, the HECO characteristics hold notable potential in practical applications, particularly in understanding and forecasting the dynamics of information propagation within social networks. Below are some potential applications of the HECO model across various domains: (1) Social Media Marketing: By understanding the extent to which users accept advertisements or trending information, the HECO model can assist marketers in designing more effective social media strategies to enhance the velocity and reach of information dissemination; (2) Public Health Campaigns: When promoting health information or awareness of vaccination initiatives, the model can predict the rate at which different demographic groups will accept health-related messages, thereby aiding health organizations in more accurately targeting their promotional resources; (3) Crisis Management: In emergency situations, comprehending the rapid spread of information is essential for an effective crisis response. The HECO model can forecast the speed and breadth of information propagation, assisting in the development of more robust emergency communication strategies; (4) Online Sentiment Analysis: Governments and corporations can utilize the HECO model to monitor and analyze the genesis and evolution of public opinion, thereby gaining a more profound understanding of the needs and reactions of the populace; (5) Product Promotion: Businesses can apply the HECO model to refine their strategies for new product promotion by identifying consumer groups most likely to rapidly accept and disseminate information, thus accelerating the market penetration of their products; (6) Information Security: Within the realm of cybersecurity, the HECO model can aid in the anticipation and prevention of the spread of misinformation or rumors by pinpointing key nodes in the propagation of information to bolster network defenses; (7) Traffic Planning: In the analysis of traffic networks, the conceptual framework of the HECO model can be employed to comprehend and optimize the flow of information, such as real-time traffic updates, to alleviate congestion and enhance traffic efficiency. By applying the HECO model in these domains, a deeper understanding and more effective utilization of the mechanisms of information propagation within social networks can be achieved, leading to improved quality and efficiency in decision-making processes. The research presented herein also offers a new direction for the study of information propagation in heterogeneous networks. However, this study only considers the propagation of group heterogeneity under basic scenarios and does not account for propagation within multi-layer networks. Additionally, the influence of parameters such as limited contact capacity is not considered. It is hoped that future research will have the opportunity to further explore this field.

Data availability statement

The original contributions presented in the study are included in the article/Supplementary Material, further inquiries can be directed to the corresponding author.

Author contributions

JJ: Methodology, Project administration, Supervision, Writing–review and editing. YH: Data curation, Formal Analysis, Methodology, Writing–original draft. WZ: Methodology, Writing–review and editing. YC: Validation, Writing–review and editing.

Funding

The author(s) declare that financial support was received for the research, authorship, and/or publication of this article. This work was supported by Education Department of Inner Mongolia Autonomous Region (NJZZ23074), Funds for basic scientific research of universities directly under the Autonomous region (ZTY2024065), Natural Science Foundation project of Inner Mongolia Autonomous Region (2024QN05046) and Research fund project of Inner Mongolia University of Technology.

Conflict of interest

The authors declare that the research was conducted in the absence of any commercial or financial relationships that could be construed as a potential conflict of interest.

Publisher’s note

All claims expressed in this article are solely those of the authors and do not necessarily represent those of their affiliated organizations, or those of the publisher, the editors and the reviewers. Any product that may be evaluated in this article, or claim that may be made by its manufacturer, is not guaranteed or endorsed by the publisher.

References

1. Houghton D, Pressey A, Istanbulluoglu D. Who needs social networking? An empirical enquiry into the capability of Facebook to meet human needs and satisfaction with life. Comput Hum Behav (2020) 104:106153. doi:10.1016/j.chb.2019.09.029

CrossRef Full Text | Google Scholar

2. Khan S, Saravanan V, Lakshmi TJ, Deb N, Othman NA. Privacy protection of healthcare data over social networks using machine learning algorithms. Comput Intelligence Neurosci (2022) 2022:9985933–8. doi:10.1155/2022/9985933

CrossRef Full Text | Google Scholar

3. Kolowitz B, Lauro GR, Venturella J, Georgiev Y, Barone M, Deible C, et al. Clinical social networking--a new revolution in provider communication and delivery of clinical information across providers of care? J digital Imaging (2014) 27(2):192–9. doi:10.1007/s10278-013-9653-0

PubMed Abstract | CrossRef Full Text | Google Scholar

4. Gil-Fernández R, Calderón-Garrido D, León-Gómez A, Martin-Piñol C. Comparativa del uso educativo de las redes sociales en los grados de Maestro: universidades presenciales y online. Aloma (2019) 37(2):75–81. doi:10.51698/aloma.2019.37.2.75-81

CrossRef Full Text | Google Scholar

5. bt Yahya SMSA, Ahmad SB Preliminary study on educational user interface architecture for social network. Int J Eng Technol (2018) 7(4):457–62. doi:10.14419/ijet.v7i4.36.23916

CrossRef Full Text | Google Scholar

6. Liu T, He X, Guo X, Zhao Y. The influence of the network evolutionary game model of user information behavior on enterprise innovation product promotion based on mobile social network marketing perspective. Math Probl Eng (2022) 2022.

CrossRef Full Text | Google Scholar

7. Lee S, Park H. A study on the effect of social networking marketing on the purchase intention in the airline. East Asian J Business Econ (2021) 9(2):55–73.

Google Scholar

8. Zhang Y, Pan D, Fan S. Analysis of layered information dissemination model and caching strategy in Social Internet of Things. Nonlinear Dyn (2023) 111(15):14379–94. doi:10.1007/s11071-023-08594-5

CrossRef Full Text | Google Scholar

9. He J, Li Y, Zhu N. A game theory-based model for the dissemination of privacy information in online social networks. Future Internet (2023) 15(3):92–412. doi:10.3390/fi15030092

CrossRef Full Text | Google Scholar

10. Chen J, Huang J, Xin C, Liu M. Research on information dissemination model based on heat transfer in online social network. The J Supercomputing (2022) 79(7):7717–35.

Google Scholar

11. Zhu X, Wang W, Cai S, Stanley HE. Optimal imitation capacity and crossover phenomenon in the dynamics of social contagions. J Stat Mech (2018) 2018.

PubMed Abstract | CrossRef Full Text | Google Scholar

12. Pan D, Zhang Y. Analysis of information propagation and control of a layered SITR model in complex networks. Front Phys (2022) 10:985517. doi:10.3389/fphy.2022.985517

CrossRef Full Text | Google Scholar

13. He L, Zhu L, Zhang Z. Turing instability induced by complex networks in a reaction–diffusion information propagation model. Inf Sci (2021) 578:762–94. doi:10.1016/j.ins.2021.08.037

CrossRef Full Text | Google Scholar

14. Wang W, Tang M, Zhang H, Gao H, Do Y, Liu Z. Epidemic spreading on complex networks with general degree and weight distributions. Phys Rev E, Stat nonlinear, soft matter Phys (2014) 90(4):042803. doi:10.1103/physreve.90.042803

PubMed Abstract | CrossRef Full Text | Google Scholar

15. Guan G, Guo Z. Stability behavior of a two-susceptibility SHIR epidemic model with time delay in complex networks. Nonlinear Dyn (2021) 106(1):1083–110. doi:10.1007/s11071-021-06804-6

PubMed Abstract | CrossRef Full Text | Google Scholar

16. Liu G, Liu Z, Jin Z. Dynamics analysis of epidemic and information spreading in overlay networks. J Theor Biol (2018) 444:28–37. doi:10.1016/j.jtbi.2018.02.010

PubMed Abstract | CrossRef Full Text | Google Scholar

17. Cao B, Guan G, Shen S, Zhu L. Dynamical behaviors of a delayed SIR information propagation model with forced silence function and control measures in complex networks. The Eur Phys J Plus (2023) 138(5):402. doi:10.1140/epjp/s13360-023-04005-1

PubMed Abstract | CrossRef Full Text | Google Scholar

18. Ding N, Guan G, Shen S, Zhu L. Dynamical behaviors and optimal control of delayed S2IS rumor propagation model with saturated conversion function over complex networks. Commun Nonlinear Sci Numer Simulation (2024) 128:107603. doi:10.1016/j.cnsns.2023.107603

CrossRef Full Text | Google Scholar

19. Zhu L, Yang F, Guan G, Zhang Z. Modeling the dynamics of rumor diffusion over complex networks. Inf Sci (2021) 562:240–58. doi:10.1016/j.ins.2020.12.071

CrossRef Full Text | Google Scholar

20. Zhu L, Wang X, Zhang Z, Lei C. Spatial dynamics and optimization method for a rumor propagation model in both homogeneous and heterogeneous environment. Nonlinear Dyn (2021) 105(4):3791–817. doi:10.1007/s11071-021-06782-9

PubMed Abstract | CrossRef Full Text | Google Scholar

21. Zhu X, Ma J, Su X, Tian H, Wang W, Cai S. Information spreading on weighted multiplex social network. Complexity (2019) 2019:1–15. doi:10.1155/2019/5920187

CrossRef Full Text | Google Scholar

22. Chen X, Zhang S. An SEIR model for information propagation with a hot search effect in complex networks. Math biosciences Eng : MBE (2023) 20(1):1251–73. doi:10.3934/mbe.2023057

CrossRef Full Text | Google Scholar

23. Kovanen L, Kaski K, Kertész J, Saramäki J. Temporal motifs reveal homophily, gender-specific patterns, and group talk in call sequences. Proc Natl Acad Sci USA (2013) 110(45):18070–5. doi:10.1073/pnas.1307941110

PubMed Abstract | CrossRef Full Text | Google Scholar

24. Bakshy E, Messing S, Adamic LA. Political science. Exposure to ideologically diverse news and opinion on Facebook. Science (2015) 348(6289):1130–2. doi:10.1126/science.aaa1160

PubMed Abstract | CrossRef Full Text | Google Scholar

25. Gandy A, Veraart LAM. Adjustable network reconstruction with applications to CDS exposures. J Multivariate Anal (2019) 172:193–209. doi:10.1016/j.jmva.2018.08.011

CrossRef Full Text | Google Scholar

26. Barrat A, Barthelemy M, Pastor-Satorras R, Vespignani A. The architecture of complex weighted networks. Proc Natl Acad Sci USA (2004) 101(11):3747–52. doi:10.1073/pnas.0400087101

PubMed Abstract | CrossRef Full Text | Google Scholar

27. Chen T, Li Q, Yang J, Cong G, Li G. Modeling of the public opinion polarization process with the considerations of individual heterogeneity and dynamic conformity. Mathematics (2019) 7(10):917. doi:10.3390/math7100917

CrossRef Full Text | Google Scholar

28. Zhu X, Yang Q, Tian H, Ma J, Wang W. Contagion of information on two-layered weighted complex network. IEEE Access (2019) 7:155064–74. doi:10.1109/access.2019.2948941

CrossRef Full Text | Google Scholar

29. Iyengar R, Van den Bulte C, Valente TW. Opinion leadership and social contagion in new product diffusion. Marketing Sci (2011) 30(2):195–212. doi:10.1287/mksc.1100.0566

CrossRef Full Text | Google Scholar

30. Golub B, Jackson MO. Naive learning in social networks and the wisdom of crowds. Am Econ J Microeconomics (2010) 2(1):112–49. doi:10.1257/mic.2.1.112

CrossRef Full Text | Google Scholar

31. Lerman K, Ghosh R. Information contagion: an empirical study of the spread of news on digg and twitter social networks. Proc Int AAAI Conf Web Soc Media (2010) 4(1):90–7. doi:10.1609/icwsm.v4i1.14021

CrossRef Full Text | Google Scholar

32. Wang W, Tang M, Zhang H, Lai Y. Dynamics of social contagions with memory of nonredundant information. Phys Rev E, Stat nonlinear, soft matter Phys (2015) 92(1):012820. doi:10.1103/physreve.92.012820

PubMed Abstract | CrossRef Full Text | Google Scholar

33. Yuan X, Hu Y, Stanley HE, Havlin S. Eradicating catastrophic collapse in interdependent networks via reinforced nodes. Proc Natl Acad Sci USA (2017) 114(13):3311–5. doi:10.1073/pnas.1621369114

PubMed Abstract | CrossRef Full Text | Google Scholar

34. Arratia R, Gordon L, Waterman MS. The erdos-renyi law in distribution, for coin tossing and sequence matching. Ann Stat (1990) 18(2):539–70. doi:10.1214/aos/1176347615

CrossRef Full Text | Google Scholar

35. Wang S, Cheng W. Novel method for spreading information with fewer resources in scale-free networks. Physica A: Stat Mech its Appl (2019) 524:15–29. doi:10.1016/j.physa.2019.03.018

CrossRef Full Text | Google Scholar

36. Erdos P, Renyi A. On random graphs. Publicationes Mathematicae (Debrecen) (1959) 6.

Google Scholar

37. McPherson M, Smith-Lovin L, Cook JM. Birds of a feather: homophily in social networks. Annu Rev Sociol (2001) 27(1):415–44. doi:10.1146/annurev.soc.27.1.415

CrossRef Full Text | Google Scholar

38. Barabasi AL, Oltvai ZN. Network biology: understanding the cell's functional organization. Nat Rev Genet (2004) 5(2):101–13. doi:10.1038/nrg1272

PubMed Abstract | CrossRef Full Text | Google Scholar

39. Louf R, Barthélemy M. How congestion causes long waiting times: a statistical physics approach to traffic instability. Phys Rev E (2013) 88(6):062814.

Google Scholar

40. Barabási AL, Albert R. Emergence of scaling in random networks. science (1999) 286(5439):509–12. doi:10.1126/science.286.5439.509

PubMed Abstract | CrossRef Full Text | Google Scholar

41. Jeong H, Tombor B, Albert R, Oltvai ZN, Barabási AL. The large-scale organization of metabolic networks. Nature (2000) 407(6804):651–4. doi:10.1038/35036627

PubMed Abstract | CrossRef Full Text | Google Scholar

42. Dobson I, Carreras BA, Lynch VE, Newman DE. Complex systems analysis of series of blackouts: cascading failure, critical points, and self-organization. Chaos: Interdiscip J Nonlinear Sci (2007) 17(2):026103. doi:10.1063/1.2737822

PubMed Abstract | CrossRef Full Text | Google Scholar

43. Boginski V, Butenko S, Pardalos PM. Statistical analysis of financial networks. Comput Stat Data Anal (2005) 48(2):431–43. doi:10.1016/j.csda.2004.02.004

CrossRef Full Text | Google Scholar

Keywords: complex networks, weighted network, information propagation, individual hesitant-common characteristics, heterogeneous information adoption model

Citation: Jia J, Huang Y, Zhang W and Chen Y (2024) Information propagation characteristic by individual hesitant-common trend on weighted network. Front. Phys. 12:1410089. doi: 10.3389/fphy.2024.1410089

Received: 31 March 2024; Accepted: 17 May 2024;
Published: 26 June 2024.

Edited by:

Xuzhen Zhu, Beijing University of Posts and Telecommunications (BUPT), China

Reviewed by:

Wenjie Dong, Nanjing University of Aeronautics and Astronautics, China
Yunqiu Qiu, Ocean University of China, China
Yaping Ge, Hunan City University, China

Copyright © 2024 Jia, Huang, Zhang and Chen. This is an open-access article distributed under the terms of the Creative Commons Attribution License (CC BY). The use, distribution or reproduction in other forums is permitted, provided the original author(s) and the copyright owner(s) are credited and that the original publication in this journal is cited, in accordance with accepted academic practice. No use, distribution or reproduction is permitted which does not comply with these terms.

*Correspondence: Jianlin Jia, jjl@imut.edu.cn

Disclaimer: All claims expressed in this article are solely those of the authors and do not necessarily represent those of their affiliated organizations, or those of the publisher, the editors and the reviewers. Any product that may be evaluated in this article or claim that may be made by its manufacturer is not guaranteed or endorsed by the publisher.