 Jiawu Li
 Lin Huang
 Yitong Peng2
 Yan Luo
94% of researchers rate our articles as excellent or good
Learn more about the work of our research integrity team to safeguard the quality of each article we publish.
Find out more
ORIGINAL RESEARCH article
Front. Phys., 27 June 2022
Sec. Medical Physics and Imaging
Volume 10 - 2022 | https://doi.org/10.3389/fphy.2022.939657
This article is part of the Research TopicMicrowave-induced thermoacoustic imaging/Photoacoustic ImagingView all 10 articles
Purpose: This study aimed to investigate the relationship between dielectric properties (permittivity and conductivity), thermoacoustic signals (TAS) and temperature of liver tissues at 3.0 GHz.
Materials and Methods: An open-ended coaxial probe was used to measure the dielectric properties of fresh porcine liver tissues in vitro, and a thermoacoustic imaging (TAI) system was used to collect the TAS. Porcine liver tissues were placed on a heating platform, and the dielectric properties measuring probe and temperature sensor were inserted into the liver tissues separated by 1.5 cm. First, the liver tissues were gradually heated by a heating platform from room temperature (30°C) to 60°C, and the dielectric properties and TAS were measured as the temperature increased approximately every 1°C. Second, after the temperature of the porcine liver tissue reached 60°C, the heating platform was turned off to naturally cool the porcine liver tissue to room temperature. During the process, the dielectric properties and TAS were also measured as the temperature decreased every 1°C. Finally, the changes in the dielectric properties and TAS of the liver tissues with temperature at 3.0 GHz frequency were analyzed.
Results: During the process of heating the tissues up to 60°C, the conductivity of the porcine liver tissues decreased while the permittivity and TAS of the porcine liver tissues increased, and the relationships were nonlinearly correlated. Meanwhile, during the cooling process, the conductivity of the porcine liver tissues increased, while the permittivity and TAS decreased, and the relationships were also nonlinearly correlated.
Conclusion: The dielectric properties and TAS of porcine liver tissue changed significantly with temperature, which makes it possible to differentiate the safety margin during liver thermal ablation with thermoacoustic imaging (TAI). While the relationship between temperature, dielectric properties and TAS needs to be further investigated, TAI has the potential to be utilized for safety margin screening during thermal ablation.
Hyperthermia therapy is a medical treatment that exposes biological tissue to high temperatures to destroy and kill cancer cells, and has become an important tumor treatment modality in addition to surgical treatment, chemotherapy, radiotherapy and immunotherapy. The key to local thermal ablation is to produce a necrotic area that completely covers the tumor. Therefore, real-time evaluation of the ablation process and the safety margin is essential. Thermal ablation is mainly used to treat liver tumors smaller than 3 cm [1]; however, with the expansion of indications, single liver tumors smaller than, for example, 5 cm can also be treated with thermal ablation [2], which makes the evaluation of safety margins more important to ensure complete tumor ablation. The dielectric properties of biological tissues carry abundant physiological and pathological information, but they are sensitive to environmental factors, especially the influence of temperature [3, 4]. Therefore, changes in tissue dielectric properties must be considered during thermal ablation. Moreover, knowledge of the temperature-dependent dielectric properties of liver tissues is important to imaging modalities that generate images based on differences in dielectric properties.
Since the importance of the dielectric properties of biological tissues to the diagnosis and treatment of diseases has been recognized, many researchers have studied the dielectric properties of human or animal biological tissues [5–7]. Although several studies have explored the dielectric properties of liver tissues at different frequencies at room temperature [8, 9], the dielectric properties of liver tissues at different temperatures need further investigation. Recently, there have been studies on the correlation between the dielectric properties of liver tissues and temperature [10–15]. Although most of these studies were limited to a narrow frequency range of 460–480 kHz (RF frequencies), they indicated that the dielectric properties of liver tissue are temperature dependent. In recent years, the dielectric properties of biological tissues under microwave frequencies have also attracted more attention [14, 16]. However, the temperature-dependent dielectric properties of liver tissues within the temperature range of 30°C–60°C at 3.0 GHz have been only partially studied. In clinical thermal ablation, 2.45 GHz is mainly utilized. Thus, it is necessary to further explore the temperature-dependent dielectric properties of liver tissues during the heating and cooling process.
Thermoacoustic imaging (TAI) is a novel imaging modality that can reflect the biological characteristics (especially dielectric properties) of tissues via thermoacoustic effects, and has the advantages for high contrast of microwave imaging and high resolution for ultrasound imaging [17]. Some studies have investigated the relationship between thermoacoustic signals (TAS) and temperature in phantom and biological tissues [18, 19], while a few studies have explored the temperature-dependent TAS and dielectric properties simultaneously in liver tissues [19, 20]. Meanwhile, the combination of temperature, dielectric properties and TAS has certain guiding significance for the theoretical study of TAI for the detection of ablation safety boundaries. Furthermore, the frequency of TAI is 3.0 GHz, which is close to the frequency used for microwave ablation (2.45 GHz), and the dielectric properties of liver tissue are similar at these two frequencies [5]. Therefore, this study aimed to explore the dielectric property changes of ex vivo porcine liver tissue during the heating and cooling process, as well as the temperature dependence of TAS at 3.0 GHz.
In this study, fresh porcine liver tissue was obtained from a local slaughterhouse. All porcine liver tissues used in the experiment were acquired from different individuals to minimize sampling error. Homogeneous blocks of porcine liver, at least 3*3 cm2, were used for the experiments. Each ex vivo porcine liver tissue was wrapped in aluminum foil to keep it fresh before experiments. The initial temperature at the beginning of the experiments was approximately 30°C.
The dielectric property measurement was conducted with an open-ended coaxial system [21], as shown in Figure 1. In this study, short standard calibration was attained by pressing the coaxial probe on a thin copper sheet. Then, an open standard was established by placing the probe in free space, and the load standard was completed by immersing the probe into deionized water. After calibration the performance of the coaxial probe was verified by measuring the conductivity of pure water during the heating and cooling process, which is shown in Figure 2.
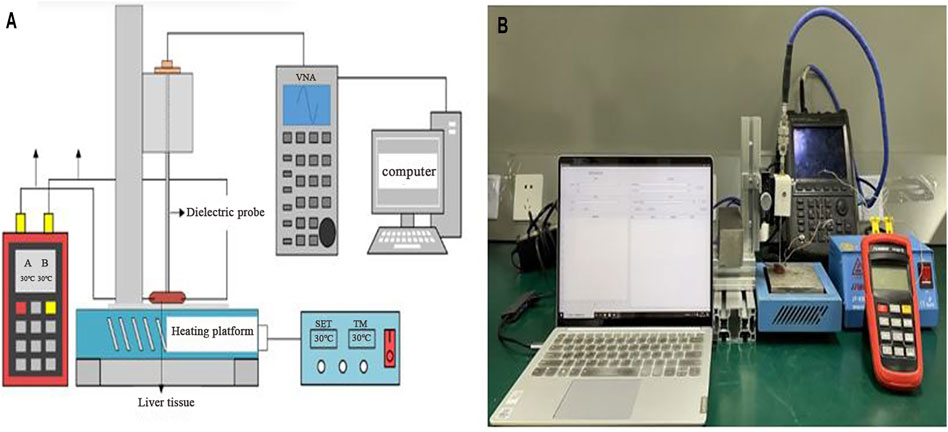
FIGURE 1. Schematic diagram (A) and image (B) of the experimental setup for dielectric property measurement in ex vivo liver tissues. The porcine liver tissue was placed on the surface of a heating platform, and the dielectric properties testing probe and temperature probes were inserted into liver tissues at an interval of 1.5 cm.
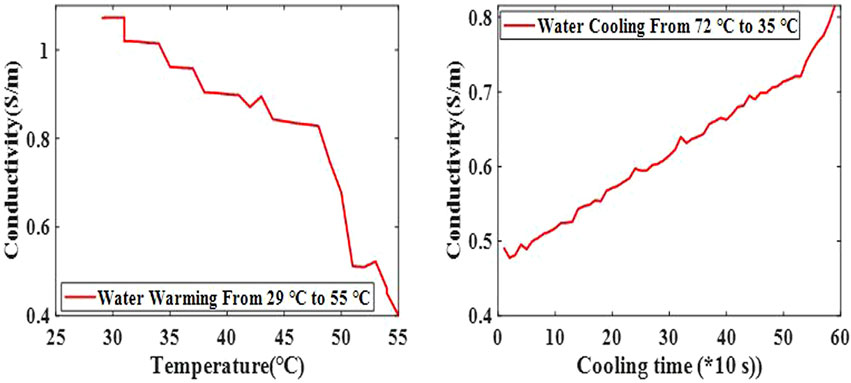
FIGURE 2. Conductivity changes of pure water with temperature. The conductivity of pure water decreased gradually in the heating process and increased gradually in the cooling process.
Figures 1A,B shows the placement of the coaxial probe and thermometer. The ex vivo porcine liver tissues were placed on a heating platform (JF-956K, Tianjin, China), and the temperature of the heating platform was controlled by an external temperature regulating system. A digital thermometer (Omega Engineering, Inc., Stanford, CT) was used to measure the temperature of the liver tissues. The dielectric property measuring probe was inserted 0.5 cm deep into the center of the liver tissue, and two temperature probes were inserted at the same depth in the same plane approximately 1.5 cm away from the dielectric property testing probe. The measuring system was kept stationary throughout the experiment. In total, four liver tissues were used in the study. The probe was wiped with clean test paper before the measurement of the different liver tissues so that probe residues did not affect the test results.
The thermoacoustic signal (TAS) was collected with a previously reported array transducer-based system [22] [Figure 3A presents a schematic of the TA imaging system]. Briefly, pulsed microwaves emitted from a homemade microwave generator (frequency: 3.0 GHz, bandwidth: 50 MHz, peak power: 60 kW, pulse duration: 550 ns) were coupled to a handheld antenna [23] via a semirigid coaxial cable (1.5 m long with 2.2 dB insertion loss). The actual average microwave power density at the liver was only approximately 15.0 mW/cm2 when a 50 Hz repetition frequency and 550 ns pulse duration were utilized, which is below the IEEE standard for safety levels (20 mW/cm2 at 3.0 GHz) [24]. The excited TAS was captured by a 128-element linear array transducer (8.5 MHz center frequency, SH7L38, SASET. Inc., China) and further amplified by homemade 128 channel amplifiers (bandwidth: 0.2–2.5 MHz, gain: 56 dB). Finally, the TAS was averaged 50 times and recorded by two 32-channel acquisition cards (NI5752, NI Inc., United States) at a sampling rate of 50 MPs. The TA images were recovered by using a delay and sum algorithm created by MATLAB (Mathworks Inc., Natic, MA) [25]. To investigate the relationship between TAS and the temperature of liver tissue, the TA images were obtained (Figures 3B,C), and the sum of the area within the white square was regarded as the TAS for further analysis.
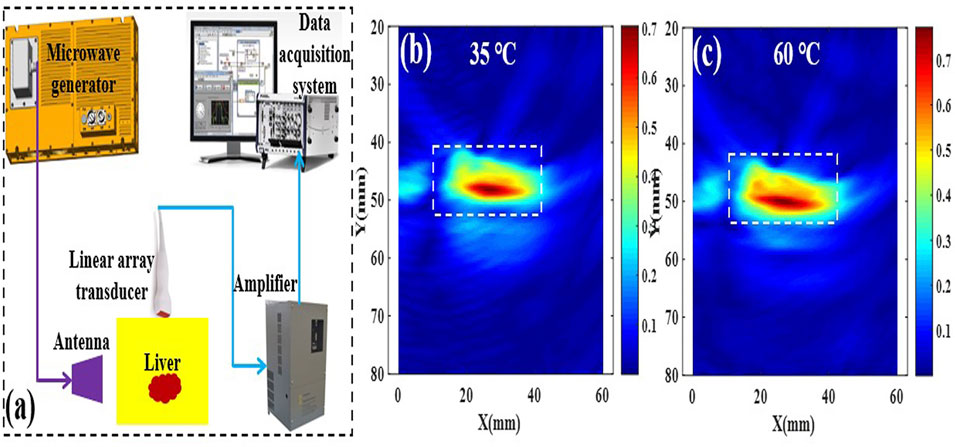
FIGURE 3. Schematic of the TA imaging system (A), and the corresponding TA images of porcine liver tissue at 35 and 60°C (B,C).
During the heating process, the temperature of the liver tissue was gradually increased to 60°C by adjusting the power of the heating plate. When the temperature of the liver tissue reached 60°C, the heating platform was turned off to naturally cool the liver tissue to room temperature. The dielectric properties and TAS of ex vivo porcine liver tissues at temperatures ranging from room temperature (30°C) to 60°C at a frequency of 3.0 GHz (the frequency used for thermoacoustic imaging) were measured. A temperature above 60°C was not attempted because significant physiological changes were expected in tissues above 56°C–60°C [26, 27], which is also an indicator of effective tumor destruction during thermal ablation [28]. The dielectric properties and TAS were measured every 1°C throughout the heating and cooling process. The relationship between dielectric properties (permittivity and conductivity), TAS and temperature of the liver tissue at 3.0 GHz frequencies was expressed by polynomial curve fitting. Higher correlations have correlation coefficient, R2, closer to 1.
The conductivity of pure water decreased gradually in the heating process and increased gradually in the cooling process, which is consistent with other studies [29] (Figure 2). This may be related to higher temperatures, resulting in more intense thermal motion of water molecules, making it more difficult to induce uniform polarization.
In general, the dielectric properties and TAS changes of liver tissues with temperature were consistent in all the test groups. During the process of heating to 60°C, the conductivity of the porcine liver tissues decreased with temperature (Figure 4), the permittivity (Figure 5) and TAS (Figure 6) of the porcine liver tissues increased, and the relationships were nonlinearly correlated. Meanwhile, during the cooling process, the conductivity of the porcine liver tissues increased with temperature, while the permittivity and thermoacoustic signals decreased, and the relationships were also nonlinearly correlated.
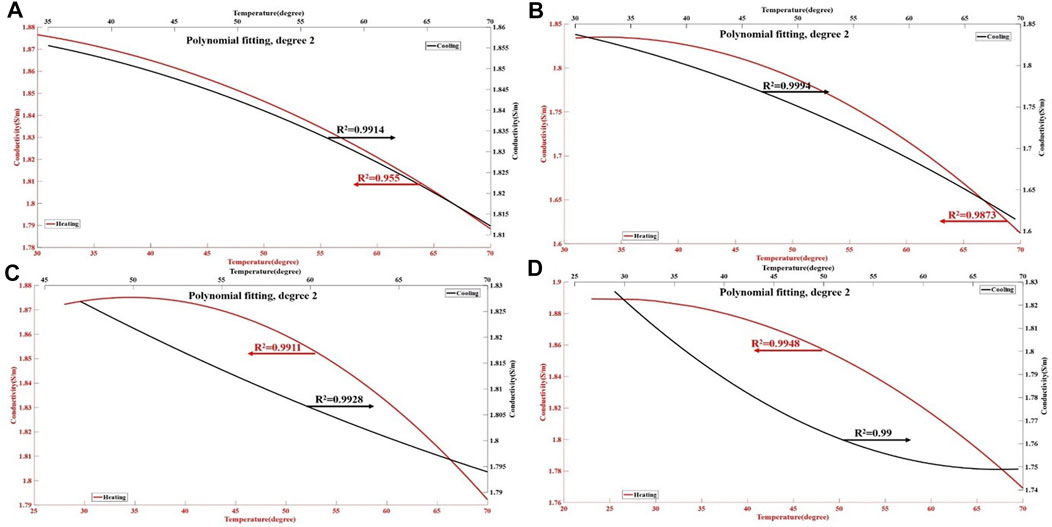
FIGURE 4. Changes in the conductivity properties of ex vivo liver tissue during the heating and cooling process. The red lines in the figures (A–D) represent the polynomial curve fitting of the conductivity of liver tissue during the heating process, with an R2 values of 0.955–0.9948. The black line represents the polynomial curve fitting of conductivity of liver tissue during the cooling process, with an R2 of 0.99–0.9994. The results show an almost nonlinear relationship between the conductivity of liver tissues and temperature.
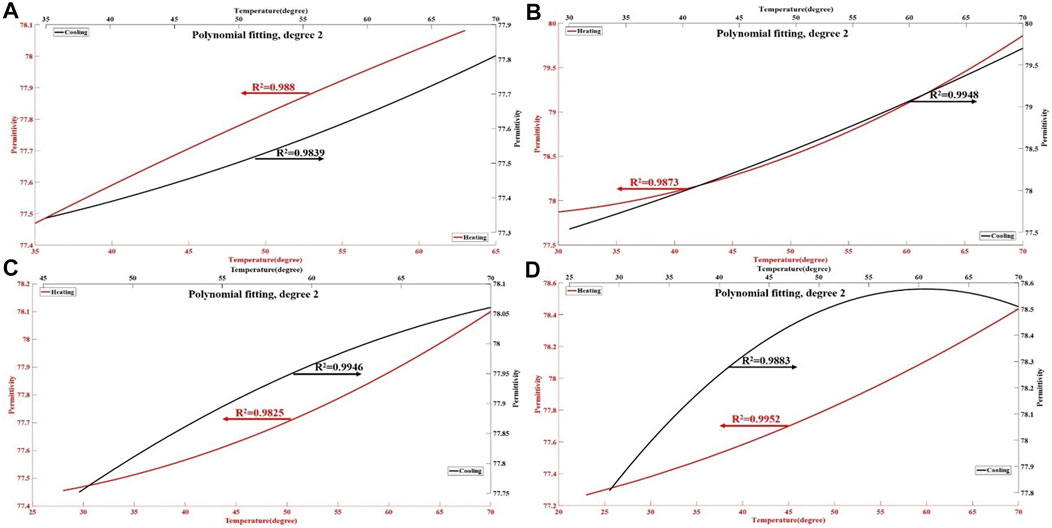
FIGURE 5. The permittivity changes of ex vivo liver tissue during the heating and cooling process. The red lines in the figures (A–D) represent the polynomial curve fitting of the permittivity of liver tissue during the heating process, with an R2 values of 0.9825–0.9952. The black line represents the polynomial curve fitting of permittivity of liver tissue during the cooling process, with an R2 of 0.9839–0.9948. The results show an almost nonlinear relationship between the permittivity of liver tissue and temperature.
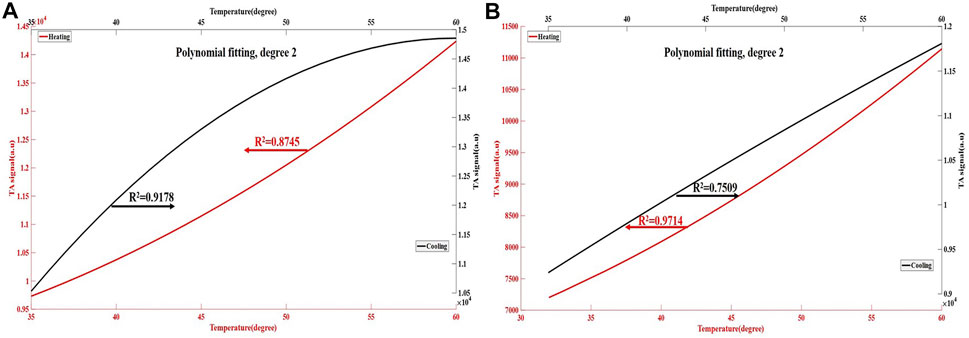
FIGURE 6. The thermoacoustic signals changes of ex vivo liver tissue during the heating and cooling process. The red line in the figure (A,B) represents the polynomial curve fitting of thermoacoustic signal of liver tissue during the heating process, with an R2 values of 0.8745–0.9714. The black line represents the polynomial curve fitting of thermoacoustic signal of liver tissue during the cooling process, with an R2 of 0.7509–0.9178. The results show that almost a nonlinear relationship between thermoacoustic signal of liver tissue and temperature.
In addition, during the processes of heating and cooling the liver tissues, the change rates of the conductivity per degree were 0.0035 ± 0.0025 and 0.0038 ± 0.0043, respectively. The change rates of the permittivity per degree were 0.0274 ± 0.0130 and 0.0263 ± 0.0105, respectively. The change rates of the conductivity and permittivity of the liver tissues during the heating and cooling process are presented in Figure 7.
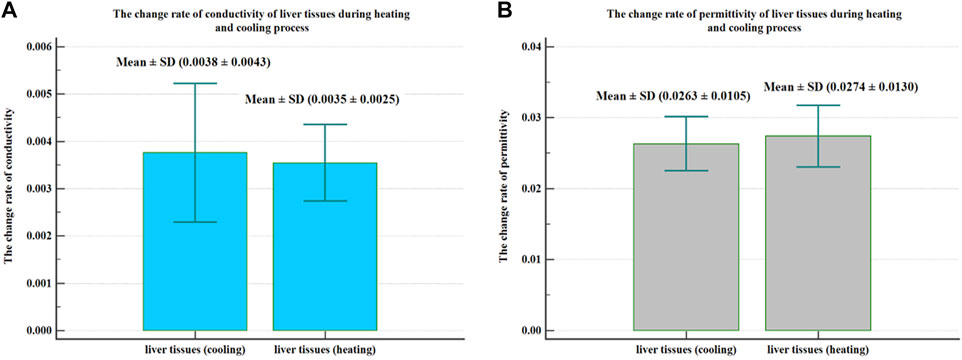
FIGURE 7. The change rate of conductivity and permittivity of liver tissues during the heating and cooling process. During the heating and cooling process of liver tissues, the change rate of conductivity per degree was 0.0035 ± 0.0025 and 0.0038 ± 0.0043, respectively (A), and the change rate of permittivity per degree was 0.0274 ± 0.0130 and 0.0263 ± 0.0105, respectively (B).
During the process of heating and cooling, the conductivity and permittivity at the same temperature point are different, and Figure 8 shows the change curve of the difference.
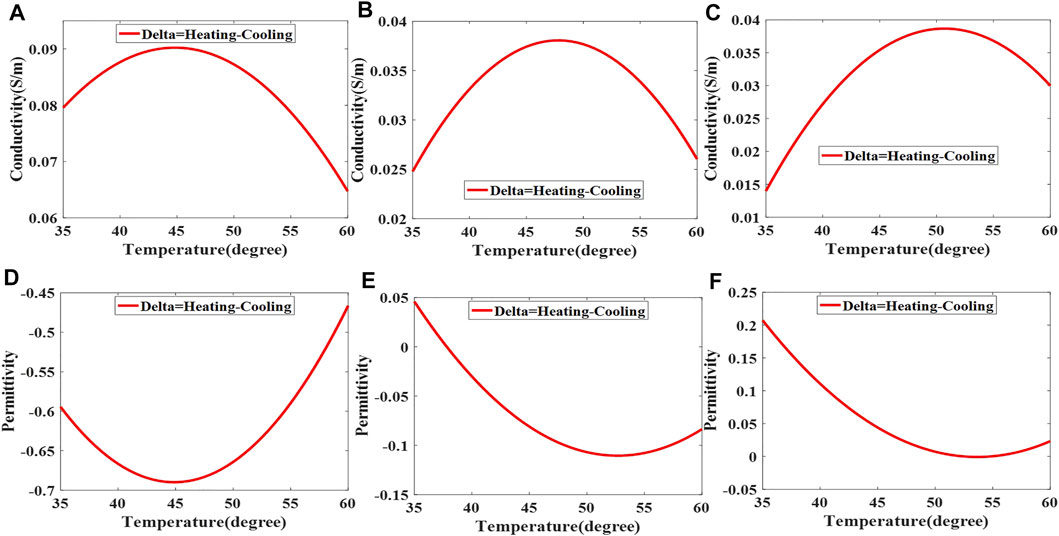
FIGURE 8. The difference between conductivity (A–C) and permittivity (D–F) of liver tissues at the same temperature point during the heating and cooling process.
This study explored the change in dielectric properties and TAS of fresh ex vivo porcine liver tissue with temperature. The results showed that the permittivity, conductivity and TAS of porcine liver tissues changed regularly with temperature at 3.0 GHz. Recently, an increasing number of studies have been conducted on the dielectric properties of the liver in the radiofrequency (RF) and microwave (MW) frequency ranges with changes in temperature.
In the RF frequency range, [10] explored the temperature-dependent in-vivo and ex-vivo conductivity at 470 kHz, and the results showed that conductivity increased continuously and uniformly from body temperature to 77°C, and a continuous reduction in conductivity was observed during the cooling phase. In addition, [11] measured the dielectric properties of porcine liver ex vivo up to 100°C at 480 kHz and found increasing conductivity with temperature. Furthermore, [12] measured the conductivity of liver tissue at 500 kHz at temperatures ranging from 40 to 90°C. They found that the conductivity increased with temperature, and the change was irreversible above 60°C. The study of [30] indicated that at 915 MHz, the permittivity of ex vivo bovine liver decreased with temperature, while the conductivity gradually increased.
However, the frequency of RF ablation is lower than that of microwave ablation. To date, only a few studies have been found on the temperature-dependent conductivity properties of liver tissues at a higher frequency (1–3 GHz). [14] showed a significant decrease in conductivity (approximately 33%) in liver tissue at 2.45 GHz when the temperature increased to over 60°C, with a dramatic drop when the temperature was close to 100°C. [31] explored the changes in the dielectric properties in liver tissue at 915 and 2.45 GHz with temperatures up to 100°C. Their study indicated that permittivity and conductivity decrease substantially and irreversibly at high temperatures. Interestingly, as seen from the graphs presented in their results, when the temperature was below 60°C, the conductivity increased with increasing temperature at 915 MHz and decreased with increasing temperature at 2.45 GHz. The electrical conductivity results of liver tissues with temperature increases at higher frequencies are consistent with our study. It seems that at a lower frequency (below 1 GHz), the conductivity of liver tissue increases with temperature, and at a higher frequency (1–3 GHz), it decreases with temperature. This is related to the fact that the ionic loss increases with temperature, and the relaxation process is dominated by ionic losses at low frequencies and dielectric losses at higher frequencies.
Our study showed that the permittivity and conductivity changes of the liver tissues with temperature were nonlinear at 3.0 GHz. Furthermore, previous studies have reported that dielectric properties are not always linear over a wide range of temperatures and frequencies [15, 32]. However, studies have proposed that the temperature coefficients of permittivity and conductivity are linear, which can be used to further deduce the dielectric properties of biological tissues [30, 33]. Further studies are needed to determine whether there is a linear relationship between temperature and the permittivity and conductivity of biological tissues. In addition, we found that as the temperature increased, the dielectric properties of the liver tissues changed irreversibly; that is, at the same temperature point during the heating and cooling process, the conductivity and permittivity were different. This change is most obvious when the temperature reaches 45°C, which may be related to the aggravation of tissue cell damage after the temperature exceeds 45°C [34, 35], rather than tissue dehydration, as significant tissue dehydration occurs when the temperature reaches 100°C. In this study, we further explored the changes in the thermoacoustic signals of liver tissues with temperature. The results showed that the TAS of liver tissues increased with temperature and decreased during the cooling process. [19] explored the relationship between TAS and temperature in porcine livers in vitro, and the results showed that the thermoacoustic signal increased with temperature (30°C–50°C), and the relationship was nonlinear, which is in agreement with our results. The changes in TAS were consistent with the changes in permittivity with temperature, which could provide theoretical guidance for thermoacoustic imaging to distinguish ablation tissue from normal tissue.
However, the current study has some limitations. The microwave ablation uses 2.45 GHz for thermal ablation, which was slightly different from the frequency used for TAI (3.0 GHz). However, according to a previous study [36] and an open data site “Calculation of the Dielectric Properties of Body Tissues in the frequency range 10 Hz–100 GHz” [5], the dielectric properties of the liver at 2.45 GHz (s = 1.6864 S/m, εr = 43.035) and 3.0 GHz (s = 2.0755 S/m, εr = 42.165) are close. In addition, the results were obtained from in vitro porcine liver tissue, which may differ from in vivo experiments. Finally, the porcine liver tissues used in the experiment were acquired from different individuals, but the resulting dielectric properties and thermoacoustic signals showed a consistent trend with temperature.
In this study, we explored the temperature-dependent dielectric properties and TAS of porcine liver tissue at 3.0 GHz. The experimental results indicated that the dielectric properties and TAS of porcine liver tissue changed significantly with temperature, which makes it possible to differentiate the safety margin during liver ablation by thermoacoustic imaging. However, the relationship between temperature, dielectric properties and TAS needs to be further investigated, especially the quantitative correlation between TAS and temperature, which will be useful in the quantitative evaluation of clinical thermal ablation boundaries.
The original contributions presented in the study are included in the article/Supplementary Material, further inquiries can be directed to the corresponding authors.
The animal study was reviewed and approved by the West China Hospital of Sichuan University.
Study design: All authors. Data Collection: JL, YP, and LH. Data analysis and interpretation: JL and LH. Manuscript writing: JL. All authors contributed to the article and approved the submitted version.
This research was supported by National Natural Science Foundation of China (Nos 82001832, 81701702, and 82071940).
The authors declare that the research was conducted in the absence of any commercial or financial relationships that could be construed as a potential conflict of interest.
All claims expressed in this article are solely those of the authors and do not necessarily represent those of their affiliated organizations, or those of the publisher, the editors and the reviewers. Any product that may be evaluated in this article, or claim that may be made by its manufacturer, is not guaranteed or endorsed by the publisher.
1. Vogl T, Nour-Eldin N-E, Hammerstingl R, Panahi B, Naguib N. Microwave Ablation (MWA): Basics, Technique and Results in Primary and Metastatic Liver Neoplasms - Review Article. Fortschr Röntgenstr (2017) 189:1055–66. doi:10.1055/s-0043-117410
2. Deng M, Li S-H, Guo R-P. Recent Advances in Local Thermal Ablation Therapy for Hepatocellular Carcinoma. The Am Surgeon (2021) 000313482110545 Epub ahead of print. doi:10.1177/00031348211054532
3. Geddes LA, Baker LE. The Specific Resistance of Biological Material-A Compendium of Data for the Biomedical Engineer and Physiologist. Med Biol Engng (1967) 5:271–93. doi:10.1007/BF02474537
4. Zia G, Sebek J, Prakash P. Temperature-dependent Dielectric Properties of Human Uterine Fibroids over Microwave Frequencies. Biomed Phys Eng Express (2021) 7:065038. doi:10.1088/2057-1976/ac27c2
5. Andreuccetti D, Fossi R, Petrucci C. Calculation of the Dielectric Properties of Body Tissues in the Frequency Range 10 Hz-100 GHz Florence: IFAC-CNR 1997-2015. (Florence (Italy): Institute for Applie Physics). (2021). http://niremf.ifac.cnr.it/tissprop/htmlclie/htmlclie.php.
6. Gabriel C, Peyman A, Grant EH. Electrical Conductivity of Tissue at Frequencies below 1 MHz. Phys Med Biol (2009) 54:4863–78. doi:10.1088/0031-9155/54/16/002
7. Yilmaz T, Ates Alkan F. In Vivo Dielectric Properties of Healthy and Benign Rat Mammary Tissues from 500 MHz to 18 GHz. Sensors (2020) 20:2214. doi:10.3390/s20082214
8. Wang L, Wang H, Xu C, Ji Z, Li J, Dong X, et al. Dielectric Properties of Human Active Liver, Kidney and Spleen Compared to Those of Respective Inactive Tissues, Porcine Tissues and the Data Provided by a Database in the Frequency Range of 10 Hz to 100 MHz. IEEE Trans Biomed Eng (2021) 68:3098–109. doi:10.1109/TBME.2021.3065016
9. O’Rourke AP, Lazebnik M, Bertram JM, Converse MC, Hagness SC, Webster JG, et al. Dielectric Properties of Human normal, Malignant and Cirrhotic Liver Tissue:in Vivoandex Vivomeasurements from 0.5 to 20 GHz Using a Precision Open-Ended Coaxial Probe. Phys Med Biol (2007) 52:4707–19. doi:10.1088/0031-9155/52/15/022
10. Zurbuchen U, Holmer C, Lehmann KS, Stein T, Roggan A, Seifarth C, et al. Determination of the Temperature-dependent Electric Conductivity of Liver Tissue Ex Vivo and In Vivo: Importance for Therapy Planning for the Radiofrequency Ablation of Liver Tumours. Int J Hyperthermia (2010) 26:26–33. doi:10.3109/02656730903436442
11. Macchi EG, Gallati M, Braschi G, Persi E. Dielectric Properties of RF Heatedex Vivoporcine Liver Tissue at 480 kHz: Measurements and Simulations. J Phys D: Appl Phys (2014) 47:485401. doi:10.1088/0022-3727/47/48/485401
12. Ryan TP, Platt RC, Dadd JS, Humphries S. Tissue Electrical Properties as a Function of thermal Dose for Use in a Finite Element Model. Adv Heat Mass Transfer Biotechnol (1997) 355:167–71.
13. Fallahi H, Sebek J, Prakash P. Broadband Dielectric Properties of Ex Vivo Bovine Liver Tissue Characterized at Ablative Temperatures. IEEE Trans Biomed Eng (2021) 68:90–8. doi:10.1109/TBME.2020.2996825
14. Lopresto V, Pinto R, Lovisolo GA, Cavagnaro M. Changes in the Dielectric Properties Ofex Vivobovine Liver during Microwave thermal Ablation at 2.45 GHz. Phys Med Biol (2012) 57:2309–27. doi:10.1088/0031-9155/57/8/2309
15. Fu F, Xin SX, Chen W. Temperature- and Frequency-dependent Dielectric Properties of Biological Tissues within the Temperature and Frequency Ranges Typically Used for Magnetic Resonance Imaging-Guided Focused Ultrasound Surgery. Int J Hyperthermia (2014) 30:56–65. doi:10.3109/02656736.2013.868534
16. Silva NP, Bottiglieri A, Conceição RC, O’Halloran M, Farina L. Characterisation of Ex Vivo Liver Thermal Properties for Electromagnetic-Based Hyperthermic Therapies. Sensors (2020) 20:3004. doi:10.3390/s20103004
17. Kruger RA, Reinecke DR, Kruger GA. Thermoacoustic Computed Tomography-Technical Considerations. Med Phys (1999) 26:1832–7. doi:10.1118/1.598688
18. Pramanik M, Wang LV. Thermoacoustic and Photoacoustic Sensing of Temperature. J Biomed Opt (2009) 14:054024. doi:10.1117/1.3247155
19. Lou C, Xing D. Temperature Monitoring Utilising Thermoacoustic Signals during Pulsed Microwave Thermotherapy: A Feasibility Study. Int J Hyperthermia (2010) 26:338–46. doi:10.3109/02656731003592035
20. Zhou T, Meaney PM, Hoopes PJ, Geimer SD, Paulsen KD. Microwave thermal Imaging of Scanned Focused Ultrasound Heating: Animal Experiments. Proc SPIE (2011) 7901:79010N. doi:10.1117/12.877584
21. La Gioia A, Porter E, Merunka I, Shahzad A, Salahuddin S, Jones M, et al. Open-Ended Coaxial Probe Technique for Dielectric Measurement of Biological Tissues: Challenges and Common Practices. Diagnostics (2018) 8:40. doi:10.3390/diagnostics8020040
22. Zheng Z, Huang L, Jiang H. Label-free Thermoacoustic Imaging of Human Blood Vessels In Vivo. Appl Phys Lett (2018) 113:253702. doi:10.1063/1.5054652
23. Huang L, Li T, Jiang H. Technical Note: Thermoacoustic Imaging of Hemorrhagic Stroke: a Feasibility Study with a Human Skull. Med Phys (2017) 44:1494–9. doi:10.1002/mp.12138
24.IEEE. IEEE Standard for Safety Levels with Respect to Human Exposure to Radio Frequency Electromagnetic fields 3 kHz to 300 GHz. IEEE Stand (1999) C95:1. doi:10.1109/IEEESTD.1999.89423
25. Hoelen CGA, de Mul FFM. Image Reconstruction for Photoacoustic Scanning of Tissue Structures. Appl Opt (2000) 39:5872–83. doi:10.1364/ao.39.005872
26. Bircan C, Barringer SA. Determination of Protein Denaturation of Muscle Foods Using the Dielectric Properties. J Food Sci (2002) 67:202–5. doi:10.1111/j.1365-2621.2002.tb11384.x
27. Nikfarjam M, Muralidharan V, Christophi C. Mechanisms of Focal Heat Destruction of Liver Tumors. J Surg Res (2005) 127:208–23. doi:10.1016/j.jss.2005.02.009
28. Brace CL, Laeseke PF, van der Weide DW, Lee FT. Microwave Ablation with a Triaxial Antenna: Results in Ex Vivo Bovine Liver. IEEE Trans Microwave Theor Techn. (2005) 53:215–20. doi:10.1109/TMTT.2004.839308
29. Artemov VG. A Unified Mechanism for Ice and Water Electrical Conductivity from Direct Current to Terahertz. Phys Chem Chem Phys (2019) 21:8067–72. doi:10.1039/c9cp00257j
30. Stauffer PR, Rossetto F, Prakash M, Neuman DG, Lee T. Phantom and Animal Tissues for Modelling the Electrical Properties of Human Liver. Int J Hyperthermia (2003) 19:89–101. doi:10.1080/0265673021000017064
31. Brace CL. Temperature-dependent Dielectric Properties of Liver Tissue Measured during thermal Ablation: toward an Improved Numerical Model. Annu Int Conf IEEE Eng Med Biol Soc (2008) 2008:230–3. doi:10.1109/IEMBS.2008.4649132
32. Lazebnik M, Converse MC, Booske JH, Hagness SC. Ultrawideband Temperature-dependent Dielectric Properties of Animal Liver Tissue in the Microwave Frequency Range. Phys Med Biol (2006) 51:1941–55. doi:10.1088/0031-9155/51/7/022
33. Chin L, Sherar M. Changes in Dielectric Properties Ofex Vivobovine Liver at 915 MHz during Heating. Phys Med Biol (2001) 46:197–211. doi:10.1088/0031-9155/46/1/314
34. Schildkopf P, J. Ott O, Frey B, Wadepohl M, Sauer R, Fietkau R, et al. Biological Rationales and Clinical Applications of Temperature Controlled Hyperthermia - Implications for Multimodal Cancer Treatments. Cmc (2010) 17:3045–57. doi:10.2174/092986710791959774
35. Oei AL, Vriend LEM, Krawczyk PM, Horsman MR, Franken NAP, Crezee J. Targeting Therapy-Resistant Cancer Stem Cells by Hyperthermia. Int J Hyperthermia (2017) 33:419–27. doi:10.1080/02656736.2017.1279757
Keywords: conductivity, permittivity, thermoacoustic signal, temperature, liver
Citation: Li J, Huang L, Peng Y, Li E and Luo Y (2022) The Relationship Between Dielectric Properties, Thermoacoustic Signals and Temperature of Liver Tissues at 3.0 GHz. Front. Phys. 10:939657. doi: 10.3389/fphy.2022.939657
Received: 09 May 2022; Accepted: 13 June 2022;
Published: 27 June 2022.
Edited by:
Yuancheng Fan, Northwestern Polytechnical University, ChinaReviewed by:
Guoqiang Liu, Institute of Electrical Engineering (CAS), ChinaCopyright © 2022 Li, Huang, Peng, Li and Luo. This is an open-access article distributed under the terms of the Creative Commons Attribution License (CC BY). The use, distribution or reproduction in other forums is permitted, provided the original author(s) and the copyright owner(s) are credited and that the original publication in this journal is cited, in accordance with accepted academic practice. No use, distribution or reproduction is permitted which does not comply with these terms.
*Correspondence: Lin Huang, bGh1YW5nQHVlc3RjLmVkdS5jbg==; Yan Luo, eWFubHVvQHNjdS5lZHUuY24=
Disclaimer: All claims expressed in this article are solely those of the authors and do not necessarily represent those of their affiliated organizations, or those of the publisher, the editors and the reviewers. Any product that may be evaluated in this article or claim that may be made by its manufacturer is not guaranteed or endorsed by the publisher.
Research integrity at Frontiers
Learn more about the work of our research integrity team to safeguard the quality of each article we publish.