 Ying Ma
 Lin Ma
 Juanjuan Zheng
 Min Liu
 Zeev Zalevsky
 Peng Gao
95% of researchers rate our articles as excellent or good
Learn more about the work of our research integrity team to safeguard the quality of each article we publish.
Find out more
BRIEF RESEARCH REPORT article
Front. Phys. , 09 May 2022
Sec. Optics and Photonics
Volume 10 - 2022 | https://doi.org/10.3389/fphy.2022.892529
This article is part of the Research Topic Digital Holography: Techniques and Applications View all 16 articles
Quantitative phase-contrast microscopy (QPCM) provides an effective approach for label-free detection of transparent samples. In this study, we propose a condenser-free quantitative phase-contrast microscopy (CF-QPCM), in which several light-emitting diodes (LEDs) distributed on a ring are used for direct ultra-oblique illumination. Such condenser-free design greatly simplifies the system’s structure and releases the space for installing samples. Quantitative phase maps are reconstructed by retarding the unscattered components of the object waves for a series of phases 0, π/2, π, and 3π/2 through a high-speed spatial light modulator (SLM). With this system, quantitative phase imaging of live cells has been achieved at a spatial resolution of 231 nm (lateral) and a frame rate of 250 Hz. We believe that the proposed CF-QPCM can contribute to biomedical, industrial, chemistry fields, etc.
The invention of microscope triggered a revolution in science and cognition, and it also greatly promoted the development of life sciences. Electron microscopes have sub-nanometer spatial resolution and play an incomparable value in structural biochemistry research [1, 2], however, the complex sample preparation hinders the application of electron microscopy in live cells. On the contrary, fluorescence microscopy has been acting as one of the mainstream techniques in life science due to the feature of being non-invasive and the capability to selectively visualize the bio-structures of interest by fluorescence labeling [3–6]. Nevertheless, the application of fluorescence microscopy is hindered by the phototoxicity and photobleaching of fluorophores used.
Being a label-free and non-invasive imaging technique, quantitative phase microscopy (QPM) can quantitatively access the thickness or refraction index (RI) distributions of samples [7, 8]. Digital holography microscopy (DHM) can perform high-accuracy phase measurements of transparent samples by utilizing the interference between an object wave and an off-axis reference wave [9–11]. Common-path configurations were used in DHM to enhance the immunity of the system to environmental disturbances [12]. Researchers further improved the spatial resolution and realized 3D tomographic imaging by mechanically scanning the illumination [13, 14]. Nevertheless, 240 angles scanning within an annular quasi-2π range are required and limit the imaging speed below 0.8 frames per second (FPS).
Single-beam QPM approaches, in terms of ptychographic iterative engine (PIE) [15] and Fourier ptychographic microscope (FPM) [16–18] have been developed rapidly in recent years, providing the complex amplitude information of samples by recording a series of diffraction patterns under different illumination positions/directions, or other physical constraints. It is worth noting that the reconstruction of a high-resolution image with these methods requires recording hundreds of low-resolution diffraction patterns, and hence their imaging speed is greatly limited. QPM based on asymmetrical illumination [19] and transport of intensity equation (TIE) [20] can also retrieve the phase mapping of a sample using a relatively-complicated recovery process. Popescu and his co-workers proposed gradient light interference microscopy (GLIM), realizing 3D imaging of optically thick embryos, however it is not suitable for discontinuous samples due to its differential interference contrast essence [21]. Alternatively, phase-contrast imaging, initially proposed by Zernike in the 1940s, can convert the phase distribution of a transparent object into intensity modulation and, therefore, has also been playing an important role in life science [22]. Further, condenser-free Zernike phase-contrast microscopy using annularly-arranged or radially-scanned LEDs was proposed, simplifying the configuration and easing sample installation [23]. As an evolution from qualitative phase imaging to quantitative phase imaging, spatial light interference microscopy (SLIM) uses a spatial light modulator (SLM) instead of the conventional phase plate to perform quantitative phase imaging at temporal and spatial resolutions of 0.6 s and 350 nm, respectively, [24, 25]. Recently, the oblique angle of the annular illumination in SLIM was enlarged, forming the ultra-oblique SLIM, which enhanced the lateral resolution to 270 nm at an imaging speed of 250 Hz [26], and which identified mitochondria inside live cells by combining a neural network with SLIM [27]. It should be noted that the annular illumination module in SLIM system is either complicated or costly since they require a water-immersed objective lens with a high numerical aperture (NA) to provide ultra-oblique illumination (∼70o). Moreover, the condenser in the illumination module narrows the space where samples can be installed and hence induce the inconvenience of loading samples.
In this study, we propose condenser-free quantitative phase microscopy, termed CF-QPCM. High spatio-temporal resolution QPM imaging is performed by combining the oblique illumination from annularly-distributed LEDs and the concept of the Zernike phase contrast. The proposed system greatly simplifies the architecture, releases the complexity of sample installation, and avoids the cell contamination caused by a water-immersed condenser objective lens. CF-QPCM can be combined with various fluorescence microscopies to perform multi-modality imaging, providing complementary information for the same sample.
CF-QPCM is expediently constructed in a wide-field fluorescence microscope frame, where a dichroic mirror wheel is equipped for integrating fluorescence imaging modality, as shown in Figure 1A. An illuminator is comprised of dozens of LEDs, which are distributed in several concentric rings. The LEDs on different rings can be chosen independently, so that they can illuminate a sample at different angles. All LEDs used are identical and have a narrow spectrum band (470 ± 10 nm, central wavelength ± half-width). For CF-QPCM imaging, only the LEDs on one ring are lit up simultaneously to achieve off-axis illuminations. The emitted light from the LEDs directly illuminates the sample, which is placed at the front focal plane of the objective lens (Leica, ×100/1.44 Oil Immersion, WD-0.17, Germany). After passing through the sample, an object wave is formed, which carries the structural and compositional information of the sample. The object wave can be divided into scattered and unscattered waves. The scattered and unscattered waves are Fourier transformed by the objective lens and further imaged to a high-speed SLM (Meadowlark Optics, MSP1920-400-800-HSP8, United States) by a telescope system (shown in Figure 1A). A polarizer is placed before the SLM to maximize the phase modulation efficiency of the SLM. To perform quantitative phase imaging of CF-QPCM, the spectra of unscattered waves, which are apparently the images of all the LEDs, are retarded in phase for 0, 0.5π, π, and 1.5π by the SLM, as seen in Figure 1A. For simplicity, the sample to be studied is described with the transmittance function
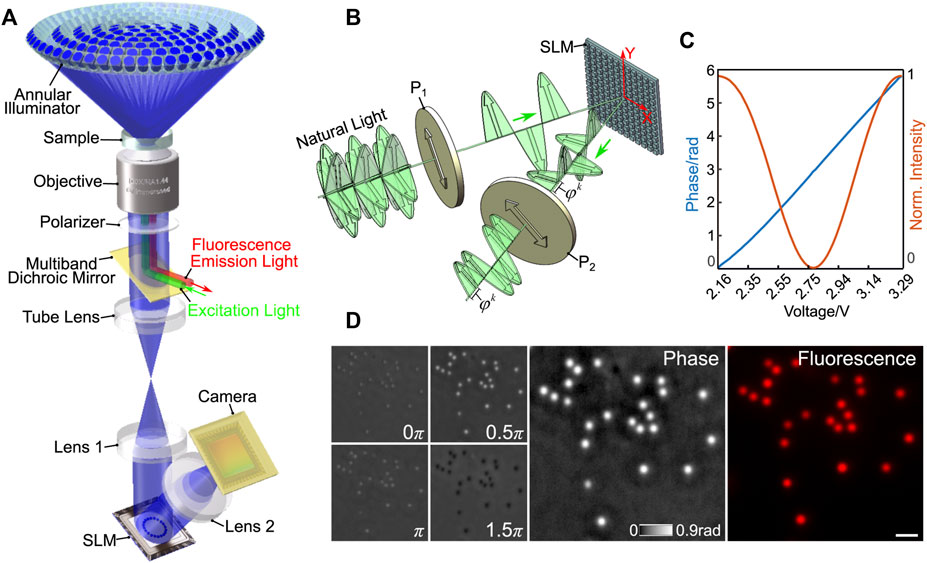
FIGURE 1. (A) The schematic diagram of CF-QPCM. (B) The schematic setup for SLM calibration. (C) Calibration curves: the measured intensity (orange) and the modulated phase (blue) versus the loaded voltage. (D) Phase and fluorescence images of fluorescent polystyrene spheres (diameter: 300 nm). The left is the raw intensity images obtained during the four-step phase-shifting operation, and the right is the reconstructed phase image and the fluorescence image. Scale bar in (D) represents 1 μm.
Here,
Here tan−1{·} denotes the arctangent function. Obviously, the temporal resolution of the system is determined by the maximal frame rate of the sCMOS camera and the SLM (the lower one of the two). Considering four frames are needed to reconstruct a quantitative phase image, the temporal resolution of the system is 4 ms. Ulteriorly, the temporal resolution of the system can reach up to 250 FPS by reusing the raw phase-shifting images [28].
SLM is the key component in CF-QPCM, whose nonlinear optical response of liquid crystal to loaded voltage needs to be calibrated for a linear response between the applied voltage and the generated phase. We propose a simple method to calibrate the SLM accurately, which allows for measuring the response property of each pixel and avoiding the wavefront curvature induced by externally induced devices. The schematic diagram of the proposed SLM calibration is shown in Figure 1B. By nature, the liquid crystal in SLMs only respond to the light with the polarization orientation along the y direction (Y-axis), while it has no response to the light with the polarization orientation along the x direction (X-axis). Therefore, we set two polarizers, P1 and P2, with their polarization direction 45o with respect to the x-direction. After traversing through the first polarizer P1 and modulated by the SLM, the resulted light beams can be written as
Here, m and n represent the pixel coordinates on the SLM along the x and y directions.
The dc term
In the CF-QPCM system, we use an annular illuminator circled by 24 LEDs, generating oblique illuminations (NAillu = 0.7) to achieve higher spatial resolution. Under such illumination, a sample is imaged by an oil-immersed objective lens (×100/1.44, Leica). According to the principle of partially coherent imaging, the theoretical lateral resolution of the system is δ = λ/(NAimag + NAillu) = 220 nm under the oblique illuminations and 326 nm under on-axis plane wave illumination, respectively. Then, we use 200 nm diameter fluorescent polystyrene spheres (RF200C, Huge Biotechnology) to measure the lateral resolution of the CF-QPCM system. Figure 2 shows the images of the polystyrene spheres obtained with CF-QPCM in comparison with fluorescence imaging (Figure 2C). Specifically, Figures 2A,B are the phase images of the polystyrene spheres obtained with annular illumination (NAillu = 0.7) and on-axis plane wave illumination (NAillu = 0). The phase distributions along the line that crosses the center of the same individual sphere in Figures 2A,B were extracted and fitted with Gaussian functions in Figure 2D. It is apparent that the prior one has a higher spatial resolution than the later one. When dozens of spheres were analyzed like the way shown in Figure 2D, the statistics reveal that the measured lateral resolutions (in terms of full width at half maximum, FWHM) are
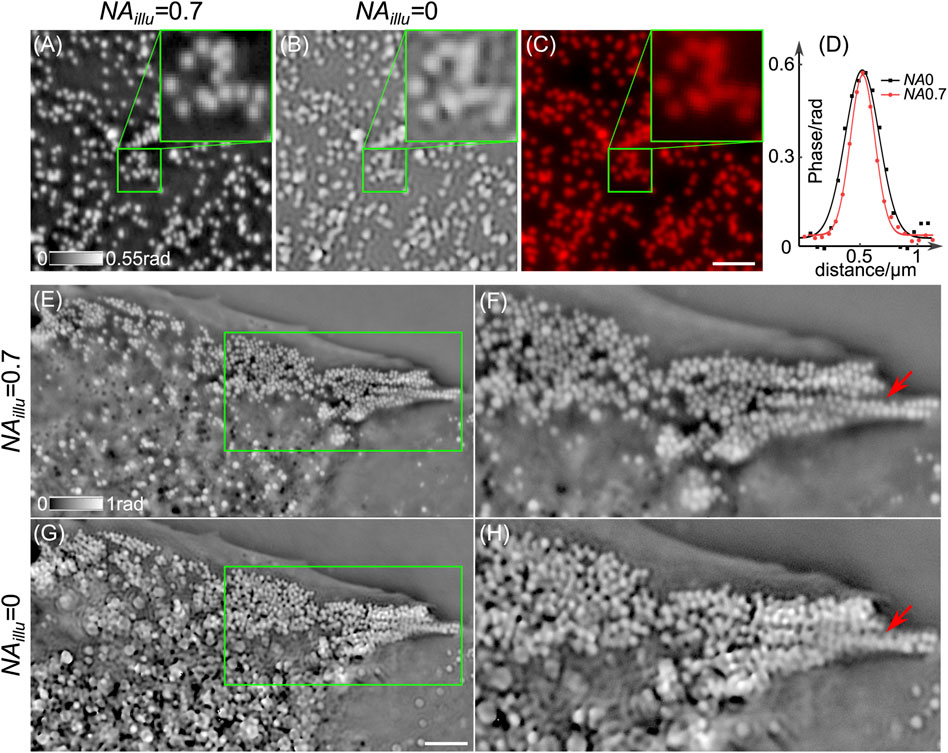
FIGURE 2. CF-QPCM imaging of polystyrene spheres and lipid droplets inside live Cos7 cells. (A,B) The phase images of 200-nm diameter polystyrene spheres using CF-QPCM with annular illuminations (NAillu = 0.7) and on-axis plane wave illumination (NAillu = 0). (C) The fluorescence image of the polystyrene spheres. (D) The profiles along the lines crossing the centers of a sphere in (A,B). (E) and (G) The phase images of live a Cos7 cell obtained by CF-QPCM with annular illumination (NAillu = 0.7) and on-axis plane wave illumination (NAillu = 0). (F) and (H) The enlarged views in the green boxes in (E) and (G) show the superiority of NAillu-0.7 illumination over NAillu-0 illumination on resolving minute structures of samples. Scale bars in (C) and (G): 2 and 4 μm.
CF-QPCM can visualize fine structures of sub-cellular organelles inside live cells once for all with high contrast and high resolution, but it lacks the specificity of organelles. As a remedy, we integrated both the CF-QPCM module and fluorescence imaging module into a microscope frame to obtain complementary information simultaneously for the same organelles, as shown in Figure 3. First, we demonstrated phase and fluorescence dual-modality imaging on mitochondria in live Cos7 cells stained with fluorescent dye (Thermo Fisher, MitoTracker 7512, United States), and the results are shown in Figure 3A. The merged image indicates that CF-QPCM can perform high-contrast imaging of mitochondria together with the surrounding organelles without fluorescent labeling. Second, we performed phase and fluorescence dual-modality imaging on lipid droplets in live Cos7 cells labeled with specific dye (Thermo Fisher, HCS LipidTOX, United States), as shown in Figure 3B. The phase images of the lipid droplets have high contrast as their inner refractive index is quite different from the cytoplasm. Third, we performed phase and fluorescence dual-modality imaging on cell nucleus in live Cos7 labeled with desired dye (Biotium, NucSpot®Live 650 Nuclear Stain, United States), as shown in Figure 3C. The cell nucleus is often easily recognized since it has a clear membrane. The comparison between CF-QPCM and fluorescence images of the nucleus indicates that CF-QPCM can distinguish the nucleus from other surrounding organelles, such as mitochondria. Lastly, we performed phase and fluorescence dual-modality imaging on endoplasmic reticulum (ER) in live Cos7 cells labeled with ER Tracker (Thermo Fisher, ER Tracker E34250, United States), as shown in Figure 3D. Similar structures of ERs can be visualized in both the phase image and the fluorescence image. It is confirmed from the above experiments that CF-QPCM has the power to image organelles without fluorescent labeling and is compatible with other imaging modalities to provide complementary information.
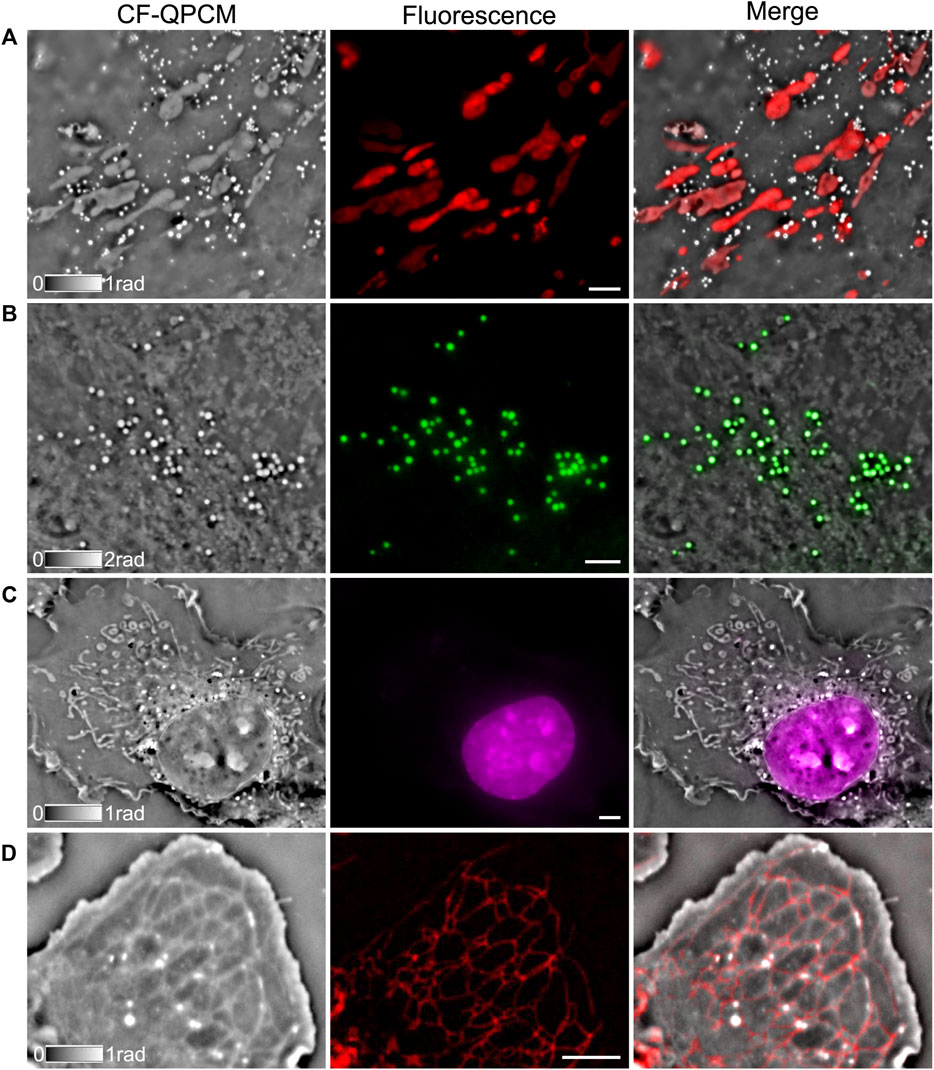
FIGURE 3. Dual-modality images of live Cos7 cells obtained by combining CF-QPCM with a wide-field fluorescence imaging module. CF-QPCM (gray images) and wide-field fluorescence images (color images) of mitochondria (A), lipid droplets (B), cell nucleus with thin membrane (C), and ER (D). Scale bars in (A–D) represent 4 μm.
As mentioned before, the LEDs on the rings with different diameters can be chosen to generate different illumination angles, according to different field of view (FOV) of CF-QPCM imaging. For the large-FOV imaging mode, an objective (×20/0.3) and the LEDs on a ring with a smaller diameter (yielding NAillu = 0.3) are selected to match the phase ring on the SLM. For the small-FOV imaging mode, an oil-immersed objective (×100/1.44) is used, and the LEDs on a ring with a larger diameter (yielding NAillu = 0.7) are selected to match the phase ring on the SLM. The large-FOV imaging mode allows us to study the overall confluency and distribution of cells, as well as the interaction between different cells in a large FOV, while the small-FOV imaging mode enables us to investigate the structure and dynamics of internal organelles with high resolution without fluorescent labeling. Live Cos7 cells were used as the sample to demonstrate the two imaging modes of CF-QPCM in the following.
To demonstrate the first imaging mode of CF-QPCM, Figure 4A, left) shows a phase image of live Cos7 cells in a FOV of 500 × 500 μm2 captured with the objective (×20/0.3) and NAillu = 0.3. Dozens of cells can be observed in the large FOV once for all, which helps us to search for the sub-regions of interest. With the same setting, we captured the flow process of red blood cells (RBCs) as well in the blood vessels of zebrafish (Supplementary Video S1) with a temporal resolution of 100 frames per second (FPS). It can be found that RBCs flow in the blood vessels one by one, and the flow speed is different at different locations. To demonstrate the second imaging mode of CF-QPCM, the sub-regions of interest (about 25 × 25 μm2), e.g., those marked with 1, 2, 3, 4, can be further visualized with high resolution using oil-immersed objective (×100/1.44) and NAillu = 0.7, as shown in Figure 4A, right). Furthermore, CF-QPCM was used to image mitochondria, which play a key role in energy metabolism and are involved in cell aging and death. Figure 4B shows the time series of mitochondrial fission captured with CF-QPCM, and the dynamic process can be seen in Supplementary Video S2. In addition, the dynamic processes (notably the interactions) of ER, mitochondria, and lipid droplets in a live Cos7 cell can be found in Supplementary Video S3. The results indicate that the proposed CF-QPCM can perform high-quality phase imaging for different scales of samples to meet different application requirements.
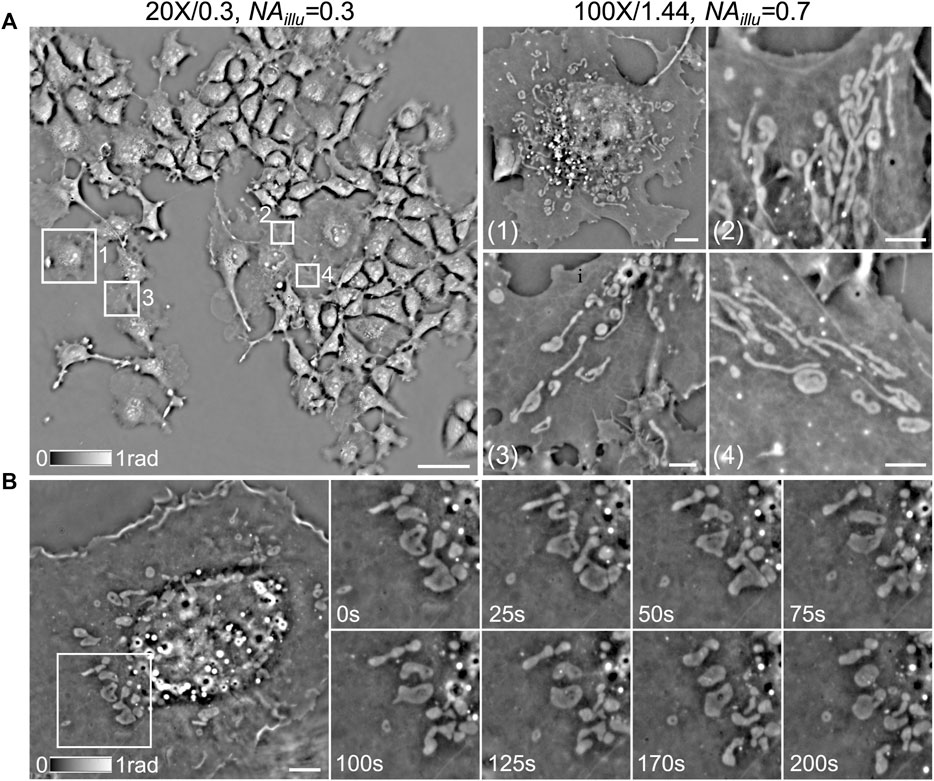
FIGURE 4. Phase imaging of live Cos7 cells with CF-QPCM under different configurations. (A) left: phase image of live Cos7 cells obtained with the large-FOV imaging mode; right: phase images of several sub-regions marked with white boxes on the left, obtained with the small-FOV imaging mode. (B) left: phase image of a live Cos7 cell obtained with the small-FOV imaging mode; right: time series of mitochondrial fission in the white box on the left. Scale bars in (A)-left, (A)-right, and (B) are 65 μm, 4 μm, and 6 μm, respectively.
In this paper, we have demonstrated a high-resolution, condenser-free quantitative phase-contrast microscopy (CF-QPCM) by combining partially coherent annular illumination with quantitative phase-contrast microscopy (QPCM). In CF-QPCM, the transparent samples are directly illuminated with circularly distributed LEDs, greatly simplifying the system configuration, easing the sample installation, and avoiding the cell contamination caused by the water-immersed condenser objective lens. CF-QPCM has a very high spatial resolution of 231 nm (lateral) and a temporal resolution of 250 Hz for 2D imaging, and it can capture the dynamics of organelles inside live cells under normal survival conditions (37°C and 5% CO2) without fluorescent labeling. In the future, if higher spatial resolution is required, oblique illumination with an even larger angle could be used, although this may reduce the space between the sample and illuminator. CF-QPCM can be combined with various fluorescence microscopies to form the multi-modality imaging system. Due to its common path interference configuration, CF-QPCM has a strong immunity to external disturbances, which is very suitable for long-term observation of live samples. And in the proposed CF-QPCM, the annular illumination angle of LEDs can be expediently adjusted through electrical control according to different applications, providing complementary information for the same sample. Of note, the application of CF-QPCM to organelle-specific phase-contrast image can be enhanced by using a neural network, trained with phase and fluorescence image pairs of the same organelles [27]. There are also many label-free QPCM method to provide phase-contrast images for visualizing organelles inside live cells, such as optical diffraction tomography (ODT) with annular quasi-2π illumination [13, 14]. While, CF-QPCM only needs three or four phase-shifted raw images to reconstruct a quantitative phase image and hence has a much faster imaging speed, more suitable for observing the dynamics and interactions of live organelles. Meanwhile, a circularly distributed LEDs illuminator provides a superior spatial resolution to visualize tiny structures of organelles. The quantitative phase imaging capability of CF-QPCM also opens a gate for inspection of industrial devices, like MEMS or microlens arrays. Compared with the traditional approaches, such as digital holographic microscopy (DHM), CF-QPCM has a superior phase stability and sensibility due to its common-path configuration. CF-QPCM can also be applied to chemistry field, for example, to sense the composition of different solvents or to discriminate different substrate materials since different chemical constituent have different refractive index. We believe such a simple and versatile apparatus will be widely applied for biomedical fields and life science.
The original contributions presented in the study are included in the article/Supplementary Material, further inquiries can be directed to the corresponding author.
The animal study was reviewed and approved by Animal Experiment Ethics Committee of Xidian University.
PG conceived and supervised the project. YM and LM Performed experiments and data analysis. JZ, ML, and ZZ contributed to data analysis. YM wrote the draft of the manuscript. All the authors edited the manuscript.
The authors acknowledge the support from the National Natural Science Foundation of China (NSFC 62105251, 62075177, 12104354); Natural Science Foundation of Shaanxi Province (2021JQ-184); Fundamental Research Funds for the Central Universities (XJS210503 and XJS210504); the National Key Research and Development Program of China (2021YFF0700303); Exchange Program Between China-and Poland (2021–2022); Guangdong Basic and Applied Basic Research Foundation (2020A1515110590); Research Fund of State Key Laboratory of Transient Optics and Photonics.
The authors declare that the research was conducted in the absence of any commercial or financial relationships that could be construed as a potential conflict of interest.
All claims expressed in this article are solely those of the authors and do not necessarily represent those of their affiliated organizations, or those of the publisher, the editors and the reviewers. Any product that may be evaluated in this article, or claim that may be made by its manufacturer, is not guaranteed or endorsed by the publisher.
The Supplementary Material for this article can be found online at: https://www.frontiersin.org/articles/10.3389/fphy.2022.892529/full#supplementary-material
1. Yuan W., Zhu B., Li X.-Y., Hansen T. W., Ou Y., Fang K, et al. Visualizing H 2 O Molecules Reacting at TiO 2 Active Sites with Transmission Electron Microscopy. Science (2020) 367:428–30. doi:10.1126/science.aay2474
2. Kumar A., Baker J. N., Bowes P. C., Cabral M. J., Zhang S., Dickey E. C, et al. Atomic-resolution Electron Microscopy of Nanoscale Local Structure in lead-based Relaxor Ferroelectrics. Nat. Mater. (2021) 20:62–67. doi:10.1038/s41563-020-0794-5
3. Shao L., Kner P., Rego E. H., Gustafsson M. G. L. Super-resolution 3D Microscopy of Live Whole Cells Using Structured Illumination. Nat. Methods (2011) 8:1044–1046. doi:10.1038/nmeth.1734
4. Hell S. W., Wichmann J. Breaking the Diffraction Resolution Limit by Stimulated Emission: Stimulated-Emission-Depletion Fluorescence Microscopy. Opt. Lett. (1994) 19:780–782. doi:10.1364/OL.19.000780
5. Betzig E., Trautman J. K., Harris T. D., Weiner J. S., Kostelak R. L. Breaking the Diffraction Barrier: Optical Microscopy on a Nanometric Scale. Science (1991) 251:1468–1470. doi:10.1126/science.251.5000.1468
6. Rust M. J., Bates M., Zhuang X. Sub-diffraction-limit Imaging by Stochastic Optical Reconstruction Microscopy (STORM). Nat. Methods (2006) 3:793–796. doi:10.1038/nmeth929
7. Micó V., Zheng J., Garcia J., Zalevsky Z., Gao P. Resolution Enhancement in Quantitative Phase Microscopy. Adv. Opt. Photon. (2019) 11:135–214. doi:10.1364/AOP.11.000135
8. Gao P., Yuan C. Resolution Enhancement of Digital Holographic Microscopy via Synthetic Aperture: a Review. gxjzz (2022) 3:1–16. doi:10.37188/lam.2022.006
9. Park Y., Choi W., Yaqoob Z., Dasari R., Badizadegan K., Feld M. S. Speckle-field Digital Holographic Microscopy. Opt. Express (2009) 17:12285–92. doi:10.1364/OE.17.012285
10. Zheng J., Pedrini G., Gao P., Yao B., Osten W. Autofocusing and Resolution Enhancement in Digital Holographic Microscopy by Using Speckle-Illumination. J. Opt. (2015) 17:085301. doi:10.1088/2040-8978/17/8/085301
11. Gao P., Pedrini G., Osten W. Structured Illumination for Resolution Enhancement and Autofocusing in Digital Holographic Microscopy. Opt. Lett. (2013) 38:1328–30. doi:10.1364/OL.38.001328
12. Zhang M., Ma Y., Wang Y., Wen K., Zheng J., Liu L, et al. Polarization Grating Based on Diffraction Phase Microscopy for Quantitative Phase Imaging of Paramecia. Opt. Express (2020) 28:29775–87. doi:10.1364/OE.404289
13. Dong D., Huang X., Li L., Mao H., Mo Y., Zhang G, et al. Super-resolution Fluorescence-Assisted Diffraction Computational Tomography Reveals the Three-Dimensional Landscape of the Cellular Organelle Interactome. Light Sci. Appl. (2020) 9:1–15. doi:10.1038/s41377-020-0249-4
14. Cotte Y., Toy F., Jourdain P., Pavillon N., Boss D., Magistretti P, et al. Marker-free Phase Nanoscopy. Nat Photon (2013) 7:113–117. doi:10.1038/nphoton.2012.329
15. Godden T. M., Suman R., Humphry M. J., Rodenburg J. M., Maiden A. M. Ptychographic Microscope for Three-Dimensional Imaging. Opt. Express (2014) 22:12513–12523. doi:10.1364/OE.22.012513
16. Zhang H., Jiang S., Liao J., Deng J., Liu J., Zhang Y, et al. Near-field Fourier Ptychography: Super-resolution Phase Retrieval via Speckle Illumination. Opt. Express (2019) 27:7498–512. doi:10.1364/OE.27.007498
17. Alexandrov S. A., Hillman T. R., Gutzler T., Sampson D. D. Synthetic Aperture Fourier Holographic Optical Microscopy. Phys. Rev. Lett. (2006) 97:168102. doi:10.1103/physrevlett.97.168102
18. Ou X., Horstmeyer R., Zheng G., Yang C. High Numerical Aperture Fourier Ptychography: Principle, Implementation and Characterization. Opt. Express (2015) 23:3472–91. doi:10.1364/OE.23.003472
19. Ledwig P., Robles F. E. Quantitative 3D Refractive index Tomography of Opaque Samples in Epi-Mode. Optica (2021) 8:6–14. doi:10.1364/OPTICA.410135
20. Zuo C., Li J., Sun J., Fan Y., Zhang J., Lu L, et al. Transport of Intensity Equation: a Tutorial. Opt Lasers Eng (2020) 135:106187. doi:10.1016/j.optlaseng.2020.106187
21. Nguyen T. H., Kandel M. E., Rubessa M., Wheeler M. B., Popescu G. Gradient Light Interference Microscopy for 3D Imaging of Unlabeled Specimens. Nat. Commun. (2017) 8:1–9. doi:10.1038/s41467-017-00190-7
22. Zernike F. Phase Contrast, a New Method for the Microscopic Observation of Transparent Objects Part II. Physica (1942) 9:974–986. doi:10.1016/S0031-8914(42)80035-X10.1016/s0031-8914(42)80079-8
23. Webb K. F. Condenser‐free Contrast Methods for Transmitted‐light Microscopy. J Microsc (2015) 257:8–22. doi:10.1111/jmi.12181
24. Wang Z., Millet L., Mir M., Ding H., Unarunotai S., Rogers J, et al. Spatial Light Interference Microscopy (SLIM). Opt. Express (2011) 19:1016–26. doi:10.1364/OE.19.001016
25. Zhang J. K., He Y. R., Sobh N., Popescu G. Label-free Colorectal Cancer Screening Using Deep Learning and Spatial Light Interference Microscopy (SLIM). APL Photon (2020) 5:040805. doi:10.1063/5.0004723
26. Ma Y., Guo S., Pan Y., Fan R., Smith Z. J., Lane S, et al. Quantitative Phase Microscopy with Enhanced Contrast and Improved Resolution through Ultra‐oblique Illumination (UO‐QPM). J. Biophotonics (2019) 12:e201900011. doi:10.1002/jbio.201900011
27. Guo S., Ma Y., Pan Y., Smith Z. J., Chu K. Organelle-specific Phase Contrast Microscopy Enables Gentle Monitoring and Analysis of Mitochondrial Network Dynamics. Biomed. Opt. Express (2021) 12:4363–4379. doi:10.1364/BOE.425848
28. Ma Y., Li D., Smith Z. J., Li D., Chu K. Structured Illumination Microscopy with Interleaved Reconstruction (SIMILR). J. Biophotonics (2017) 11:e201700090. doi:10.1002/jbio.201700090
Keywords: quantitative phase imaging, phase contrast, ultra-oblique illumination, label-free, non-invasive
Citation: Ma Y, Ma L, Zheng J, Liu M, Zalevsky Z and Gao P (2022) High Spatio-Temporal Resolution Condenser-Free Quantitative Phase Contrast Microscopy. Front. Phys. 10:892529. doi: 10.3389/fphy.2022.892529
Received: 09 March 2022; Accepted: 23 March 2022;
Published: 09 May 2022.
Edited by:
Santosh Kumar, Liaocheng University, ChinaReviewed by:
Revathi Sekar, Helmholtz Association of German Research Centres (HZ), GermanyCopyright © 2022 Ma, Ma, Zheng, Liu, Zalevsky and Gao. This is an open-access article distributed under the terms of the Creative Commons Attribution License (CC BY). The use, distribution or reproduction in other forums is permitted, provided the original author(s) and the copyright owner(s) are credited and that the original publication in this journal is cited, in accordance with accepted academic practice. No use, distribution or reproduction is permitted which does not comply with these terms.
*Correspondence: Peng Gao, cGVuZy5nYW9AeGlkaWFuLmVkdS5jbg==
†These authors have contributed equally to this work
Disclaimer: All claims expressed in this article are solely those of the authors and do not necessarily represent those of their affiliated organizations, or those of the publisher, the editors and the reviewers. Any product that may be evaluated in this article or claim that may be made by its manufacturer is not guaranteed or endorsed by the publisher.
Research integrity at Frontiers
Learn more about the work of our research integrity team to safeguard the quality of each article we publish.