- 1Institute of Military Transportation, Army Military Transportation University, Tianjin, China
- 2School of Control Science and Engineering, Tiangong University, Tianjin, China
In this study, we aim to investigate the fault prediction for watercraft equipment by using grey relational analysis. At first, the healthy degree model of watercraft equipment is proposed, and then two main theorems are derived to determine the health condition criteria for equipment. Lastly, the relevant simulation results are provided to verify the validity and accuracy of the healthy degree model. Current results can be helpful to effectively design the supporting mode of watercraft equipment and realize the transformation of watercraft equipment support from planned maintenance to predictive maintenance.
1 Introduction
Maintenance task affects the reliability and availability of equipment, which is the key factor to minimize failure time and reduce operation cost in the lifecycle of equipment [1]. Currently, the majority of methods of equipment maintenance are planned maintenance [2–10]. Among them, AKYUZ and CELIK designed an enhanced planned maintenance system (E-PMS) for a ship by using A’WOT, and their study had made a great contribution to improving the performance of equipment [2]. In practice, however, the planned maintenance is greatly influenced by the external environment and heavily depends on human effort, which leads to low efficiency and poor accuracy in the following two aspects: one is excessive maintenance, which means the unnecessary maintenance of better equipment, and the other one is insufficient maintenance, and the equipment has broken down before the maintenance period due to various reasons, but restricted by the maintenance plan, it has to operate with faults.
Therefore, fault prediction is the key to realizing the transformation of support mode from planned maintenance to predictive maintenance, which can perform the warning before the failure of equipment occurs. Also, more and more attention has been focused on fault prediction for equipment [11–22], such as fault prediction for the vehicle [11, 12], the watercraft [13–15], the aircraft engine [16–18], the power supply system [19, 20], and the track circuit [21–23]. Due to the complexity of watercraft structure and the diversity of the marine environment, it is challenging and difficult to study the fault prediction for watercraft equipment.
Over the past few years, a large number of methods were explored to predict the failure, such as the grey model [24, 25], the BP neural network [26, 27], the RBF neural network [28, 29], the data-driven model [30–33], deep learning [34], and the grey relational analysis method [35]. Although the grey models in [24, 25] were effective to a certain extent, they only considered the development of a single or several characteristic parameters independently. There were also some results that focused on theoretical research and had made some contributions [36, 37]. But their experimental data was generated from the simulation, which cannot represent the data characteristics of a real physical system. Meanwhile, a data-driven prediction method was introduced into the failure prognosis of marine diesel engines, and a discrete wavelet transform was applied to process the data based on the data characteristics [30]. In order to take multiple characteristic parameters into account comprehensively, the grey neural network model was first introduced into fault prediction for ship machinery in [38]. However, most of the existing works [30] only analyze whether the watercraft equipment will break down; they cannot explain the type of the fault and when the fault will occur. In response to the aforementioned problems, the healthy degree model based on grey relational analysis of watercraft equipment is proposed in this study, and it has been applied to a certain type of watercraft and the improvement of performance has been approved. The highlights of this study are summarized as follows.
∗ A novel healthy degree model is put forward by using grey relational analysis. The healthy state of watercraft equipment can be predicted by the value of the healthy degree. If the healthy degree is greater than 1, then the watercraft equipment will be healthy. If the healthy degree is less than 1, then the watercraft equipment will break down, the fault mode will be identified, and the fault occurrence time will be predicted.
∗ The implementation of the support mode transformation from planned maintenance to predictive maintenance can solve the three major problems: whether the watercraft equipment needs to be repaired, what kind of fault it is, and when the fault will occur.
The rest of this article is arranged as follows: at first, we describe the problem to be resolved in Section 2, which consists of the necessary notations and the data generation method. Then, the healthy degree model is introduced in Section 3 to predict whether the watercraft equipment needs to be repaired, what kind of equipment fault it is, and when the fault will occur. In Section 4, an example of fault prediction is provided for the engine equipment in a certain type of watercraft, and the simulation results are obtained to verify the validity and accuracy of the fault prediction. Finally, some concluding remarks are made to end this study.
2 Problem Descriptions
2.1 Notations
The dataset to be tested is expressed as
2.2 The Data Generation Method of Grey Relational Analysis
Since the range of watercraft equipment character parameters are different, and the values of them are not in one order of magnitude, it is very important to process the values into a comparability sequence. In fact, this processing is similar to normalization which is called data generation of grey relational analysis.
The method in [39] is used in this section since the data generation is obtained according to the attributes of character parameters.
If we wish to maximize the value of character parameter, then the value generated can be described as follows:
which is provided in [39].
If we wish to minimize the value of character parameter, then the value generated can be denoted as follows:
which is exhibited in [39].
If we wish that the value be close to the desired value y*, then the value generated can be expressed as follows:
which is represented in [39].
It is obvious that the values of character parameters are transformed into the same interval
3 Healthy Degree Model Based on Grey Relational Analysis
The traditional grey relational coefficient used in [39] is calculated merely depending on the difference between two sequences. Actually, the area can represent the grey relational coefficient between two sequences; more obviously, the larger the area is, the smaller the grey relational coefficient will be. Then the area between the two sequences labeled xi and yj is described as follows:
where l is the number of intersections between the two sequences, and intersections are expressed as
After that, the grey relational coefficient is represented as follows:
where Sij and δij are the area and similarity between the two sequences, respectively. Clearly, the grey relational coefficient increases with the increase of similarity, while it decreases when the area is increased.
Finally, the healthy degree is expressed as follows:
If all of hij is greater than 1 for any
Theorem 1. : For
Proof: According to Eq.
From the known condition
Based on Eq.
In the same way, Eq.
On the basis of Eq.
Then, we have
By virtue of which the function
Multiplying both sides of Eq.
Theorem 2. : If rij < ri0 for
Proof: Due to rij < ri0 for
On account of which the function
Based on Eq.
4 Simulation Results
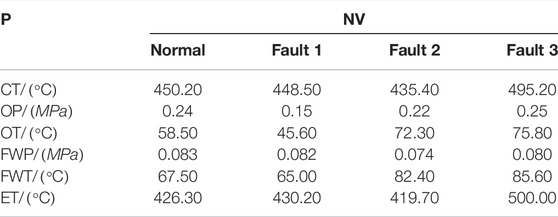
A fault prediction example is given for the engine equipment in a certain type of watercraft. Three kinds of common faults are chosen to establish the healthy degree model. Fault 1 is excessive clearance of the crankpin bearing or main bearing, fault 2 is cooling water leakage, and fault 3 is propeller overload. Parameters of cylinder temperature (labeled CT), oil pressure (labeled OP), oil temperature (labeled OT), freshwater pressure (labeled FWP), freshwater temperature (labeled FWT), and exhaust temperature (labeled ET) are selected as the character parameters. According to their values of them in the states of health and three failure modes, the average value of them in each state is considered as the normalized vector which is described in Table 1 where P is the parameter and NV is the normalized vector.
Taking time as the horizontal axis and healthy degree as the vertical axis, three kinds of fault prediction curves are represented to analyze the trend of the curve and predict the occurrence time of the fault included. In this case, the time period is 100 s with a failure point included. The corresponding historical failure record is exhibited in Table 2. If the predicted results obtained by the healthy degree model are consistent with Table 2, then the effectiveness of the healthy degree model can be verified.

TABLE 2. Historical failure record of which the time period is 100 s with the failure point included.
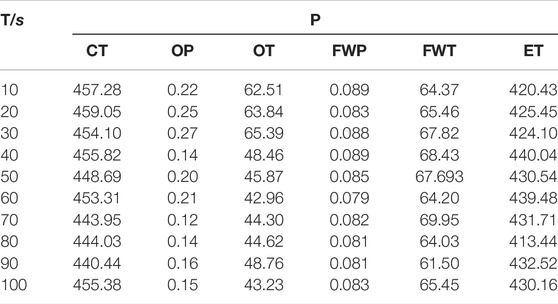
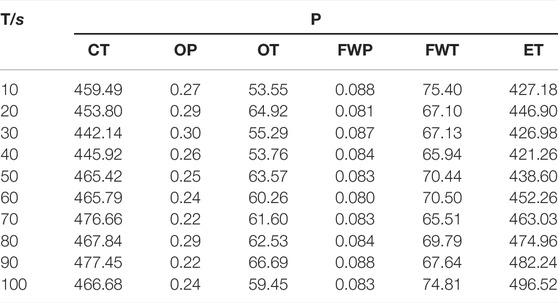
In the process of the engine equipment from normal operation to the failure of excessive clearance of the crankpin bearing or main bearing, the time period 100 s including the failure point is studied, and the data are collected every 10 s. The collected data are shown in Table 3, where P and T mean the parameter and time.
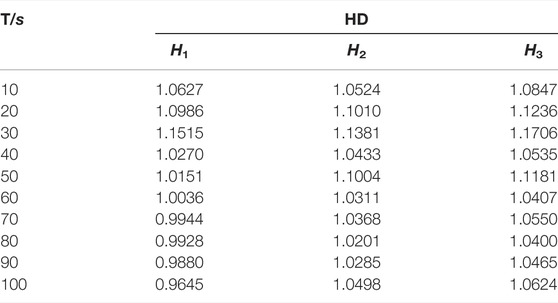
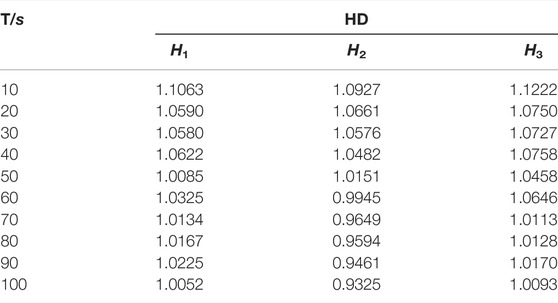
The generated data aforementioned are brought into the healthy degree model to calculate the healthy degree exhibited in Table 4, where HD is healthy degree and T is time, and the graph of fault prediction curves is displayed in Figure 1.
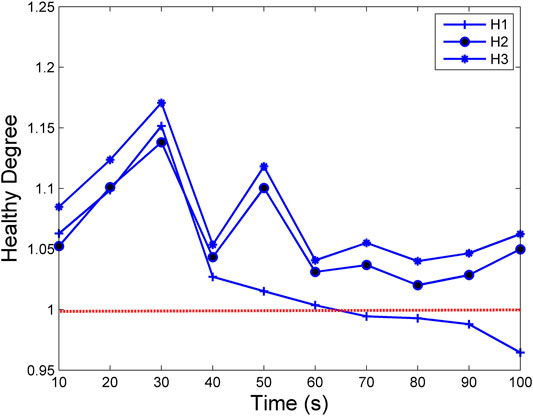
FIGURE 1. Fault prediction curves of engine equipment from normal operation to fault 1. It is obvious that only the healthy degree of fault prediction curve of fault 1 starts to be less than 1 in the time period from 60 to 70 s, and it decreases with time.
It is obvious that only the healthy degree of fault 1 starts to be less than 1 in the time period from 60 to 70 s, and it decreases with time. In other words, the failure of excessive clearance of the crankpin bearing or main bearing will occur in the time period from 60 to 70 s, which is consistent with Table 2.
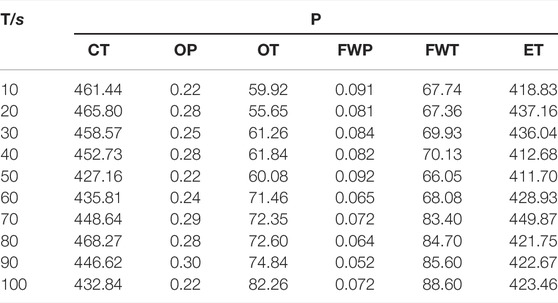
In the process of engine equipment from normal operation to fault 2, in this case, the time period is 100 s with a failure point included, and the data are collected every 10 s which is described in Table 5.
Based on the collected data and the healthy degree model, the healthy degree is obtained in Table 6, and the graph of fault prediction curves is shown in Figure 2.
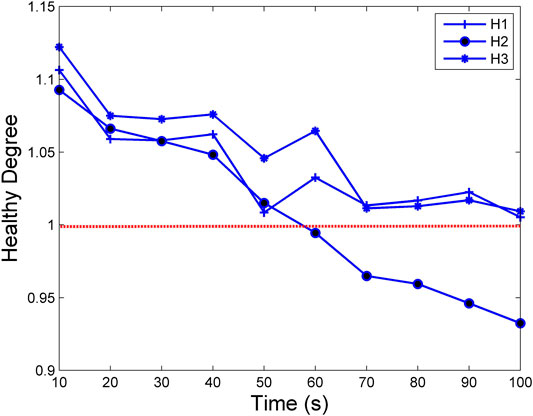
FIGURE 2. Fault prediction curves of engine equipment from normal operation to fault 2. It is evident that only the fault prediction curve of fault 2 whose healthy degree starts to be less than 1 in the time period from 50 to 60 s.
According to Figure 2, only the fault prediction curve of the leakage of cooling water whose healthy degree starts to be less than 1 in the time period from 50 to 60 s, and the healthy degree decreases with time. Therefore, the fault of the leakage of cooling water will happen in the time period from 50 to 60 s, which is in line with Table 2.
The time period of 100 s with the failure point included is discussed in the process of engine equipment from normal operation to fault 3. The data are collected every 10 s, as shown in Table 7.
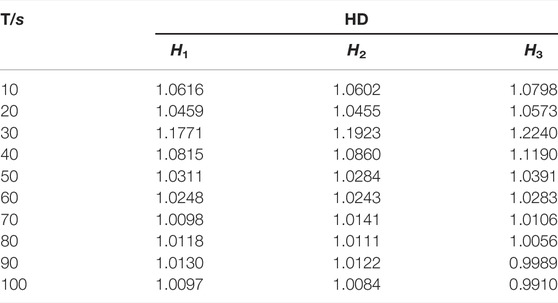
The collected data are used to calculate the healthy degree in Table 8, and the graph of fault prediction curves is displayed in Figure 3.
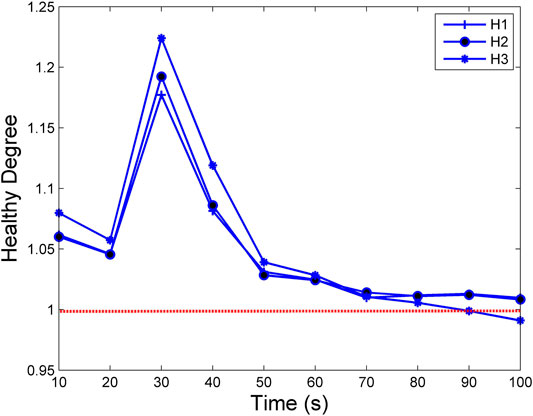
FIGURE 3. Fault prediction curves of engine equipment from normal operation to fault 3. It is obvious that only the fault prediction curve of fault 3 whose healthy degree starts to be less than 1 when the time is close to 90 s, and the healthy degree decreases with time.
It is evident that only the fault prediction curve of the propeller overload whose healthy degree starts to be less than 1 when the time is close to 90 s, and the healthy degree decreases with time. In short, the occurrence time of the propeller overload failure will be close to 90 s, which matches the data shown in Table 2.
5 Conclusion
In summary, the healthy degree model of watercraft equipment is proposed in this article. On the basis of grey relational analysis, the healthy degree model can solve three major problems: whether watercraft equipment needs to be repaired, what kind of fault it is, and when the fault will occur. After that, we analytically derive two theorems related to the healthy degree model, which are conducive to comprehending and applying the healthy degree model. Finally, the real data of the engine equipment in a certain type of watercraft are utilized and the relevant simulation results are provided to verify the effectiveness of the healthy degree model, and there are failure data of three types of common faults which are excessive clearance of the crankpin bearing or main bearing, the leakage of cooling water, and the propeller overload. Obviously, the predicted results of the healthy degree model are consistent with reality. The current analysis of fault prediction will be beneficial to change the support mode of watercraft equipment and realize the transformation of watercraft equipment support from planned maintenance to predictive maintenance.
In addition, there still remains a disadvantage due to the lack of failure data in this study. We will further study the generation of failure data via establishing the simulation model of watercraft equipment, carrying out the fault simulation experiment, and fully utilizing the data science in [40, 41].
Data Availability Statement
The original contributions presented in the study are included in the article/Supplementary Materials, further inquiries can be directed to the corresponding author.
Author Contributions
SF: writing the original manuscript. SF, ZC, and QG: healthy degree model analysis. SF: simulation experiment. SF and JY: revising the manuscript. CX: review, guidance, and editing. All authors have made efforts for the work and agreed to its publication.
Funding
This work was partially supported by the Project of Prognostic and Health Management (Grant 47201) and the National Natural Science Foundation of China (NSFC) (Grant 61773286).
Conflict of Interest
The authors declare that the research was conducted in the absence of any commercial or financial relationships that could be construed as a potential conflict of interest.
Publisher’s Note
All claims expressed in this article are solely those of the authors and do not necessarily represent those of their affiliated organizations, or those of the publisher, the editors, and the reviewers. Any product that may be evaluated in this article, or claim that may be made by its manufacturer, is not guaranteed or endorsed by the publisher.
References
1. Lazakis I, Raptodimos Y, Varelas T. Predicting Ship Machinery System Condition through Analytical Reliability Tools and Artificial Neural Networks. Ocean Eng (2018) 152:404–15. doi:10.1016/j.oceaneng.2017.11.017
2. Akyuz E, Celik M. Using of A'wot to Design an Enhanced Planned Maintenance System (E-Pms) On-Board Ship. Brod (2017) 68:61–75. doi:10.21278/brod68104
3. Gašpar G, Poljak I, Orović J. Computerized Planned Maintenance System Software Models. Pomor (Online) (2018) 32:141–5. doi:10.31217/p.32.1.14
4. Stanivuk T, Stazić L, Vidović F, Čobanov A. Ship Planned Maintenance System Data Analysis. Int J Traffic Transp Eng (2020) 10:432–6. doi:10.7708/ijtte.2020.1002
5. Al-Turki U, Duffuaa S, Bendaya M. Trends in Turnaround Maintenance Planning: Literature Review. Jqme (2019) 25:253–71. doi:10.1108/jqme.2017.007410.1108/jqme-10-2017-0074
6. Stazić L, Komar I, Mihanović L, Mišura A. Shipowner′s Impact on Planned Maintenance System Database Quality Grades Resemblance Equalization. Trans Marit Sci (2018) 7:5–22. doi:10.7225/toms.2018.07.001
7. Kim M, Hyun DK, Kim SH, Ji WK, Kwon KS. A Study on the Scheduling of Planned Maintenance for Multicomponent System with Hidden Failures: Focusing on Inspection Cost. J Korea Academia-Industrial Coop Soc (2019) 20:149–58. doi:10.5762/kais.2019.20.10.149
8. Fernández-Marca D, Mostacero-Rojas K, Núñez-Ponce V, Raymundo C, Mamani-Macedo N, Moguerza JM. Lean Manufacturing Model of Production Management under the Focus on Maintenance Planned to Improve the Capacity Used in a Plastics Industry Sme. In: International Conference on Applied Human Factors and Ergonomics. Springer (2020). 448–54. doi:10.1007/978-3-030-50791-6_57
9. Jasiulewicz-Kaczmarek M. Swot Analysis for Planned Maintenance Strategy-A Case Study. IFAC-PapersOnLine (2016) 49:674–9. doi:10.1016/j.ifacol.2016.07.788
10. Wang W. A Stochastic Model for Joint Spare Parts Inventory and Planned Maintenance Optimisation. Eur J Operational Res (2012) 216:127–39. doi:10.1016/j.ejor.2011.07.031
11. Nabwey HA. A Method for Fault Prediction of Air Brake System in Vehicles. Int J Eng Res Technol (2020) 13:1002–8. doi:10.37624/ijert/13.5.2020.1002-1008
12. Shafi U, Safi A, Shahid AR, Ziauddin S, Saleem MQ. Vehicle Remote Health Monitoring and Prognostic Maintenance System. J Adv Transp (2018) 2018:1–10. doi:10.1155.2018.806151410.1155/2018/8061514
13. Tra V, Kim J. Pressure Vessel Diagnosis by Eliminating Undesired Signal Sources and Incorporating ga-based Fault Feature Evaluation. IEEE Access (2020) 8:134653–67. doi:10.1109/access.2020.3010871
14. Sahu AR, Palei SK. Fault Prediction of Drag System Using Artificial Neural Network for Prevention of Dragline Failure. Eng Fail Anal (2020) 113:104542–29. doi:10.1016/j.engfailanal.2020.104542
15. Tsaganos G, Nikitakos N, Dalaklis D, Ölcer AI, Papachristos D. Machine Learning Algorithms in Shipping: Improving Engine Fault Detection and Diagnosis via Ensemble Methods. WMU J Marit Aff (2020) 19:51–72. doi:10.1007/s13437-019-00192-w
16. Shang L, Liu G. Sensor and Actuator Fault Detection and Isolation for a High Performance Aircraft Engine Bleed Air Temperature Control System. IEEE Trans. Contr. Syst. Technol. (2011) 19:1260–8. doi:10.1109/tcst.2010.2076353
17. Liu Y, Wang T, Zhang H, Cheutet V. Simulation-based Fuzzy-Rough Nearest Neighbour Fault Classification and Prediction for Aircraft Maintenance. J Simul (2021) 15:202–16. doi:10.1080/17477778.2019.1680261
18. Zhao Y-P, Wang J-J, Li X-Y, Peng G-J, Yang Z. Extended Least Squares Support Vector Machine with Applications to Fault Diagnosis of Aircraft Engine. ISA Trans (2020) 97:189–201. doi:10.1016/j.isatra.2019.08.036
19. Zhang S, Wang Y, Liu M, Bao Z. Data-based Line Trip Fault Prediction in Power Systems Using Lstm Networks and Svm. IEEE Access (2018) 6:7675–86. doi:10.1109/access.2017.2785763
20. Feng D, Lin S, He Z, Sun X. A Technical Framework of Phm and Active Maintenance for Modern High-Speed Railway Traction Power Supply Systems. Int J Rail Transp (2017) 5:145–69. doi:10.1109/access.2017.278576310.1080/23248378.2017.1286954
21. Hu L-Q, He C-F, Cai Z-Q, Wen L, Ren T. Track Circuit Fault Prediction Method Based on Grey Theory and Expert System. J Vis Commun Image Represent (2019) 58:37–45. doi:10.1016/j.jvcir.2018.10.024
22. de Bruin T, Verbert K, Babuška R. Railway Track Circuit Fault Diagnosis Using Recurrent Neural Networks. IEEE Trans. Neural Netw. Learn Syst. (2017) 28:523–33. doi:10.1109/tnnls.2016.2551940
23. Liu S, Wei Y, Yin Y, Feng T, Lin J. Structural Health Monitoring Method of Pantograph-Catenary System Based on Strain Response Inversion. Front. Phys. (2021) 9:316. doi:10.3389/fphy.2021.691510
24. Shiuh-Jer Huang SJ, Chien-Lo Huang CL. Control of an Inverted Pendulum Using Grey Prediction Model. IEEE Trans. Ind. Appl. (2000) 36:452–8. doi:10.1109/28.833761
25. Liu W, Zhang M, Wang Y. Weak Thruster Fault Prediction Method for Autonomous Underwater Vehicles Based on Grey Model. In: Proceedings of the Institution of Mechanical Engineers, Part I: Journal of Systems and Control Engineering, 233 (2019). 348–56. doi:10.1177/0959651818793730
26. Yi J, Wang Q, Zhao D, Wen JT. Bp Neural Network Prediction-Based Variable-Period Sampling Approach for Networked Control Systems. Appl Math Comput (2007) 185:976–88. doi:10.1016/j.amc.2006.07.020
27. Wong WE, Qi Y. Bp Neural Network-Based Effective Fault Localization. Int. J. Soft. Eng. Knowl. Eng. (2009) 19:573–97. doi:10.1142/s021819400900426x
28. Ke Meng K, Zhao Yang Dong ZY, Dian Hui Wang DH, Kit Po Wong KP. A Self-Adaptive Rbf Neural Network Classifier for Transformer Fault Analysis. IEEE Trans. Power Syst. (2010) 25:1350–60. doi:10.1109/tpwrs.2010.2040491
29. Chai W, Qiao J. Non-linear System Identification and Fault Detection Method Using Rbf Neural Networks with Set Membership Estimation. Ijmic (2013) 20:114–20. doi:10.1504/ijmic.2013.056183
30. Pan Y, Mao Z, Xiao Q, He X, Zhang Y. Discrete Wavelet Transform Based Data Trend Prediction for Marine Diesel Engine. In: 6th Data Driven Control and Learning Systems (DDCLS). IEEE (2017). 782–7.
31. Baptista M, Sankararaman S, de Medeiros IP, Nascimento C, Prendinger H. Forecasting Fault Events for Predictive Maintenance Using Data-Driven Techniques and Arma Modeling. Comput Industrial Eng (2018) 115:41–53. doi:10.1016/j.cie.2017.10.033
32. Odgaard PF, Lin B, Jorgensen SB. Observer and Data-Driven-Model-Based Fault Detection in Power Plant Coal Mills. IEEE Trans Energy Convers (2008) 23:659–68. doi:10.1109/tec.2007.914185
33. Zhao X, Kim J, Warns K, Wang X, Ramuhalli P, Cetiner S, et al. Prognostics and Health Management in Nuclear Power Plants: an Updated Method-Centric Review with Special Focus on Data-Driven Methods. Front Energy Res (2021) 9:294. doi:10.3389/fenrg.2021.696785
34. She J, Shi T, Xue S, Zhu Y, Lu S, Sun P, et al. Diagnosis and Prediction for Loss of Coolant Accidents in Nuclear Power Plants Using Deep Learning Methods. Front Phys (2021) 9:1–9. doi:10.3389/fenrg.2021.665262
35. Liu HC, You JX, Fan XJ, Lin QL. Failure Mode and Effects Analysis Using D Numbers and Grey Relational Projection Method. Expert Syst Appl (2014) 41:4670–9. doi:10.1016/j.eswa.2014.01.031
36. Yin S, Ding SX, Haghani A, Hao H, Zhang P. A Comparison Study of Basic Data-Driven Fault Diagnosis and Process Monitoring Methods on the Benchmark tennessee Eastman Process. J Process Control (2012) 22:1567–81. doi:10.1016/j.jprocont.2012.06.009
37. Wang X, Qi L, Chen C, Tang J, Jiang M. Grey System Theory Based Prediction for Topic Trend on Internet. Eng Appl Artif Intell (2014) 29:191–200. doi:10.1016/j.engappai.2013.12.005
38. Yang G, Wu X. Fault Prediction of Ship Machinery Based on Grey Neural Network Model. In: 2007 IEEE International Conference on Control and Automation (IEEE) (2007). 1063–6.
39. Kuo Y, Yang T, Huang GW. The Use of Grey Relational Analysis in Solving Multiple Attribute Decision-Making Problems. Comput Industrial Eng (2008) 55:80–93. doi:10.1016/j.cie.2007.12.002
40. Li H, Wang L, Bu Z, Cao J, Shi Y. Measuring the Network Vulnerability Based on Markov Criticality. ACM Trans Knowl Discov Data (TKDD) (2021) 16:1–24. doi:10.1145/3464390
Keywords: watercraft equipment, fault prediction, grey relational analysis, healthy degree model, predictive maintenance
Citation: Feng S, Chen Z, Guan Q, Yue J and Xia C (2022) Grey Relational Analysis-Based Fault Prediction for Watercraft Equipment. Front. Phys. 10:885768. doi: 10.3389/fphy.2022.885768
Received: 28 February 2022; Accepted: 15 April 2022;
Published: 25 May 2022.
Edited by:
Xiaojie Chen, University of Electronic Science and Technology of China, ChinaReviewed by:
Huijia Li, Beijing University of Posts and Telecommunications (BUPT), ChinaSong Cheng, Hefei University of Technology, China
Copyright © 2022 Feng, Chen, Guan, Yue and Xia. This is an open-access article distributed under the terms of the Creative Commons Attribution License (CC BY). The use, distribution or reproduction in other forums is permitted, provided the original author(s) and the copyright owner(s) are credited and that the original publication in this journal is cited, in accordance with accepted academic practice. No use, distribution or reproduction is permitted which does not comply with these terms.
*Correspondence: Chengyi Xia, eGlhbG9va2luZ0AxNjMuY29t
 Shasha Feng
 Zijian Chen1
 Chengyi Xia