 Elizabeth G. Kelley
 Emily E. Blick
 Vivek M. Prabhu
 Paul D. Butler1,3,4
 Michihiro Nagao
94% of researchers rate our articles as excellent or good
Learn more about the work of our research integrity team to safeguard the quality of each article we publish.
Find out more
ORIGINAL RESEARCH article
Front. Phys., 14 April 2022
Sec. Soft Matter Physics
Volume 10 - 2022 | https://doi.org/10.3389/fphy.2022.866024
This article is part of the Research TopicWomen in Science: PhysicsView all 8 articles
Lipid vesicles are widely used as models for cell membranes, hosts for membrane protein studies, and containers for hydrophilic molecules. The vesicle solutions in these applications are usually prepared at a specific lipid concentration; however, because vesicles are solvent-filled structures, the corresponding volume fraction of vesicles is at least a factor of three times higher than the corresponding lipid volume fraction and critically depends on the vesicle radii. Here we show that these higher than may be expected vesicle volume fractions result in measurable interactions between the vesicles as well as affect the vesicle diffusion. We show that vesicle solutions prepared with lipid mass fractions, mL, as low as ≈ 0.004, which correspond to a lipid concentration of ≈ 4 mg/mL or 5 mmol/L (mM), not only have a measurable apparent structure factor (S′(q)) in small angle neutron scattering (SANS) experiments, but that this repulsive structure factor also affects the measured diffusion coefficient at small scattering vectors (q) such as those probed with dynamic light scattering (DLS). The measured diffusion coefficients are further affected by indirect solvent mediated interactions described by a hydrodynamic factor (H(q)). Accounting for the concentration-dependence of the vesicle diffusion shows that the lipid concentration dependence measured in neutron spin echo (NSE) spectroscopy is due to differences in the effective vesicle diffusion coefficients and not the membrane fluctuation dynamics. The results have practical implications for static and dynamic scattering experiments as well as provide interesting insights into the interactions between soft lipid vesicles.
Lipid vesicles have many uses. They are used as model systems for biomembranes [1]; [2], environments to reconstitute and study membrane proteins [3]; [4], small volume chemical reactors [5]; [6], as well as containers for hydrophilic guest molecules in personal care products [7], drug delivery vehicles [8], and vaccines [9]. In almost all these applications, the vesicle solutions are formulated at a specific lipid mass concentration to either optimize the signal to noise ratio in experimental studies of their properties or to ensure sufficient concentrations of the encapsulated cargoes. However, the lipids only form a thin shell layer around a large, solvent-filled, core, and the corresponding vesicle volume fraction is much higher because ϕV = ϕL + ϕinternal where ϕL is the volume fraction of the lipids that form the shell and ϕinternal is effective volume fraction of the solvent filled cores. As such, the corresponding vesicle volume fraction depends on the vesicle radius and can be anywhere from 2 to 10 times higher then the corresponding lipid volume fraction for standard vesicle sizes created by extruding lipid solutions [10]; [11].
Because most of the volume of lipid vesicles is actually composed of solvent, seemingly low lipid concentrations correspond to significantly higher vesicle volume fractions and closer face-to-face distances between their surfaces than may be expected. These high volume fractions can lead to both direct and indirect solvent mediated hydrodynamic interactions between the particles, as also seen in concentrated colloid [12, 13], micelle [14], and protein solutions [15]; [16]. However, because the lipid membrane shell is soft and undergoes thermal fluctuations, lipid vesicles may have additional repulsive interactions not seen in typical “hard” colloidal systems. In addition to the excluded volume and electrostatic repulsive interactions considered in hard colloidal particle systems, lipid vesicles may also have a hydration repulsion seen at very short distances between membranes, such as seen in multilamellar stacks at low hydration levels and close interlamellar repeat distances [17]; [18], as well as undulation repulsion interactions at relatively long distances that are essential for stabilizing membrane stacks [19]. Importantly, the undulation repulsion force is relatively long range, and direct inter-vesicle interactions may be apparent at lower volume fractions than expected for hard sphere systems. Lipid vesicles are also deformable, which could further affect their interactions at high vesicle volume fractions. As such, it is both fundamentally interesting and practically important to consider the effects of such interactions on the properties of concentrated lipid vesicle solutions.
Here we study the interactions between vesicles as well as the effects of these interactions on the vesicle diffusion and membrane fluctuations in concentrated lipid vesicle solutions prepared with the well-characterized lipid, 1-stearoyl-2-oleoyl-sn-glycero-3-phosphocholine (18:0–18:1 PC, SOPC). We study the direct interactions in concentrated vesicle solutions with small angle neutron scattering (SANS) and show that there are measurable interactions at vesicle volume fractions, ϕV ≈ 0.02, which corresponds to a seemingly low lipid mass fraction, mL ≈ 0.004 or cL ≈ 4 mg/mL. These direct interactions affect the vesicle diffusion measured at large length scales, such as the length scales accessed with dynamic light scattering (DLS), a technique commonly used to determine the size and size distribution of lipid vesicle preparations. The measured vesicle diffusion constants are further affected by indirect hydrodynamic interactions. While these direct and indirect interactions affect the vesicle diffusion, they do not affect the membrane fluctuation dynamics measured at smaller length scales and faster time scales with neutron spin echo (NSE) spectroscopy over a wide range of ϕV that spanned more than two orders of magnitude in lipid concentration. Together, the results of the combined structural and dynamical scattering methods have important implications for extracting reliable information about the lipid vesicle population from different characterization techniques as well as practical implications for designing efficient scattering experiments.
1-stearoyl-2-oleoyl-sn-glycero-3-phosphocholine (18:0–18:1 PC, SOPC) was purchased from Avanti Polar Lipids. Deuterium Oxide (D2O, 99.9% D) was purchased from Cambridge Isotopes. All materials were used without further purification.
Unilamellar vesicles were prepared by extrusion following protocols in literature [11]. The dry lipid powder was dispersed in D2O at a concentration of ≈ 110 mg lipid per mL of D2O, which corresponded to a lipid weight faction of mL ≈ 0.09, and the lipid was hydrated at room temperature to form a suspension of multilamellar vesicles. The multilamellar vesicle solution was subjected to four freeze-thaw cycles and then extruded sequentially through 400 nm (15 ×), 200 nm (15 ×), 100 nm (15 ×), and 50 nm (41 ×) filters at ≥ 30°C. All samples were prepared by diluting the concentrated unilamellar vesicle stock solution with D2O.
SANS measurements were performed at the NIST Center for Neutron Research (NCNR) on the very small-angle (vSANS) instrument [20]. Measurements were performed with neutron wavelengths (λ) of 0.6 or 1.1 nm with a wavelength distribution (Δλ/λ) of 0.12. The front and middle detector carriages were positioned at 1 and 5 m or 4.5 and 18.5 m, for the 0.6 and 1.1 nm wavelength configurations, respectively, giving access to a combined q-range of 0.01 nm−1 < q < 4 nm−1, where q is the magnitude of the scattering vector and is defined as q = 4π/λ sin(θ/2) with scattering angle, θ. Data were collected at 30.0 ± 0.2°C. SANS data were reduced using the macros provided by NIST [21] and analysed with the vesicle form factor model in SasView [22].
For homogeneous, monodisperse particles, the measured intensity is given by
In which ϕ is the volume fraction of particles, Δρ is the difference in the neutron scattering length density (ρ) between the particle and the surrounding medium, V is the particle volume, P(q) is the form factor that describes the shape of the particles and S(q) is the structure factor that describes the interactions between the particles. At infinite dilution, S(q) → 1, so that I(q) = ϕΔρ2VP(q).
Importantly, S(q) as described in Eq. 1 is only strictly true for homogeneous, monodisperse, spherical particles with isotropic interactions. Estimating the apparent structure factor for particle systems with elongated or anisoptropic shapes, anisotropic interactions, or large polydispersities requires using a static decoupling approximation as discussed in several works in literature [23–26]. For the polydisperse vesicles studied here, the measured intensity is more accurately described in terms of an apparent structure factor, S′(q), such that
Assuming that the particle form factor is not a function of the concentration (i.e. the particle shape is not changing), the only thing that will change with ϕ is S′(q) and,
Where ϕ0 corresponds to a particle volume fraction low enough that the interactions between particles are negligible (i.e. S′(q) → 1). Accordingly, S′(q) can be estimated from the measured scattering intensity as
There are a few additional caveats about Eq. 4. The first is that the expression assumes that the flat incoherent background has been subtracted from the measured data. While the subtraction is not strictly necessary for comparing the data at low q, the incoherent background will vary with particle concentration, and the scaled data will not overlap at high q if the incoherent background is not subtracted from measured intensity. Eq. 4 also assumes that the particle form factor does not change with concentration, which is not necessarily true for all self-assembled systems. For example, SANS studies of microemulsions showed that the droplets became more monodisperse with increasing concentration, and the structure factor was extracted from the data by varying the scattering length density contrast (Δρ) at constant ϕ using the relative form factor method [27]; [28].
Dynamic laser light scattering measurements were performed with an LS Instruments AG (Fribourg, Switzerland) 3D cross-correlation laser light scattering system. A 500 mW Cobolt solid state laser provided 532 nm wavelength light (λo) used under Vv polarization conditions. The scattered intensity (I) was detected as a function of angle (θ) from 20.0° to 140.0° in steps of 10° via a precision goniometer by two optical fiber-coupled avalanche photodiodes under 2D pseudo-cross correlation mode. Measurements were performed with samples in cleaned, dust-free and capped glass cylindrical cells placed in a refractive index-matching vat of decalin that was thermostatically controlled to 30.00°C ± 0.01°C with an external recirculating bath.
For vesicle volume fractions up to ϕV = 0.15, the measured normalized intensity-intensity time correlation functions (g(2)(q, t) − 1) were well fit by a single exponential with decay rate, Γ, according to
Where A is the amplitude. The corresponding effective diffusion coefficients, Deff, were calculated according to Deff = Γq2, where for DLS, q = 4πn/λo sin(θ/2) in which n is the refractive index of the solution and assumed to be equal to that of the D2O solvent, n = 1.3282.
For dilute concentrations with no measurable interactions between vesicles, ϕV ≤ 0.016 where S′(q) = 1, the translational diffusion coefficients, D, were calculated from the slopes of plots of Γ vs q2. The diffusion coefficient at infinite dilution, D0, was then calculated by extrapolating the measured D values to a concentration of zero using a virial expansion,
Where k is a constant [29].
The corresponding hydrodynamic radius (RH) was calculated from D0 according to the Stokes-Einstein relation,
Where η is the known solvent viscosity, kB is the Boltzmann constant, and T is temperature.
For the highest concentration vesicle solution, ϕV = 0.28, the measured correlation functions did not follow a single exponential decay. These data were fit using a combination of two exponential decay processes,
Where Afast and Aslow are the amplitudes of fast and slow modes, and Γfast and Γslow are their relaxation rates. The fast decay process was attributed to the effective diffusion coefficient of the vesicles, Deff = Γfastq2.
In concentrated solutions at the short time limit, the diffusion of one particle is influenced by the presence of its neighbors by both direct and indirect interactions. These effects are described as,
Where D0 is the diffusion coefficient at infinite dilution, S′(q) is the apparent static structure factor measured by a technique like SANS and accounts for the direct interactions between particles, and H(q) is the hydrodynamic factor that accounts for the indirect solvent mediated interactions between particles [12].
There also are two diffusion processes to consider that depend on the length scale probed with the measurement technique relative to the size of the particles. At low q values (large length scales) relative to the size of the particles, the measured diffusion coefficient describes the relaxation of a concentration gradient, or the collective diffusion coefficient (Dc). At high q values (small length scales) relative to the size of the particles, the measured diffusion coefficient describes the trajectory of a single tracer particle among the other particles and is called the self diffusion coefficient (Ds).
Assuming the vesicles arrange on a BCC lattice, the q value characteristic of the particle spacing can be related to the particle volume fraction according to Bragg’s law, where
NSE measurements were performed on the NGA NSE Instrument at the NCNR using λ of 0.8 or 1.1 nm with Δλ/λ ≈ 0.2 to access a q-range of 0.4 nm−1 < q < 1.1 nm−1 and Fourier times (t) from 0.01 to 100 ns [33]. The temperature was controlled at 30.0°C within 0.5°C with a recirculating bath during the measurements. The data were corrected for the instrument resolution by measuring the elastic scattering from a carbon resolution standard as well as the contributions from the D2O solvent background to give the normalized intermediate scattering function (I(q,t)/I(q,0)) using the DAVE software package [34].
For unilamellar lipid vesicle solutions, the intermediate scattering function measured with NSE can contain contributions from both the vesicle diffusion and the collective membrane motions, depending on the vesicle size and the dynamic range measured during the NSE experiment. Assuming that the dynamic contributions from the vesicle diffusion and membrane fluctuations are independent (i.e the vesicle diffusion does not depend on the rate at which the membrane is fluctuating and vice versa), then their contributions to the intermediate scattering function are multiplicative,
Where Imeasured(q,t) is the intermediate scattering function measured for a lipid vesicle solution and Idiffusion(q,t) and Ifluctuations(q,t) are the contributions from the vesicle diffusion and membrane fluctuations, respectively.
Note that polydispersity can also affect the measured intermediate scattering function, Imeasured(q,t), and a dynamic decoupling approximation may be needed to interpret NSE data, particularly when S′(q) ≠ 1 in the q ranged probed with NSE [26]. However, becuase NSE measures dynamics at short length scales where q ≫ qm, S′(q) = 1 in the NSE q range studied here, and we do not need to use a decoupling approximation to interpret these NSE data from lipid vesicle solutions.
Also, because NSE measures dynamic processes at short time scales and small length scales where q ≫ qm, we assume that the vesicle diffusion is described by the self diffusion coefficient, Ds. At these short length scales and high q values, S′(q) → 1; however, the hydrodynamic interactions still affect the self diffusion coefficient, Ds(q). The hydrodynamic effects in the limit that q → ∞ are well characterized in hard sphere systems where it has been shown that
Where Eq. 11 has been shown to be accurate for ϕ ≤ 0.3, and Ds/D0 is not expected to deviate significantly from Eq. 11 for the range of vesicle volume fractions studied here. [31]; [35].
Given that the q values measured with NSE are an order of magnitude larger than the calculated qm, we assume that the conditions of q → ∞ are met and Ds can be estimated by Eq. 11 so that Idiffusion(q,t) simplifies to
Where Ds was calculated from Eq. 11 using the experimentally determined D0 value and the corresponding ϕV values listed in Table 1.
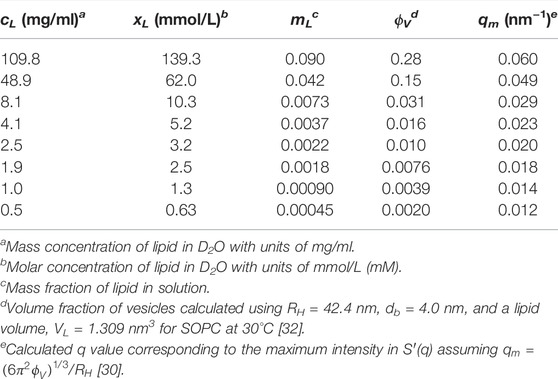
TABLE 1. Summary of lipid concentrations and corresponding vesicle volume fractions in the studied solutions.
Most NSE experiments are sensitive to the collective height fluctuations normal to the plane of the membrane, i.e. bending fluctuations at a constant membrane thickness [36]; [37]. Specific sample geometries and/or deuteration schemes also can be used to study other dynamic modes with NSE such as in-plane dynamics [38], collective thickness fluctuations [39], and the lipid acyl tail dynamics [40]. Importantly, these fluctuations are equilibrium processes, a direct consequence of lipid membranes being soft, and are therefore controlled by the physical properties of the bilayer and surrounding solvent. For bending fluctuations, the measured Ifluctuations(q, t) should be due to relaxation of the collective height fluctuations with a characteristic relaxation rate that is a balance between the ease of bending the lipid membrane (i.e. the membrane stiffness) and the time needed for the associated membrane deformation to relax (i.e. the dissipation).
The seminal work by Helfrich describes thermal bending fluctuations by treating the membrane as a thin, strucutureless sheet [19]. For a tensionless membrane, this treatment predicts that the membrane fluctuations are hydrodynamically damped with a relaxation rate determined by balance of the membrane bending modulus (κ) and the viscosity of the surrounding solvent (η). Zilman and Granek incorporated the dynamic height correlation function predicted by the Helfrich model into the dynamic structure factor and showed that,
Where the characteristic relaxation rate, ΓZG, is given by
And γk ≈ 1 for κ ≫ kBT as expected for most phospholipid membranes [41,42].
The work by Zilman and Granek predicted two important scaling relationships for the membrane dynamics measured at length scales greater than the bilayer thickness and less than the characteristic size scale of the higher order membrane structure (ξ), which corresponds to the vesicle radius for unilamellar vesicles. The first is that the intermediate scattering function decays as a stretched exponential with a stretching exponent of 2/3 (Eq. 13), and the second is that the corresponding relaxation rate, ΓZG, scales with q3 (Eq. 14). Both predicted scaling relationships were confirmed experimentally in early NSE studies of lipid membranes [43]; [44]; however, the extracted values of κ were an order of magnitude larger than those measured with other established characterization techniques.
Watson and Brown suggested that NSE measures the effective bending modulus,
Where the effective bending modulus,
The NSE data presented here were fit considering contributions from both the vesicle diffusion and the membrane fluctuations following the Zilman-Granek treatment,
Where Ds was calculated using Eq. 11, and ΓZG was the only fit parameter. Eq. 16 assumes that the amplitude of the undulation motions is 1. While other works also include a q-dependent relative amplitude of the undulation motion [49], this additional term affects the absolute value of ΓZG, and consequently the absolute value
All presented data were collected on samples made by diluting the same concentrated stock solution of SOPC unilamellar vesicles. The lipid concentration in the most dilute sample, mL = 0.00045, corresponded to a concentration of ≈ 0.6 mmol/L (mM) and was at least five order of magnitude higher than the critical micelle concentration (CMC) of lipids with at least 16 carbons in the acyl tail which is on the order of 10–6 mM or lower [50]. Given that the studied lipid concentrations were well above the CMC and that lipid exchange rates are very slow, we assumed that the lipid vesicle structures were stable upon dilution and any differences in the SANS, DLS, and NSE data were attributed to concentration effects, and not structural differences, in the vesicle solutions.
SANS is most often used to extract detailed information on the structure of the lipid membrane [37]. This information is contained in the data at short length scales at high q values, while the data at larger length scales and smaller q values contain information about the vesicle size and polydispersity as well as the direct interactions between vesicles. Shown in Figure 1 are SANS data measured for a dilution series of unilamellar SOPC vesicles. The inset in Figure 1A shows the data for the lowest measured lipid concentration, mL = 0.0018, which corresponded to a vesicle volume fraction of ϕV = 0.0076, fit with a form factor for unilamellar vesicles. The form factor fits the data well over the entire measured q-range, supporting that there was not a measurable structure factor in the data at this low lipid concentration. The fit results gave a bilayer thickness of db ≈ 4 nm and a number-averaged vesicle radius of Rn ≈ 31 nm with polydispersity, σR = 0.34 as summarized in Table 2.
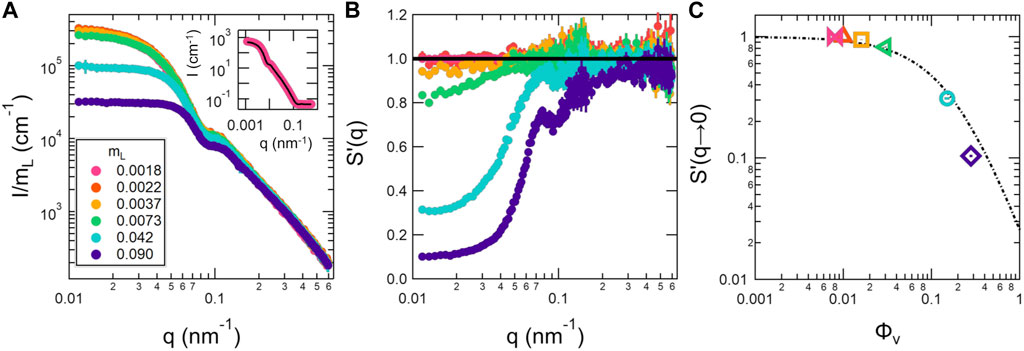
FIGURE 1. Normalized SANS data (A), corresponding apparent structure factors S′(q) (B), and extrapolated S′(q → 0) (C) for a concentration series of SOPC unilamellar vesicles. The SANS data in (A) were normalized by the corresponding lipid mass fraction, mL. The inset shows the measured intensity over the entire q range for the lowest lipid volume fraction, mL = 0.0018, which corresponds to ϕV = 0.0076, (points) and fits to a vesicle form factor (solid line). The apparent structure factors in (B) were calculated by dividing out the measured intensity for the mL = 0.0018 sample following Eq. 4. The S′(q → 0) were determined by extrapolating the apparent structure factors in (B) to q = 0 nm −1 (points) and are plotted versus the vesicle volume fraction (ϕV) calculated based on the RH value listed in Table 2. The dotted line in (C) corresponds to analytic expression for S(0) in monodisperse hard sphere systems [51]; [52]. Error bars represent one standard deviation and in some cases are smaller than the symbols.
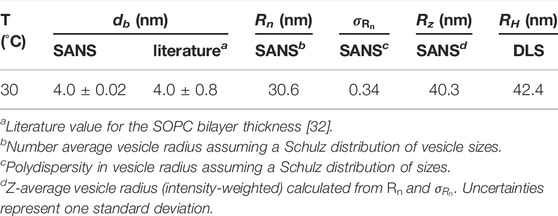
TABLE 2. Summary of lipid vesicle characterization results from SANS and DLS.
The SANS data plotted in Figure 1A were normalized by mL. The normalized intensities overlapped in all samples at q ≳ 0.2 nm−1 but systematically decreased at q ≲ 0.1 nm−1 with increasing concentration for mL ≥ 0.0041, a hallmark of a repulsive structure factor in scattering data.
Assuming that the vesicle form factor did not change upon dilution, the apparent structure factors, S′(q), were calculated by dividing the normalized intensity for the different samples with the normalized intensity measured for the most dilute sample, mL = 0.0018, following Eq. 4. The calculated apparent structure factors are plotted in Figure 1B, where the solid line corresponds to S′(q) = 1, the value expected if the inter-vesicle interactions were negligible. The apparent structure factors deviated from 1 at low q in the SANS data measured for solutions with lipid mass fractions as low as mL = 0.0041, which corresponded to ϕV = 0.016, and the values of S′(q → 0) further decreased with increasing concentration.
The value of S′(q → 0) is considered the thermodynamic limit and directly related to the isothermal osmotic compressibilty of the solution,
Where Π is the osmotic pressure and
DLS is a bench top characterization technique widely used to determine the size of extruded vesicles; however, DLS does not directly measure the size of the particles in solution, but rather their diffusion. The raw data are intensity-intensity correlation functions that decay due to motions of the particles with a relaxation rate, Γ. Shown in Figure 2A are the relaxation rates, Γ, extracted from single exponential fits to the measured intensity-intensity correlation functions plotted versus q2 for dilute SOPC vesicle solutions. The data for ϕV ≤ 0.0076 (mL ≤ 0.0018) followed the expected q2 scaling for simple diffusion, while the data for ϕV = 0.016 (mL = 0.0037) deviated from the expected scaling, particularly at high q. The corresponding diffusion coefficients, D, extracted from the best fits to Γ = Dq2 are plotted versus ϕV in Figure 2B.
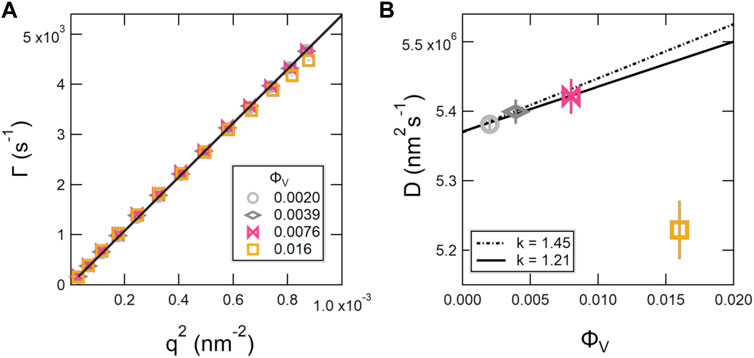
FIGURE 2. Decay constants, Γ extracted from single exponential fits to the DLS correlation functions plotted versus q2 (A) and corresponding diffusion coefficients, D (B) for dilute SOPC lipid vesicle solutions. The solid line in (A) is a representative linear fit to Γ = Dq2 to determine the D values plotted in (B). The lines in (B) correspond to fits with a virial expansion following Eq. 6 to determine diffusion coefficient at infinite dilution, D0, where the solid line is the best fit to the data and the dashed line is the fit with the scaling constant reported for hard spheres, k = 1.45 [29]. The error bars represent one standard deviation and in some cases are smaller than the symbols.
The data for ϕV ≤ 0.0076 in Figure 2B were fit with Eq. 6 to determine the diffusion coefficient at infinite dilutions, D0. The best fit to the data is shown as the solid line in Figure 2B and gave values of D0 = 5.37 × 10⁶ nm2s−1 and k = 1.21. The corresponding RH value calculated from D0 was 42.4 nm, where RH is an intensity-weighted or Z-averaged radius, such that the larger particles are weighted more heavily. Comparing the RH with Rz calculated from the Schulz distribution of vesicle sizes extracted from the SANS data analysis showed that the values were in good agreement (Table 2). Also note that the best fit value of k = 1.21 was slightly lower than value reported for hard sphere solutions where k = 1.45 for collective diffusion [29], and the corresponding predictions for hard spheres are shown as the dotted line in Figure 2B.
The intensity-intensity correlation functions deviated from a single exponential decay at the highest vesicle volume fraction, ϕV = 0.28, and were better fit by a sum of two exponential decays given by Eq. 8. The normalized correlation functions for ϕV = 0.0039 and 0.28 are compared in Figure 3. A second slower mode was seen at longer times in the data for ϕV = 0.28 that was not captured by a single exponential decay (Figure 3 inset).
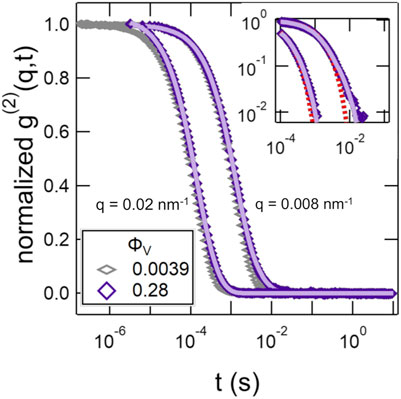
FIGURE 3. Normalized intensity-intensity correlation functions, g(2)(q, t) at two representative q values for SOPC vesicle solutions with lipid mass fractions of ϕV = 0.0039 and 0.28. The solid lines are the fits to the data at ϕV = 0.28 with a double exponential decay using Eq. 8. The inset is the data for ϕV = 0.28 plotted on a log-log scale and compares the fits with a single (dotted line) and double exponential (solid line) decay.
The short time diffusion of the vesicles also was affected by the inter-vesicle interactions at high ϕV. Shown in Figure 4 are plots of D0 normalized by the effective diffusion coefficients, Deff(q) from the DLS measurements and the apparent structure factors determined from the SANS measurements in the previous section. The data showed that even at a vesicle volume fraction of ϕV = 0.016, which corresponded to mL ≈ 0.0037, there were measurable effects of the solvent-mediated, indirect vesicle interactions on the DLS data. These indirect solvent mediated interactions are described by the hydrodynamic factor, H(q). The corresponding H(q) were calculated from the combined SANS and DLS data as H(q) = S′(q)Deff/D0 for the different volume fractions and also are plotted for the different lipid concentrations in Figure 4.
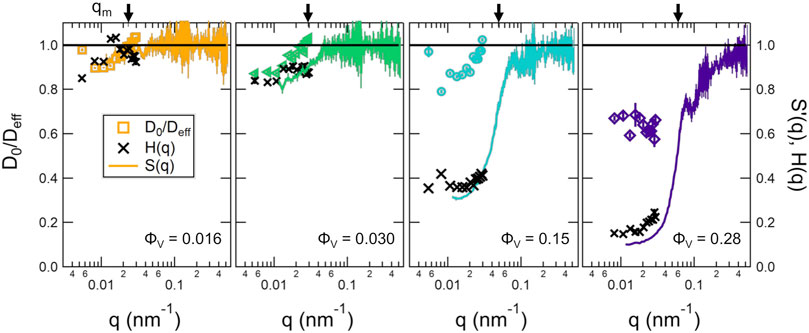
FIGURE 4. D0/Deff determined from DLS measurements, S′(q) determined from SANS measurements, and extracted H(q) values from the combined DLS and SANS results calculated as H(q) = S′(q)Deff/D0 for different volume fractions of vesicles (ϕV) listed on the plots. The vertical arrow on the upper x-axis show the corresponding qm values given in Table 1. The open symbols are the D0/Deff values from DLS, the solid lines are the S′(q) extracted from the SANS data, and the crosses are the calculated H(q). Error bars represent one standard deviation and in some cases are smaller than the symbols.
The DLS data measured at the largest length scales corresponded to q values that were approximately an order of magnitude lower than qm for lipid vesicles, which should correspond to the collective diffusion of the vesicles given by Dc. While there are only a few studies that have measured H(q) for soft lipid vesicles [30]; [53], these effects on the collective diffusion of hard colloidal particles are well studied. Work by Chichocki et al. calculated H(q) for hard spheres considering three-particle interactions and showed that in the limit of q = 0, [54]; [31].
The extrapolated values of H(q → 0) for the lipid vesicle solutions and the calculated values for hard spheres following Eq. 18 are compared in Figure 5. The measured H(q) for the soft vesicles solutions agreed well with the predictions for hard sphere solutions at low volume fractions, but began to deviate for ϕV ≳ 0.15.
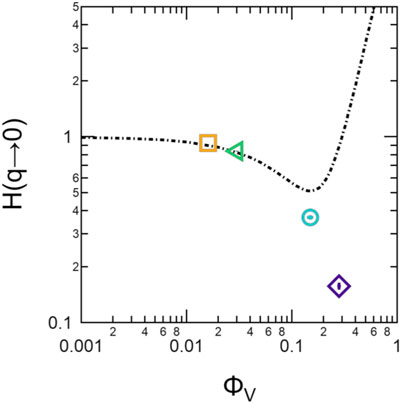
FIGURE 5. Extrapolated H(q → 0) values for the lipid vesicle solutions (points) compared to the hard sphere behavior described by Eq. 18 (dotted line). Error bars represent one standard deviation.
Unilamellar vesicle solutions are often used as model systems for the study of membrane fluctuations on the nanometer lengths scales and nanosecond time scales using neutron spin echo spectroscopy. The contrast between protiated lipids and the deuterated surrounding solvent makes most NSE experiments sensitive to the thermal motions normal to the plane of the bilayer. The relaxation times of these collective height fluctuations, which are also referred to as bending fluctuations, are related to the effective membrane rigidity,
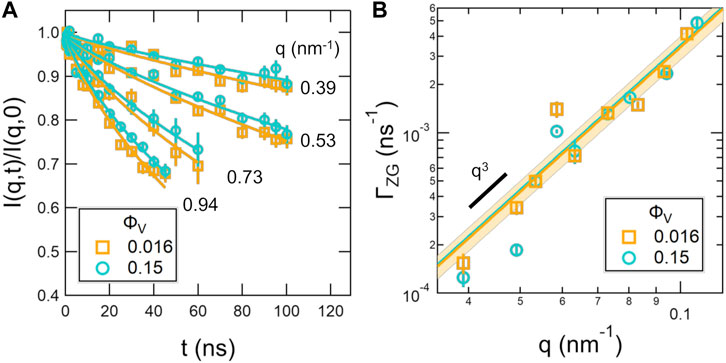
FIGURE 6. Normalized intermediate scattering functions, I(q, t)/I(q, 0) (A) and extracted relaxation rates for the membrane height fluctuations, ΓZG (B) measured for the vesicle solutions with ϕV that vary by an order of magnitude, ϕV = 0.016 and 0.15. The points in (A) are the measured data and the solid lines are the fits according to Eq. 16 where Ds was calculated according to Eq. 11 using the experimentally determined D0 value. Error bars on the data points represent one standard deviation. The solid lines in (B) are the fits, and the shaded regions are the 95% confidence intervals on the fits to Eq. 15.
However, the slower dynamics were due to slower self diffusion of the lipid vesicles in the more concentrated sample, not an increase in membrane rigidity. The NSE data were fit assuming that Ds of the lipid vesicles could be estimated with Eq. 11 for hard spheres using the experimentally determined D0 value. The corresponding fits to the NSE data considering both the vesicle diffusion and the membrane fluctuations described by the Zilman-Granek formalism (Eq. 16) are shown as the solid lines in Figure 6A. The extracted relaxation rates for the membrane fluctuations, ΓZG, and their fits to a q3 scaling are shown in Figure 6B. The 95% confidence intervals on the fits to the ΓZG values at the two concentrations overlapped as well as the corresponding values of
The results showed that the membrane fluctuation dynamics were not affected over the wide concentration range studied here. The slopes of the fit to ΓZG vs q3 curves, which are proportional to
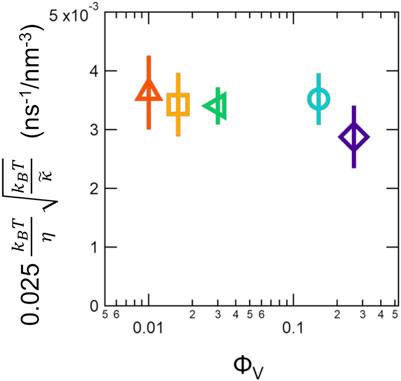
FIGURE 7. Best fit slopes to plots of ΓZG versus q3, which is inversely proportional to the effective bending modulus
The combination of scattering methods used here clearly shows that there are both direct and indirect interactions between lipid vesicles in concentrated solutions. Understanding the effects of these interactions has practical implications for designing efficient scattering experiments as well as extracting reliable information on the vesicle structure and dynamics from the resulting data. Studying these interactions also presents new opportunities for understanding the stability of lipid assemblies in solution as well as using liposomes as models of soft colloids. The practical and potential implications of the presented results are discussed in more detail below.
The solutions studied here contained unilamellar vesicles that were prepared by extruding a concentrated SOPC solution through a filter with a nominal pore size of 50 nm. The SANS data measured for these solutions showed evidence of repulsive interactions between the vesicles at vesicle volume fractions as low as ϕV ≈ 0.016, which corresponded to a lipid mass fraction of mL ≈ 0.004 or xL ≈ 5 mM for the vesicles ≈ 80 nm in diameter studied here. Such interactions would appear at even lower lipid mass concentrations in solutions containing larger vesicles, as the volume fraction of the internal solvent core scales with the vesicle radius cubed, R3.
Neglecting to properly account for the presence of interactions between vesicles and the associated structure factor, and only fitting small angle scattering data with a form factor, can impact the reliability of the extracted fit results. The peak in a structure factor often occurs at or near the same q value as the features in the form factor attributed to the vesicle size and size distribution, and as a result, likely can affect the fit values for the vesicle radius and corresponding polydisperisty [55]. Not accounting for S(q) could also affect the fit results for the scattering length density contrast (Δρ in Eq. 1), which is particularly important in studies aimed at extracting information about the composition of the bilayer, such as structural asymmetry or the location of incorporated peptides or small molecules, where the relevant information is contained in changes in Δρ. In the dilute limit where S′(q) = 1, as q → 0, I(q → 0) - B = I0 = ϕ(Δρ)2V, where B is the incoherent background. As shown in Figure 1, S′(q) impacts the scattered intensity at low q, and therefore, fitting low q data with only a form factor will often underestimate the true I0 in vesicle solutions with repulsive interactions.
At high enough q-values relative to the overall vesicle radii, qR ≫ 1, the measured SANS data overlapped, and the S′(q) correction was not needed to extract information regarding the bilayer thickness. It is important to note that “high” q will be relative to the radius of the vesicles. Recent work has shown that vesicle prepared by extrusion though a 100 nm filter often are not unilamellar [11], and using smaller filter pore sizes is one way to ensure that the vesicle solution does not contain a small population of multilamellar vesicles that can affect the interpretation of scattering data at high q. However, as R decreases, the absolute value of q corresponding to qR ≫ 1 will increase. Another approach to ensuring that vesicles are unilamellar is to incorporate a small amount of charged lipid [11]. Incorporating charged lipids, particularly in unbuffered solutions, will further increase the repulsive interactions between vesicles and result in an even more pronounced structure factor in the data. To ensure that the q-range of interest needed to extract information about the bilayer structure is not affected by contributions from S′(q), it is good practice to measure one or two dilutions of a sample to ensure that the data overlap.
In addition to the direct interactions measured with SANS, the indirect hydrodynamic interactions also affect the vesicle diffusion coefficient measured with DLS. The data in Figure 4 show that the diffusion coefficients measured with DLS were affected by the structure factor seen in the SANS data as well as the solvent-mediated hydrodynamic interactions. Because D is directly used to calculate RH (Eq. 7), not accounting for the potential effects of the direct and indirect interactions on the vesicle diffusion will directly impact the vesicle sizes estimated with DLS. It is also important to keep in mind that DLS data are highly sensitive to multiple scattering, especially for visually turbid solutions such as those at high lipid concentrations, which can also affect the reliability of the extracted information about the samples. Here the data were collected on an light scattering instrument specifically designed to correct for the effects of multiple scattering, but in general, DLS data collected on dilute samples (ϕV ≲ 0.1% by volume) are more reliable. Like with SANS experiments, collecting DLS data for a dilution series ensures that the measured correlation functions and estimated diffusion coefficients are not changing significantly with concentration and improves the reliability of the results.
At the highest vesicle volume fraction, ϕV ≈ 0.3, the measured DLS data also did not follow a single exponential decay as shown in Figure 3. It is important to keep in mind that DLS measures the diffusion of particles in solution, and that the presence of two decay modes reflects two populations of diffusive processes in this case and not the presence of two vesicle size populations. Previous work by Pusey et al. showed that DLS data measured for even modestly polydisperse particles with a size distribution as small as σ ≈ 0.1 contained two independent modes with well separated decay times at high volume fractions [56]. The fast mode described the collective diffusion of the particles given by Dc and discussed above, while the second slower mode was attributed to the local position exchanges of particles with different sizes. At even higher volume fractions, colloidal solutions are also known to undergo caged diffusion, where the slow mode is associated with the time required for the cages formed by neighboring particles to break apart [13]; [57]. Similar behavior was also seen in concentrated lipid vesicle solution studied by Yu et al. in which they observed two distinct slow and fast populations with single-particle fluorescence tracking [58]. While diffusion in concentrated solutions of hard colloidal particles is well studied, fewer studies have looked at this phenomenon in soft, deformable colloids, and this dynamical heterogeneity may be important for understanding not only diffusion in complex environments but also the rheological properties of concentrated solutions of soft particles.
While the interactions between vesicles affected the diffusion dynamics at large length scales, or equivalently small q values, the membrane fluctuation dynamics at the nanometer length scale and high q values measured with NSE were not affected over the entire studied concentration range. While there was a lipid concentration dependence in the measured intermediate scattering functions, as seen in Figure 6A, the analysis presented here suggests that these differences in the measured dynamics were due to differences in the vesicle diffusion dynamics, not the membrane fluctuations dynamics.
However, even at the lower vesicle volume fractions, the values of
Another promising implication of these results is that NSE measurements can be performed on higher lipid concentration solutions without affecting the membrane fluctuation dynamics, so long as the vesicle diffusion is properly taken into account. The measured intensity, and therefore the required measurement time, is directly related to the lipid concentration in the sample. The data for the ϕV = 0.016 and 0.15 samples in Figure 6A required measurements times of ≈ 16 h and ≈ 6 h, respectively, yet the extracted values of ΓZG/q3 are the same within error. These results show that dilute, non-interacting samples are not necessarily needed for NSE measurements of membrane fluctuations. While the relevant lipid concentration and required NSE counting times will depend on the samples as well as the NSE instrument and instrument configurations used for the experiment, higher concentration samples in general will require shorter measurements times than more dilute samples, which would allow for efficient use of beam time at user facilities.
Systematically measuring and analyzing the structure factors in concentrated lipid solutions also presents new opportunities to probe the interactions in lipid membrane systems. There are several elegant experimental methods for measuring the interaction potential between two materials as a function of separation distance; however, these methods often require samples that are at least microns in size [63]. Measuring such interactions between things that are nanometers in size is more experimentally challenging. The results presented here for concentrated lipid vesicle solutions highlight the utility of small angle scattering methods for characterizing the interactions between nanometer-sized structures in solution. Future studies aimed at measuring and modeling S′(q) in concentrated lipid vesicle solutions could provide further insights into the interactions potentials between the liposomes as well as the membrane properties that affect these interactions.
Quite interestingly, the shapes of the calculated apparent structure factors for the lipid vesicles shown in Figure 1B did not show the characteristic features seen in structure factors for hard colloidal systems. The structure factors for such systems that are well described by a hard sphere or single Yukawa interaction potential typically show a pronounced maximum where S′(q) > 1 at qm that corresponds to the interparticle spacing. The calculated S′(q) for the lipid vesicles did not show a clear maximum, though we do note that there were peaks at q ≈ 0.08 nm−1 in the apparent structure factors for mL = 0.042 and 0.090, which corresponded to a length scale of 2π/q ≈ 80 nm, or approximately the hydrodynamic diameter of the particles. One possible explanation for the atypical shape of the calculated S′(q) curves is the high polydispersity in the vesicle sizes (
Because the shape of calculated S′(q) for the lipid vesicles did not match those expected for typical colloidal systems, we were not able to fit the data with a common model and instead chose to compare the extrapolated S′(q → 0) to predictions for hard spheres to gain additional insight into the strength of the repulsive interactions. The present data for S′(q → 0) in Figure 1C suggested that the interactions between lipid vesicles were more repulsive than hard spheres at high volume fractions. Previous measurements of S′(q) in unilamellar vesicle solutions have also noted deviations from hard sphere behavior [64]. The hard sphere structure factor only considers excluded volume interactions, i.e. two spheres can not occupy the same volume. The trends in apparent structure factors suggest that there are additional repulsive interactions in vesicle systems beyond what is predicted by hard sphere interactions. It is interesting to note that H(q) measured for the lipid vesicles followed the hard sphere predictions at ϕV ≲ 0.04, but also deviated at higher volume fractions. Previous studies by Haro-Pérez et al. of charged and uncharged liposome solutions have also shown that Deff/D0 deviates from hard sphere behavior at vesicle volume fractions on the order of 0.03 [30]; [53]. These deviations in H(q) may suggest that the additional repulsive interactions also affect hydrodynamic interactions at high q.
Unlike hard spheres, lipid vesicles are soft and can deform in shape which may affect their interactions at high ϕ. There are also two well-known repulsive interactions found between soft membranes but not colloidal particles: short range hydration repulsion and long range undulation repulsion [63]. The hydration repulsion at sub nanometer length scales prevents the membranes from sticking together [17]; [18], while the undulation repulsion is comparatively long range and arises from entropic confinement of two membranes when they are close together [19]. The strength of the undulation repulsion is therefore related to the membrane rigidity, κ, and the associated membrane fluctuations that are measured with NSE. The balance of these hydration and undulation repulsive forces with Van der Waals attraction is what determines the interlamellar spacing in multilamellar stacks. The undulation repulsion force is also responsible for the unbinding transition seen in multilamellar stacks at high temperatures [65–67] or in the presence of certain salts [68]; [69], and could also lead to increased repulsion between lipid vesicles at very high volume fractions and close face-to-face distances. While more much data at high ϕV are needed, measuring the effects of lipid composition, temperature, and ionic strength of the surrounding solvent would provide further insights into the repulsive forces underlying the interactions between vesicles.
When combined with other techniques, measuring S′(q) in lipid-based assemblies may provide additional insights into the physicochemical properties of the system. For example, we recently showed that the changes in S′(q → 0) measured with SANS and the membrane fluctuation dynamics measured with NSE showed the same temperature-dependent trends for charged lipid membranes, which were both due changes in the effective headgroup charge as the lipids melted [70]. Similarly, extending the q-range measured during small angle scattering measurements of lipid vesicles with added peptides, drugs, or other small molecules to lower q, would provide insights into how these additives not only affect the bilayer structure [37], but also the interactions between membranes.
Here we show how seemingly low lipid mass concentrations result in measurable interactions between vesicles because the majority of the vesicle volume is composed of the solvent core, and therefore, the corresponding vesicle volume fraction is several times higher than the lipid volume fraction used to prepare the solution. These interactions were seen in solutions of zwitterionic SOPC vesicles ≈ 80 nm in diameter at lipid mass concentrations as low as ≈ 5 mM, and the onset of interactions would shift to even lower lipid mass concentrations for larger vesicles or those containing charged headgroups. While such interactions would affect the reliability of the vesicle size estimates from SANS data as well as from the vesicle diffusion coefficients measured at low q values with DLS, the bilayer structure and fluctuation dynamics measured at high q were unaffected over a wide lipid concentration range. It is also interesting to note that the S′(0) and H(0) measured for the concentrated lipid vesicle solutions were in good agreement with the well-studied results for hard sphere solutions up to vesicle volume fractions of ϕV ≈ 0.15, but deviated at higher volume fractions, suggesting liposomes would be interesting model systems for studies of soft colloidal particles. We hope that the results presented here will help guide the design of more efficient experiments and enable more robust data analysis as well as open new avenues for understanding the interactions between lipid-based assemblies.
The datasets presented in this study can be found in online repositories. The names of the repository/repositories and accession number(s) can be found below: NCNR data repository at http://dx.doi.org/10.18434/T4201B and the NIST data repository at https://doi.org/10.18434/mds2-2567.
EK and EB prepared samples. EK, EB, VP, and MN performed experiments. EK, VP, PB, and MN discussed and analyzed data. All authors contributed to the writing and revisions of the manuscript.
Access to the vSANS and NGA NSE instruments was provided by the Center for High Resolution Neutron Scattering, a partnership between the National Institute of Standards and Technology and the National Science Foundation under Agreement No. DMR-2010792. This work benefited from the use of the SasView application, originally developed under NSF award DMR-0520547. SasView also contains code developed with funding from the European Union’s Horizon 2020 research and innovation programme under the SINE2020 project, grant agreement No 654000. Certain equipment, instruments or materials are identified in this paper in order to adequately specify the experimental details. Such identification does not imply recommendation by the National Institute of Standards and Technology nor does it imply the materials are necessarily the best available for the purpose.
The authors declare that the research was conducted in the absence of any commercial or financial relationships that could be construed as a potential conflict of interest.
All claims expressed in this article are solely those of the authors and do not necessarily represent those of their affiliated organizations, or those of the publisher, the editors and the reviewers. Any product that may be evaluated in this article, or claim that may be made by its manufacturer, is not guaranteed or endorsed by the publisher.
The authors gratefully thank Ingo Hoffmann, Yun Liu, and John Nagle for helpful suggestions and discussions.
1. Chan YHM, Boxer SG. Model Membrane Systems and Their Applications. Curr Opin Chem Biol (2007) 11:581–7. doi:10.1016/j.cbpa.2007.09.020
2. Mouritsen OG. Model Answers to Lipid Membrane Questions. Cold Spring Harbor Perspect Biol (2011) 3:a004622. doi:10.1101/cshperspect.a004622
3. Yao X, Fan X, Yan N. Cryo-EM Analysis of a Membrane Protein Embedded in the Liposome. Proc Natl Acad Sci U.S.A (2020) 117:18497–503. doi:10.1073/pnas.2009385117
4. Chadda R, Bernhardt N, Kelley EG, Teixeira SC, Griffith K, Gil-Ley A, et al. Membrane Transporter Dimerization Driven by Differential Lipid Solvation Energetics of Dissociated and Associated States. Elife (2021) 10:e63288. doi:10.7554/eLife.63288
5. Tsumoto K, Nomura SIM, Nakatani Y, Yoshikawa K. Giant Liposome as a Biochemical Reactor: Transcription of DNA and Transportation by Laser Tweezers. Langmuir (2001) 17:7225–8. doi:10.1021/la010887s
6. Kazakov S, Kaholek M, Teraoka I, Levon K. UV-induced Gelation on Nanometer Scale Using Liposome Reactor. Macromolecules (2002) 35:1911–20. doi:10.1021/ma011644+
7. Rosen M. Delivery System Handbook for Personal Care and Cosmetic Products: Technology, Applications and Formulations. Norwich, NY: William Andrew (2005).
8. Bulbake U, Doppalapudi S, Kommineni N, Khan W. Liposomal Formulations in Clinical Use: An Updated Review. Pharmaceutics (2017) 9:12. doi:10.3390/pharmaceutics9020012
9. Schwendener RA. Liposomes as Vaccine Delivery Systems: A Review of the Recent Advances. Ther Adv Vaccin (2014) 2:159–82. doi:10.1177/2051013614541440
10. Seth M, Ramachandran A, Leal LG. Dilution Technique to Determine the Hydrodynamic Volume Fraction of a Vesicle Suspension. Langmuir (2010) 26:15169–76. doi:10.1021/la1023086
11. Scott HL, Skinkle A, Kelley EG, Waxham MN, Levental I, Heberle FA. On the Mechanism of Bilayer Separation by Extrusion, or Why Your LUVs Are Not Really Unilamellar. Biophysical J (2019) 117:1381–6. doi:10.1016/j.bpj.2019.09.006
12. Nägele G. On the Dynamics and Structure of Charge-Stabilized Suspensions. Phys Rep (1996) 272:215–372. doi:10.1016/0370-1573(95)00078-x
13. Segrè PN, Pusey PN. Scaling of the Dynamic Scattering Function of Concentrated Colloidal Suspensions. Phys Rev Lett (1996) 77:771–4. doi:10.1103/physrevlett.77.771
14. Hayter JB, Penfold J. Self-consistent Structural and Dynamic Study of Concentrated Micelle Solutions. J Chem Soc Faraday Trans 1 (1981) 77:1851–63. doi:10.1039/f19817701851
15. Porcar L, Falus P, Chen WR, Faraone A, Fratini E, Hong K, et al. Formation of the Dynamic Clusters in Concentrated Lysozyme Protein Solutions. J Phys Chem Lett (2010) 1:126–9. doi:10.1021/jz900127c
16. Yearley EJ, Godfrin PD, Perevozchikova T, Zhang H, Falus P, Porcar L, et al. Observation of Small Cluster Formation in Concentrated Monoclonal Antibody Solutions and its Implications to Solution Viscosity. Biophysical J (2014) 106:1763–70. doi:10.1016/j.bpj.2014.02.036
17. LeNeveu DM, Rand RP, Parsegian VA. Measurement of Forces between Lecithin Bilayers. Nature (1976) 259:601–3. doi:10.1038/259601a0
18. Schneck E, Sedlmeier F, Netz RR. Hydration Repulsion between Biomembranes Results from an Interplay of Dehydration and Depolarization. Proc Natl Acad Sci U.S.A (2012) 109:14405–9. doi:10.1073/pnas.1205811109
19. Helfrich W. Steric Interaction of Fluid Membranes in Multilayer Systems. Z für Naturforschung A (1978) 33:305–15. doi:10.1515/zna-1978-0308
20. Barker J, Moyer J, Kline S, Jensen G, Cook J, Gagnon C, et al. The Very Small Angle Neutron Scattering Instrument at the National Institute of Standards and Technology. J Appl Crystallogr (2022) 55:826. doi:10.1107/s1600576722000826
21. Kline SR. Reduction and Analysis of SANS and USANS Data Using Igor Pro. J Appl Cryst (2006) 39:895–900. doi:10.1107/S0021889806035059
22.SasView. Sasview Version 5.0.4 (2021). Available from: https://www.sasview.org/ (Accessed February 10 2021).
23. Kotlarchyk M, Chen SH. Analysis of Small Angle Neutron Scattering Spectra from Polydisperse Interacting Colloids. J Chem Phys (1983) 79:2461–9. doi:10.1063/1.446055
24. Pedersen JS. Analysis of Small-Angle Scattering Data from Colloids and Polymer Solutions: Modeling and Least-Squares Fitting. Adv Colloid Interf Sci (1997) 70:171–210. doi:10.1016/s0001-8686(97)00312-6
25. Greene DG, Ferraro DV, Lenhoff AM, Wagner NJ. A Critical Examination of the Decoupling Approximation for Small-Angle Scattering from Hard Ellipsoids of Revolution. J Appl Cryst (2016) 49:1734–9. doi:10.1107/s1600576716012929
26. Liu Y. Intermediate Scattering Function for Macromolecules in Solutions Probed by Neutron Spin Echo. Phys Rev E (2017) 95:020501. doi:10.1103/PhysRevE.95.020501
27. Nagao M, Seto H, Yamada NL. Interaction between Droplets in a Ternary Microemulsion Evaluated by the Relative Form Factor Method. Phys Rev E Stat Nonlin Soft Matter Phys (2007) 75:061401. doi:10.1103/PhysRevE.75.061401
28. Nagao M, Seto H. Concentration Dependence of Shape and Structure Fluctuations of Droplet Microemulsions Investigated by Neutron Spin Echo Spectroscopy. Phys Rev E Stat Nonlin Soft Matter Phys (2008) 78:011507. doi:10.1103/PhysRevE.78.011507
29. Cichocki B, Felderhof BU. Diffusion of Brownian Particles with Hydrodynamic Interaction and Hard Core Repulsion. J Chem Phys (1991) 94:556–62. doi:10.1063/1.460319
30. Haro-Pérez C, Quesada-Pérez M, Callejas-Fernández J, Casals E, Estelrich J, Hidalgo-Álvarez R. Interplay between Hydrodynamic and Direct Interactions Using Liposomes. J Chem Phys (2003) 119:628–34. doi:10.1063/1.1578628
31. Gapinski J, Wilk A, Patkowski A, Häußler W, Banchio AJ, Pecora R, et al. Diffusion and Microstructural Properties of Solutions of Charged Nanosized Proteins: Experiment versus Theory. J Chem Phys (2005) 123:054708. doi:10.1063/1.1996569
32. Kučerka N, Nieh MP, Katsaras J. Fluid Phase Lipid Areas and Bilayer Thicknesses of Commonly Used Phosphatidylcholines as a Function of Temperature. Biochim Biophys Acta (Bba) - Biomembranes (2011) 1808:2761–71. doi:10.1016/j.bbamem.2011.07.022
33. Rosov N, Rathgeber S, Monkenbusch M. Neutron Spin Echo Spectroscopy at the NIST center for Neutron Research. Washington, DC: ACS Publications (2000).
34. Azuah RT, Kneller LR, Qiu Y, Tregenna-Piggott PLW, Brown CM, Copley JRD, et al. Dave a Comprehensive Software Suite for the Reduction, Visualization, and Analysis of Low Energy Neutron Spectroscopic Data. J Res Natl Inst Stand Technol (2009) 114:341. doi:10.6028/jres.114.025
35. Banchio AJ, Nägele G. Short-time Transport Properties in Dense Suspensions: From Neutral to Charge-Stabilized Colloidal Spheres. J Chem Phys (2008) 128:104903. doi:10.1063/1.2868773
36. Kelley EG, Butler PD, Nagao M. 4. Collective Dynamics in Model Biological Membranes Measured by Neutron Spin echo Spectroscopy. In: Characterization of Biological Membranes. Berlin, Germany: de Gruyter (2019). p. 131–76. doi:10.1515/9783110544657-004
37. Kinnun JJ, Scott HL, Ashkar R, Katsaras J. Biomembrane Structure and Material Properties Studied with Neutron Scattering. Front Chem (2021) 9:203. doi:10.3389/fchem.2021.642851
38. Armstrong CL, Häußler W, Seydel T, Katsaras J, Rheinstädter MC. Nanosecond Lipid Dynamics in Membranes Containing Cholesterol. Soft matter (2014) 10:2600–11. doi:10.1039/c3sm51757h
39. Woodka AC, Butler PD, Porcar L, Farago B, Nagao M. Lipid Bilayers and Membrane Dynamics: Insight into Thickness Fluctuations. Phys Rev Lett (2012) 109:058102. doi:10.1103/PhysRevLett.109.058102
40. Nagao M, Kelley EG, Faraone A, Saito M, Yoda Y, Kurokuzu M, et al. Relationship between Viscosity and Acyl Tail Dynamics in Lipid Bilayers. Phys Rev Lett (2021) 127:078102. doi:10.1103/PhysRevLett.127.078102
41. Zilman AG, Granek R. Undulations and Dynamic Structure Factor of Membranes. Phys Rev Lett (1996) 77:4788–91. doi:10.1103/physrevlett.77.4788
42. Zilman AG, Granek R. Membrane Dynamics and Structure Factor. Chem Phys (2002) 284:195–204. doi:10.1016/s0301-0104(02)00548-7
43. Takeda T, Kawabata Y, Seto H, Komura S, Ghosh SK, Nagao M, et al. Neutron Spin-echo Investigations of Membrane Undulations in Complex Fluids Involving Amphiphiles. J Phys Chem Sol (1999) 60:1375–7. doi:10.1016/S0022-3697(99)00122-5
44. Yi Z, Nagao M, Bossev DP. Bending Elasticity of Saturated and Monounsaturated Phospholipid Membranes Studied by the Neutron Spin echo Technique. J Phys Condens Matter (2009) 21:155104. doi:10.1088/0953-8984/21/15/155104
45. Seifert U, Langer SA. Viscous Modes of Fluid Bilayer Membranes. Europhys Lett (1993) 23:71–6. doi:10.1209/0295-5075/23/1/012
46. Watson MC, Brown FLH. Interpreting Membrane Scattering Experiments at the Mesoscale: The Contribution of Dissipation within the Bilayer. Biophysical J (2010) 98:L9–L11. doi:10.1016/j.bpj.2009.11.026
47. Nagle JF. Measuring the Bending Modulus of Lipid Bilayers with Cholesterol. Phys Rev E (2021) 104:044405. doi:10.1103/PhysRevE.104.044405
48. Nagao M, Kelley EG, Ashkar R, Bradbury R, Butler PD. Probing Elastic and Viscous Properties of Phospholipid Bilayers Using Neutron Spin echo Spectroscopy. J Phys Chem Lett (2017) 8:4679–84. doi:10.1021/acs.jpclett.7b01830
49. Hoffmann I. Data Analysis and Background Subtraction in Neutron Spin echo Spectroscopy. Front Phys (2021) 8:602. doi:10.3389/fphy.2020.620082
50. King MD, Marsh D. Head Group and Chain Length Dependence of Phospholipid Self-Assembly Studied by Spin-Label Electron Spin Resonance. Biochemistry (1987) 26:1224–31. doi:10.1021/bi00379a004
51. Van Helden AK, Vrij A. Static Light Scattering of Concentrated Silica Dispersions in Apolar Solvents. J Colloid Interf Sci (1980) 78:312–29. doi:10.1016/0021-9797(80)90570-6
52. Grant MC, Russel WB. Volume-fraction Dependence of Elastic Moduli and Transition Temperatures for Colloidal Silica Gels. Phys Rev E (1993) 47:2606–14. doi:10.1103/PhysRevE.47.2606
53. Haro-Pérez C, Quesada-Pérez M, Callejas-Fernández J, Hidalgo-Álvarez R, Estelrich J, Rojas-Ochoa LF. Hydrodynamic Interactions in Charged Vesicles Suspensions. In: Experimental and Computational Fluid Mechanics. Berlin, Germany: Springer (2014). p. 63–70. doi:10.1007/978-3-319-00116-6_4
54. Cichocki B, Ekiel-Jeżewska ML, Szymczak P, Wajnryb E. Three-particle Contribution to Sedimentation and Collective Diffusion in Hard-Sphere Suspensions. J Chem Phys (2002) 117:1231–41. doi:10.1063/1.1484380
55. Kiselev MA, Aksenov VLD, Lombardo Kisselev AM, Lesieur P. Structure Factor of Dimyristoylphosphatidylcholine Unilamellar Vesicles: Small-Angle X-ray Scattering Study. Tech Rep (2003). JINR-E–19-2003-33, JINR.
56. Pusey PN, Fijnaut HM, Vrij A. Mode Amplitudes in Dynamic Light Scattering by Concentrated Liquid Suspensions of Polydisperse Hard Spheres. J Chem Phys (1982) 77:4270–81. doi:10.1063/1.444428
57. Weeks ER, Weitz DA. Subdiffusion and the Cage Effect Studied Near the Colloidal Glass Transition. Chem Phys (2002) 284:361–7. doi:10.1016/s0301-0104(02)00667-5
58. Yu Y, Anthony SM, Bae SC, Granick S. How Liposomes Diffuse in Concentrated Liposome Suspensions. J Phys Chem B (2011) 115:2748–53. doi:10.1021/jp109146s
59. Nagle JF. Experimentally Determined Tilt and Bending Moduli of Single-Component Lipid Bilayers. Chem Phys Lipids (2017) 205:18–24. doi:10.1016/j.chemphyslip.2017.04.006
60. Rawicz W, Olbrich KC, McIntosh T, Needham D, Evans E. Effect of Chain Length and Unsaturation on Elasticity of Lipid Bilayers. Biophysical J (2000) 79:328–39. doi:10.1016/s0006-3495(00)76295-3
61. Monkenbusch M, Holderer O, Frielinghaus H, Byelov D, Allgaier J, Richter D. Bending Moduli of Microemulsions; Comparison of Results from Small Angle Neutron Scattering and Neutron Spin-Echo Spectroscopy. J Phys Condens Matter (2005) 17:S2903–S2909. doi:10.1088/0953-8984/17/31/017
62. Farago B, Monkenbusch M, Goecking KD, Richter D, Huang JS. Dynamics of Microemulsions as Seen by Neutron Spin echo. Physica B: Condensed Matter (1995) 213-214:712–7. doi:10.1016/0921-4526(95)00257-A
63. Israelachvili J. Intermolecular and Surface Froces. International Series of Monographs on Physics. Cambridge, MA, USA: Academic Press (1991).
64. Muddle AG, Higgins JS, Cummins PG, Staples EJ, Lyle IG. Light Scattering and Neutron Scattering from Concentrated Dispersions of Small Unilamellar Vesicles. Faraday Discuss Chem Soc (1983) 76:77–92. doi:10.1039/dc9837600077
65. Lipowsky R, Leibler S. Unbinding Transitions of Interacting Membranes. Phys Rev Lett (1986) 56:2541–4. doi:10.1103/physrevlett.56.2541
66. Mutz M, Helfrich W. Unbinding Transition of a Biological Model Membrane. Phys Rev Lett (1989) 62:2881–4. doi:10.1103/physrevlett.62.2881
67. Vogel M, Münster C, Fenzl W, Salditt T. Thermal Unbinding of Highly Oriented Phospholipid Membranes. Phys Rev Lett (2000) 84:390–3. doi:10.1103/physrevlett.84.390
68. Pozo-Navas B, Raghunathan VA, Katsaras J, Rappolt M, Lohner K, Pabst G. Discontinuous Unbinding of Lipid Multibilayers. Phys Rev Lett (2003) 91:028101. doi:10.1103/PhysRevLett.91.028101
69. Kawabata Y, Bradbury R, Kugizaki S, Weigandt K, Melnichenko YB, Sadakane K, et al. Effect of Interlamellar Interactions on Shear Induced Multilamellar Vesicle Formation. J Chem Phys (2017) 147:034905. doi:10.1063/1.4994563
Keywords: lipid vesicles, small angle neutron scattering (SANS), dynamic light scattering (DLS), neutron spin echo spectroscopy (NSE), structure factor, hydrodynamic factor, membrane dynamics
Citation: Kelley EG, Blick EE, Prabhu VM, Butler PD and Nagao M (2022) Interactions, Diffusion, and Membrane Fluctuations in Concentrated Unilamellar Lipid Vesicle Solutions. Front. Phys. 10:866024. doi: 10.3389/fphy.2022.866024
Received: 30 January 2022; Accepted: 21 March 2022;
Published: 14 April 2022.
Edited by:
Silvina Ponce Dawson, University of Buenos Aires, ArgentinaReviewed by:
Theyencheri Narayanan, European Synchrotron Radiation Facility, FranceCopyright © 2022 Kelley, Blick, Prabhu, Butler and Nagao. This is an open-access article distributed under the terms of the Creative Commons Attribution License (CC BY). The use, distribution or reproduction in other forums is permitted, provided the original author(s) and the copyright owner(s) are credited and that the original publication in this journal is cited, in accordance with accepted academic practice. No use, distribution or reproduction is permitted which does not comply with these terms.
*Correspondence: Elizabeth G. Kelley, ZWdrQG5pc3QuZ292
†Present address:Emily E. Blick, Biomedical Engineering Department, The University of Wisconsin, Madison, WI, United States
Disclaimer: All claims expressed in this article are solely those of the authors and do not necessarily represent those of their affiliated organizations, or those of the publisher, the editors and the reviewers. Any product that may be evaluated in this article or claim that may be made by its manufacturer is not guaranteed or endorsed by the publisher.
Research integrity at Frontiers
Learn more about the work of our research integrity team to safeguard the quality of each article we publish.