- 1Shanghai Synchrotron Radiation Facility, Shanghai Advanced Research Institute, Chinese Academy of Sciences, Shanghai, China
- 2Shanghai Institute of Applied Physics, Chinese Academy of Sciences, Shanghai, China
- 3University of Chinese Academy of Sciences, Beijing, China
- 4School of Physical Science and Technlogy, ShanghaiTech University, Shanghai, China
Speckle scanning metrology is an effective tool to determine the X-ray wave front error in synchrotron radiation. By measuring wave front radii of curvature, X-ray optics can be high-precision aligned and adaptive optics can be used for compensating these wave front errors to pursue an aberration-free wave front. Photon beam and motor vibrations are the major limitations in characterizing the beam performances. An analytical model is presented in this article to reveal the influences of photon beams and motor vibrations on the measurements of the wave front radii of curvature. It is worth noting that the influence of low-frequency vibration is oscillatory and thus the selection of sampling frequency is strongly related. The experimental results verify the model and reveal the main dependency of the experimental deviations on the amplitude and frequency of vibrations.
Introduction
As a novel X-ray wave front sensing technique, the near-field speckle-based technique has been successfully applied to X-ray imaging [1–3] and metrology [4–7]. Compared to the previous techniques such as the Hartmann wave front sensor [8], propagation iterative algorithm [9], and grating interferometry [10], the speckle-based technique has the advantages of high measurement accuracy, flexible experimental setup, and economical application cost. X-ray speckle scanning metrology utilizes the speckle pattern produced by the diffuser (such as sandpaper or membrane) as a wave front marker to modulate the X-ray wave front [11]. By analyzing a series of speckled patterns acquired during a diffuser scan, the wave front phase gradient or local curvature can be extracted [12].
Noise and vibration inevitably interact with synchrotron radiation facilities. For high-precision scanning-based metrology or an imaging experimental process, often, they have more influence than photon flux. Zhou discussed the noise properties on the speckle-based imaging and found a behavior similar to that of the grating-based method [13]. The signal-to-noise ratio was found to have a strong influence on the subset size choice in speckle-based imaging [14]. Photon beam vibrations from the electron beam orbit, insert devices [15], ground [16], optics (mechanical or thermal instability), mechanical pieces of equipment [17], and other human activities occur more unpredictably. Vibrations can be roughly divided into three frequency regimes: low (<1 Hz), intermediate (1–100 Hz), and high (>100 Hz) regimes [18]. Although the vibrations of intermediate and high frequencies can be greatly suppressed through the optimization of buildings and environment, as well as the beamline equipment and optics, the vibrations of intermediate and low frequencies in the submicron scale are widespread, which have a significant impact on the experiments of high spatial or temporal resolution. Optical vibrations have been revealed to have relations with beam coherence [19], beam size, and divergence [20]. Scanning motor vibrations or errors in different scan sequences that change the effective scan step size can also introduce artifacts in the measurement [21]. Berujon used the X-ray speckle tracking technique to measure the beam stability with a fast time-sampling resolution ∼80 Hz [22]. However, rapid exposure requires a high beam flux, and this technique can only measure the vibrations below the sampling frequency. To the best of our knowledge, comprehensive studies discussing the influence of vibrations on beam quality or the accuracy of related metrology in the synchrotron radiation field are still lacking, which makes it difficult to accurately characterize the wave front and realize the stability adjustment with high-speed feedback. In contrast, a similar situation of laser propagation [23, 24] or sensor [25] in a turbulent atmosphere has been treated with an emphasis.
This article analytically analyzes and discusses the influence of photon beams and motor vibrations with various amplitudes and frequencies on the X-ray speckle scanning metrology.
Theory
In speckle scanning metrology, X-rays pass through a diffuser and are collected on a pixel detector. As is shown in Figure 1A, the diffuser plane and detector plane are represented in the different coordinating systems. The diffuser can be scanned along the vertical direction driven by a high-precision motor at a constant step μ and a constant speed v. The line intensity profiles of the kth row Io(x, zk) in a stack (n) of speckle patterns collected during a scan time t can be stitched as a new speckle pattern Io(x, zk, ζk(t)), as shown in Figure 1B. Here, ζk (t) = ζk (0)+vt and vt < nμ. Since all images in the horizontal direction do not change, in order to simplify the expression, x will be omitted in the subsequent expressions.
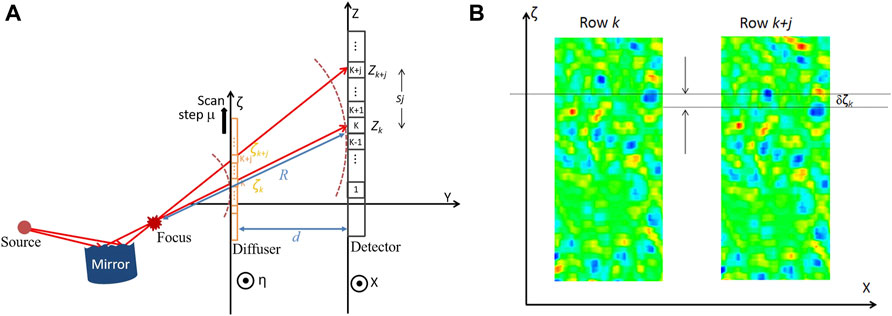
FIGURE 1. (A) Measurement configuration for the speckle scanning metrology. (B) The new stitched speckle patterns built from the kth and (k + j)th rows of a stack of speckle patterns.
The square difference between the kth and (k + j)th stitched speckle pattern can be expressed as follows:
In this expression, with the change in ζ, a region of interest as the subset moves in the range of scan sequence for the square difference calculation. The location of the least-square difference at ζ = δζk can denote the best matching of two stitched speckle patterns, as shown in Figure 1B. Equation 1 is equivalent to the cross-correlation function using a digital image correlation method [26]. In this situation, the kth and (k + j)th stitched speckle patterns have an approximate relational expression:
where Ii is the incoming beam intensity at the diffuser plane and T is the transfer function of a diffuser. In the case where the focus is upstream of the diffuser, the local wave front radius of curvature Rk with respect to the kth row pixels can be calculated based on a geometrical relation given as follows:
where s is the detector pixel size and d is the diffuser-to-detector distance. The local wave front radius of curvature can be measured with higher angular resolution by analyzing the speckles using more neighboring pixels (smaller j), but too many neighboring pixel choices may result in an indistinguishable shift compared to the scan step.
Whether it is the vibration of a point source or a reflective mirror, the beam vibration mainly presents as the shift in position or angle. Actually, both linear and angular vibrations exist in any synchrotron beamline. In the small-angle approximation of a paraxial system, all vibration processes can be reflected on the linear position shift of speckles. Assuming the vibration occurs in the vertical direction, the vibration at the diffuser plane is described by a sinusoidal function of time and a random vibration τb in the form of
where A is the amplitude and f is the vibration frequency. τb normally satisfies Gaussian probability distributions with zero mean and a known standard deviation. The location of the irradiation on the diffuser changes with the vibration, therefore Ii in Eq. 2 is no longer constant. Similarly, the scanning motor also has a random vibration or a step error, which can be denoted as τm. Defining a calculation error δζek of the shift δζk resulting from a photon beam vibration ξ(t) and a random motor vibration τm(t), Eq. 2 can be changed as follows:
where Δζ = Asin(2πfζk/v) is the beam offset when the diffuser moves a displacement of δζk.
Since δζe is far less than δζ, and the vibrations ξ and τm are small quantities, the first-order Taylor expansions can be used to express these disturbances. Combining Eq. 1 and Eq. 5, the following equation is obtained:
where M(ζk) = d2Ii(ζk)/dζk2 and h (ζk) = dT (ζk)/dζk. Minimizing Eq. 6 by solving dχ2/dζ = 0 when ζ = δζk, we can get the relationship between the error of shift and the different vibrations as follows:
We assume that the motor vibration τm is Gaussian white noise. For a situation with only motor vibration, the variance of the error of shift can be expressed [27] in a simple form σ2ζ = σ2 τm. For a situation with only beam vibration, the second summation term of the numerator in the Eq. 7 equals zero. If the beam vibration obeys a Gaussian statistical relation ξ(t) = τb(t), the variance of the error of shift can be mathematically expressed as follows [27]:
When the beam vibration is described by a sinusoidal function, the situation is highly dependent on the vibration frequency. The beam intensity function can be expressed as the convolution of the probability density function P and its original intensity distribution [28]: Ii(ζk+ξ(t)) = P(ζk)*Ii(ζk), where * is the convolution operator. In a small range within the vibration amplitude A, the intensity can be regarded as a constant. In this case, the beam intensity function is equivalent to I (ζk+ξ(t)) = P (ζk)Ii(ζk). If the beam vibration ξ(t) = Asin(2πft), the probability density function of ξ(t) is P(ζk) = 1/[π(A2-ζk2)1/2]. The variance of the error of shift can be given as follows:
where fs = v/nμ is the sampling frequency of the detector during a scan sequence in the range of any subset, i is the row order in the scan sequence, and N = [f/fs] is the integral value. In a sinusoidal period, the mean square σ2ξ1 = A2/2. For extra beam offset beyond periodic vibrations, the mean square σ2ξ2 is as follows:
When the vibration frequency is much higher than the sampling frequency in a single exposure f >> f0 = fsn, the collected patterns are the statistical average of the speckle patterns in a sampling time, that is, low-contrast or blur speckle patterns. In this case, the second term can be neglected. Since the vibration period cannot be recorded by the detector, the frequency no longer affects the value of the first term. When the vibration frequency satisfies fs << f < f0, the stitched speckle image includes N reciprocating vibrations, which is the first item in the given expression. The vibrations with opposite directions in any vibration period produce reverse deviations δζe, which makes a relatively small competition error in the algorithm for searching out a maximum δζ14. The weight of the first term Eq. 9 is greater as N increases and the first term increases slowly with the increase of the vibration period and amplitude. The second term depicts the influence from the extra beam offset beyond these periodic vibrations. It is clear that if the vibration frequency f is exactly an integral multiple of fs, the second term is equal to zero, so there is a relative minimum of the error of shift. If the vibration reaches maximum amplitude A, there is a relative maximum of the error of shift. When the vibration frequency is close to or lower than the sampling frequency of the detector within the subset range, the effect of the vibration performs as the linear movement of the incoming beam. In this case, the first term is equal to zero and the low-frequency beam offset expressed in the second term determines the error of shift.
In consideration of the complex form of Eq. 9, we can simplify its expression based on the analysis in the last paragraph. Compared to the influence from multiple vibration periods on the correlation method, the influence from the statistical fluctuations of T, M, h, and I can be neglected so that a constant term can be used to replace the formula in summation term. Eq. 9 and Eq. 10 can be simplified as follows:
where K1 and K2 are constants and the weight function γ(f) = Nfs/f.
Based on Eq. 3, the root-mean-square error (RMSE) of the wave front radius of curvature has a relationship with that of the speckle shift, which is given as follows:
Combining Eqs 9, 10, or using a simplified Eq. 11, the calculation error of the radius of curvature can be estimated from the vibration influence.
Except the calculation error of the wave front radius of curvature, the angular resolution of the measurement also changes. In theory, the angular resolution of the radius of curvature is sj/R. When the photon beam has a vibration with its frequency smaller than the sampling frequency, the angular resolution changes to (sj+Δζ)/R. For the position of a sudden change of curvature, M(ζk) in Eqs 8, 9 increases significantly and the vibration increases the error. For a high-frequency vibration, the angular resolution remains unchanged.
Experiments
The X-ray speckle scanning metrology measurements were performed at the BL09B measurement beamline of the Shanghai Synchrotron Radiation Facility with an X-ray energy of 10 keV. As shown in Figure 1, the cylindrical mirror was mounted with the vertical deflection on the sample manipulator of L0 = 39 m downstream of the source. The sandpaper with the pore size of 3 μm was L1 = 380 mm downstream of the mirror. The grazing-incidence angle of the mirror was at the total reflection θ = 0.18°. The detection system, a microscope objective lens system (Optique Peter) with a magnification of 10 coupled to a CMOS camera (Hamamatsu) was placed at d = 955 mm behind the sandpaper. The effective pixel size was s = 0.65 μm. The exposure time was 5 s for each capture. During scanning measurements, the sandpaper was driven at a nano-precision linear motion stage (PI) with a step size of μ = 200 nm along the vertical direction and m = 51 speckle patterns were recorded during each scan. The movement time of each step is 0.2 s. The vibrations of a cylindrical mirror were simulated by a sinusoidal motion of another piezo linear motion stage (Coremorrow) along the vertical direction with different frequencies (0.01–60 Hz) and different amplitudes (20–200 nm). The subset width of 31 steps was used in the digital image correlation algorithm.
Results and Discussions
Figure 2 shows the measured wave front radius of a curvature with different vibration frequencies from 0.01 to 60 Hz and fixed amplitude of 50 nm. It is clear that at the low-frequency regime, the vibration caused a significant influence. Based on the simplified analytical model of Eq. 11, the RMSE of these wave front radii of curvature versus the frequency can be simulated, as seen in Figure 3. The RSME curve can be regarded as the sum of the algorithm error from periodic vibration (first term), the extra deviation (second term), and the random errors. It is clear that when the vibration frequency is greater than f0 = 0.19 Hz, the RSME tends to a constant, and in the low-frequency regime, the RSME shows a characteristic of oscillation. When the f = 0.025, 0.075, 0.125, and 0.175 Hz, the sinusoidal vibration almost reached the maximum amplitude. As seen in Figure 3, the RMSEs of the wave front radii of curvature are closer to the maximum. Whereas when the f/fs is close to an integer such as f = 0.1 or 0.6 Hz, the RMSEs are relatively small. Based on the aforementioned results, it is obvious that if the sampling frequency is set lower than most of the vibration frequencies, to avoid the region of oscillation, relatively stable, and predictable experimental results can be obtained.
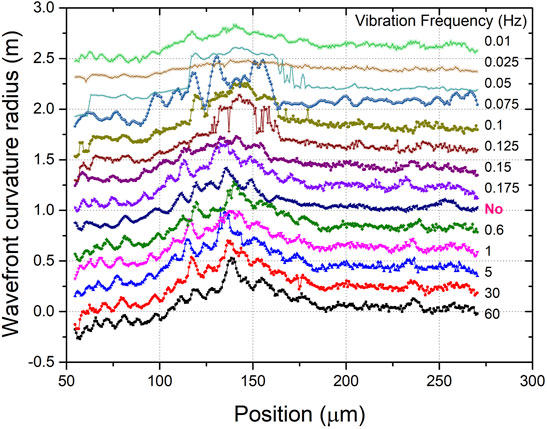
FIGURE 2. Measured wave front radii of curvature with different vibration frequencies from 0.01 to 60 Hz and fixed vibration amplitude of 50 nm. When low-frequency vibrations below 0.15 Hz are added, the measured wave front curvature starts to diverge away from the no-vibration state.
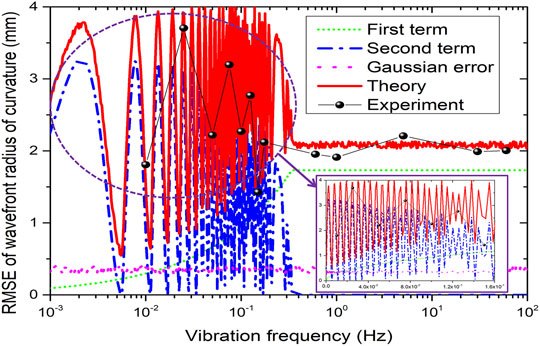
FIGURE 3. Comparison of the experimental and the theoretical RMSE of the wave front radius of curvature. The solid red line represents the simulated curve based on Eq. 11. The green short dot, blue dash dot, and magenta dot, respectively, represent the first term, second term, and error term in Eq. 11. The black line and solid ball are the experiment data. The extra inserted figure is to expand the frequency range of 0–0.16.
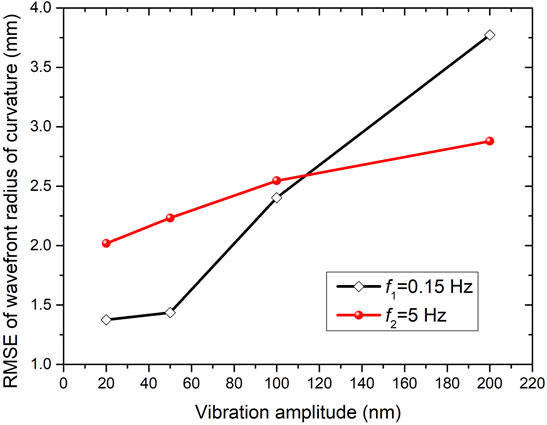
Figure 4 presents the measured wave front radii of curvature at the frequencies 0.15 and 5 Hz as the vibration amplitudes changed from 20 to 200 nm. Since the measurements for frequencies of 0.15 and 5 Hz were carried out on different days, the wave front curvature radii in cases of zero amplitude were a little different. In the case of 5 Hz, the measurement can tolerate a very large vibration amplitude and the curvature radius profile almost maintains the same shape. In contrast, the test data with 200 nm vibration amplitude at 0.15 Hz has significant errors and in some locations, the error is even more than 0.4 m. Figure 5 compares the RMSE curves of the two frequencies. Since the amplitude changes, the summation terms in Eq. 9 contain the variable A. In this case, the RMSE is a quartic increasing function of amplitude. Since the second term in Eq. 9 has a certain weight at 0.15 Hz and the σ2ξ2 is greater than σ2ξ1, the RMSE at 0.15 Hz has a greater slope than that at 5 Hz as the amplitude increases. As the frequency decreases further, the weight of the first term in Eq. 9 also decreases so that the RMSE increases significantly with the increase of amplitude.
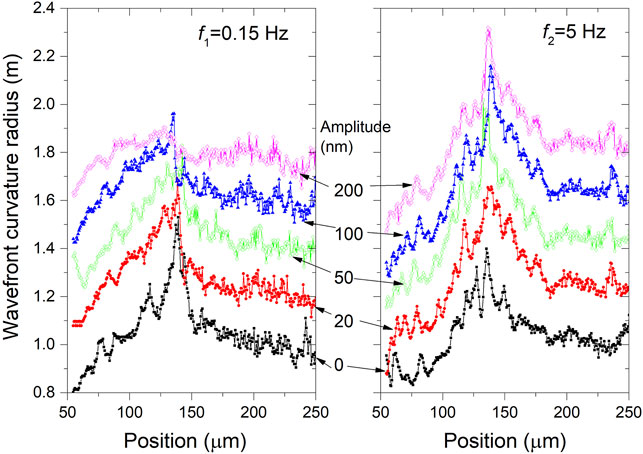
FIGURE 4. Measured wave front curvature radius with different vibration amplitudes from 20 to 200 nm for a given frequency of 0.15 Hz (left) and 5 Hz (right). The measurement can tolerate a vibration amplitude of 200 nm at 5 Hz but much lower amplitude at 0.15 Hz.
Figure 6 presents a stability test of the pitch angle for the horizontal-deflecting collimating mirror with the water-cooling system at the Shanghai Synchrotron Radiation Facility. The relative pitch stability was measured using the Renishaw XL-80 laser interferometer, and the data were collected at a sampling frequency of 250 Hz. The lower figure reports the Fourier transform of vibration amplitudes with a bandwidth upper limit of 120 Hz. The eigenmodes below 50 Hz are always related to the support. For such a mirror longer than 800 mm, the low-frequency vibration of <0.5 Hz can be closed loop compensated by using a feedback system based on the beam position monitor because this low-frequency vibration has significant negative effects on X-ray speckle scanning metrology. The RMS vibration below 20 Hz is beyond 20 nrad. The sampling frequency of X-ray speckle scanning metrology needs to avoid higher than main frequency peaks or at least avoid the maximum of the second term in Eq. 10. The vibration of the frequency higher than 20 Hz cannot be compensated by a feedback system; hence, its influence on the metrology is almost a constant as demonstrated in Figure 3.
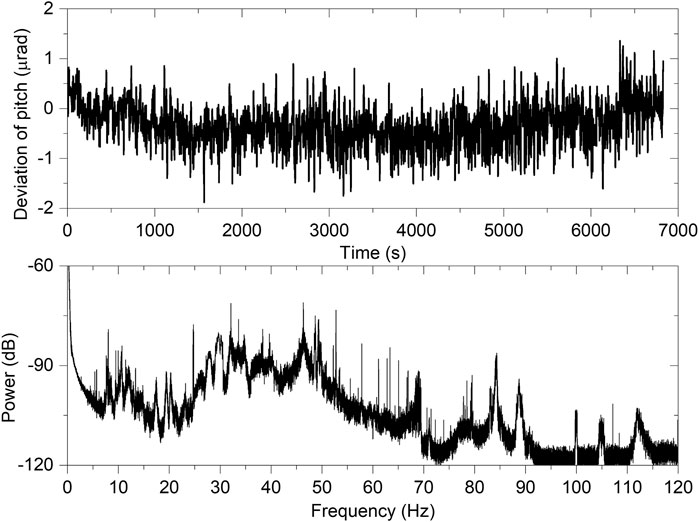
FIGURE 6. Vibration of the pitch angle for the horizontal-deflecting collimating mirror (upper) and its power in the frequency domain (lower).
Conclusion
In conclusion, we presented an analytical model and experimental verification of the vibration-induced effect on the measurement of the wave front radius of curvature by using the X-ray speckle scanning technique. The proposed method can be used to estimate the experimental errors or optimize the sampling time in X-ray speckle scanning metrology based on the known eigenfrequency of the optics or the vibration frequency of the X-ray beam. It suggests that [1] the sampling frequency should be lower than most of the main vibration frequencies [2]; the rest of the lower vibration frequency should remain an integer multiple of the sampling frequency in a scan sequence within the range of a subset [3]; the low-frequency vibration should be eliminated as much as possible. When the aforementioned three conditions are satisfied, the test error of metrology can be considered as a constant and easily estimated.
Data Availability Statement
The raw data supporting the conclusion of this article will be made available by the authors, without undue reservation.
Author Contributions
NT: methodology, software, experiment, and writing. HJ: conceptualization, methodology, writing, and supervision. LX: experiment. JX: writing.
Funding
The study was funded by the National Natural Science Foundation of China (12175294, 11775295), Natural Science Foundation of Shanghai of China (21ZR1471500), and the Funds from the Youth Innovation Promotion Association, CAS (2018295).
Conflict of Interest
The authors declare that the research was conducted in the absence of any commercial or financial relationships that could be construed as a potential conflict of interest.
Publisher’s Note
All claims expressed in this article are solely those of the authors and do not necessarily represent those of their affiliated organizations, or those of the publisher, the editors, and the reviewers. Any product that may be evaluated in this article, or claim that may be made by its manufacturer, is not guaranteed or endorsed by the publisher.
Acknowledgments
The authors would like to thank our colleague Dr. Zhongliang Li for helping with the set-up of experiments at the measurement beamline BL09B of SSRF.
References
1. Berujon S, Wang H, Sawhney K. X-ray Multimodal Imaging Using a Random-phase Object. Phys Rev.A (2013) 86(6):1–9.
2. Morgan KS, Paganin DM, Siu KKW. X-ray Phase Imaging with a Paper Analyzer. Appl Phys Lett (2012) 100(12):124102. doi:10.1063/1.3694918
3. Zanette I, Zhou T, Burvall A, Lundström U, Larsson DH, Zdora M, et al. Speckle-Based X-Ray Phase-Contrast and Dark-Field Imaging with a Laboratory Source. Phys Rev Lett (2014) 112(25):253903. doi:10.1103/physrevlett.112.253903
4. Wang H, Sutter J, Sawhney K. Advanced In Situ Metrology for X-ray Beam Shaping with Super Precision. Opt Express (2015) 23(2):1605–14. doi:10.1364/oe.23.001605
5. Kashyap Y, Wang H, Sawhney K. Speckle-based At-Wavelength Metrology of X-ray Mirrors with Super Accuracy. Rev Scientific Instr (2016) 87(5):052001. doi:10.1063/1.4949004
6. Jiang H, Yan S, Tian N, Liang D, Dong Z, Zheng Y. Extraction of Medium-Spatial-Frequency Interfacial Waviness and Inner Structure from X-ray Multilayers Using the Speckle Scanning Technique. Opt Mater Express (2019) 9(7):2878. doi:10.1364/ome.9.002878
7. Jiang H, Tian N, Liang D, Du G, Yan S. A Piezoelectric Deformable X-ray Mirror for Phase Compensation Based on Global Optimization. J Synchrotron Radiat (2019) 26:729–36. doi:10.1107/s1600577519003047
8. Idir M, Mercere P, Modi M, Dovillaire G, Sauvageot P. X-ray Active Mirror Coupled with a Hartmann Wavefront Sensor. Nuc Instrum Meth A (2010) 616(2-3):162–71. doi:10.1016/j.nima.2009.10.168
9. Kimura T, Mimura H, Handa S, Yumoto H, Yokoyama H, Imai S, et al. Wavefield Characterization of Nearly Diffraction-Limited Focused Hard X-ray Beam with Size Less Than 10 Nm. Rev Scientific Instr (2010) 81(12):123704. doi:10.1063/1.3509384
10. Zanette I, Weitkamp T, Donath T, Rutishauser S, David C. Two-Dimensional X-ray Grating Interferometer. Phys Rev Lett (2010) 105(24):248102. doi:10.1103/physrevlett.105.248102
11. Tian N, Jiang H, Li A, Liang D, Yan S, Zhang Z. Influence of Diffuser Grain Size on the Speckle Tracking Technique. J Synchrotron Radiat (2020) 27:146–57. doi:10.1107/s1600577519015200
12. Berujon S, Wang H, Alcock S, Sawhney K. At-wavelength Metrology of Hard X-ray Mirror Using Near Field Speckle. Opt Express (2014) 22(6):6438–46. doi:10.1364/oe.22.006438
13. Zhou T, Zdora M-C, Zanette I, Romell J, Hertz HM, Burvall A. Noise Analysis of Speckle-Based X-ray Phase-Contrast Imaging. Opt Lett (2016) 41(23):5490–3. doi:10.1364/ol.41.005490
14. Tian N, Jiang H, Li A, Liang D, Yu F. High-precision Speckle-Tracking X-ray Imaging with Adaptive Subset Size Choices. Sci Rep (2020) 10:14238. doi:10.1038/s41598-020-71158-9
15. Tsumaki K, Kumagai N. Vibration Measurement of the SPring-8 Storage Ring, Particle Accelerator Conference. IEEE (2001) 1482–4.
16. Wang X, Yan Z, Du H. Suppression of Ground Vibration for SSRF Foundation. Appl Mech Mat (2012) 105-107:30–3.
17. Li JW, Matias E, Chen N, Kim C-Y, Wang J, Gorin J, et al. Investigations of Mechanical Vibrations for Beamlines at the Canadian Light Source. J Synchrotron Radiat (2011) 18:109–16. doi:10.1107/s0909049510041075
18. Simos N. Synchrotron Facilities: Vibration and Stability challenge. Synchrotron Radiat News (2019) 32(5):2–3. doi:10.1080/08940886.2019.1654825
19. Grizolli W, Shi X, Assoufid L. Influence of Optics Vibration on Synchrotron Beam Coherence. Opt Lett (2019) 44(4):899–902. doi:10.1364/ol.44.000899
20. Goto S. Effect of Beamline Optics Vibration on the Source Size and Divergence for Synchrotron Radiation. Proc SPIE (2015) 9588:95880G. doi:10.1117/12.2191933
21. Zdora M-C. State of the Art of X-ray Speckle-Based Phase-Contrast and Dark-Field Imaging. J Imaging (2018) 4(5):60. doi:10.3390/jimaging4050060
22. Berujon S, Cojocaru R, Piault P, Celestre R, Roth T, Barrett R, et al. X-ray Optics and Beam Characterization Using Random Modulation: Experiments. J Synchrotron Radiat (2020) 27:293–304. doi:10.1107/s1600577520000508
23. Whiteley M. Compensation Efficiencies of Conventional Tracking and High-Order Beam Control in Extended Turbulence. Proc.SPIE (2000) 4125:21–101.
24. Frehlich R. Simulation of Laser Propagation in a Turbulent Atmosphere. Appl Opt (2000) 39(3):393–7. doi:10.1364/ao.39.000393
25. Kim JJ, Fernandez B, Agrawal B. Iterative Wavefront Reconstruction for strong Turbulence Using Shack-Hartmann Wavefront Sensor Measurements. J Opt Soc Am A (2021) 38(3):456–64. doi:10.1364/josaa.413934
26. Pan B, Xie H, Xu B, Dai F. Performance of Sub-pixel Registration Algorithms in Digital Image Correlation. Meas Sci Technol (2006) 17:1615–21.
27. Wang YQ, Sutton MA, Bruck HA, Schreier HW. Quantitative Error Assessment in Pattern Matching: Effects of Intensity Pattern Noise, Interpolation, Strain and Image Contrast on Motion Measurements. Strain (2009) 45:160–78. doi:10.1111/j.1475-1305.2008.00592.x
Keywords: speckle scanning metrology, synchrotron radiation, vibration analysis, vibration frequency, wave front radius of curvature
Citation: Tian N, Jiang H, Xue L and Xie J (2022) Influence of Photon Beam and Motor Vibrations on At-Wavelength X-Ray Speckle Scanning Metrology. Front. Phys. 10:864985. doi: 10.3389/fphy.2022.864985
Received: 29 January 2022; Accepted: 11 March 2022;
Published: 07 April 2022.
Edited by:
Qiushi Huang, Tongji University, ChinaReviewed by:
Hongchang Wang, Diamond Light Source, United KingdomSimon Alcock, Diamond Light Source, United Kingdom
Copyright © 2022 Tian, Jiang, Xue and Xie. This is an open-access article distributed under the terms of the Creative Commons Attribution License (CC BY). The use, distribution or reproduction in other forums is permitted, provided the original author(s) and the copyright owner(s) are credited and that the original publication in this journal is cited, in accordance with accepted academic practice. No use, distribution or reproduction is permitted which does not comply with these terms.
*Correspondence: Hui Jiang, amlhbmdodWlAempsYWIub3JnLmNu
 Naxi Tian
 Hui Jiang
 Lian Xue1