- 1Schulich Faculty of Chemistry, Technion-Israel Institute of Technology, Haifa, Israel
- 2Institute of Advanced Studies in Theoretical Chemistry, Technion-Israel Institute of Technology, Haifa, Israel
- 3Faculty of Physics, Technion-Israel Institute of Technology, Haifa, Israel
The purpose of this review is to describe the rationale behind the RVP (resonance via Padé) approach for calculating energies and widths of resonances, while emphasizing a solid mathematical ground. The method takes real input data from stabilization graphs, where quasi-discrete continuum energy levels are plotted as a function of a parameter, which gradually makes the employed basis functions more diffuse. Thus, input data is obtained from standard quantum chemistry packages, which are routinely used for calculating molecular bound electronic states. The method simultaneously provides the resonance positions (energies) and widths (decay rates) via analytical continuations of real input data into the complex plane (via the Padé approximant). RVP holds for isolated resonances (in which the energy-gap between resonance states is smaller than their decay rates). We focus also on the ability to use an open-source “black-box” code to calculate the resonance positions and widths as well as other complex electronic properties, such as transition dipoles.
1 Introduction and Motivation
1.1 Resonances in Chemistry
Resonances are perhaps one of the most striking phenomena in chemistry [1, 2]. Molecules in metastable states (so called resonances) have enough energy to ionize or dissociate but do not do it right away. They have finite lifetimes and decay to the products which can be electrons, ions and radicals. The decay rates can vary from case to case and can be different by many order of magnitudes and there may be several open decay channels.
Let’s consider the following illustrative triatomic (ABC) molecular reaction that occurs on a ground electronic potential energy surface,
Where [ABC]# represents an activated complex that has enough energy to dissociate to several different products and, BC* is the diatomic molecule BC in an excited ro-vibrational state. This reaction takes place for a specific collision energy (within a given uncertainty) at which the activated complex is created in a well defined metatsable state. This metastable state is known as a resonance state, as time passes it decays into the reaction products. The energy of the activated complex above the lowest energy threshold (i.e., above the minimal energy in which it can dissociates) is the resonance position, Eres. The decay rate or width of the activated complex, Γres, is inverse proportional to the lifetime of the activated complex, where 2πℏ is the proportional parameter. The decay rate, Γres, is a sum over the partial decay rates into all the possible products. That is,
The difference between the energy of the activated complex in a resonance (metastable) state and the energies of the different bound-state energies of the reaction products provide the relative kinetic energies of the AB + C, AC + B and A + BC* products. The energy and width of the activated complex and the partial decay rates can be calculated from a single eigenfunction of the time independent nuclear Schrödinger equation when outgoing boundary conditions are imposed [1–3]. Notice that by imposing outgoing boundary conditions on the non-equilibrium reaction presented in Eq. 1 will turn the real physical molecular Hamiltonian into a non-Hermitian Hamiltonian, as will be explained in details below. The resonance via Padé (RVP) method, which is the focus of this review, enables the calculations of the energy and decay rate of such an activated complex. In principle, also the partial widths can be calculated by RVP, but the way to do it is out of the scope of this review.
A second illustration examines the autoionization process in the helium atom. Helium has an infinite number of discrete bound states. The bound states of helium are associated with the ground and singly excited electronic states. Contrary, the doubly-excited states must ionize after a finite period of time, i.e., these states are resonance states,
Let us prove it. The starting point in our proof is to neglect the electronic repulsion and approximate the energy of a doubly-excited helium (He**) as,
where Z = 2. This value must be lower than the exact energy of a doubly-excited helium state since the electronic repulsion was neglected. Therefore, whenever
ionization takes place, where n1, n2 are the neutral He electronic levels and nion is the level of He+. This inequality can be reformulated as,
The lowest doubly-excited states occur when n1 = n2 = 2, for which
These kind of resonances are referred to Feshbach type resonances [2] since their energies (for n1 = n2 = 2) are below their own ionization threshold, i.e., He*+(2s or 2p), but above the He+(1s) threshold. Thus, Feshbach resonances are associated with two-electron processes. Therefore, dynamical electronic correlation, in which one go beyond the mean field (Hartree Fock) approximation, must be considered. Imposing outgoing boundary conditions on the electronic solutions of the time-independent Scrödinger equation makes the electronic Hamiltonian non-Hermitian, as in the above molecular dissociation example. Thus, the resonance energy positions and decay rates of He**, and any chemical systems in autoionization states, can be immediately obtained from the eigenvalue spectrum of a non-Hermitian Hamiltonian (see the next section for more details). Moreover, below we show that RVP can be used to study the autoionization process in Eq. 2 with great accuracy.
Another type of metastable electronic states are the shape-type resonances [2], which lay above their own ionization threshold, therefore they represent a one-electron transition and they can be obtained within the Hartree-Fock approximation. This is a one-electron process, in which an electron tunnels through a potential barrier that results from a mean repulsion potential that corresponds to all the other electrons. Of course, for accurate calculations of energies and widths (inverse lifetimes) one should go beyond the mean field approximation. The simplest examples for electronic shape-type resonances are the ground electronic states of the molecular Hydrogen, Nitrogen and CO anions [5, 6]. Notice that in such anionic-resonance cases the decay process is referred to as autodetachment.
Uracil anion is an example for a biochemical system in which ionization and dissociation may occur simultaneously. Attachment of an electron to uracil leads to two types of electronic resonance anion states. Shape resonances appear as an electron is attached to one of the unoccupied π* orbitals of the neutral ground state of uracil. Alternatively, an electron can be attached to excited states of the neutral uracil, forming an electronica Feshbach resonances. In addition to the autoionization process associated electronic resonance states, also dissociative electron attachment (DEA) processes may follow upon the creation of a uracil anion. Uracil may undergo DEA into C3H3N2O− by eliminating CO and H [7]. These autoionization and DEA process may result in damage to the RNA strand. Below we show that RVP can be used in studying such processes, by calculating the complex energies of the lowest three shape-type states of the uracil anion as well as the transition dipoles between them.
All in all, electronic resonances refer to autoionization (e.g., Eq. 2) and nuclear resonances refer to a situation in which a molecule pre-dissociates (e.g., Eq. 1). Notice that autoionization can become a more complicated and “rich” phenomenon, as in the case of: Auger [8–11], ICD (interatomic Coulombic decay) [12–20], ETMD (electron-transfer mediated decay) [15, 20–23], etc. Nuclear shape-type and Feshbach-type resonances are described in detail in Chapter 2 in Ref. 1 that is dedicated to Resonances Phenomena in Nature. Of course, often the decay of the electron and nuclear resonance states may happen simultaneously. As for example,
The RVP method, which is described below, is applicable to all these cases.
1.2 Wavepacket Time-Dependent Propagation vs. Time-Independent Stationary Solutions via Outgoing Boundary Conditions
Let us first briefly explain the motivation to look for such a comparison. In scattering theory resonances are associated with wavefunctions or eigenstates of the time-independent Schrödinger equation (TISE), which only consist of outgoing waves at the asymptote. The physical reason is clear. The system is prepared in a metastable state and as time passes it breaks apart into sub-systems as described above. Solving the TISE with such outgoing boundary conditions (OBCs) results in a discrete spectrum with real and complex eigenvalues, which are associated with bound states and resonances, respectively [1–3]. Notice that such a spectrum characterizes the non-Hermitian quantum mechanics (NHQM) formalism, i.e., by imposing OBCs we turn the QM problem into the NH regime. The bound state eigenvalues are real and the corresponding eigenfunctions are exactly as usual (i.e, decay asymptotically to zero). The resonance eigenvalues are complex,
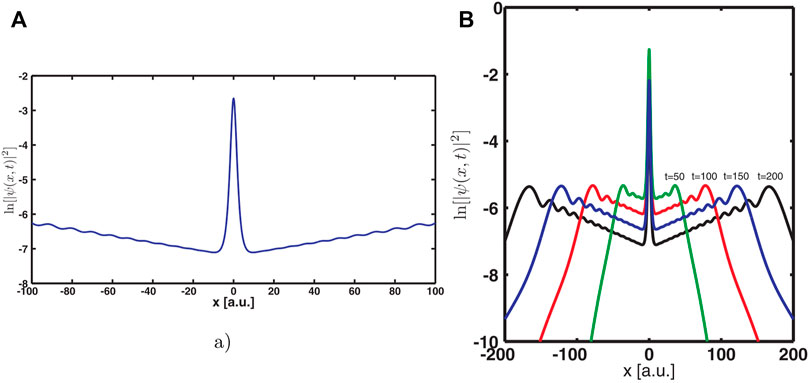
FIGURE 1. (A) Illustration of the asymptotic divergence of the resonance state density for the model potential
This seems to contradict the representation of resonances as the solutions of the time-dependent Schrödinger equation (TDSE) known as wavepackets. Since resonances are embedded in the continuous part of the spectrum they cannot be described using a single stationary eigenstate. Though, at any given time of the dynamics, the wavepackets are represented as superpositions of the (Hermitian) Hamiltonian eigenstates. Thus, wavepackets by definition are square integrable functions, i.e., their asymptotes decay exponentially and do not exponentially diverge.
The answer to this puzzle was given in Refs. [1, 3, 24]: before a wavepacket decays at the asymptote it actually diverges exponentially (at very large but finite distance from the interaction region). Figure 1B illustrates this point at different dynamic times. The conclusion is quite clear. It is appropriate to impose OBCs in order to describe a decaying system since the corresponding solution of the TISE with OBCs also display the same divergence as the wavepacket solution of the TDSE does.
So which method, out of the two, is recommended for calculating resonances? The answer is that neither of them can be recommended for realistic molecular systems. The reason is as follows: within Hermitian QM we cannot use the TISE and we are forced to solve the TDSE; this presents a major numerical difficulty when considering standard quantum chemistry packages for calculating resonance states. Within NHQM, solving the TISE with OBCs does not allow one to use square integrable basis sets, which transform the partial differential eigenvalue problem into a matrix eigenvalue problem, as in the Hermitian case. Therefore, a practical approach for describing resonances would be to transform the problem into the NH regime while retaining the square-integrability of the eigenstates. Such a procedure (the so-called complex scaling, which is described in the next section) can be used within many-body electronic structure formalism.
Let us briefly explain why the asymptote of the resonance wavefunction diverges exponentially in space but decays exponentially in time. The time-independent Schrödinger equation is given by,
where E = Ethreshold + |ℏk|2/(2m) and Ethreshold is the ionization/dissociation threshold energy. The asymptote of an eigenfunction associated with an above threshold energy and with only one open decay channel is given by,
The scattering matrix is the ratio between the amplitudes of the incoming [Ain(E)] and the outgoing [Aout(E)] waves. The poles of the scattering matrix are complex and the associated wavevectors take discrete values,
when ϕn ≥ 0, for which Ain(En) = 0 (see chapter 4 in Ref. [1]).
Therefore, since
the resonance function is not part of the Hilbert space. That is, it is not a square integrable function since it exponentially diverges in space. Due to this spatial behavior the resonance wavefuctions can not be expanded with a basis set of square integrable functions, as in the calculations of bound electronic states. Therefore we need to find out how we can transform the electronic coordinates such that the resonance wavefunction will remain square integrable and can be described as a finite linear combination of square integrable basis functions. As for example Gaussians which are used in standard electronic structure calculations.
Now, let’s turn to the exponential decay of the resonance function in time. The time phase factor
where En = ReEn + iImEn (and for resonances ImEn < 0) and the number of particles is conserved only when
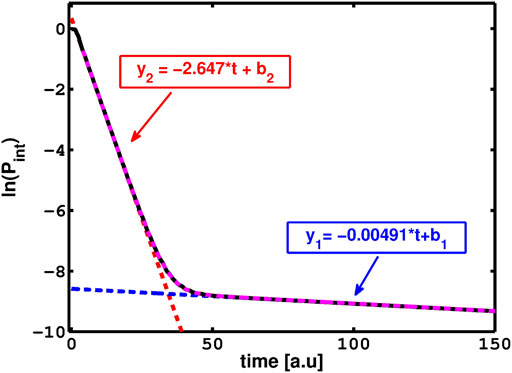
FIGURE 2. The survival probability, Pint = |⟨Ψ(0)|Ψ(t)⟩|2, as a function of time. The initial Gaussian mainly populates the two narrowest resonances of the model potential V(x) = (x2/2 + 0.8) exp(−0.2x2). The slope of each line represents the decay rate of each resonance. The larger slope (of y2) is the decay rate of the shorter resonance while the smaller slope (of y1) is for the longer (i.e. narrower) resonance. Reprinted by permission of the publisher (Taylor & Francis Ltd, http://www.tandfonline.com).
1.3 Complex Scaling Transformations in Order to Calculate Resonances by Methods Originally Developed for Bound States
It is straightforward to realize that Eq. 6, when r → reiθ and using Eq. 5, becomes,
when θ ≥ ϕn. And since (Eq. 5)
the condition θ ≥ ϕn yields,
Where {En} are the complex resonances energies, Γn = −2Im[En], m is the mass of the emitted particle (e.g., an electron) and Ethreshold is the ionization/dissociation threshold energy. For additional details see Chapter 5.2 in Ref. [1]. In such a case, the resonance state can be represented as a square integrable function, thus, it can be expanded in terms of localized basis functions (such as Gaussians), similarly to a bound state. Upon such complex coordinate rotation, the Hamiltonian becomes non-Hermitian and the complex resonance energies are obtained regardless of the value of the rotation angle θ inside the interval [θc, π/4]. (The upper limit on the θ interval is also explained in Chapter 5.2 in Ref. [1].)
This raises the question: is it possible to rotate the coordinate into the complex plane? If the physical potential is an analytical function, as in the case of atomic potentials, the coordinates of the system can be rotated into the complex half lower plane when θc < θ < π/4. However, the molecular electronic Hamiltonian within the Born-Oppenheimer approximation is singular at the nuclei positions and therefore a uniform analytical continuation into the complex plane by re → reeiθ is not allowed. This complication results in different methodologies for tackling this problem. The rigorous solution to this problem is to chose complex electronic coordinates that remain real inside an interaction volume, which include all the molecular nuclei. By that we avoid the singularities in the electron-nucleus attractive potential terms, and rotate the coordinate into the complex plane only out of the interaction volume by using θ. Section 4 presents several methods, which introduce such complex electronic coordinates that avoid these singularities. By using one of these complex electronic coordinates, the non-Hermitian (NH) Hamiltonian,
where
Here we are coming to a delicate point which is important for the RVP method. Rather than computing the complex matrix elements for a non-Hermitian Hamiltonian operator
where the complex diffuse Gaussians are given by [26],
and where η = αeiθ and the electronic vector position is re = (xe, ye, ze) centered on the nuclei RN = (xN, yN, zN). Notice that one needs to avoid the complex conjugate in the matrix elements (the so called c-product, see Ref. [1]) and therefore we get,
Examining the NH Hamiltonian matrix elements, one can see that going into the complex plane can be made even simpler. From Ref. [27] we know that the Hamiltonian matrix elements, unlike the operator itself, can be analytically dilated. Therefore, one does not even have to use complex diffuse Gaussians to obtain these matrix elements. Instead, one can calculate these elements as a function of the parameter η but with θ = 0, i.e., calculate the matrix elements as a function of α. Then, analytically dilate this parameter into the complex plane by substituting η = αeiθ. In other words, to simplify things further and avoid the use of complex diffuse Gaussian basis functions, one can use real diffuse Gaussian basis functions, which depend on the real parameter, α, and then make this parameter complex by taking θ ≠ 0. Doing so, one can obtain the NH matrix elements by using real functions and the real Hamiltonian.
Needless to say that even this kind of simplification is not straightforward to apply and requires the modifications of the standard (Hermitian) quantum chemistry packages, which include variety of ab-initio methods (based on MP (Møller Plesset perturbation theory), CI (configuration interaction), CC (coupled cluster) and more.
Here we are coming to the new approach we developed, in which we take one step further in the analytic continuation direction and replace the analytic dilation of the Hamiltonian matrix elements with that of a single eigenvalue. A proof of this point is given in the next two sections. Obviously, there is a great numerical advantage to analytical continuation of a single eigenvalue over an N × N matrix elements, where N is the number of basis functions employed. Since the Padé approximant (see Section 2.2) is used for the analytical continuation the method is know as Resonance via Padé (RVP). There are additional numerical advantages to RVP. Standard NHQM methods commonly work directly in the complex plane in order to calculate the resonance eigenvalue [6, 25–40]. RVP belongs to a subgroup of methods, which move into the NHQM regime via analytical continuation [41–44] It is based on the stabilization technique [45–49], where the real energy levels are plotted as a function of a parameter (α as denoted above) that controls the diffuseness of the Gaussian basis functions (see details in Section 2.1). The stabilization calculation, which is computationally the most demanding step, is followed by a very “cheap” analytical continuation step [50] (see Section 3). Therefore, analytical-continuation methods that are based on the stabilization technique hold two distinct advantages: First, Matsika and co-workers showed that the computation time required by the stabilization technique is an order of magnitude lower than the time required by a NHQM approach that works literally in the complex plane [43]. Second, the versatility in generating the stabilization graph opens the door for various applications. That is, stabilization graphs can be calculated using any standard quantum chemistry packages, with any existing Hermitian electronic structure method, see for example Ref. [44].
1.4 Proof of Concept for the Resonance via Padé Method for Small Hamiltonian Matrices
In this section we explain the concept behind the RVP method and its connection to the analytical continuation of the real Hamiltonian matrix elements (HMEs); we stated above that in order to calculate resonances in the complex plane one can analytically dilate the real HMEs into the complex plane. This means that in order to calculate resonances one needs to obtain the matrix elements as a function of a real parameter, α. Therefore, the characteristic polynomial for this matrix will also depend on α, and in turn the solution of this polynomial will also depend on α. The solution of this polynomial is in fact the eigenvalue (energy level) that we are looking for. We conclude that if the real Hamiltonian matrix elements can be analytically dilated into the complex plane, also the eigenvalues can be dilated into the complex plane. Further details are given below.
Thus, one can avoid the numerical diagonalization of a non-Hermitian complex matrix and replace it with Hermitian electronic-structure calculations that yield real eigenvalues, which can be dilated into to complex plane. Similarly, one can carry out dilation into the complex plane and obtain complex properties other than the energy, such as complex dipole transitions and other properties that are calculated as expectation values. This is because the eigenvectors can be expressed as a linear combination of the HMEs, therefore we claim that they also depend on α, and can be analytically dilated into the complex plane. Thus, one can avoid the numerical calculations of the eigenvectors of the non-Hermitian complex matrix, and obtain complex energies and expectation values by analytical continuation.
Unfortunately, closed form expressions of the eigenvalues and eigenvectors as function of the HMEs are known only for small Hamiltonian matrices, i.e., less than 5 × 5. Namely, such closed form expressions are known only for Hamiltonian matrices constructed from two, three or four basis functions. Nevertheless, we can use the Padé approximant in order to get closed form expressions for the eigenvalues and expectation values for relatively large matrices, which are typically used in electronic structure calculations. However, before going into the procedure for large and finite analytical expressions (that are required for actual chemical problems) we want to establish the proof for the small dimensional matrices.
Let us show it for the simple 2 × 2 Hamiltonian matrix. The HMEs are function of a real scaling parameter η, where we chose η = αeiθ with θ = 0. The eigenvalues are given by
It is clear that if the HMEs are known analytical functions of η, one can dilate them into the complex plane by substituting complex values for η → αeiθ with θ ≠ 0. Then, analytically calculate the stationary points in the complex plane (to satisfy the complex variational principle as described in Ref. [1]). The stationary points are associated with the resonance complex eigenvalues, where Re[E±] are the energy positions and − 2Im[E±] = Γ are the widths. Similarly, the real dipole transitions can be expressed as function of a real scaling parameter,
For the 2 × 2 real Hamiltonian matrix case the vectors [Ψ±(η)] are analytically obtained as function of the real HMEs. The components of the eigenvectors
where
Thus the complex dipole transitions can be associated with stationary solutions in the complex plane obtained by analytic dilation of D+,−(η) into the complex plane.
Similar expressions can be derived for the 3 × 3 and 4 × 4 cases. However, for larger matrices we shell use the Padé approximant in order to get closed form expressions for the eigenvalues and dipole transitions as a function of (a real) η. And then, carry out the analytical continuation into the complex plane and look for stationary solutions, which are associated with the resonance positions and widths or the complex dipole transitions, as detailed in Section 2 and Section 3.
1.5 Resonance via Padé for a Large and Finite Sized Hamiltonian Matrix
In the above section we saw that complex resonance eigenvalues and dipole transitions can be obtained by analytical continuation from real eigenvalues and dipole transitions, which are obtained from standard (Hermitian and real) calculations. However, this analysis is limited to small number of basis functions (<5) for which we have closed form analytical expressions. The extension of this approach to large matrices, i.e., to large number of basis functions, requires the use of a numerical scheme to describe either
and,
The main question is from where do we get the data from which we will fit the coefficients in the above expression. The answer to this question is that we take it from stabilization graphs, see Section 2.1 for more details.
Other questions we need to answer are:
(Q1) How to select the initial real data points from the stabilization graphs?
(Q2) How to select the Np, Nq or Mp, Mq parameters of the polynomials?
(Q3) How to optimize the real approximated polynomial expansions, i.e., the aj,p, bj,q or cj,j′,p, dj,j′,q coefficients, to the ab-initio stabilization calculations?
(Q4) How to locate the stationary solutions in the complex plane, which are associated with the resonance positions and widths or with the complex transition dipoles?
These questions are answered in Section 2 (specifically Section 2.2), which discusses the RVP formalism in details.
2 The Resonance via Padé Method—Resonance via Padé in Practice for Large Hamiltonian Matrices
2.1 Real Stabilization Graphs
As mentioned above, our new approach to introduce non-Hermiticity and obtain resonances is by analytic dilation of eigenvalues from the stable part of a stabilization graph into the complex plane. Since we use the Padé approximant as our analytical continuation method, we call our new approach Resonance Via Padé, RVP. This approach, unlike uniform complex scaling, uses standard, Hermitian, calculations to obtain the resonance position and width, and does not modify the Hamiltonian.
In the RVP method, as a first step, the energy spectrum is calculated using Hermitian codes as a function of a generalized box quantization parameter, E(α) where α = η (with θ = 0 and η = αeiθ). For example, the eigenvalues can be calculated as a function of the number of basis functions (BFs) [45] or when finite given BFs are scaled by a real factor [47, 48, 51]. In practice, to scale the BFs by a real factor, one can use Gaussian base functions and divide the exponents of the Gaussians by the real factor α (see Eq. 11). Calculating the energy spectrum with these BFs will produce E(α). Note that in this case, α < 1 will cause the spatial distribution of the Gaussians to compress, and α > 1 will cause it to expand. Therefore, we typically employ the range: 0.6 < α < 2.0.
In such calculations, when continuously increasing α, the discrete energy levels of the quasi-continuum spectra are highly affected (i.e., lowered). Resonance states, unlike the delocalized quasi-continuum states are much less affected by small variations of α [1, 52], since resonance states are typically much more localized in the interaction region, see Figures 3.5 and 3.6 in Ref. [1]. Therefore, while quasi-continuum states significantly change as α is varied, resonance states remain relatively stable. This is why a graph portraying E(α) as function of α around the resonance energy is named a stabilization graph, as illustrated in Figure 3A.
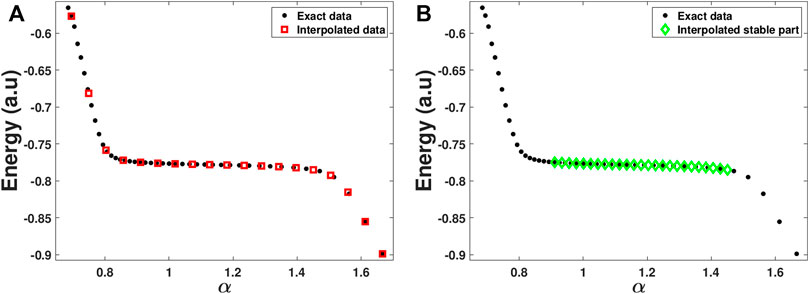
FIGURE 3. The stabilization graph of the He**(2s2) resonance state, where the real energy level is plotted as a function of a real parameter (α) that controls the diffuseness of the Gaussian basis functions. The plot illustrates the different steps within the automated RVP algorithm. (A) Calculated (black circles) and interpolated (red squares) data points. (B) The interpolated stable region produced by step 1 of the automated RVP algorithm (green diamonds) that serves as input for the Padé/Schlessinger point method.
In such a graph, an energy level crossing is expected between the highly affected delocalized quasi-continuum states and the stable resonance energy. However, since states with the same symmetry cannot cross each other in the adiabatic representation, avoided crossings are obtained in the graph. In these avoided crossings, a transition from a localized state to a delocalized quasi-continuum state occurs. Therefore, the avoided crossings are associated with branch points (BPs) in the complex energy plane (see chapter 9 in Ref. [1]). Consequently, E(α) is not an analytic function of α.
Nevertheless, while the avoided crossings correspond to a mixing between two functions: a localized function and a delocalized quasi-continuum function, the stable part of the stabilization graph, in between two avoided crossings, corresponds to a single function, localized in the interaction region. Therefore, the stable part of the stabilization is expected to be locally analytic, while the avoided crossings are expected to be non-analytic. Thus, the stable regions contain all the relevant information for analytical continuation into the complex plane. A numerical proof for this point is given in Refs. [52, 53] and the figures within.
This is how the RVP approach avoids the non-analytic parts in the stabilization graph. In this approach, a single energy level, obtained from the stable part of the stabilization graph, is analytically dilated using the Padé approximant. Namely, the stable part of the stabilization graph, which has a smaller slope than the unbound energies [46], is fitted as a function of a real scaling parameter to a ratio between two polynomials (like Eq. 13):
where P(α) and Q(α) are polynomial functions of a real scaling parameter, α. As the focus of the analytic continuation scheme is not on the avoided crossing regions, but rather on the stable part of the stabilization graph, excellent results are obtained [50, 53].
2.2 Resonances by Analytical Continuation of the Padé-Schlessinger Method Into the Complex Energy Plane
As previously explained, the stable part of the stabilization graph is expected to be locally analytic. Yet this is not all, this stable region is also known to contain information on the resonance lifetime. It has already been shown by Hazi and Taylor. [46], that the slope of the stable region is related to the width of the resonance. That is, as the resonance width increases the slope of the stable part increases. Furthermore, as shown in Section 3.4 in Ref. [1] (and Figures 3.4–3.8 wherein), one can even estimate the resonance width by analysing the localized function that is associated with the stable region’s eigenvalues. In this case, the width is proportional to the square of the ratio between the normalized amplitude of the function out of the interacting region and in the interaction region. So, the stable region in a stabilization graph contains enough information on the resonance lifetime and all the relevant information for analytic dilation into the complex plane.
Therefore, it is clear why this region should be used if one wants to carry analytical continuation to the complex plane and gain insight on the resonance lifetime. In other words, the answer to Q1 in Section 1.5 is clear - the initial real data points from the stabilization graphs one needs to use is the data from the stable part of the stabilization graph.
Indeed, as a second step in the RVP method, data from the stable region is analytically dilated into the complex plane using the Padé approximant (Eq. 15) in order to locate stationary points (SPs), resonances. In Ref. [53], an analytical path from the stable region towards a complex stationary point is shown. This path goes between the BPs and bypass them. This is an additional proof that using Padé, one can always remain on an analytic path in the complex plane that goes towards a stationary point. Notice that the existence of such a path results from the use of a finite basis set, which are always used in any electronic-structure calculation [53].
In practice, within the RVP method, an analytic Padé function is fitted using the Schlessinger point method [54] to data from the stable region. The Schlessinger point method requires a set of M data points (αi) and their corresponding eigenvalues (Ei), and then the Schlessinger truncated continued fraction assumes the following form:
where the zi coefficients need to be determined recursively such that
This truncated continued fraction can be transformed to a Padé like form (Eq. 15). Thus, by choosing to use the Schlessinger point method for the Padé approximant, one obtains automatically from the data points, all the information on the Padé function, namely the answers to Q2 and Q3 in Section 1.5 above. Q2 deals with the degree of the polynomials in the Padé function, and Q3 deals with their coefficients. Clearly, both are determined by the data set itself satisfying Eq. 17.
Once the zi coefficients are determined, and Eq. 16 is completed, an analytic continuation into the complex plane is performed. This is done by substituting a complex η, instead of α, i.e. η = αeiθ with θ ≠ 0. Then, SPs, resonances, can be identified by generating α- and θ-trajectories and looking for cusps in the complex plane [52, 55]. Alternatively, SPs can be identified by solving the algebraic equation
To sum up, by using the RVP method, analytic continuation of a single eigenvalue level into the complex plane can be employed, provided that the input data is taken from the stable region of a stabilization graph since it is a local analytic region. Therefore, we can divide the RVP method to three steps. In the first step the stable region data is fitted into a Padé/Schlessinger function and dilated into the complex plane. An analytic path from the stable region to the complex SPs, which avoids any of the BPs, exist when a finite basis set is employed. In the second step, the SPs are located using the algebraic equation
3 Automatic Calculations of Resonances by the Resonance via Padé Method: The “Push of a Button Approach”
Based on all the knowledge we have reviewed in this body of work, and all the knowledge we have accumulated throughout the years on the RVP method, recently we were able to take the next step in implementing the RVP method, and produced an automated RVP package (https://pypi.org/project/automatic-rvp/). This package, given a stabilization graph from other Hermitian computations, is able, in the click of a button, of automatically calculating the resonance energy and width and presenting it with the relevant statistical data. Doing so, the package goes through three steps:
1. Recognizing the analytical part of the stabilization graph.
2. Constructing RVP approximation for different inputs.
3. Running statistics.
In the first step, the package is given a stabilization graph produced by other Hermitian computations, and its goal is to recognize the analytical, stable, part of the graph. Practically, the package gets as input the α values as the x variables, and the real energy values (E) as the y variables, f(x), (black circles in Figure 3A).
At first, the package interpolates the data between min(α) to max(α) through the makima interpolation [56–58], and estimates the y values of equally distributed x values. The number of these x values is 40% of the initial α values, and they are ranging from min(α) to max(α). In this point, we have two sets of data: the initial set of α and E values (black circles in Figure 3A), and the interpolated set of x and y values (red squares in Figure 3A). The interpolated set aim is to portray the structure of the function f(x) in a general form, without any focus on small deviation in the original data.
Next, the package identifies the stable region of the stabilization graph. It does so by looking for two consecutive data points in the interpolated set, which have the smallest numerical slope between them. Afterwards, the slope between this couple and all the other data points in the interpolated set is calculated. Then the package looks for all the data points in the interpolated set that are adjacent to the couple and have a slope value between 70% and 130% of the original slope found. If the number of points that meet this criterion is more than or equal to 10, the package proceed to the next stage and sets the range between the min(x) found and the max(x) found as the x range corresponding to the analytical, stable, part of the stabilization graph. If the number of points is less than 10, the package looks for two other consecutive data points in the interpolated set, which have the second smallest numerical slope between them, and so on.
In the next stage, the package checks the number of α values it has in the x range it found. If the number is smaller than 25, the package produces an error message. If not, the package estimates through the makima interpolation, the y values of equally distributed 25 x values in the range it found. These 25 x points and their y values are considered as the analytical, stable, part of the stabilization graph (see the green diamonds in Figure 3B). The aim of this stage is to avoid overfitting of data, therefore the data is interpolated over the range of x found in the previous stage.
In step 2 of the package, the data is divided into all possible subset containing between 8 and 25 consecutive data points. Each subset is fitted to a Padé approximant, which is stored as a symbolic function [59]. This symbolic function is later derived to find the SPs. Convergence of the SPs is checked with respect to the number of input points (M from Eq. 16 and 17), and the difference between CM(η) and CM−1(η) is reported as the error of the SP [53]. At the end of this step, all of the SPs, with their α, θ and error values, are collected.
In step 3 of the package, the collected SPs are first screened: SPs with more than 25% error in their imaginary energy part are thrown out. The number of SPs left is termed n. Later, the collection of SPs is normalized in the real and imaginary energy axes. This stage aims to an equal distribution of SPs for every problem, so the next stage in the package can be problem-independent.
In the next stage, the packages looks for clusters according to the DBSCAN algorithm [60]. This algorithm requires two parameters: ϵ which is the maximal distance between 2 core points of the cluster, and minPT which is the minimum number of points required to form a cluster. In our case, minPT is the minimum between 100 and 8% of n, and ϵ is varied in iterations between 0.001 and 5 in leaps of 0.001.
In every iteration, the clusters are screened, and all of the physical clusters are evaluated and graded between 1 and 3, based on their size and standard deviation. The higher the grade is, the better the cluster is: We are looking for a cluster as big as possible, with the smallest standard deviation possible. All the clusters, together with their grades are stored. In the next iteration, ϵ is raised, and the newly found physical clusters are graded. This time, the clusters are compared to the stored clusters. Any cluster that was upgraded, is deleted from the storage and is saved with the new data and grade. Any new clusters with a grade of 1 or 2 is also stored. All the other clusters are thrown away, and then ϵ is raised again in iterations, until it reaches a value of 5.
At the end of this stage, the package reports all the stored clusters with a grade 3 or 2. In addition to the cluster mean real energy and mean imaginary energy, the package presents the following statistical data: the cluster grade, the real energy standard deviation, the imaginary energy standard deviation, the imaginary energy coefficient of variance, the mean α value, the α standard deviation, the mean θ value, the θ standard deviation, the ϵ in which the cluster was found, the size of the cluster and the size of the cluster in percentage relative to n.
Of course, all of these steps are transparent to the end user, and given the stabilization graph, one gets, at the push of a button, a list of clusters containing the resonance mean energy and width and the above statistical data. Additionally, the user is also presented with the stabilization graph, on which the chosen stable part is marked. Yet, it is important to note that the package is also modular, and the user can change every parameter marked in bold in the above description. Furthermore, the user can choose, if desired, to run all the steps together or to run only some step individually.
4 The Equivalence Between Resonance via Padé and Other Non-Hermitian Methods in Chemistry
RVP belongs to the group of methods that operate within the non-Hermitian (NH) quantum mechanics (QM) formalism [6, 25–40]. Other NH methods that are considered herein are: complex scaling, complex basis function and reflection-free complex absorbing potential. The equivalence between the different methods is illustrated below by comparing the complex electronic coordinate, which are obtained by RVP and by the other NH methods. Notice that these complex electronic coordinate remain real inside the interaction region as discussed in Section 1.3 above.
The most straightforward approach for studying resonances is complex scaling (CS) [1, 2]. In this approach the coordinates are rotated into the complex plane, i.e., the method is associated with a contour of integration that is rotated into the complex plane. The scaling can be uniform or partial. Uniform scaling is associated with a uniform complex contour (UCC), in which
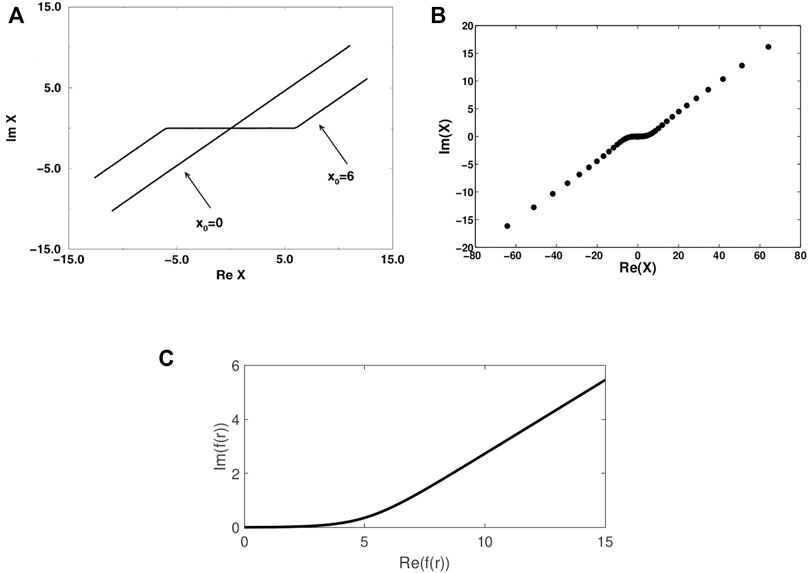
FIGURE 4. (A) A schematic representation of a uniform (x0 = 0) and exterior (x0 = 6) complex contours of integration for calculating the non-Hermitian Hamiltonian matrix elements (Reprinted from Ref. [2], Copyright (1998), with permission from Elsevier). (B) and (C) presents smooth exterior complex contours from numerical calculations using (B) CBF (Reprinted (adapted) with permission Ref. [62]. Copyright (2016) American Chemical Society) and (C) RVP (Reprinted (adapted) with permission Ref. [63]. Copyright (2021) American Chemical Society), as described in the text.
Another approach for studying resonances is to augment the physical Hamiltonian with a complex absorbing potential (CAP) in order to guarantee that the asymptotes of the resonance eigenfunctions decay to zero. However, the CAP must be a reflection-free CAP (RF-CAP) in order to perfectly absorb and avoid generation of reflections, which temper with the description of the resonance wavefunction in the interior region [61]. If the CAP is not a RF-CAP one should remove the artificial effect of the CAP on the solutions of the time-independent Schrödeinger equation. Note that it is challenging to remove this effect within the framework of finite basis set calculations, however, schemes for such a removal can be found in Refs. [6, 64, 65]. The RF-CAP, on the contrary, is a perfectly absorbing potential, which avoids the reflection problem by definition. Importantly, the absorbing potential introduced within the RF-CAP method, is derived from a complex contour of integration, specifically, using a SECC. Therefore, the equivalence between CS and RF-CAP emerges directly from the construction of the absorbing potential [61].
Alternatively, it is possible to use complex basis functions (CBFs), i.e., complex Gaussian functions [25, 26, 38, 39]. Within the CBF approach one can carry out analytical continuation of the Hamiltonian matrix elements (as discussed in Section 1.4), in which the Gaussian exponential parameters are scaled by e−2iθ (and fixing the stretching parameter α = 1). CBF can be used uniformly, if all the Gaussian basis functions are scaled by the complex factor, or partially, if only the diffuse basis functions are scaled. Importantly, the CBF method is also associated with a complex contour of integration [62, 63]. Such a complex CBF contour can be obtained by diagonalizing the matrix of the one-particle coordinate operator
RVP is conceptually equivalent to CBF, however here the basis functions are scaled by a real parameter η = αeiθ with θ = 0. Again, the scaling can be done uniformly, such that all the basis functions are scaled, or partially, in which only the diffuse basis functions are scaled. Calculating the RVP complex contour is done in two steps. First, the contour is obtained in a similar fashion to CBF, but here the contour lay on the real axis. Next, by dilating it into the complex plane we obtain the complex RVP contour. We do it in a similar manner to the analytical continuation employed in RVP for the energies (see details in Section 2.2), but unlike the energy case here we substitute into the fitted Padé function the scaling parameters that yield the resonance energy, i.e.,
The ability to associate a complex coordinate contours for CS, RF-CAP, CBF and RVP suggests similarities between these NHQM methods. The rationale behind this is that all these NHQM methods introduce, indirectly, outgoing boundary conditions to the many-electron problem, which manifests in a complex contour of integration.
5 Resonance via Padé: Calculations of Resonance Positions, Widths and Complex Dipole Transitions From Standard-Hermitian Quantum Chemistry Packages
Below we present several illustrative applications of RVP for atomic and molecular systems. Atomic helium, the triplet Van-der Walls 3He*−H2 supermolecule, and the RNA base uracil anion. Helium was chosen as a benchmark due to the availability of extremely accurate reference complex energies and transition dipoles. 3He*−H2 was chosen since it illustrates the remarkable agreement of the theoretical RVP calculations with the cold-collision experimental results. Moreover, while the excited helium is in the 3S state (in the He(3S,1s2s) + H2 collision) the agreement between the calculated and measured reaction rates where not so sensitive to the accuracy of the calculated resonance width. However, for the He(3P,1s2p) + H2 case the agreement between theory and experiment were obtained only for accurate calculations of the width. The agreement between the quantum RVP calculations and the cold-chemistry measurements illustrates the capabilities of our method. The uracil anion example illustrates the ability of RVP in carrying out NHQM ab-initio calculations for many-electron many-atom molecules with biological interest.
5.1 Benchmarking of the Resonance via Padé Approach for Complex Energies as Well as for Complex Dipole Transitions
5.1.1 Complex Energies–Positions and Widths
In previous studies RVP was benchmark by examining several small-to medium-size chemical systems for which there exist reliable and accurate experimental data or theoretical values. These systems include the doubly-excited Feshbach states of: helium (multiple states) [50, 53], H− (2s2) [53], beryllium (1s22p3s1P) [63] and H2 (1
One of the best system for studying autoionization is the doubly-excited He** atom (Eq. 2) since exact calculations (i.e., converged non-relativistic energies) are available [69–72]. In addition, very accurate complex transition dipole values that can be used as a reference have been reported [73]. Helium is a two electron system, hence it is possible to calculate its resonance positions and widths using full configuration interaction (FCI) and complex scaling (CS) with a very large and highly optimized one-electron basis set (ExTG5G), these CS/FCI/ExTG5G [36, 73] energies are in perfect agreement with the exact ones [69–72]. From the electronic structure point of view FCI involve no approximation, therefore comparing our FCI/RVP with the reference FCI/CS allows for a pure comparison between the two non-Hermitian methodologies. Furthermore, there are several doubly-excited He** resonance states, which allows examining the performance of RVP in case of multiple resonances; that is, we tested the reliability of the computed energy difference between resonance states. Therefore, it is also suitable for examining the quality of the RVP transition dipoles between resonance states.
The five lowest doubly-excited resonance states of He** are calculated and compared with the exact values [69–72]. Clearly, from Figure 5 and Table 1 the RVP energies are in remarkable agreement with the exact ones. Notice that this agreement is further improved by increasing the size of the basis set used within the RVP calculations, as presented in Ref. [74].
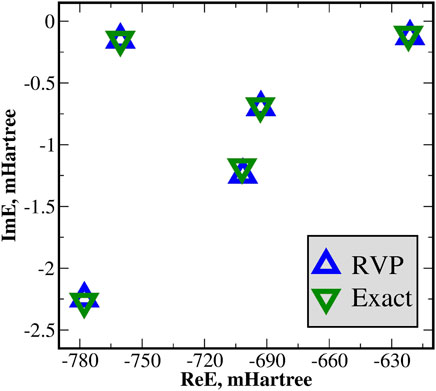
FIGURE 5. The RVP complex energies (ReE+iImE) of the doubly excited Feshbach He** states contrasted with the exact values, in mHartree. These energies are also presented in Table 1. The RVP energies are in remarkable agreement with the exact ones. Reprinted (adapted) with permission Ref. [50]. Copyright (2019) American Chemical Society.
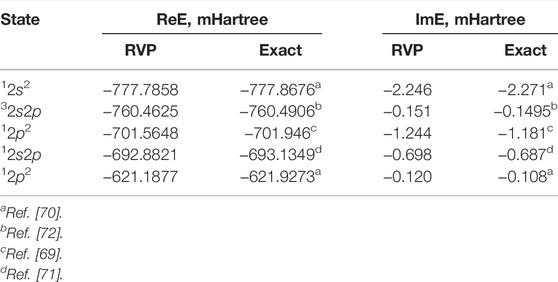
TABLE 1. Multiple complex energies of the doubly-excited He** Feshbach states; RVP vs. exact values. These values are also represented graphically in Figure 5. Reprinted (adapted) with permission Ref. [50]. Copyright (2019) American Chemical Society.
5.1.2 Complex Transitions Dipole
Table 2 presents the complex dipole transitions between different electronic states of helium. The transitions shown on the left column correspond to the labeling presented in Figure 6. Since these dipoles involve transitions from bound or resonance states always into a resonance state they become complex in accordance with the non-Hermitian theory. The reference values in Table 2 corresponds to very accurate theoretical values obtained by a CS/FCI with a very large ExTG5G basis set, see Refs. [36, 75] for details. These values can be regarded as exact since ExTG5G is highly-extended and optimised even for treating highly excited helium Rydberg states. In order to calculate the RVP transition dipoles we use two different basis sets, Basis-I and Basis-II. They are obtained by truncating the ExTG5G basis set, i.e., by omitting the most diffuse basis functions (which are essential for studying highly excited Rydberg states). Basis-I is a more extended basis set than Basis-II. Both basis sets yield good agreement with the reference CS values. For the real part of the transition dipoles, Reμ, RVP is converged since the difference between Basis-I and Basis-II is very small, nevertheless the agreement of Basis-I with the reference values is better than that of Basis-II. For the imaginary part of the transition dipoles, Imμ, Basis-I clearly works better than Basis-II. Seven out of the total eight transitions calculated with Basis-I are in better agreement with the reference values than the Basis-II results. For the eighth transition, from the 2nd to the 6th states, both Basis-I and Basis-II give the same error with respect to the reference value. Since the RVP complex transition dipoles are in agreement with the very accurate FCI/CS/ExTG5G dipoles and since the trend of the results with respect to the size of the basis set behave as expected, we conclude that the RVP approach is suitable for calculating electronic properties other than energies.
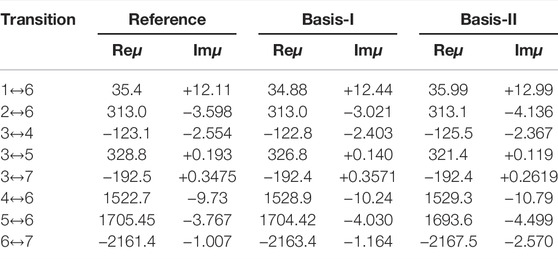
TABLE 2. Complex transition dipoles of helium in milli-atomic units. The state labels in the first column corresponds to the labels in Figure 6. The reference values refer to a very accurate results obtained by complex scaling (CS) and full configuration interaction (FCI) with a very large (ExTG5G) basis set [36, 75]. The RVP transition dipoles are calculated using two type of truncated ExTG5G basis sets, where Basis-I is larger than Basis-II. Reprinted (adapted) with permission Ref. [74]. Copyright (2020) American Chemical Society.
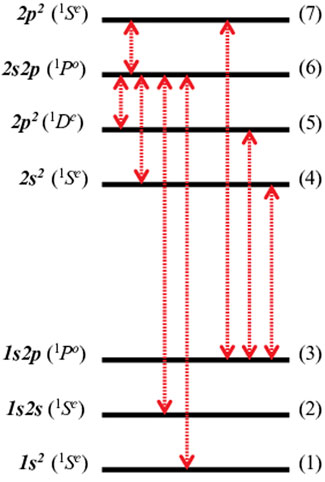
FIGURE 6. A schematic representation of the atomic helium energy levels. The singly and doubly excited states correspond to bound and resonance states, respectively. There are three bound states (at the bottom of the figure) and four resonance states (at the top). The left-hand side shows the spectroscopic atomic term symbols, which are associated with the index lables (shown on the right-hand side). The red double arrows represent the dipole allowed transitions, these eight complex dipoles are presented in Table 2. Reprinted (adapted) with permission Ref. [74]. Copyright (2020) American Chemical Society.
5.2 Complex Potential Energy Surfaces for 3He*−H2 Penning Ionization Reaction
The calculated RVP complex potential energy surfaces (CPESs) that are presented below play a crucial role in the interpretation and analysis of the reaction rates (RRs) measured in cold molecular collision.
5.2.1 He(3S,1s2s) + H2
Herein, we present investigation of the following molecular reaction:
He(3S,1s2s) + H2 → [He*−H2] → He(1S,1s2) +
which allows direct comparison with the experimental results. Thus, it can be considered as an additional benchmarking of RVP. This particular Penning ionization process was studied experimentally at very low temperatures [76]. That is, experimental cold-chemistry RRs are available. RR calculations require the CPES of the He*−H2 supermolecule, which is obtained from the RVP complex eigenvalues as a function of the geometrical configuration of this system. The sensitivity of such a quantum process to the CPES structure poses a challenge to any state-of-the-art ab-initio calculations since autoionization becomes more pronounced as the temperature decline.
The computational details are: the real PES and the stabilization graphs are calculated with the equation-of-motion coupled cluster (EOM-CC) method with singles, doubles, and perturbative triples corrections [EOM-CCSD(dT)] [77]. The 1S ground state of He–H2 is the reference configuration used to calculate the target 3S resonance state. For the basis set we use the primitive 5ZP set [78]. The hydrogen molecule is treated as a rigid rotor with a fixed distance, r0 = 0.74085 Å. The distance R varied over a wide range, while the angle is restricted to ϕ = 0 and ϕ = π/2. See Figure 7 for the definition of these parameters. Using these two angles we can expressed the CPES, E(R, ϕ), as a power series (in cos ϕ). See Ref. [67] for additional details.
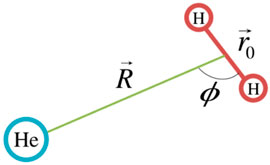
FIGURE 7. Schematic representation of the He*−H2 supermolecule. Reprinted (adapted) with permission Ref. [67]. Copyright (2017) American Chemical Society.
Figure 8 displays the real potential curve (blue) for the He* − H2 supermolecule at ϕ = π/2 (T-shape). In addition, it shows a schematic representation of the RVP decay rates using red arrows (the actual RVP calculations are presented below), where a darker shade corresponds to a faster decay, and a lighter shade to a slower decay. The autoionization state decays into the potential energy curve of the cation ground state of the supermolecule (green). The cation surface represents the ionization threshold for this autoionization process. The area of interest, in which the autoionization was observed experimentally [76], is shown as inset in Figure 8. A shallow potential well is exposed, which could be overlooked on larger scale, see the black rectangle on the blue curve in Figure 8. The depth of the well for the T-shape and linear (not shown here) geometries is around 2.87 × 10⁻⁵ and 5.012 × 10⁻⁵ Hartree (6.3 and 11 cm−1), respectively, which emphasizes the need for a highly accurate CPES.
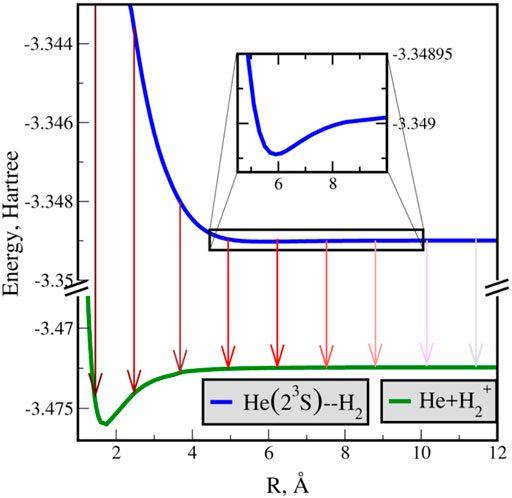
FIGURE 8. Potential energy curves of the neutral-excited (He(3S,1s2s) + H2, in blue) and cation (He(1S,1s2) +
The CPES is obtained by recalculating the RVP complex energies at each molecular configuration. That is, calculating at different distances, R at for both T-shape and linear geometries. The position [ReE(R, ϕ)] and decay rate [Γ(R, ϕ) = −2ImE(R, ϕ)], for the T-shape geometry of He*−H2 are presented in Figures 9A,B, respectively. From Figure 9A it is clearly seen that the depth of the potential well remains unchanged after analytic continuation. Thus, the approximation of the resonance as bound state in the continuum is justified, however this approximation does not provide the decay rate of the resonance state. The calculated RVP decay rate, Figure 9B, is fitted into a single exponential curve (or linear in logarithmic scale, see inset). The Penning ionization decay rate is associated with a single exponential function [79]. Therefore, we conclude that the autoionization process under study corresponds to a Penning ionization. A similar behavior was also observed for the complex potential of the linear geometry (not shown).
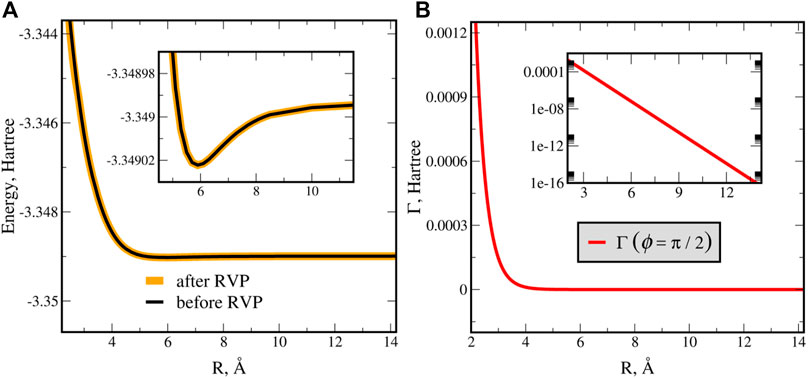
FIGURE 9. The RVP complex potential energy surface in T-shape (ϕ = π/2) geometry of He(3S,1s2s) + H2. The real part is presented in panel (A), where the inset zooms into the shallow well. The orange curve (the real part (ReE(R)) of the complex RVP curve) and the black curve (the approximated Hermitian calculations) are in agreement. The imaginary part, i.e., the decay rate (Γ(R) = −2ImE(R)), is presented in panel (B). The decay rate fits into a single exponential curve (see inset in logarithmic scale), which confirms that this autoionization is a Penning ionization [79]. Reprinted (adapted) with permission Ref. [67]. Copyright (2017) American Chemical Society.
Next, the ab-initio RVP CPES was used to compute the RRs for the above collision with ortho- and para-hydrogen molecules. The CPES is represented as a truncated interaction potential [E(R, ϕ) → V(R, ϕ)], which is expressed as a power series (in cos ϕ) [67]. Then, we solve the nuclear time-independent Schrödeinger equation with V(R, ϕ) for the metastable and cationic product. The nuclear eigenvalues and eigenfunctions of the metastable state and product state were integrated into the scattering theory to compute the RRs. The computing of the RRs were done by using the non-Hermitian time independent scattering theory (see derivation given in Chapter 8 of Ref. [1] and references therein) within the framework of the adiabatic approximation first derived for cold molecular collisions in Ref. [80].
Figure 10 presents the RRs calculated with the RVP CPES and measured by the cold-chemistry experiment. The experimental curves is in blue and our theoretical findings in red, we observe excellent agreement for both the para-H2 and ortho-H2 cases. Notice that our results are within the experimental uncertainty, see Ref. [67] for details. In addition, the theoretical RRs are calculated in an ab-initio fashion without any fitting parameters, where only the Planck’s constant, charges, and masses of the electrons and nuclei were used as input parameters. It demonstrate the accuracy of the calculated CPES, which allows interpretation of the observed resonance phenomena. Finally, it illustrates the universality of the RVP approach in calculating CPESs and reaction rates for any many-atom system in any decay process.
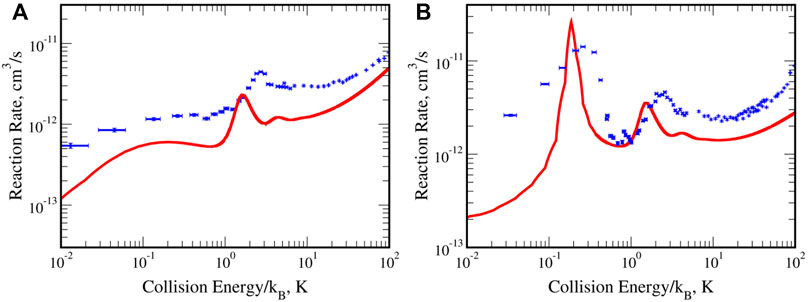
FIGURE 10. The reaction rates for the He(3S,1s2s) + H2 collision. Panel (A) for H2 in its rotational ground state (para) and (B) in its first excited state (ortho). The peaks are associated with nuclear resonances of the He*−H2 supermolecule. Reprinted (adapted) with permission Ref. [67]. Copyright (2017) American Chemical Society.
The RVP reaction rate [67], in red, is in excellent agreement with the experimental one [81], in blue. The theoretical results are computed using the RVP ab-initio complex potential energy surface, without using any fitting parameter. Adopted from Ref. [67].
5.2.2 He(3P,1s2p) + H2
In an additional cold chemistry experiment, structures in the measured RRs, associated with resonances, were reported in a collision between the ground-state hydrogen isotopologues (H2/HD) with helium atoms, but now, in an excited triplet P-state [82]. That is:
He(3P,1s2p) + H2 → [He*−H2] → He(1S,1s2) +
A theoretical explanation of the appearance of these structures was not given. However, in Ref. [68] we presented a quantum ab-initio calculation that interpreted this experiment. This emphasis the need for proper CPESs, in which the real and imaginary parts are computed at the same level of theory.
The RVP CPESs were calculated using the two of the most symmetric orientations of the supermolecule, ϕ = 0 and ϕ = π/2, i.e., with H2 perpendicular and parallel to the collision trajectory. The computational details are similar to the ones given in the 3S case. The linear configuration give rise to one Σ and one Π states since He is in a P state. Whereas, the T-shape configuration display the C2v point group symmetry and give rise to three potentials with A1, B1, and B2 symmetries. Therefore, five different potential curves are obtained. Figure 11 present these complex potentials, where the real parts (ReE(R)) are presented in Figure 11A, showing three attractive and two repulsive curves. The imaginary part is shown in Figure 11B, where each decay rate curve fits into a single exponential curve (or liner in logarithmic scale). This suggests that this autoionizations are Penning ionizations [79]. B1, which has the most attractive potential (with about 4800 K depth at 2Å) and also has the highest decay rate (in black), is the dominated potential in the reaction rate calculations, as discussed below.
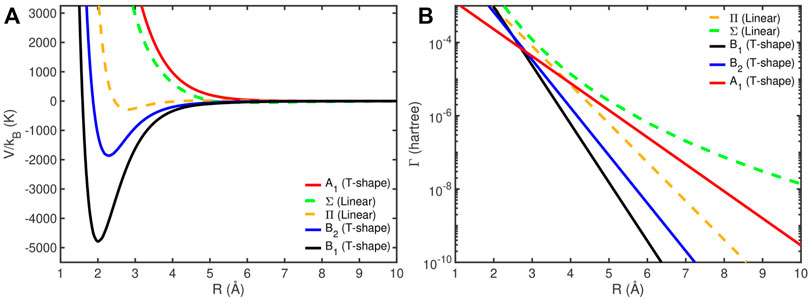
FIGURE 11. The RVP complex potential energy surface of He(3P,1s2p) + H2 in T-shape and linear geometries. The real part (ReE(R)) is presented in panel (A). The decay rate (Γ(R) = −2ImE(R)) is presented in panel (B) in logarithmic scale. Reprinted (adapted) with permission Ref. [68]. Copyright (2019) American Chemical Society.
Next we identify these CPESs as the interaction potentials in the nuclear Hamiltonian [E(R, ϕ) → V(R, ϕ)], again, expressed as a power series (in cosϕ), see Ref. [68] for details. The RRs were calculated using the solutions of the nuclear time-independent Schrödeinger equation. The experimentally measured RRs found that the Penning ionization product weight is 90% at all collision energies [82]. Therefore, we assumed that Penning ionization dominated the whole process. The theoretical Penning-ionization RR obtained for the He(23P) + H2 system is shown in Figure 12. Notice that H2 is in the ground (J = 0) para state of the rotational levels. It is possible to recover pure para-hydrogen in a cold-collision experiment, which makes the para-H2 an exciting molecular species to study. The figure compares the theoretical RR (in blue) with the experimental one (in black) for the temperature range of 0.01–100 K. In addition, we also report the RR for the He(23P) + HD(J = 0) case, it is behavior is nearly identical to the He(23P) + H2(J = 0) case. Finally, the Langevin power law is shown (in red dashed line), which scales as E1/6. The Langevin power law was calculated with a coefficient value of 122a.u. [82]. Notice that the RVP calculations do not include any external scaling or fitting parameter. Our results are in good agreement with the experimental RRs over the entire temperature range. The theoretical reaction rate reproduces the experimental structure also below 1 K. At this temperature a transition from the classical to the quantum domain occurs.
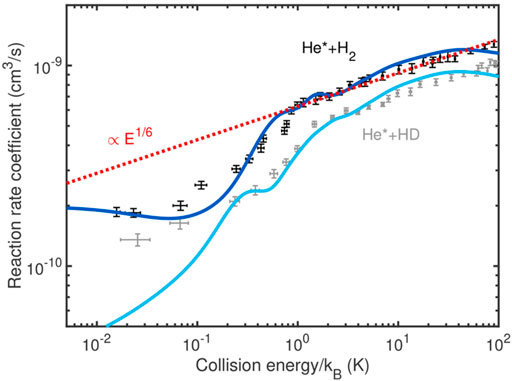
FIGURE 12. The reaction rates for the He(3P,1s2p) + H2 collision. The theoretical reaction rate is shown in blue and the experimental one in black dots with error bars over a temperature range of 0.01 K till 100 K (For the isotopic collision we use cyan and gray for the theoretical and experimental rates, respectively.) The ab-initio theoretical results (based on the RVP complex surfaces) are in agreement with the experimental reaction rates also in the low temperature region (
In the experimental work [82], the authors had related their theoretical reaction rate on the long range Van der-Waal’s interaction, where the potential scales as 1/R6. Moreover, they claimed that the entire reaction rate would be controlled by the classical Langevin power law. However, based on our ab-initio quantum calculations, a clear transition from this “classical” regime to the quantum region is observed. Specifically, the RR of He(23P) + para-H2 behaves as the power law at the asymptote for relatively high temperatures. However quantum effects become dominant below 1 K. This can be seen very clearly in Figure 12 as a sharp drop in the RR coefficient. Above 1 K (i.e., above this drop) the classical power law can be used in order to predict the RR. But below 1 K, the classical explanation completely fails and the RR coefficients are governed by quantum laws.
Notice that the RR can be reproduce using only the T-shape B1 potential but to achieve a quantitative agreement with experimental date the entire CPESs need to be considered. The asymptote (R → ∞) of the collision coordinate is the entry channel of the reactants. At the asymptote all the five potential are degenerate, therefore we expect that all states will contribute. However, the B1 state alone dominated the collision process. The B1 potential is the most symmetric, it has the deepest well, i.e., lowest in energy, and it has the fastest decay rate, see Figure 11. Thus, the majority of the reactants will populate B1 and the collision is along this particular adiabatic surface, see Ref. [68] for additional details.
5.3 Resonances of Uracil Anion
5.3.1 Complex Energies–Position and Width
Resonance (metastable) states can be generated, for example, by an absorption of slow electrons by neutral nucleobases in their ground state. It was suggested that such resonance states play a key-role in DNA or RNA damage [83]. In this section, we present an ab-initio investigation, using RVP, of the uracil anion. We present, for its three low lying shape-type resonance states the positions and decay rates. We also present the calculation of the complex transition dipoles between these metastable states. These electronic properties are a prerequisite for a future ab-initio light-matter interaction study. Notice that this is the first application of RVP to a medium-size system.
The presented results are converged with respect to the size of the one-electron basis set. Since polarized basis functions appear to be essential we consider the Dunning’s basis sets. We find that it is necessary to employ the triple-ζ basis set, cc-pVTZ. However, additional diffuse functions are mandatory, by systematically adding these on top of the cc-pVTZ basis set we conclude that cc-pVTZ+2s2p2d is the optimal basis set. Where two diffuse functions with s, p and d angular momentum are added to the cc-pVTZ set of each atom, while for the hydrogens we use aug-cc-pVTZ. The stabilization graphs of the three uracil anion shape-type resonance states, at the EOM-EA-CCSD/cc-pvTZ+2s2p2d level, are presented in Figure 13.
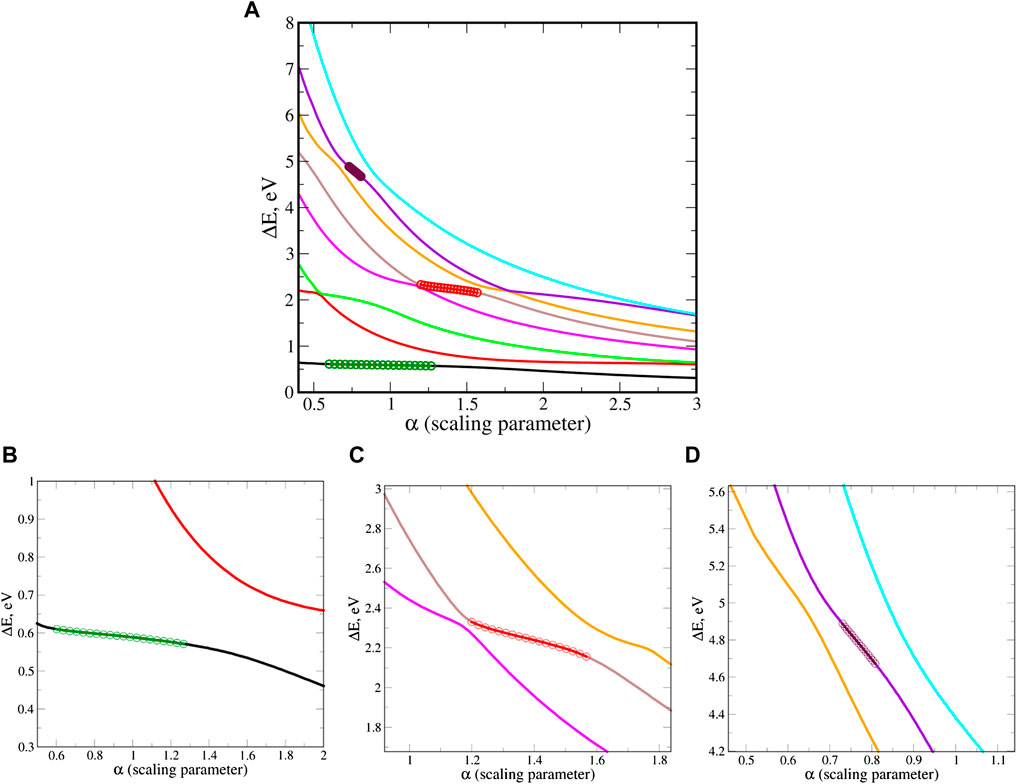
FIGURE 13. (A) Stabilization (energy) graphs for the uracil anion. This is an EOM-EA-CCSD/cc-pVTZ+2s2p2d calculation. Circles represent the input data for the RVP method, which is taken from the stable region. (B–D) zoom into the stable part that corresponds to the 1π*, 2π* and 3π* states, respectively. Reprinted from Ref. [66], with the permission of AIP Publishing.
Table 3 presents the converged RVP results compared with the most recent theoretical results. These studies include the Generalized Padé Approximation (GPA) approach that is also based on the stabilization technique [42, 43], and complex absorbing potential (CAP) added to the symmetry-adapted cluster-configuration interaction (SAC-CI) approach [84]. We observe the same trend for all the recent theoretical results (presented in Table 3). This is encouraging since earlier studies [85–88] presented a wide range of values for the positions and widths.
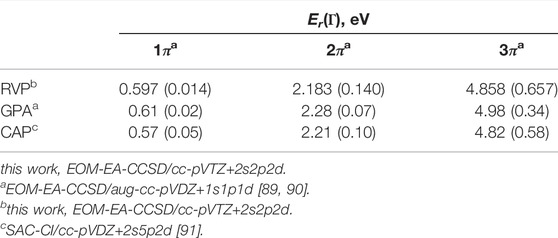
TABLE 3. Energy positions (Er) and widths (Γ, in parenthesis) of the lowest three shape-type resonances of uracil anion calculated using RVP and compared with other theoretical works. Adopted from Ref. [66].
5.3.2 Complex Transition Dipoles Between the Uracil Anion Resonances
Complex dipole transitions between the lowest shape-type metastable states are computed using the energy-converged, cc-pVTZ+2s2p2d, basis set. The RVP procedure for calculating complex dipole transitions is illustrated in Figure 14 for the 1π* ↔ 2π* case, i.e., between the 1st and 2nd shape-type states. The energy stabilization graph for these states is presented in Figure 14A. We highlight (in black) an area for which there is an overlap between the two stable regions. This overlap region in parameter space corresponds to a “macroscopic stability” in the dipole transition graph, Figure 14B. It is an analytic region, in which the change in the values is relatively small, in the current case less than 10% of the dipole value itself. The “macroscopic stability” idea was defined for situations in which the variational principle does not hold [92]. In such cases and, unlike the case of energy stabilization graphs, the behaviour of the continuum states that are scaled by a parameter is not well defined. In the energy stabilization graphs case, the energy of a continuum state will always decrease as α (the real scaling parameter) increases, i.e., as the space spanned by the basis set is increased. Contrary, in transition dipole calculations the dipole can either decrease or increase. Therefore, in the dipole transition case one obtains different shapes of stabilization graphs, as in Figure 14B, additional dipole stabilization plots can be found in the supporting information in Refs. [66, 74].
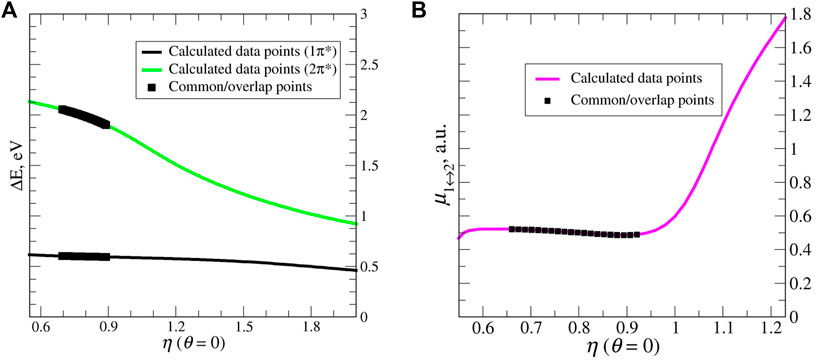
FIGURE 14. (A) Stabilization (energy) graphs for the 1π* and 2π* resonance states of the uracil anion. The black squares represent the overlap region (in the energy) between the two electronic resonance states. (B) Stabilization (dipole transitions) graphs for 1π* ↔ 2π*. The black points corresponds to a stable part on the graph, which has the same α-range as the overlap (energy) region. These points are used as input within RVP. This is n EOM-EA-CCSD/cc-pVTZ+2s2p2d calculation. Reprinted from Ref. [66], with the permission of AIP Publishing.
Technically, the complex dipole transitions are calculated in a similar manner to the procedure for calculating the complex resonance energies [74]. Input data for fitting a Padé polynomial function are taken as the points marked in black in Figure 14B. Once in possession of a Padé function, analytical dilation into the complex plane is allowed. Next, one search for SPs clusters, i.e., complex dipoles are identified using the clusterization technique [50]. The results, i.e., the complex dipole transitions between the three low-laying resonance states, are given in Table 4. Notice that the real part dominant the three dipole transitions, where the imaginary part corresponds to about 1% of it or less.

TABLE 4. Complex dipole transitions (in a.u.) between the three lowest shape-type resonances of the uracil anion calculated with RVP. Electronic-structure method: EOM-EA-CCSD. Basis set: cc-pVTZ+2s2p2d. Reprinted from Ref. [66], with the permission of AIP Publishing.
6 Summary
The RVP (Resonance via Padé) method and its applications have been described. The method enables the calculations of complex eigenvalues and energy surfaces associated with resonance states with finite lifetimes, also know as metastable states. Moreover, RVP allows calculations of other complex electronic properties, such as complex dipole transitions and moments. As illustrative numerical applications we present the calculations of: multiple doubly excited helium resonance states and the transitions between them, the 3He*−H2 cold collision, and uracil anion (an RNA nuclear base).
Since RVP is based on the stabilization technique, the complex properties are computed from real eigenvalues and real dipole transitions obtained from standard (Hermitian) quantum chemistry packages. The transition from the real axis into the complex plane is done by analytical continuation, specifically using the Padé approximant. The rational, mathematical logic and the methodology of RVP are presented here.
The ability to calculate ab-initio energies and lifetimes for small to medium-size systems (even with biological relevant) opens the door for investigating reactions of such molecules in which autoionization takes place. While the ability to also compute their complex dipole transitions enables investigating photo induced dynamics of such biological molecules.
Moreover, we describe an open-source code, which can be used as a “black box” to calculate complex physical properties from real input data with the RVP method. For the automatic code see (https://pypi.org/project/automatic-rvp/).
Author Contributions
AL—writing and calculations. IH—writing and calculations. NM—writing and ideas.
Funding
We acknowledge the Israel Science Foundation (Grant No. 1661/19) for a partial support.
Conflict of Interest
The authors declare that the research was conducted in the absence of any commercial or financial relationships that could be construed as a potential conflict of interest.
Publisher’s Note
All claims expressed in this article are solely those of the authors and do not necessarily represent those of their affiliated organizations, or those of the publisher, the editors and the reviewers. Any product that may be evaluated in this article, or claim that may be made by its manufacturer, is not guaranteed or endorsed by the publisher.
References
2. Moiseyev N. Quantum Theory of Resonances: Calculating Energies, Widths and Cross-Sections by Complex Scaling. Phys Rep (1998) 302:212–93. doi:10.1016/s0370-1573(98)00002-7
3. Klaiman S, Gilary I. On Resonance: A First Glance into the Behavior of Unstable States. Adv Quan Chem (2012) 63:1–31. doi:10.1016/b978-0-12-397009-1.00001-1
4. Hilborn RC. Einstein Coefficients, Cross Sections, F Values, Dipole Moments, and All That. Am J Phys (1982) 50:982–6. doi:10.1119/1.12937
5. Zuev D, Jagau T-C, Bravaya KB, Epifanovsky E, Shao Y, Sundstrom E, et al. Complex Absorbing Potentials within EOM-CC Family of Methods: Theory, Implementation, and Benchmarks. J Chem Phys (2014) 141:024102. doi:10.1063/1.4885056
6. Landau A, Moiseyev N. Molecular Resonances by Removing Complex Absorbing Potentials via Padé; Application to CO− and N2−. J Chem Phys (2016) 145:164111. doi:10.1063/1.4965887
7. Fennimore MA, Karsili TNV, Matsika S. Mechanisms of H and CO Loss from the Uracil Nucleobase Following Low Energy Electron Irradiation. Phys Chem Chem Phys (2017) 19:17233–41. doi:10.1039/c7cp01345k
8. Trinter F, Schöffler MS, Kim H-K, Sturm FP, Cole K, Neumann N, et al. Resonant Auger Decay Driving Intermolecular Coulombic Decay in Molecular Dimers. Nature (2014) 505:664–6. doi:10.1038/nature12927
9. Murphy BF, Osipov T, Jurek Z, Fang L, Son S-K, Mucke M, et al. Femtosecond X-Ray-Induced Explosion of C60 at Extreme Intensity. Nat Commun (2014) 5:4281. doi:10.1038/ncomms5281
10. Galli L, Son S-K, White TA, Santra R, Chapman HN, Nanao MH. Towards Rip Using Free-Electron Laser Sfx Data. J Synchrotron Radiat (2015) 22:249–55. doi:10.1107/s1600577514027854
11. Li Z, Vendrell O, Santra R. Ultrafast Charge Transfer of a Valence Double Hole in Glycine Driven Exclusively by Nuclear Motion. Phys Rev Lett (2015) 115:143002. doi:10.1103/physrevlett.115.143002
12. Cederbaum LS, Zobeley J, Tarantelli F. Giant Intermolecular Decay and Fragmentation of Clusters. Phys Rev Lett (1997) 79:4778–81. doi:10.1103/physrevlett.79.4778
13. Scheit S, Averbukh V, Meyer H-D, Moiseyev N, Santra R, Sommerfeld T, et al. On the Interatomic Coulombic Decay in the Ne Dimer. J Chem Phys (2004) 121:8393–8. doi:10.1063/1.1794654
14. Sisourat N, Kryzhevoi NV, Kolorenč P, Scheit S, Jahnke T, Cederbaum LS. Ultralong-Range Energy Transfer by Interatomic Coulombic Decay in an Extreme Quantum System. Nat Phys (2010) 6:508–11. doi:10.1038/nphys1685
15. Gokhberg K, Kolorenč P, Kuleff AI, Cederbaum LS. Site- and Energy-Selective Slow-Electron Production Through Intermolecular Coulombic Decay. Nature (2014) 505:661–3. doi:10.1038/nature12936
16. Iablonskyi D, Nagaya K, Fukuzawa H, Motomura K, Kumagai Y, Mondal S, et al. Slow Interatomic Coulombic Decay of Multiply Excited Neon Clusters. Phys Rev Lett (2016) 117:276806. doi:10.1103/physrevlett.117.276806
17. Ren X, Jabbour Al Maalouf E, Dorn A, Denifl S. Direct Evidence of Two Interatomic Relaxation Mechanisms in Argon Dimers Ionized by Electron Impact. Nat Commun (2016) 7:11093. doi:10.1038/ncomms11093
18. Landau A, Ben-Asher A, Gokhberg K, Cederbaum LS, Moiseyev N. Ab Initio Complex Potential Energy Curves of the He*(1s2p1P)–Li Dimer. J Chem Phys (2020) 152:184303. doi:10.1063/5.0008337
19. Ben-Asher A, Landau A, Cederbaum LS, Moiseyev N. Quantum Effects Dominating the Interatomic Coulombic Decay of an Extreme System. J Phys Chem Lett (2020) 11:6600–5. doi:10.1021/acs.jpclett.0c01974
20. Jabbari G, Gokhberg K, Cederbaum LS. Competition Between Interatomic Coulombic Decay and Autoionization of Doubly-Excited Atoms. Chem Phys Lett (2020) 754:137571. doi:10.1016/j.cplett.2020.137571
21. Sakai K, Stoychev S, Ouchi T, Higuchi I, Schöffler M, Mazza T, et al. Electron-Transfer-Mediated Decay and Interatomic Coulombic Decay from the Triply Ionized States in Argon Dimers. Phys Rev Lett (2011) 106:033401. doi:10.1103/PhysRevLett.106.033401
22. LaForge AC, Stumpf V, Gokhberg K, von Vangerow J, Stienkemeier F, Kryzhevoi NV, et al. Enhanced Ionization of Embedded Clusters by Electron-Transfer-Mediated Decay in Helium Nanodroplets. Phys Rev Lett (2016) 116:203001. doi:10.1103/physrevlett.116.203001
23. Unger I, Seidel R, Thürmer S, Pohl MN, Aziz EF, Cederbaum LS, et al. Observation of Electron-Transfer-Mediated Decay in Aqueous Solution. Nat Chem (2017) 9:708–14. doi:10.1038/nchem.2727
24. Goldzak T, Gilary I, Moiseyev N. Resonance Energies, Lifetimes and Complex Energy Potential Curves from Standard Wave-Packet Calculations. Mol Phys (2012) 110:537–46. doi:10.1080/00268976.2012.662599
25. McCurdy CW, Rescigno TN. Extension of the Method of Complex Basis Functions to Molecular Resonances. Phys Rev Lett (1978) 41:1364–8. doi:10.1103/physrevlett.41.1364
26. White AF, Head-Gordon M, McCurdy CW. Complex Basis Functions Revisited: Implementation with Applications to Carbon Tetrafluoride and Aromatic N-Containing Heterocycles within the Static-Exchange Approximation. J Chem Phys (2015) 142:054103. doi:10.1063/1.4906940
27. Moiseyev N, Corcoran C. Autoionizing States of H2 and H−2 Using the Complex-Scaling Method. Phys Rev A (1979) 20:814–7. doi:10.1103/physreva.20.814
28. Rescigno TN, McCurdy CW, Orel AE. Extensions of the Complex-Coordinate Method to the Study of Resonances in Many-Electron Systems. Phys Rev A (1978) 17:1931–8. doi:10.1103/physreva.17.1931
29. Sajeev Y, Moiseyev N. Reflection-Free Complex Absorbing Potential for Electronic Structure Calculations: Feshbach-Type Autoionization Resonances of Molecules. J Chem Phys (2007) 127:034105. doi:10.1063/1.2753485
30. Ghosh A, Karne A, Pal S, Vaval N. CAP/EOM-CCSD Method for the Study of Potential Curves of Resonant States. Phys Chem Chem Phys (2013) 15:17915–21. doi:10.1039/c3cp52552j
31. Sommerfeld T, Santra R. Efficient Method to Perform CAP/CI Calculations for Temporary Anions. Int J Quan Chem. (2001) 82:218–26. doi:10.1002/qua.1042
32. Feuerbacher S, Sommerfeld T, Santra R, Cederbaum LS. Complex Absorbing Potentials in the Framework of Electron Propagator Theory. Ii. Application to Temporary Anions. J Chem Phys (2003) 118:6188–99. doi:10.1063/1.1557452
33. Bravaya KB, Zuev D, Epifanovsky E, Krylov AI. Complex-Scaled Equation-Of-Motion Coupled-Cluster Method with Single and Double Substitutions for Autoionizing Excited States: Theory, Implementation, and Examples. J Chem Phys (2013) 138:124106. doi:10.1063/1.4795750
34. Jagau T-C, Zuev D, Bravaya KB, Epifanovsky E, Krylov AI. Correction to “A Fresh Look at Resonances and Complex Absorbing Potentials: Density Matrix-Based Approach”. J Phys Chem Lett (2015) 6:3866. doi:10.1021/acs.jpclett.5b02017
35. Kunitsa AA, Granovsky AA, Bravaya KB. CAP-XMCQDPT2 Method for Molecular Electronic Resonances. J Chem Phys (2017) 146:184107. doi:10.1063/1.4982950
36. Kaprálová-Žďánská PR, Šmydke J. Gaussian Basis Sets for Highly Excited and Resonance States of Helium. J Chem Phys (2013) 138:024105. doi:10.1063/1.4772468
37. Benda Z, Jagau T-C. Communication: Analytic Gradients for the Complex Absorbing Potential Equation-Of-Motion Coupled-Cluster Method. J Chem Phys (2017) 146:031101. doi:10.1063/1.4974094
38. White AF, Epifanovsky E, McCurdy CW, Head-Gordon M. Second Order Møller-Plesset and Coupled Cluster Singles and Doubles Methods with Complex Basis Functions for Resonances in Electron-Molecule Scattering. J Chem Phys (2017) 146:234107. doi:10.1063/1.4986950
39. Hernández Vera M, Jagau T-C. Resolution-of-the-Identity Second-Order Møller-Plesset Perturbation Theory with Complex Basis Functions: Benchmark Calculations and Applications to Strong-Field Ionization of Polyacenes. J Chem Phys (2020) 152:174103. doi:10.1063/5.0004843
40. Parravicini V, Jagau T-C. Embedded Equation-Of-Motion Coupled-Cluster Theory for Electronic Excitation, Ionisation, Electron Attachment, and Electronic Resonances. Mol Phys (2021) 119:e1943029. doi:10.1080/00268976.2021.1943029
41. McCurdy CW, McNutt JF. On the Possibility of Analytically Continuing Stabilization Graphs to Determine Resonance Positions and Widths Accurately. Chem Phys Lett (1983) 94:306–10. doi:10.1016/0009-2614(83)87093-6
42. Chao JSY, Falcetta MF, Jordan KD. Application of the Stabilization Method to the H−2(12g) and Mg−(12p) Temporary Anion States. J Chem Phys (1990) 93:1125–35. doi:10.1063/1.459176
43. Thodika M, Fennimore M, Karsili TNV, Matsika S. Comparative Study of Methodologies for Calculating Metastable States of Small to Medium-Sized Molecules. J Chem Phys (2019) 151:244104. doi:10.1063/1.5134700
44. Thodika M, Mackouse N, Matsika S. Description of Two-Particle One-Hole Electronic Resonances Using Orbital Stabilization Methods. J Phys Chem A (2020) 124:9011–20. doi:10.1021/acs.jpca.0c07904
45. Holøien E, Midtdal J. New Investigation of the 1se Autoionizing States of He and H−. J Chem Phys (1966) 45:2209–16.
46. Hazi AU, Taylor HS. Stabilization Method of Calculating Resonance Energies: Model Problem. Phys Rev A (1970) 1:1109–20. doi:10.1103/physreva.1.1109
47. Taylor HS. Models, Interpretations, and Calculations Concerning Resonant Electron Scattering Processes in Atoms and Molecules. Adv Chem Phys (1971) 18:91–147.
48. Taylor HS, Hazi AU. Comment on the Stabilization Method: Variational Calculation of the Resonance Width. Phys Rev A (1976) 14:2071–4. doi:10.1103/physreva.14.2071
49. Landau A. Shaping and Controlling Stabilisation Graphs for Calculating Stable Complex Resonance Energies. Mol Phys (2019) 117:2029–42. doi:10.1080/00268976.2019.1575993
50. Landau A, Haritan I. The Clusterization Technique: A Systematic Search for the Resonance Energies Obtained via Padé. J Phys Chem A (2019) 123:5091–105. doi:10.1021/acs.jpca.8b12573
51. Landau A, Haritan I, Kaprálová-Žďánská PR, Moiseyev N. Advantages of Complex Scaling Only the Most Diffuse Basis Functions in Simultaneous Description of Both Resonances and Bound States. Mol Phys (2015) 113:3141–6. doi:10.1080/00268976.2015.1080872
52. Haritan I, Moiseyev N. On the Calculation of Resonances by Analytic Continuation of Eigenvalues from the Stabilization Graph. J Chem Phys (2017) 147:014101. doi:10.1063/1.4989867
53. Landau A, Haritan I, Kaprálová-Žd’ánská PR, Moiseyev N. Atomic and Molecular Complex Resonances from Real Eigenvalues Using Standard (Hermitian) Electronic Structure Calculations. J Phys Chem A (2016) 120:3098–108. doi:10.1021/acs.jpca.5b10685
54. Schlessinger L. Use of Analyticity in the Calculation of Nonrelativistic Scattering Amplitudes. Phys Rev (1968) 167:1411–23. doi:10.1103/physrev.167.1411
55. Moiseyev N, Friedland S, Certain PR. Cusps, θ Trajectories, and the Complex Virial Theorem. J Chem Phys (1981) 74:4739–40. doi:10.1063/1.441624
56. Cleve M. Makima Piecewise Cubic Interpolation (2019). Available from: https://blogs.mathworks.com/cleve/2019/04/29/makima-piecewise-cubic-interpolation/.
57. Akima H. A New Method of Interpolation and Smooth Curve Fitting Based on Local Procedures. J ACM (1970) 17:589–602. doi:10.1145/321607.321609
58. Akima H. A Method of Bivariate Interpolation and Smooth Surface Fitting Based on Local Procedures. Commun ACM (1974) 17:18–20. doi:10.1145/360767.360779
59. Meurer A, Smith CP, Paprocki M, Čertík O, Kirpichev SB, Rocklin M, et al. SymPy: Symbolic Computing in Python. PeerJ Comput Sci (2017) 3:e103. doi:10.7717/peerj-cs.103
60. Ester M, Kriegel H-P, Sander J, Xu X. A Density-Based Algorithm for Discovering Clusters in Large Spatial Databases with Noise. Kdd (1996) 96:226–31.
61. Moiseyev N. Derivations of Universal Exact Complex Absorption Potentials by the Generalized Complex Coordinate Method. J Phys B: Mol Opt Phys (1998) 31:1431–41. doi:10.1088/0953-4075/31/7/009
62. Ben-Asher A, Moiseyev N. On the Equivalence of Different Methods for Calculating Resonances: From Complex Gaussian Basis Set to Reflection-Free Complex Absorbing Potentials via the Smooth Exterior Scaling Transformation. J Chem Theor Comput. (2016) 12:2542–52. doi:10.1021/acs.jctc.6b00059
63. Ben-Asher A, Landau A, Moiseyev N. Uniform vs Partial Scaling within Resonances via Pade Based on the Similarities to Other Non-Hermitian Methods: Illustration for the Beryllium 1s22p3s State. J Chem Theor Comput. (2021) 17:3435–44. doi:10.1021/acs.jctc.1c00223
64. Riss UV, Meyer H-D. Calculation of Resonance Energies and Widths Using the Complex Absorbing Potential Method. J Phys B: Mol Opt Phys (1993) 26:4503–35. doi:10.1088/0953-4075/26/23/021
65. Lefebvre R, Sindelka M, Moiseyev N. Resonance Positions and Lifetimes for Flexible Complex Absorbing Potentials. Phys Rev A (2005) 72:052704. doi:10.1103/physreva.72.052704
66. Buskila G, Landau A, Haritan I, Moiseyev N, Bhattacharya D. Complex Energies and Transition-Dipoles for the Uracil Anion Shape-Type Resonances from Stabilization Curves via Padé. J Chem Phys (2022) 156:194101. doi:10.1063/5.0086887
67. Bhattacharya D, Ben-Asher A, Haritan I, Pawlak M, Landau A, Moiseyev N. Polyatomic AB Initio Complex Potential Energy Surfaces: Illustration of Ultracold Collisions. J Chem Theor Comput. (2017) 13:1682–90. doi:10.1021/acs.jctc.7b00083
68. Bhattacharya D, Pawlak M, Ben-Asher A, Landau A, Haritan I, Narevicius E, et al. Quantum Effects in Cold Molecular Collisions from Spatial Polarization of Electronic Wave Function. J Phys Chem Lett (2019) 10:855–63. doi:10.1021/acs.jpclett.8b03807
69. Lindroth E. Calculation of Doubly Excited States of Helium with a Finite Discrete Spectrum. Phys Rev A (1994) 49:4473–80. doi:10.1103/physreva.49.4473
70. Burgers A, Wintgen D, Rest J-M. Highly Doubly Excited S States of the Helium Atom. J Phys B: Mol Opt Phys (1995) 28:3163–83. doi:10.1088/0953-4075/28/15/010
71. Rost JM, Schulz K, Domke M, Kaindl G. Resonance Parameters of Photo Doubly Excited Helium. J Phys B: Mol Opt Phys (1997) 30:4663–94. doi:10.1088/0953-4075/30/21/010
72. Argenti L. Rydberg and Autoionizing Triplet States in Helium up to the N=5 Threshold. At Data Nucl Data Tables (2008) 94:903–80. doi:10.1016/j.adt.2008.03.003
73. Kaprálová-Žďánská PR, Moiseyev N. Helium in Chirped Laser Fields as a Time-Asymmetric Atomic Switch. J Chem Phys (2014) 141:014307. doi:10.1063/1.4885136
74. Bhattacharya D, Landau A, Moiseyev N. Ab Initio Complex Transition Dipoles Between Autoionizing Resonance States from Real Stabilization Graphs. J Phys Chem Lett (2020) 11:5601–9. doi:10.1021/acs.jpclett.0c01519
75. Pick A, Kaprálová-Žďánská PR, Moiseyev N. AB-Initio Theory of Photoionization via Resonances. J Chem Phys (2019) 150:204111. doi:10.1063/1.5098063
76. Henson AB, Gersten S, Shagam Y, Narevicius J, Narevicius E. Observation of Resonances in Penning Ionization Reactions at Sub-Kelvin Temperatures in Merged Beams. Science (2012) 338:234–8. doi:10.1126/science.1229141
77. Manohar PU, Krylov AI. A Noniterative Perturbative Triples Correction for the Spin-Flipping and Spin-Conserving Equation-Of-Motion Coupled-Cluster Methods with Single and Double Substitutions. J Chem Phys (2008) 129:194105. doi:10.1063/1.3013087
78. Jorge FE, Sagrillo PS, de Oliveira AR. Gaussian Basis Sets of 5 Zeta Valence Quality for Correlated Wave Functions. Chem Phys Lett (2006) 432:558–63. doi:10.1016/j.cplett.2006.10.026
79. Miller WH, Morgner H. A Unified Treatment of Penning Ionization and Excitation Transfer. J Chem Phys (1977) 67:4923–30. doi:10.1063/1.434674
80. Pawlak M, Shagam Y, Narevicius E, Moiseyev N. Adiabatic Theory for Anisotropic Cold Molecule Collisions. J Chem Phys (2015) 143:074114. doi:10.1063/1.4928690
81. Klein A, Shagam Y, Skomorowski W, Żuchowski PS, Pawlak M, Janssen LMC, et al. Directly Probing Anisotropy in Atom-Molecule Collisions Through Quantum Scattering Resonances. Nat Phys (2017) 13:35–8. doi:10.1038/nphys3904
82. Shagam Y, Klein A, Skomorowski W, Yun R, Averbukh V, Koch CP, et al. Molecular Hydrogen Interacts More Strongly when Rotationally Excited at Low Temperatures Leading to Faster Reactions. Nat Chem (2015) 7:921–6. doi:10.1038/nchem.2359
83. Lipton MS, Fuciarelli AF, Springer DL, Edmonds CG. The Study of Radiation Induced Dna-Protein Crosslinks by Electrospray Ionization Mass Spectrometry. In: Radiation Damage in DNA: Structure/Function Relationships at Early Times. Columbus, OH: Battelle Press (1995).
84. Kanazawa Y, Ehara M, Sommerfeld T. Low-Lying π* Resonances of Standard and Rare DNA and RNA Bases Studied by the Projected CAP/SAC-CI Method. The J Phys Chem A (2016) 120:1545–53. doi:10.1021/acs.jpca.5b12190
85. Cheng H-Y, Chen C-W. Energy and Lifetime of Temporary Anion States of Uracil by Stabilization Method. J Phys Chem A (2011) 115:10113–21. doi:10.1021/jp205986z
86. Dora A, Tennyson J, Bryjko L, van Mourik T. R-Matrix Calculation of Low-Energy Electron Collisions with Uracil. J Chem Phys (2009) 130:164307. doi:10.1063/1.3119667
87. Gianturco FA, Lucchese RR. Radiation Damage of Biosystems Mediated by Secondary Electrons: Resonant Precursors for Uracil Molecules. J Chem Phys (2004) 120:7446–55. doi:10.1063/1.1688320
88. Kossoski F, Bettega MHF, Varella MTDN. Shape Resonance Spectra of Uracil, 5-Fluorouracil, and 5-Chlorouracil. J Chem Phys (2014) 140:024317. doi:10.1063/1.4861589
89. Fennimore MA, Matsika S. Core-Excited and Shape Resonances of Uracil. Phys Chem Chem Phys (2016) 18:30536–45. doi:10.1039/c6cp05342d
90. Fennimore MA, Matsika S. Correction: Core-Excited and Shape Resonances of Uracil. Phys Chem Chem Phys (2017) 19:29005–6. doi:10.1039/c7cp90241g
91. Ehara M, Kanazawa Y, Sommerfeld T. Low-Lying π Resonances Associated with Cyano Groups: A CAP/SAC-CI Study. Chem Phys (2017) 482:169–77. doi:10.1016/j.chemphys.2016.09.033
Keywords: resonances, ab-initio, electronic structure, stabilization graph, analytical continuation, RVP
Citation: Landau A, Haritan I and Moiseyev N (2022) The RVP Method—From Real Ab-Initio Calculations to Complex Energies and Transition Dipoles. Front. Phys. 10:854039. doi: 10.3389/fphy.2022.854039
Received: 13 January 2022; Accepted: 22 April 2022;
Published: 21 June 2022.
Edited by:
Tamar Seideman, Northwestern University, United StatesReviewed by:
Pierre Descouvemont, Université Libre de Bruxelles, BelgiumMichael Falcetta, Grove City College, United States
Copyright © 2022 Landau, Haritan and Moiseyev. This is an open-access article distributed under the terms of the Creative Commons Attribution License (CC BY). The use, distribution or reproduction in other forums is permitted, provided the original author(s) and the copyright owner(s) are credited and that the original publication in this journal is cited, in accordance with accepted academic practice. No use, distribution or reproduction is permitted which does not comply with these terms.
*Correspondence: Arie Landau, YWxhbmRhdUB0ZWNobmlvbi5hYy5pbA==; Idan Haritan, aGFyaXRhbkBjYW1wdXMudGVjaG5pb24uYWMuaWw=; Nimrod Moiseyev, bmltcm9kQHRlY2huaW9uLmFjLmls
 Arie Landau
 Idan Haritan
 Nimrod Moiseyev