 Ruhao Liu
- 1School of Earth Sciences, Northeast Petroleum University, Daqing, China
- 2College of Petroleum Engineering, Xi’an Shiyou University, Xi’an, China
- 3The Fifth Oil Production Plant of Daqing Oilfield, Daqing, China
Based on the information of dense cored wells and by analyzing off-surface reservoir data, we determined the type of off-surface reservoirs in the area, the characteristics of off-surface reservoir microfacies (vertical), the planar distribution characteristics of off-surface reservoirs, the off-surface reservoir rocks, facies features, etc., so as to extract the matching pattern of the well pattern and the sand body. Based on the core analysis of the cored well area and the analysis of the matching relationship between injection and production between wells, five typical conventional off-surface and high-quality strip sand body injection and production modes between wells were extracted, and five corresponding core physical models and numerical models were constructed. Through physical simulation displacement experiment and numerical simulation displacement experiment analysis, the research shows that conventional off-surface reservoirs can be exploited separately and can be produced well, with a recovery rate of 40%; conventional off-surface reservoirs are combined with high-quality strip sand bodies (Lu et al., Journal of Xi’an Shiyou University (Natural Science Edition), 2019, 34(4): 60–66 and Cheng et al., Oil and Gas Reservoir Evaluation and Development, 2019, 9(02): 56–59). Under mining conditions, there is serious interlayer interference; under the condition of tandem mining of conventional off-surface reservoirs and high-quality strip sand bodies, the production level of off-surface reservoirs can be effectively improved. Experiments show that the contribution rate of conventional off-surface reservoirs reaches 62% under the conditions of pin-out mining with high-quality sand bodies. The research results lay the foundation for further refined development and improvement of the economic and effective utilization of reserves.
1 Introduction
The densely cored well area in the east of Xing-6 District is located in the Xingshugang Oilfield in the north of the Xingshugang structure in the Daqing Placanticline. The west is adjacent to the Qijia Gulong sag, the east is connected to the Sanzhao sag, the north of the Daqing Placanticline is the Xingshugang structure, the south is the Putaohua structure, and the northeast is the Taipingtun structure. Structurally, it is located on the third-level structure in the middle of the second-level structural belt of Daqing Placanticline in the northern central depression area of the Songliao Basin. Specifically, it is located in the north of the Xingshugang structure, Xing-6 area in the Xing4-6 pure oil region. In the east, it starts from the third row of Xingwu District in the north, to the third row of Xinglu District in the south, and is bounded by Sada Road in the west, adjacent to the area of Xing4-6 and the transition zone in the east of Xingbei in the east [3]. The distribution of underground oil and water is controlled by the secondary structure. The oil-bearing area of the block is 9.7 km2, and the geological reserves are 3,366.37 × 104 t.
According to previous research results, the Xingshugang Oilfield’s Sapu oil layer is a large-scale river-delta deposit in the northern Songliao Basin. It has experienced large-scale slow lacustrine regression in the Qingshankou Formation, rapid lacustrine regression in the early stage of the Yaojia Formation, and stable lacustrine regression in mid-term and late stage. The water enters such a compound cycle process. The terrain of this area is gentle, and the water body is very shallow. Affected by factors such as structure, climate, and hydrodynamic compensation conditions, the water area fluctuates greatly. In addition, the delta sand body undergoes changes, and the local lake belt line continues to swing. The target layers of this study are the Sa 2, Sa 3, and Pu 2 oil layers. The Sa 2 and Sa 3 oil formations are the Sartu oil layers, and the Pu 2 oil formation is the Putaohua oil layer. After years of sedimentary facies research, the Saertu reservoir in the Xingshugang area is a delta front subfacies deposit, and it is located at the front and end of the large river-delta sedimentary system in the northern Songliao Basin. Reservoir deposits are divided into two types: inner delta inner front facies and outer front facies, with outer front facies mainly being deposited. The Sa 2 and Sa 3 oil layers belong to delta front deposits, with underwater distributary channels developed and sand bodies distributed in patches [4]. The Sapa oil layer is divided into 66 sedimentary time units, of which the delta front subfacies accounted for the largest number, 51, accounting for 77% of the proportion, followed by the inner delta front subfacies at 12, accounting for 18% of the proportion. The oil layer group is well developed in the delta outer front subfacies.
The eastern part of Xing6 District was put into development in 1968. The basic well pattern is the combined production wells of Sa, Portugal, and high oil layers. The main production targets are the high permeability and large thickness of the Pu I1–I3 oil layers and other high-permeability and thicker oil layers. The non-main oil layer adopts the water injection method with a cutting distance of 2.0 km. In 1987, the block began to undergo an intensification adjustment. The main mining targets are the non-main oil layer with an effective thickness of less than 2 m and a permeability of less than 0.15 μm2. The production layer is a set of combined production in the Sapucha oil layer. The well layout method of filling water wells between wells and oil production wells between rows, with a well spacing of 400 m and new infilling oil and water wells staggered by 200 m, constitutes an inclined five-point well pattern; in 1997, the block started secondary infilling adjustments and the main mining targets. Its effective thickness is the thin effective layers and off-surface oil layers (0.2–0.4 m) that are not used or have poor production in non-main oil layers and a small part of the unused surface and inner layers (0.5–1.0 m). Between injection and production, the new production well faces the old production well, and the new injection well faces the old water injection well. The first row is 150 m away from the adjustment well row, and the new production well row is placed 100 m apart from the old well in the 200 m × 200 m linear water injection method; in 2007, the block started three intensification adjustments. The second type of off-surface reservoir, the first type of off-surface reservoir, and a small part of the thin layer within the surface were used as adjustment objects. The point method area well layout method.
2 Materials and Methods
2.1 Core Model Construction and Preparation
According to the extracted characteristics of the five inter-well sand body injection-production matching models, the artificial core manufacturing technology is applied to simulate the matching relationship of the corresponding models and the corresponding permeability, and the corresponding five core models are constructed.
2.1.1 Core Model Preparation
Production principle:
(1) To develop a simulation core of whole-rock minerals, the process must ensure that the added clay minerals are not glued by the cement;
(2) The heating temperature will not change the crystal lattice of the clay, the interlayer structure water will be precipitated, and the original clay properties will be lost;
(3) Compared with the natural core, the developed simulated core has the same lithology and close physical parameters, which can meet the needs of the experiment.
According to the analysis results of particle size and physical properties, first, we weigh a certain amount of quartz sand of a certain specification, a certain amount of feldspar, kaolin, illite, montmorillonite, chlorite, etc., and mix the above raw materials thoroughly. The prepared cementing agent and the above-mentioned solid mixed raw materials are prepared according to the proportion, fully mixed uniformly, and sieved; then the solid–liquid mixture after the sieving is weighed quantitatively and regularly, and the amount of cementing agent, production pressure, and production time are screened out through orthogonal experiments [5, 6].
2.1.2 Optimization of Core Model
The permeability of conventional surface reservoirs is controlled within 50 mD, and the permeability of high-quality strips is controlled above 50 mD. Due to the narrow permeability range, the screening is cumbersome and the production is difficult. A total of five types of 17 core models were constructed this time, and five cores required for the composite experiment were selected; the corresponding permeability was measured, as shown in Table 1, and core test instruments are shown in Figures 1, 2.
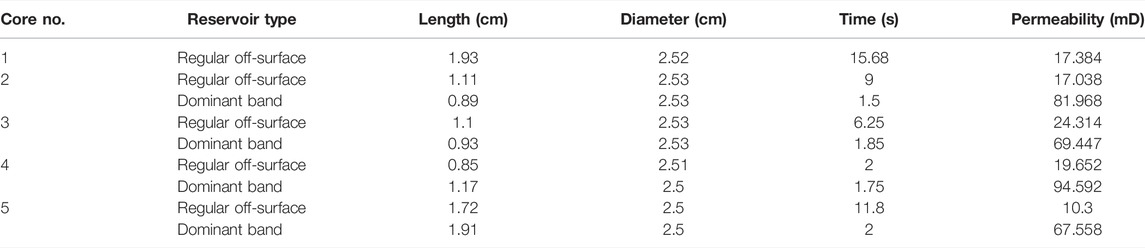
TABLE 1. Core model construction and corresponding parameter characteristics.
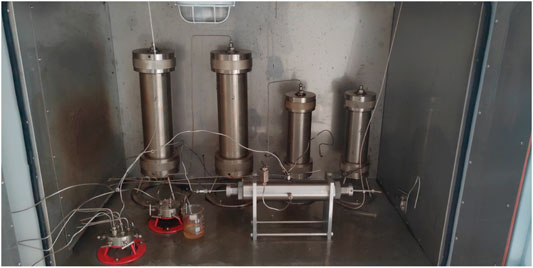
FIGURE 1. Core test tool.
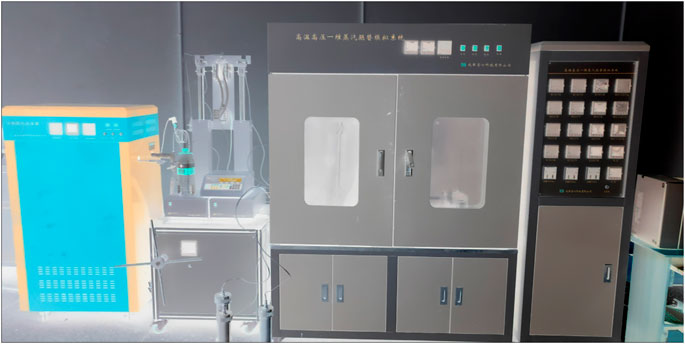
FIGURE 2. High-temperature and high-pressure one-dimensional steam displacement simulation system of MG 236.
2.2 Displacement Experiment Design
This experiment only carried out physical simulation displacement experiments with five core models. However, considering that it is difficult to reveal the degree of production and corresponding contribution characteristics of conventional off-surface reservoirs and high-quality strip reservoirs through physical simulation experiments, this time five types of numerical simulation experiments were added, corresponding to core models based on numerical simulation technology. Based on the above reasons, for different purposes, this experiment designed three major programs [7–9].
2.2.1 Model Displacement Experiment Scheme
2.2.1.1 Core Model Processing
According to the People’s Republic of China Petroleum and Natural Gas Industry Standard SY-T5358-2002″ for experiment preparation and rock sample processing, the steps include the following:
(1) Cleaning: Before the displacement test, the fluid that may exist in the rock sample must be cleaned. Generally, a mixture of alcohol and benzene can be used for cleaning.
(2) Drying: Put the elongated artificial core into a 101-2A electric heating blast drying box for drying. The drying temperature should be controlled at no higher than 60°C, and the relative humidity should be controlled at 40%–50%.
Each rock sample should be dried to a constant weight, and the drying time should not be less than 48 h. Weighing is done every 8 h after 48 h, and the difference between the two weighings should be less than 10 mg.
Saturation: The dried constant-weight rock sample is continuously vacuumed for 24 h until the pressure in the bottle is maintained at −0.1 MPa for a long time, and the formation water with a salinity of 8,198.5 ppm is configured to perform self-absorption and saturated fluid.
For rock sample saturation, different saturation pressures should be adopted according to the permeability and cementation of the rock sample. The pressure time should not be less than 48 h, and the pressure of the high-pressure metering pump used should not be less than 15 MPa to ensure that the rock sample is fully saturated. The rock sample is soaked in saturated liquid for at least 48 h.
The electric blast box used to dry the core is a 101-2A electric heating blast drying box. The 101-2A electric heating blast drying box is composed of a box body, an electric heating blast system, and a temperature control system. The advantage of the drying box is that there is a large area of double-layer tempered glass inspection window on the door, which can clearly observe the heating and drying core state in the box.
2.2.1.2 Displacement Plan
Load the sandstone cores of different models that have been evacuated and saturated with water into the core holder, clarify the conventional surface and dominant bands of each core, determine the correct injection and production directions, and set the core in the holder. On level ground, add 15 MPa ring pressure to water drive saturated oil. When the outlet oil saturation is constant and does not change, measure the oil production produced by the displacement and calculate the irreducible water saturation. Then start the water drive experiment and collect the outlet. Calculate the oil production, water production, recovery degree, water content, etc. When the outlet water content stabilizes at 98%, the experiment ends.
The injection pump is the ISCO A260 high-pressure non-pulse metering double-cylinder pump with constant current and pressure function in the United States. This pump adopts a digital positioning monitoring servo control circuit to make the solution flow accurately under any pressure conditions and make the high-speed flow smooth. The pressure sensor ensures excellent stability and repeatability. The ISCO A260 high-pressure non-pulse metering double-cylinder pump improves the accuracy in this experiment and ensures the accuracy of the data after many experiments.
Experimental conditions: Simulated formation temperature and pressure are set to 40°C and 10 MPa, respectively.
Collection parameters were liquid production, pressure, oil production, and water production.
Analysis parameters were recovery degree and water content.
2.2.1.3 Core Water Content Experiment
The core water-bearing test method mainly uses the changes in the surface properties of the oil layer and the changes in oil-bearing components and oil-bearing levels to perform simple tests.
Experimental methods are the dripping experiment, sedimentation experiment, etc.
This experiment mainly uses the dripping experiment method. The core dripping experiment uses the principle of the change in wettability of the rock surface; that is, whether the core is washed by water is determined by the size of the water droplet and the core wetting angle. Use a small dropper to drop water vertically on the newly drilled core, observe it for 10 min, and make judgments based on the shape, diffusion, and penetration of the water droplets. The end face of the rock sample should be flat with the cylinder surface when drilling core sampling for dripping experiment, the end face should be perpendicular to the cylinder surface, and there should be no structural defects such as missing corners. The diameter is generally about 2.54 or 3.81 cm, and the length is not less than 1.5 of the diameter [10–12]. During the experiment, the dropper should be kept at the same height from the core surface, generally about 2–3 cm. If dripping water is too high, gravity will destroy the natural form of water droplets, where the lithology is uneven, especially the same lithology and color are obvious; both sides of the change should be encrypted and dripped, so that the washing interface that appears on the same core can be determined. There are five levels of water droplet morphology in the core drip experiment, as shown in Table 2.
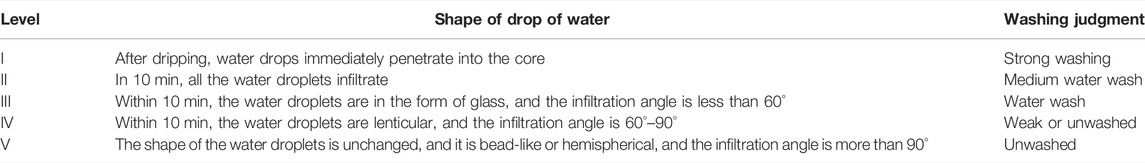
TABLE 2. Classification table of dripping experiment.
2.2.2 Model Numerical Simulation and Comparison Experiment Scheme
2.2.2.1 Introduction to CMG Software
This paper uses the reservoir numerical simulation software CMG to verify the above results. The software can complete the conceptual design of the reservoir development plan, detailed development plan design, development plan adjustment, displacement process simulation, remaining oil saturation analysis, and remaining oil distribution law research. Wait for work.
The software includes the following functional modules:
(1) Geological modelling: mainly through logging interpretation results, seismic interpretation results, reservoir geology, and experimental analysis of three-dimensional geological models of structural gas reservoirs and establishing reservoir grid attributes.
(2) Component model (used for condensate gas reservoir and heavy oil thermal recovery).
(3) Black oil model (used for oil reservoir and general gas reservoir simulation calculation).
(4) Phase state calculation module.
(5) Post-processing module.
CMG software has two major advantages:
(1) Portability
IMEX programming uses standard Fortran 77 language, which can run on a variety of hardware platforms, including IBM mainframe, CDC, CRAY, Honeywell, DEC, Prime, Gould, Unisys, Apollo, SUN, HP, FPS, and IBM.
CMG’s drawing system module is Results, and the SR2 file system is used to process the output results after simulation. Results can also be used to map all data including grid design [13].
Numerical simulation has two compatible machines of P-PC386 and P-PC486.
(2) Drawing system
Advantages: ① Parameters are adjusted, and the operation is easy to repeat. ② The calculation is simple, the cycle is short, and the time is saved.
2.2.2.2 Numerical Simulation Experiment Program
First, based on the contact relationship between the conventional off-surface and high-quality strips of the five types of core models, a laboratory-level numerical model is established, and corresponding attribute assignments are made.
(1) Conventional off-surface separate mining model: size 4.5 cm × 4.5 cm × 30 cm, porosity 18%, permeability 17.8 mD, pore volume 72.89 cm3, reserve 40.09 cm3, initial oil saturation 55%, injection rate 2 ml/min.
(2) Conventional off-surface and high-quality strip mining in parallel: porosity 18%–23%, permeability 17.8–80 mD, pore volume 124.5 cm3, reserve 68.49 cm3, initial oil saturation 55%, injection rate 2 ml/min.
(3) Conventional off-surface perforating in parallel with high-quality strips: model size 4.5 cm × 4.5 cm × 30 cm, porosity 18%–23%, permeability 17.8–80 mD, pore volume 124.5 cm3, reserve 68.49 cm3, initial oil saturation 55%, injection rate 2 ml/min, perforation at the bottom of the injection end.
(4) Conventional off-surface and high-quality strip mining: model size 4.5 cm × 4.5 cm × 30 cm, porosity 18%–23%, permeability 17.8–80 mD, pore volume 124.5 cm3, reserve 68.49 cm3, initial oil saturation 55%, injection. The amount is 2 ml/min.
(5) Conventional off-surface and high-quality strips in series with high-quality strip pinch-out mining: model size 4.5 cm × 4.5 cm × 30 cm, porosity 18%–23%, permeability 17.8–80 mD, pore volume 119.07 cm³, reserve 65.48 cm³, initial oil content saturated by 55%, injection volume 2 ml/min.
Refer to the physical simulation displacement experiment plan to carry out the water flooding experiment and measure the corresponding parameters. Numerical simulation and comparison experiments provide support for quantifying the corresponding utilization characteristics.
Acquisition parameters are liquid production, oil production, water production, pressure, etc.
Analysis parameters are recovery degree, water content, contribution rate of different parts, etc.
2.2.3 Interference Experiment Scheme of Parallel Mining
In order to better determine the corresponding contribution rate during parallel mining of conventional off-surface reservoirs and high-quality strips and clarify their mutual interference characteristics, this time, a numerical simulation experiment of high-quality strips and conventional off-surface parallel mining (small cores) was designed. The attribute value is as follows.
The size of the model is 4.5 cm × 4.5 cm × 30 cm (two cores), the porosity is 18%–23%, the permeability is 17.8–80 mD, the pore volume is 182.25 cm3, the reserve is 100.23 cm3, the initial oil saturation is 55%, and the injection volume is 2 ml/min. The method of separate measurement with the same injection is used to determine the contribution rate of the corresponding liquid production or the degree of recovery.
3 Experimental Results and Analysis
3.1 Separate Mining Off the Conventional Table
3.1.1 Physical Model Experiment Analysis
The parameters of the conventional off-surface reservoir model (core 1) are as follows: model size 4.5 cm × 4.47 cm × 28 cm, porosity 15.83%, permeability 17.8 mD, pore volume 93.535 cm3, reserve 43.1 cm3, initial oil saturation 55.28%, water. The injection rate during flooding is 2 ml/min.
With 98% water content as the end condition, the final recovery level is 41.13% of the recovery level curve.
When the injection rate is 0–0.7 PV, the recovery level rises rapidly, and when the injection rate is 0.7–3.4 PV, the recovery level rises steadily. When the injection rate is greater than 3.4 PV, the cycle section is inefficient and ineffective.
When the injection volume is 0 PV, the pressure is 5.54 MPa. When the injection volume is 0–0.73 PV, the pressure rises rapidly. When the injection volume reaches 0.73 PV, the peak value is 7.83 MPa. Injection volumes of 0.73–2.45 PV indicate a rapid pressure drop. After PV, it is a stable stage. See Figure 3.
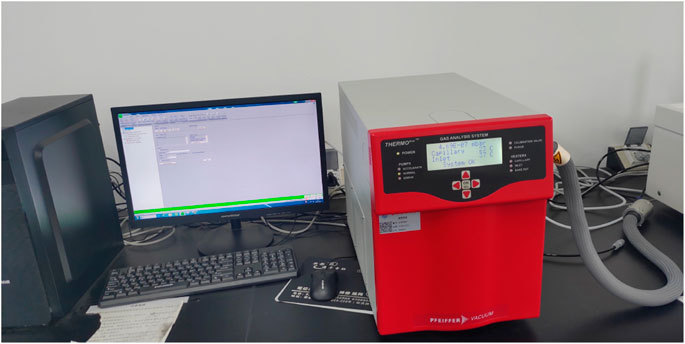
FIGURE 3. Test result record.
Dripping water experiment shows that there is secondary infiltration on the main flow line at the injection end of the conventional surface, indicating that most of the residual oil is distributed in the large pores and the center of the pores, while the water is distributed in the small pores, pore edges, and pore corners. Relatively speaking, the degree of production is good, washed [14–16].
3.1.2 Analysis of Digital-Analog Experiments
The parameters of the conventional off-surface reservoir model (core 1) are as follows: model size 4.5 cm × 4.5 cm × 30 cm, porosity 18%, permeability 17.8 mD, pore volume 72.89 cm3, reserve 40.09 cm3, initial oil saturation 55%, water flooding. The injection volume is 2 ml/min.
With 98% moisture content as the end condition of the simulation, the final recovery level is 40.24%.
When the injection volume is 0 to 0.7 PV, the recovery level rises rapidly; when the injection volume is 0.7 to 4.5 PV, the recovery level rises steadily; and when the injection volume is greater than 4.5 PV, the cycle is inefficient and ineffective.
In the initial stage, the pressure is 5.41 MPa, the injection rate is from 0 to 0.79 PV, the pressure rises rapidly, the injection rate reaches 0.79 PV, and the peak reaches a stable stage [17].
During the flooding process, the anhydrous oil recovery period occurs from 0 to 0.79 PV. The production end flow gradually increases. After 0.79 PV, the water meets water and the water cut rises rapidly. From 0.79 to 4.48 PV, the production end flow rate increases relatively slowly. At 4.48 PV, the post-production end flow is relatively stable.
When the injection volume is 0–1.27 PV, the cumulative oil production rises rapidly, and when the injection volume is 1.27 to 5.95 PV, the cumulative oil production rises steadily. When the injection volume is greater than 5.95 PV, the cumulative oil production enters the inefficient cycle.
The initial oil saturation is 55%, and the oil saturation is 30% at 8.95 PV; the oil saturation gradually increases from the injection end to the production end, and the overall production level is higher than that of conventional off-surface extraction alone [18, 19].
3.1.3 Comparative Analysis of the Physical Model and Digital Model
Through the comparative analysis of physical model and digital model data, it can be seen that when the conventional off-surface injection and production are performed separately; the physical properties are relatively homogeneous; the fluid does piston movement; the flow, pressure, and saturation change uniformly from the injection end to the production end; and the production is relatively good.
3.2 Parallel Mining of High-Quality Strips and Conventional Off-Balance Sheet
3.2.1 Analysis of the Physical Model Experiment
The parameters of the high-quality strip and conventional off-surface parallel model (core 2) are model size 4.4 cm × 4.4 cm × 28 cm, average porosity 17.15%, permeability 17.03–81.96 mD, pore volume 85 cm3, reserve 46.71 cm3, initial oil saturation 55%, and injection rate 2 ml/min during water flooding.
With 98% water content as the end condition, the final recovery level is 43.36% of the recovery level curve. When the injection volume is 0 to 1 PV, the recovery level rises rapidly, and when the injection volume is 1 to 2 PV, the recovery level rises steadily. When the injection volume is greater than 3.5 PV, the cycle is inefficient and ineffective. The overall production level is higher than that in the conventional off-balance sheet alone. The exploitation of high-quality strip sand bodies is greater than the conventional surface [20, 21].
When the injection volume is 0 PV, the pressure is 4.96 MPa. When the injection volume is 0 to 0.02 PV, the pressure rises quickly. When the injection volume reaches 0.02 PV, the peak value is 7.83 MPa. Injection volumes of 0.02 to 1.62 PV indicate a rapid pressure drop. After PV, it is a stable stage (Figure 4).
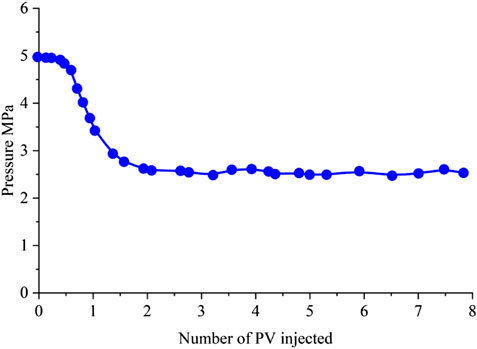
FIGURE 4. The pressure change of the phantom I.
The dripping experiment shows that the conventional surface of the injection end is basically not used, indicating that the capillary force is its driving force. The smaller the pores, the greater the power. The water easily flows into the small pores, and the oil will remain in the large pores. Micro-permeability: the dominant zone at the injection end is the first-level infiltration, indicating that most of the residual oil is distributed in the large pores and the center of the pores, while the water is distributed in the small pores, pore edges, and pore corners [22].
3.2.2 Analysis of Digital–Analog Experiments
The parameters of the high-quality strip and conventional off-surface parallel model (core 2) are model size 4.5 cm × 4.5 cm × 30 cm, porosity 18%–23%, permeability 17.8–80 mD, pore volume 124.5 cm3, reserve 68.49 cm3, and initial oil content saturated by 55%, and injection rate 2 ml/min during water flooding. With 98% moisture content as the end condition of the simulation, the final recovery level is 45.31% of the recovery level curve.
The period from the start of displacement to the time when the injection volume reaches 0.5 PV is the anhydrous oil recovery period. When the injection volume is 0 to 1 PV, the recovery level rises rapidly; when the injection volume is 1 to 4 PV, the recovery level rises steadily; and when the injection volume is greater than 4 PV, the cycle is inefficient and ineffective [23].
The initial stage pressure is 5 MPa, the injection volume is 0 to 0.08 PV, the pressure rises rapidly, the injection volume reaches 0.08 PV, the peak is an injection volume of 0.08 to 1.34 PV, the pressure drops quickly, the injection volume is greater than 1.56 PV, and it is a stable stage.
During the flooding process, the anhydrous oil recovery period starts from 0 to 0.31 PV, and the production end flow gradually increases. After 0.31 PV, water meets water and the water cut rises rapidly. From 0.31 to 4.5 PV, the production end flow rate increases relatively slowly. At 4.5 PV, the post-production end flow is relatively stable.
When the injection volume is 0–1.2 PV, the cumulative oil production increases rapidly. When the injection volume is 1.2 to 4.43 PV, the cumulative oil production rises steadily. When the injection volume is greater than 4.43 PV, the cumulative oil production enters the inefficient cycle.
The high flow rate is mainly in the upper part of the core with good physical properties, the top displacement effect is better, and the lower displacement effect is poor. The high oil saturation area is mainly distributed in the weaker displacement parts with poor physical properties, and the contribution rate of high-quality bands is 76.2% [24].
3.2.3 Comparative Analysis of the Physical Model and Digital Model
The recovery degree of high-quality strips and conventional off-surface mining in parallel is 3%–5% higher than that of core 1-conventional off-surface recovery; mathematical models reveal that the high-quality strips have relatively large pores, so the fluid flow direction is biased toward the side with good physical properties. The flow rate is faster, while the conventional surface pores are relatively small, the physical properties are poor, and the flow rate is slower. And because the pores of high-quality strips are relatively large and the energy transfer tends to the side with good physical properties, the pressure is relatively fast, while the conventional outer pores are relatively small, the energy transfer is poor, and the pressure is slow. Numerical simulation of oil saturation and flow characteristics reveals that high-quality strips are the main water-consuming zone, and the conventional off-surface production is poor. The contribution rate of high-quality strips is 76.2%, and the conventional off-balance sheet is only 23.8%, indicating that high-quality strips are mainly used; that is, there is serious interference between layers [25].
3.3 High-Quality Strip and Conventional Off-Surface Perforation in Parallel With Conventional Off-Surface Perforation
3.3.1 Physical Model Experiment Analysis
The parameters of the conventional off-surface perforating model (core 3) are model size 4.5 cm × 4.5 cm × 30 cm, porosity 18%–23%, permeability 17.8–80 mD, pore volume 124.5 cm3, reserve 68.49 cm3, initial oil saturation 55%, and injection rate 2 ml/min during water flooding, and the bottom of the injection end is perforated (Figure 5).
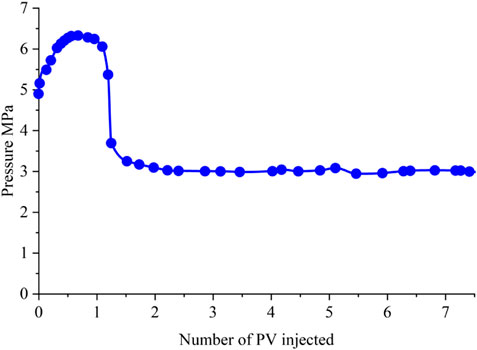
FIGURE 5. The pressure change of the phantom II.
With 98% water content as the end condition of the simulation, the final recovery level is 42.47% of the recovery level curve. The anhydrous oil recovery period is from the start of displacement to when the injection volume reaches 0.8 PV. When the injection volume is 0 to 1 PV, the recovery level rises rapidly, and when the injection volume is 1 to 3 PV, the recovery level rises steadily. When the injection volume is greater than 3 PV, the cycle is inefficient and ineffective. The utilization degree of this combined mining method is greater than that of core 1 and less than that of core 2.
When the injection volume is 0 PV, the pressure is 5.10 MPa. When the injection volume is 0–1.08 PV, the pressure rises rapidly. When the injection volume reaches 1.08 PV, the peak value is 6.05 MPa. Injection volumes of 1.08 to 1.97 PV indicate a rapid pressure drop. After PV, it is a stable stage.
The dripping experiment shows that the high-quality strips are well used and are basically the first-level infiltration, the conventional off-surface injection end mainstream line is the second-level infiltration, and the other places are the third-level infiltration; the degree of production is poor, and the remaining oil is enriched.
3.3.2 Digital–Analog Experiment Analysis
In parallel mode, the parameters of the conventional off-surface perforating model (core 3) are model size 4.5 cm × 4.5 cm × 30 cm, porosity 18%–23%, permeability 17.8–80 mD, pore volume 124.5 cm3, reserve 68.49 cm3, initial oil content saturated by 55%, and injection rate 2 ml/min during water flooding, and the bottom of the injection end is perforated.
With 98% moisture content as the end condition of the simulation, the final recovery level is 43.36% by the end of the simulation.
The anhydrous oil recovery period is from the start of displacement to when the injection volume reaches 0.8 PV. When the injection rate is 0 to 0.8 PV, the recovery level is rising rapidly; when the injection rate is 0.8 to 4 PV, the recovery level is rising steadily; and when the injection rate is greater than 4 PV, it is the inefficient and ineffective cycle section.
In the initial stage, the pressure is 5.3 MPa, the injection rate is 0 to 0.66 PV, the pressure rises quickly, the injection rate reaches 0.66 PV, and the peak is reached. It is a stable stage.
During the flooding process, the anhydrous oil recovery period starts from 0 to 0.38 PV. The production end flow rate gradually increases. After 0.38 PV, water meets water and the water cut rises rapidly. From 0.38 to 2.34 PV, the production end flow rate increases relatively slowly. At 2.34 PV, the post-production end flow is relatively stable.
When the injection volume is 0 to 0.99 PV, the cumulative oil production increases rapidly. When the injection volume is 0.99 to 5.17 PV, the cumulative oil production rises steadily. When the injection volume is greater than 5.17 PV, the cumulative oil production enters the inefficient cycle.
The areas with high oil saturation are mainly distributed in the undisplaced parts with poor physical properties. During the displacement process, the large flow is mainly in the upper part of the core with good physical properties. The top displacement effect is better than the bottom, and the flow flows from the perforated section to the dominant zone. The contribution rate of high-quality strips was 82.2%.
3.3.3 Comparative Analysis of the Physical Model and Digital Model
Comparing the characteristics of the core 3 physical model and digital model, the mining degree of the digital model is similar, and the contribution rate of high-quality strips reaches 82.2%, indicating that there is a serious interference phenomenon between layers. Both physical and numerical simulations show that the water content of this combination rises quickly. Compared with core 1, it shows that the injected fluid has the phenomenon of selecting the advantageous seepage channel to relieve the pressure; that is, the fluid is injected from the conventional surface and flows through the strata to the high-quality sand body. The streamline, flow rate, and oil saturation characteristics of the mold support the existence of this phenomenon, as shown in Figure 6.
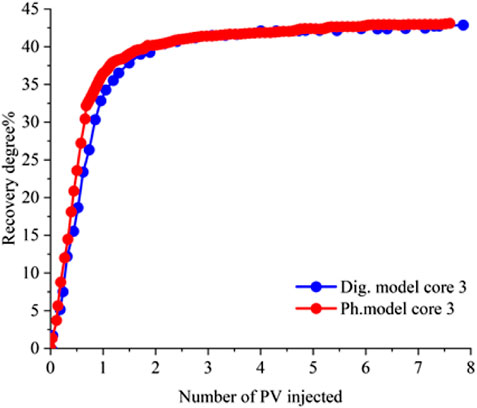
FIGURE 6. Characteristics of physical model and digital model extraction I.
4 Further Verification
4.1 High-Quality Strip Mining in Tandem With Conventional Off-Balance Sheet Mining
The parameters of the high-quality strip and conventional off-surface series model (core 4) are model size 4.5 cm × 4.5 cm × 30 cm, porosity 18%–23%, permeability 17.8–80 mD, pore volume 124.5 cm3, reserve 68.49 cm3, initial oil saturation 55%, and injection rate 2 ml/min during water flooding.
With 98% moisture content as the end condition of the simulation, the final recovery level is 42.7%, and the recovery level curve is shown in Figures 4–7. When the injection volume is 0 to 0.9 PV, the recovery level rises rapidly; when the injection volume is 0.9–4 PV, the recovery level rises steadily; and when the injection volume is greater than 4 PV, the cycle is inefficient and ineffective.
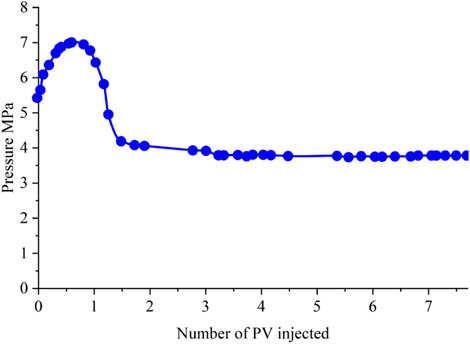
FIGURE 7. The pressure change of the phantom III.
When the injection volume is 0 PV, the pressure is 5.46 MPa. When the injection volume is 0 to 0.63 PV, the pressure rises rapidly. When the injection volume reaches 0.63 PV, it reaches the peak value of 7.01 MPa. Injection volumes of 0.63 to 2.79 PV indicate a rapid pressure drop. After PV, it is a stable stage (Figure 7).
The dripping experiment shows that the high-quality strips are well used, basically the first-level infiltration; the conventional off-surface injection end mainstream line is the second-level infiltration, the degree of production is poor, and the remaining oil is enriched.
The parameters of the high-quality strip and conventional off-surface series model (core 4) are model size 4.5 cm × 4.5 cm × 30 cm, porosity 18%–23%, permeability 17.8–80 mD, pore volume 124.5 cm3, reserve 68.49 cm3, initial oil saturation 55%, and injection rate 2 ml/min during water flooding.
With 98% moisture content as the end condition of the simulation, the final recovery level is 42.7%.
The anhydrous oil recovery period is from the start of displacement to the time when the injection volume reaches 0.7 PV. When the injection rate is 0 to 0.7 PV, the recovery level rises rapidly; when the injection rate is 0.7 to 6 PV, the recovery level rises steadily; and when the injection rate is greater than 6 PV, the cycle is inefficient and ineffective.
In the initial stage, the pressure is 5.43 MPa, the injection rate is 0 to 0.72 PV, the pressure rises quickly, the injection rate reaches 0.72 PV, and the peak is reached. Injection rates of 0.72 to 2.54 PV indicate a rapid pressure drop. It is a stable stage.
During the flooding process, the anhydrous oil recovery period starts from 0 to 0.51 PV. The production end flow gradually increases. After 0.51 PV, water meets water and the water cut rises rapidly. The 0.51 to 4.79 PV production end flow rate increases relatively slowly. At 4.79 PV, the post-production end flow is relatively stable.
When the injection volume is 0 to 0.99 PV, the cumulative oil production increases rapidly, and when the injection volume is 0.99 to 5.02 PV, the cumulative oil production rises steadily. When the injection volume is greater than 5.02 PV, the cumulative oil production enters the inefficient and ineffective cycle.
The oil saturation gradually increases from the injection end to the production end, and the initial flow rate of displacement increases gradually from the injection end to the production end. After the water-free oil production period, the flow rate is stable, and the contribution rate of high-quality strips is 64%.
Physical and numerical simulations show that the high-quality strips and conventional off-surface reservoirs can be produced in parallel with a better recovery rate of about 43% (Figure 8), which is higher than that of conventional off-surface reservoirs produced separately. Because it is mainly relatively homogeneous within the range of each layer, the numerical simulation results also show that the conventional off-surface production has increased, from about 20% in parallel to more than 30%, indicating that this mining method can increase the production of conventional off-surface reservoirs [26].
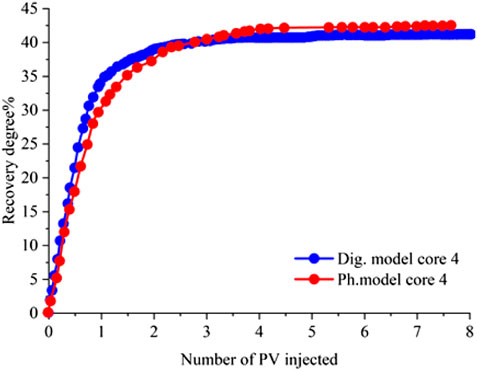
FIGURE 8. Characteristics of physical model and digital model extraction II.
4.2 High-Quality Strip Pinch-Out Mining
4.2.1 Physical Model Experiment Analysis
The parameters of the high-quality strip pinch-out model (core 5) are model size 4.5 cm × 4.5 cm × 30 cm, porosity 18%–23%, permeability 17.8–80 mD, pore volume 119.07 cm3, reserve 65.48 cm3, initial oil saturation 55%, injection volume 2 ml/min during water flooding.
With 98% moisture content as the end condition of the simulation, the final recovery level is 42.27%. When the injection volume is 0 to 1 PV, the recovery level rise rapidly; when the injection volume is 1–3 PV, the recovery level rises steadily; and when the injection volume is greater than 3 PV, the cycle is inefficient and ineffective. The anhydrous oil recovery period mainly occurs in the 0–0.8 PV stage.
When the injection volume is 0 PV, the pressure is 5.30 MPa. When the injection volume is 0 to 0.73 PV, the pressure rises rapidly. When the injection volume reaches 0.73 PV, it reaches the peak value of 6.66 MPa. The injection volume is 0.73 to 2.56 PV. After PV, it is a stable stage (Figure 9).
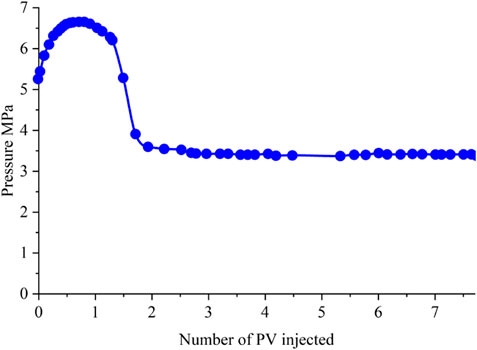
FIGURE 9. The pressure change of the physical model.
The dripping experiment showed that the high-quality strips of pinch were used well, basically the first-level infiltration; the conventional off-surface injection end mainstream line were the second-level infiltration; and the other places were the third-level infiltration; and the degree of utilization was poor.
4.2.2 Analysis of Digital–Analog Experiments
The parameters of the high-quality strip pinch-out model (core 5) are model size 4.5 cm × 4.5 cm × 30 cm, porosity 18%–23%, permeability 17.8–80 mD, pore volume 119.07 cm3, reserve 65.48 cm3, initial oil saturation 55%, injection volume 2 ml/min during water flooding.
With 98% of the water content as the end condition of the simulation, the final recovery level is 42.08%.
From the start of displacement to the time when the injection volume reaches 0.7 PV is the anhydrous oil recovery period. When the injection rate is 0 to 0.7 PV, the recovery level rises rapidly; when the injection rate is 0.7 to 3 PV, the recovery level rises steadily; and when the injection rate is greater than 3 PV, the cycle is inefficient and ineffective.
The initial stage pressure is 5.1 MPa. When the injection rate is 0 to 0.99 PV, the pressure rises rapidly. The injection rate reaches the peak when the injection rate is 0.99 PV. When the injection rate is 0.99 to 2.79 PV, the pressure drops quickly, and when the injection rate is more than 2.79 PV, the pressure is at a stable stage.
During the flooding process, anhydrous oil recovery period starts from 0 to 0.44 PV. The production end flow gradually increases. After 0.44 PV, the water meets water and the water cut rises rapidly. The production end flow rate at 0.44 to 4.05 PV increases relatively slowly. After 405 PV, the flow rate at the production side is relatively stable.
When the injection volume is 0 to 0.86 PV, the cumulative oil production rises rapidly, and when the injection volume is 0.86 to 5.17 PV, the cumulative oil production rises steadily. When the injection volume is greater than 5.17 PV, the cumulative oil production enters the inefficient and ineffective cycle.
During the displacement process, the flow presents the characteristics of converging towards high-quality strips, and the high-quality strips have large flow and good utilization. The upper and lower conventional surfaces are not well utilized and are the areas where the remaining oil is enriched. The contribution rate of high-quality strips is 37.5%.
4.2.3 Comparative Analysis of the Physical Model and Digital Model
The comparison of the physical model and digital model shows that the conventional off-balance sheet mobilization degree of this method is better, reaching 42%, and the contribution rate of regular off-balance sheet reaches 62.5%, which accounts for the main position of mining, indicating that the mining method has effectively improved the degree of production of off-surface reservoirs. How to establish this injection–production matching relationship in production is the direction that needs to be studied in the future to improve the degree of production of off-surface reservoirs. From the analysis of the distribution characteristics of sedimentary microfacies, the area near the flat high-quality strip facies belt and the conventional outer-surface splicing belt is the location that this mining method should pay attention to.
4.3 Comprehensive Analysis of Physical Simulation and Numerical Simulation Displacement Experiments
Comprehensive analysis of physical model and digital model experiments reveals the production characteristics of conventional off-surface reservoirs. Physical modeling experiments show that conventional off-surface mining has the lowest degree of recovery, with a recovery rate of 41.13% and a slower rise in water content; parallel mining of conventional off-surface and high-quality strips has the highest degree of production, reaching 43.36%, but the water content rises faster. The production degree of parallel conventional off-surface perforation is better than that of separate conventional off-surface perforation and is similar to other methods (Figure 10). The overall production degree of the five methods has reached more than 40%, but the mining methods of core 2 and core 3 obviously have interference phenomena, which are not conducive to the effective production of conventional off-surface reservoirs. Core 4 and core 5 are conducive to the production of conventional off-surface reservoirs.
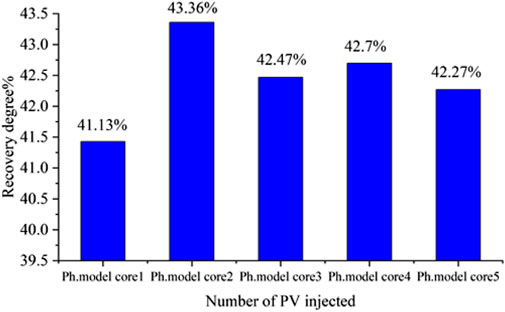
FIGURE 10. Histogram of the extraction degree comparison of the object model.
The numerical model reveals the production characteristics of the five mining methods in terms of the quantity and the spatial sweep characteristics of the injected fluid. Numerical simulation shows that the high-quality reservoir of core 2 and conventional off-surface parallel mining have the highest degree of recovery, up to 43.25%, but the interlayer interference is great, the conventional off-surface production is poor, and its contribution rate is only 23.8%. The core 3 mining method has the worst off-surface reservoir production, with a contribution rate of only 17.8%. The flow rate and streamlines show that cross flow has occurred under this method. The output is dominated by high-quality strip sand bodies without perforation, and the conventional off-the-ground production is low. The mining method of core 4 and core 5 is conducive to improving the production degree of conventional off-surface reservoirs. The physical model and digital–analog series mode reach 42.7% and 42.10%, respectively. The related fluids and streamlines prove that these two methods improve the conventional off-surface reservoirs and the degree of production of the reservoir (Figure 11).
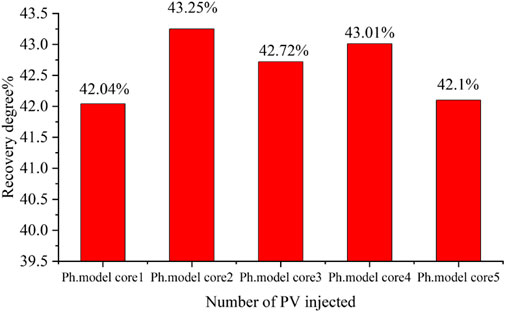
FIGURE 11. Histogram of the comparison of the degree of digital and analog extraction.
4.4 Numerical Simulation Experiment of Parallel Mining Interference
In order to determine whether there is interference under the conditions of combined production of high-quality strip reservoirs and conventional off-surface reservoirs and the degree of interference, a parallel mining experiment of the two methods was designed this time, with the purpose of determining the corresponding contribution rate. We put high-quality strip cores and conventional off-surface reservoir cores into different core holder ends, and the inlets are connected in parallel for displacement, and the outlets measure fluid production and oil production and water production, and then we determine the respective total fluid volume and total oil volume contribution in quantity.
The parameters of the parallel mining interference model are model size 4.5 cm × 4.5 cm × 30 cm (two cores), porosity 18%–23%, permeability 17.8–80 mD, pore volume 182.25 cm3, reserve 100.23 cm3, and initial oil saturation 55%. The injection rate for water flooding is 2 ml/min.
With 98% water content as the end condition of the simulation, the final recovery level is 41.12% of recovery level curve. From the start of displacement to when the injection volume reaches 0.6 PV is the anhydrous oil recovery period. When the injection volume is 0–0.6 PV, the recovery level rises rapidly; when the injection volume is 0.6 to 3 PV, the recovery level rises steadily; and when the injection volume is greater than 3 PV, the cycle is inefficient and ineffective. The high-quality strips have obvious interference characteristics. After the water-free oil recovery period, the flow rate of the high-quality strips is much larger than that of the off-surface reservoirs. The mobilization part mainly comes from high-quality strips, and the contribution rate of high-quality strips is 87.5% (Figures 12, 13). This result is similar to the results obtained by the numerical simulation of core 3 and core 2, further indicating that the combined production of these two types of reservoirs is not conducive to the production of conventional off-surface reservoirs [27].
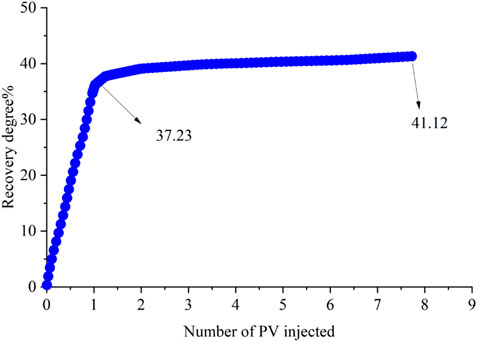
FIGURE 12. Flow line of digital and analog flow and oil saturation.
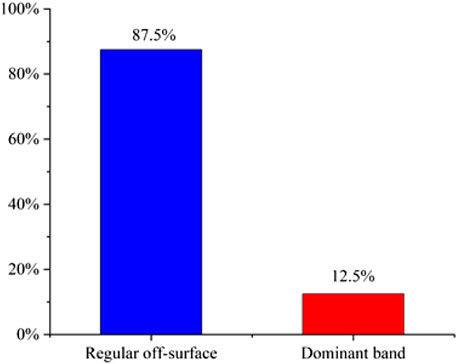
FIGURE 13. Contribution rate of two types of reservoirs.
5 Conclusion
Through physical simulation displacement experiments and related numerical simulation displacement experiments and corresponding analysis, the production characteristics of conventional off-surface reservoirs and high-quality strip reservoirs under different matching development methods are studied, and the following conclusions are mainly obtained:
(1) Conventional off-surface reservoirs are mined separately, which can be well produced, and the recovery level can reach 40%. Under the condition of combined production of conventional off-surface reservoirs and high-quality strip sand bodies, there is a serious interlayer interference; even if only the conventional off-surface reservoir is injected, the injected fluid will flow through due to the low permeability of the conventional off-surface reservoirs.
(2) Under the condition of tandem mining of conventional off-surface reservoirs and high-quality strip sand bodies, without the participation of high-quality strips, the production degree is the highest; the production effect of series mining off-surface reservoirs is significantly better than that of the parallel production mining method.
(3) Independent injection and production design can be carried out to improve the conventional surface and the degree of utilization. This splicing zone is the transition zone from high-quality strip sand bodies to conventional off-surface reservoirs. A series injection–production relationships can be established between the two.
(4) Look for the phase zone in the low-energy zone of the inner front edge-independent mining outside the conventional surface. Look for argillaceous siltstone-silty mudstone conventional off-surface reservoir development facies zones (low-energy estuary dams, sheet sand, etc.) in low-energy areas. The conventional off-surface reservoirs in this area are generally separated by thicker mudstone. By forming a sandwich structure, we can establish an independent injection–producing relationship outside the conventional surface in this area and can also achieve the purpose of effectively using the conventional surface.
Data Availability Statement
The original contributions presented in the study are included in the article/Supplementary Material, further inquiries can be directed to the corresponding author.
Author Contributions
RL and XW conceived the idea of this manuscript, and RL developed the theory and performed the experiment. XH and BS verified the results and completed the written work. All the authors read and approved the final version of the manuscript.
Funding
This work was supported by the National Natural Science Foundation of China (41774126).
Conflict of Interest
Author BS was employed by the Fifth Oil Production Plant of Daqing Oilfield.
The remaining authors declare that the research was conducted in the absence of any commercial or financial relationships that could be construed as a potential conflict of interest.
Publisher’s Note
All claims expressed in this article are solely those of the authors and do not necessarily represent those of their affiliated organizations, or those of the publisher, the editors and the reviewers. Any product that may be evaluated in this article, or claim that may be made by its manufacturer, is not guaranteed or endorsed by the publisher.
Acknowledgments
We gratefully acknowledge Northeast Petroleum University and the National Natural Science Foundation of China for their financial support.
References
1. Lu R, Liu S, Hu L. A New Method for Calculating the Dynamic Recovery Degree of Water Drive sandstone Oilfields[J]. J Xi'an Shiyou Univ (Natural Sci Edition) (2019) 34(4):60–6.
2. Cheng D, Li Y, Fang N. Experimental Study on the Change Law of Polymer Flooding Relative Permeability Curve[J]. Oil Gas Reservoir Eval Develop (2019) 9(02):56–9.
3. Lian G, Zou W, Zhang W. Application of Polymer Flooding Control Degree in the Preparation of Polymer Flooding Plan[J]. Daqing Pet Geology Develop (2019) 38(03):111–6.
4. Yan K, Han P, Cao R. Establishment and Application of Numerical Simulation Method for Identifying Streamlines of Dominant Seepage Channels after Polymer Flooding[J]. Oil Gas Reservoir Eval Develop (2019) 9(02):33–7.
5. Han P, Yan K, Cao R. Displacement Method to Increase the Degree of Recovery of the Reservoir after Polymer Flooding[J]. Lithologic Reservoirs (2019) 31(2):143–50.
6. Zhao G, Yin Z, Kuang T. Characteristics of Water Drive Reservoir Simulation Technology in Daqing Oilfield[J]. Daqing Pet Geology Develop (2019) 2019(05):1–9.
7. Chen Z, Liu Q, Pan H. Influencing Factors of the Morphological Characteristics of the Dimensionless Fluid Production index Curve[J]. Fault Block Oil and Gas Field (2019) 26(1):62–5.
8. Wu X. Prediction and Application of Dimensionless Fluid Production index Curve for Heterogeneous Water Drive Reservoirs[J]. Pet Geology Recovery Degree (2019) 2019:1–5.
9. Ming L, Liu Y, Chen X. Optimization and Adjustment of Injection-Production Structure Based on Meandering River Reservoir Architecture[J]. Lithologic Reservoirs (2019) 2019(06):145–54.
10. Han P, Cao R, Liu H. Reservoir Characteristics and Adaptive Combination Flooding Method after Polymer Flooding[J]. Daqing Pet Geology Develop (2019) 2019(05):1–11.
11. Ding J. Classification Standard for Off-Surface Reservoirs in La, Sa and Xing Oilfields[J]. Daqing Pet Geology Develop (2019) 38(02):130–5.
12. Du Q, Song B, Zhu L. Challenges and Countermeasures for Waterflooding Development in the Ultra-high Water-Cut Period of La, Sa and Xing Oilfields[J]. Daqing Pet Geology Develop (2019) 2019(05):1–6.
13. Du X, Dai Z, Jing X. Three-dimensional Water Flooding Physical Simulation experiment for Horizontal wells in Heavy Oil Reservoirs with strong Bottom Water[J]. Lithologic Reservoirs (2019) 2019:1–8.
14. Li W, Ren C, Lin R. A New Method for Dynamic Production Splitting of Multi-Layer Combined wells in Water Drive Reservoirs[J]. China Offshore Oil and Gas (2019) 31(4):89–95.
15. Song M, Han S, Dong Y. Microscopic Water Drive Efficiency and its Main Controlling Factors in Tight sandstone Reservoirs[J]. Lithologic Reservoirs (2019) 2019:1–11.
16. Wang D. The Influence of the Internal Structure of Composite Sand Bodies on Polymer Flooding[J]. Daqing Pet Geology Develop (2018) 37(4):100–3.
17. Chen X. Research on the Key Technology of CT Scanning Device for Dynamic Core Displacement of High Temperature and High pressure[D]. Beijing: China University of Geosciences (2018).
18. Lei X, Qu Z, Tong H. Composite Phase Profile Control and Flooding System to Improve the Degree of Recovery Technology after Polymer Flooding[J]. Spec Oil Gas Reservoirs (2018) 25(2):143–7.
19. Deng H. Experimental Research and Application of Coalbed Methane and Rock Displacement [D]. Xi'an: Xi'an Shiyou University (2018).
20. Zhang J, Di Qinfeng , , Shuai H. Foam Flooding Nuclear Magnetic Resonance experiment and Foam Dynamic Stability Evaluation[J]. Pet Exploration Develop (2018) 45(5):853–60. doi:10.1016/s1876-3804(18)30094-6
21. Zhao Y, Zhao X, Jian L. Indoor experiment and Field Application of CO2 Flooding in Ultra-low Permeability Reservoirs[J]. Daqing Pet Geology Develop (2018) 37(1):128–33.
22. Sun L, Chen M, Sang Di . Microscopic Waterflooding Seepage experiment of Reef limestone Models with Different Pore Types[J]. Fault Block Oil and Gas Field (2017) 24(4):546–9.
23. Cui Y, Shi J. Experimental Study on the Seepage Characteristics of Off-Surface Reservoirs in Daqing Oilfield[J]. Daqing Pet Geology Develop (2017) 36(02):69–72.
24. Wang H, Yan B, Liu C. Research on the Design and Effect of Fracturing and Flooding Technology for the Third Type of Oil Layer[J]. Mathematics Pract Understanding (2018) 2018(24):22–5.
25. Li Y, Wang Y, Yang G. On the Application of Fracturing and Flooding Technology in Daqing Oilfield[J]. China Pet Chem Stand Qual (2017) 2017(23):66–70.
26. Zhang B, Ma W, Li S. Research on Reasonable Conversion to Follow-Up Waterflooding Injection Timing in the Late Stage of Polymer Injection in the Second Class Reservoir of Daqing Oilfield[J]. Contemp Chem Industry (2017) 2017(05):89–93.
Keywords: Xing-6 area, off-surface reservoir, high-quality strip sand body, injection-production characteristics, physical simulation
Citation: Liu R, Wang X, He X and Song B (2022) Physical Simulation Experiment Study on Injection-Production Characteristics of Off-Surface Reservoirs in Sapu Oil Layer in Xing-6 Area. Front. Phys. 10:834533. doi: 10.3389/fphy.2022.834533
Received: 13 December 2021; Accepted: 20 January 2022;
Published: 01 April 2022.
Edited by:
Qingxiang Meng, Hohai University, ChinaReviewed by:
Qian Yin, China University of Mining and Technology, ChinaDawei Yin, Shandong University of Science and Technology, China
Copyright © 2022 Liu, Wang, He and Song. This is an open-access article distributed under the terms of the Creative Commons Attribution License (CC BY). The use, distribution or reproduction in other forums is permitted, provided the original author(s) and the copyright owner(s) are credited and that the original publication in this journal is cited, in accordance with accepted academic practice. No use, distribution or reproduction is permitted which does not comply with these terms.
*Correspondence: Ruhao Liu, lrh_1992@stu.nepu.edu.cn